Embed Size (px)
Citation preview

J.P. Morgan Investor ConferenceOccidental Petroleum CorporationJune 27, 2017
Vicki HollubChief Executive Officer

2
Forward-Looking StatementsPortions of this presentation contain forward-looking statements and involve risks and uncertainties that could materially affect expected results of operations, liquidity, cash flows and business prospects. Actual results may differ from anticipated results, sometimes materially, and reported results should not be considered an indication of future performance. Factors that could cause results to differ include, but are not limited to: global commodity pricing fluctuations; supply and demand considerations for Occidental's products; higher-than-expected costs; the regulatory approval environment; not successfully completing, or any material delay of, field developments, expansion projects, capital expenditures, efficiency projects, acquisitions or dispositions; uncertainties about the estimated quantities of oil and natural gas reserves; lower-than-expected production from development projects or acquisitions; exploration risks; general economic slowdowns domestically or internationally; political conditions and events; liability under environmental regulations including remedial actions; litigation; disruption or interruption of production or manufacturing or facility damage due to accidents, chemical releases, labor unrest, weather, natural disasters, cyber attacks or insurgent activity; failure of risk management; changes in law or regulations; reorganization or restructuring of Occidental's operations; or changes in tax rates. Words such as “estimate,” “project,” “predict,” “will,” “would,” “should,” “could,” “may,” “might,” “anticipate,” “plan,” “intend,” “believe,” “expect,” “aim,” “goal,” “target,” “objective,” “likely” or similar expressions that convey the prospective nature of events or outcomes generally indicate forward-looking statements. You should not place undue reliance on these forward-looking statements, which speak only as of the date of this presentation. Unless legally required, Occidental does not undertake any obligation to update any forward looking statements, as a result of new information, future events or otherwise. Material risks that may affect Occidental’s results of operations and financial position appear in Part I, Item 1A “Risk Factors” of the 2016 Form 10-K.
Use of non-GAAP Financial InformationThis presentation includes non-GAAP financial measures. You can find the reconciliations to comparable GAAP financial measures on the “Investors” section of our website.
Cautionary Statements

3
Occidental Petroleum• Value Proposition
• Portfolio Optimization
• Path to Cash Flow Neutrality and Breakeven
• Sustainability With High Quality Assets
• Model

4
2016 ROCE* Oxy’s Unique Value Proposition
Upside in rising oil price environment and downside protection during falling oil price environment
Focus on value based growth
Top quartile returns
Consistent Dividend Growth• Growing dividend with strong yield
• Value protection in down cycle
• Promotes capital allocation discipline
Moderate Value-Based Growth
• 5 – 8% average production growth through oil & gas development
• Above cost-of-capital returns (ROE and ROCE)
• Return Targets*: Domestic – 15+% International – 20+%
Strong Balance Sheet
• Maintain ample cash balance and additional sources of liquidity
• Low debt-to-capital ratio
• Income-producing assets
*Return targets based on moderate commodity prices.
5
1. Base/Maintenance Capital
2. Dividends
3. Growth Capital
4. Acquisitions
5. Share Repurchases
Subject to Returns and Market Conditions
Cash Flow Priorities Favor Dividends
Dividends promote capital allocation discipline

6
$0.50 $0.52 $0.55 $0.65 $0.80 $0.94 $1.21 $1.31 $1.47 $1.84 $2.16 $2.56 $2.88 $2.97 $3.02 $3.04$0.50 $1.02 $1.57 $2.22 $3.02
$3.96$5.16
$6.48$7.95
$9.79
$11.95
$14.51
$17.39
$20.36
$23.38
$26.42
$0.00
$4.00
$8.00
$12.00
$16.00
$20.00
$24.00
$28.00
2002 2003 2004 2005 2006 2007 2008 2009 2010 2011 2012 2013 2014 2015 2016 1Q17Ann.
Annual Dividends PaidCumulative Dividends Paid
6Note: Dividends paid as per the Record Date
Delivering Consistent Annual Dividend Growth
($/share)2002 – 2016: Oxy dividend CAGR 13.7% vs S&P CAGR 7%

7*Pro forma for ongoing operations (excludes operations sold or exited)
0
100
200
300
400
500
600
700
2011 2012 2013 2014 2015 2016
Mbo
ed
Ongoing Company Excluding Permian Resources Permian Resources
438 435 428 440528
575
Ongoing Total Company Production CAGR 6%*
Permian Resources 16% CAGR
Value Growth - Production Growth Since 2011

8*Competitors ROCE represents a simple average of APA, APC, COP, CVX, DVN, EOG, HES, MRO and XOM
(30%)
(20%)
(10%)
00%
10%
20%
30%
2008 2009 2010 2011 2012 2013 2014 2015 2016
Competitors ROCE*OXY ROCE
Value Growth - Annual ROCE for Oxy vs. Average of Competitors
2008 – 2013Average ROCE 15%

9
2013Actual
Cali-fornia
2013 Excl.California
OtherUS
MENA 2013Adjusted
PermianRes.
Al Hosn OtherInternational
South Texas 2016Ongoing
High-MarginProduction
Growth Goal
Cash FlowBreakeven
at $50 WTI*
Divested assets that did not generate competitive corporate returns or free cash flow
Investing in assets with higher cash margin and lower capital intensity Growth target - 80 MBOEPD
Prod
uctio
n (M
boed
))
South Texas Gas propertiesDecline since 2013: 17 Mboed2016 Production: 27 Mboed (11% oil production)
763 (154)
609 (62)(79)
46859
64 28 (44) 57580 655
Set to generate both returns to shareholders and value-based growth
*Cash Flow Breakeven after Dividend and Growth Capital. Slide not updated for transactions announced on June 19, 2017.
Value Growth - Multi-year Returns Focused Portfolio Optimization
2013 Cali-fornia
South Texas
Al Hosn
PermianResources
2013 Adjusted
MENAOther U.S.
2013 exc.California
OtherInt.
2016 HighMarginGrowth
Cash FlowBreakEven

10
Ope
ratin
g Ca
sh F
low
($ B
n)
$4.2
$50/bbl
Current Annualized
Chemicals
$4.4$4.7
80 MboedProduction
Current Dividend
$2.3
Sustaining Capital$2.3
$5.66.0
5.0
4.0
3.0
2.0
1.0
0.0Midstream &
Marketing
$5.6
Pathway Drivers:
• Permian Resources high-margin growth to accelerate value proposition of consistent dividend plus moderate production growth
• Enables organization to continue to drive down breakeven oil price, replenish reserves, and innovate our capabilities
Our Pathway to Cash Flow Breakeven at $50 WTI
Plan Achieved at $50
Growth Capital$1.0
Slide not updated for transactions announced on June 19, 2017.

11
Annual cash flow sensitivities (Bn) $40 $50 $60
Cash Flow Priorities:Dividend ex-
GrowthDividend +
GrowthDividend +
Growth + Options
1) Base/Maintenance Capital $2.1 $2.3 $2.5
2) Dividends (current) $2.3 $2.3 $2.3
3) Growth Capital + Options $0 $1.0 $1.0+
Cash Outflows $4.4 $5.6 $5.8+
Cash Inflows* $4.4 $5.6 $6.8
Production Growth Flat 5% - 8% 5% - 8%
*Annualized cash flow changes ~$120 million for a ~$1.00 / barrel change in oil prices upon plan execution. Slide not updated for transactions announced on June 19, 2017.
Upon plan execution, Oxy can fund dividend and sustain production from operating cash flows. WTI Oil Price:
Asset Quality and Capital Flexibility Provides Optionality to Cover Dividend
12
Ope
ratin
g Ca
sh F
low
($ B
n)
$3.2
$40/bbl
CFO Adjusted to $40 WTI
Chemicals
$3.4$3.7
80 MboedProduction
Current Dividend
$2.3
Sustaining Capital$2.1
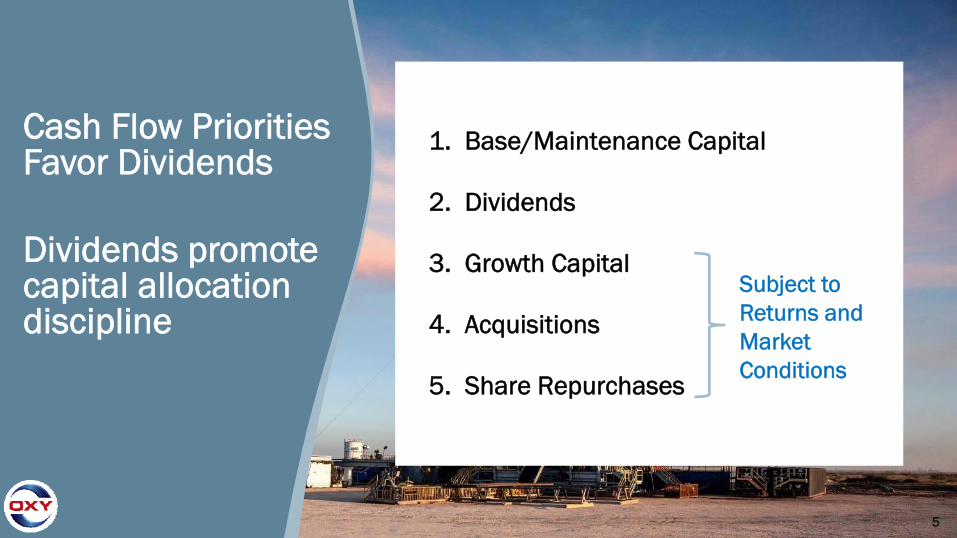
Oxy Pathway to Cash Flow Breakeven at $40 WTI
Plan Achieved at $40 WTI
$4.45.0
4.0
3.0
2.0
1.0
0.0Midstream &
Marketing
$4.4
Pathway Drivers:
• Permian Resources high-margin growth to accelerate value proposition of consistent dividend plus moderate production growth
• Enables organization to continue to drive down breakeven oil price, replenish reserves, and innovate our capabilities
Slide not updated for transactions announced on June 19, 2017.

13
Opportunistic Transactions Create Long-term Value
Consistent with our pathway to breakeven at $50 WTI*, Oxy has executed multiple transactions in the Permian to accelerate our plan.
> Oxy has agreed to a number of purchase and sale transactions in Permian Resources to generate combined proceeds of $0.6 Bn.
> Oxy has also agreed to acquire additional working interests and assume operatorship in a low-decline, low capital intensity CO2 EOR unit in the Permian Basin for $0.6 Bn.
The combination of these transactions will accelerate the cash flows of the company and enhance future returns by replacing low priority development acreage with low-decline, low capital intensity EOR production with significant opportunities for value improvement.
*Breakeven at $50 WTI is after dividend and 5%-8% production growth.

14
Overview of Non-Strategic Permian Resources Net Transactions
•Transactions Terms> Combined net proceeds of ~$0.6 Bn
•Properties Description> Divested of non-strategic acreage in Andrews, Martin
and Pecos Counties and added incremental acreage to enhance a future core development area in Glasscock County
> Reduced Permian Resources position by ~13,000 net acres and production by ~4,700 Boed (64% oil)
•Transaction Rationale> Acreage was not in focus development areas and had
no significant near-term development plans.> Monetizations accelerate cash flows from acreage from
the tail of our inventory and are NPV positive for Oxy.> Recent organic location additions exceed both the count
and the relative value of locations sold in transactions. Inventory to be updated on 2Q17 earnings call.
> Accelerates our pathway to breakeven at $50 WTI*
Focus Development Area:Greater Barilla Draw – 5,000+ Locations
Focus Development Area:Greater Sand Dunes – 2,000+ Locations
Permian Resources Acreage Permian EOR Acreage
NM Delaware Basin
TX Delaware Basin Central BasinPlatform
New Mexico NW ShelfMidland Basin
Map not updated for transactions.*Breakeven at $50 WTI is after dividend and 5%-8% production growth.

15
NM Delaware Basin
TX Delaware Basin Central BasinPlatform
New Mexico NW Shelf
Overview of Enhanced Oil Recovery Acquisition in the Permian
•Transactions Terms> Purchase price of $0.6 Bn
•Properties Description> Seminole-San Andres Unit (34.2% interest) and
Seminole Gas Processing Plant (46.6% interest)> West Bravo Dome CO2 field in New Mexico (100%
interest) and 9.9% interest in Occidental operated Bravo Dome unit.
> Increases Permian EOR production by ~8,200 Boed (70% oil)
•Transaction Rationale> Increased ownership and gained operatorship in world
class EOR property> Synergistic opportunities for capital efficiency, cost
reductions, optimized CO2 development, and accelerated residual oil zone development. These benefits can be realized on both the acquired interests and Oxy’s existing ownership.
> Accelerates our pathway to breakeven at $50 WTI*
Seminole-San Andres Unit•WI from 53% to 87%•Seminole Gas Process Plant WI from 46% to 93%
CO2 Source Fields and Pipelines•Bravo Dome Unit WI from 77% to 87% •West Bravo Dome WI from 0% to 100%
Permian Resources Acreage Permian EOR Acreage
Midland Basin
*Breakeven at $50 WTI is after dividend and 5%-8% production growth.Map not updated for transactions.

16
Upside Potential from Operatorship of Seminole-San Andres
•Value Improvement Through Scale and Operational Synergies
> Seminole-San Andres unit becomes Oxy’s largest operated CO2 flood in the Permian.
> Enhances Seminole-San Andres operations by applying Oxy’s worldwide EOR scale and expertise
> Substantial room for operating cost improvement
•Value of Synergies> Value of synergies will be magnified by impact on
both the acquired interest and Oxy’s existing ownership interest.
> Due to value of the synergies, this opportunistic acquisition delivers high returns and significant free cash flow to accelerate our pathway to cash flow breakeven at $50 WTI*.
$5
$10
$15
$20
$25
$30
Oxy EOR Permian2016 Average
Oxy Denver Unit2016 Average
Operating Costs ($/Boe)
Oxy EOR unit of analogous scale and
development type
Seminole-San Andres unit
becomes largest in Oxy’s CO2 portfolio
$0
$100
$200
$300
$400
$1/Boe $2/Boe $3/Boe $4/Boe $5/Boe
Value of Opex Synergies ($MM PV10)Acquired Interest Existing Interest
High Opex Range
Low Opex Range
*Breakeven at $50 WTI is after dividend and 5%-8% production growth.
Oxy targeting opex improvement of
greater than $5/boe

17
Transactions Effectively a Swap with Net Benefits to Oxy
Transactions on a net basis*:
> Lowers our sustaining capital and overall production decline rate> Additional benefits anticipated through capital efficiency and
other operating synergies.
Remaining 2017 2019Production (Boed) 3,500 7,000Operating Cash Flow ($ MM) 35 80Free Cash Flow ($ MM) 25 55
Net benefits accelerate cash flow breakeven at $50 WTI***Assumes $50/Bbl WTI and $3.30/MCF gas and includes attainment of $5/boe operating cost synergies at Seminole-San Andres. **Breakeven at $50 WTI is after dividend and 5%-8% production growth.

18*Competitor Peers include APC, CVX, CXO, DVN, EOG, HES, MRO, PXD. Excludes APA, COP, XOM due to negative F&D.
2016 F&D (Organic) $/Boe19.27
17.19
13.3711.73 11.41
9.59
6.86 6.51 6.45
0
5
10
15
20
1 2 3 4 5 6 7 8 OXY
$/B
oe
Competitor Peers*
Value Growth – Significantly Reduced Development Cost

19
(30%)
(20%)
(10%)
0%
10%
HES DVN CXO APC MRO APA EOG COP PXD OXY CVX XOM
*Calculated based on public information and on a consistent basisCompanies listed alphabetically : APA, APC, COP, CVX, CXO, DVN, EOG, HES, MRO, PXD, XOM
Value Growth
Focus on value driven growth - Top quartile returns
Positioned to return to double digit returns
2016 ROCE*
20
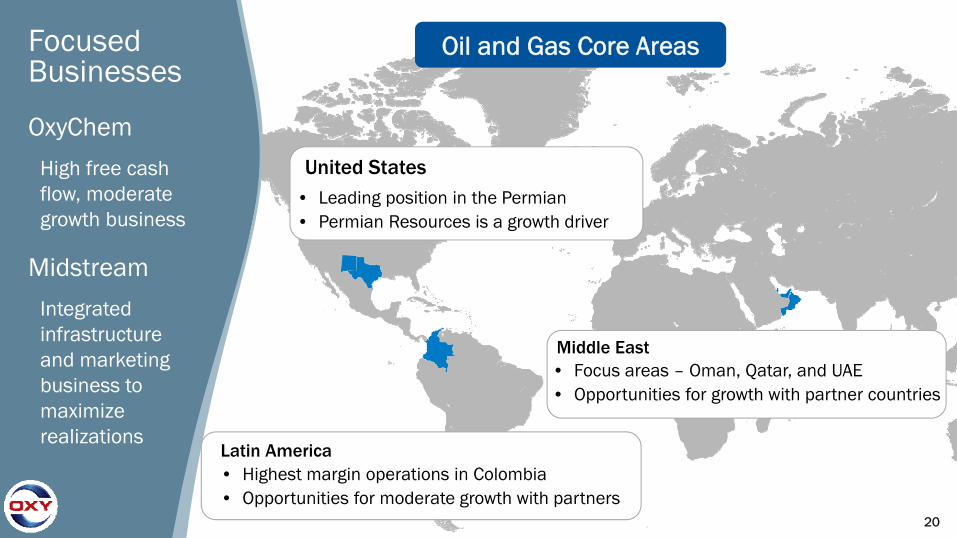
Oil and Gas Core Areas
• Leading position in the Permian• Permian Resources is a growth driver
United States
Latin America• Highest margin operations in Colombia• Opportunities for moderate growth with partners
Middle East• Focus areas – Oman, Qatar, and UAE• Opportunities for growth with partner countries
Focused Businesses
OxyChem
High free cash flow, moderate growth business
Midstream
Integrated infrastructure and marketing business to maximize realizations

21
Permian ResourcesSignificant acreage& growth potential in all development areas
~650,000 net acres within the Delaware and Midland Basin boundaries
~300,000 net acres associated with 11,650 wells in unconventional development inventory
• NM Delaware Basin 290,000
• TX Delaware Basin 150,000
• Midland Basin 210,000
Total ~650,000
NetAcres*Resources Basin Development Areas
• Central Basin Platform 215,000
• New Mexico NW Shelf 150,000
• Emerging Unconventional 50,000
• Continuing Evaluation 335,000
Total ~750,000
NetAcres*
Other Resources Unconventional Areas
• Resources – Unconventional Areas 1.4• Enhanced Oil Recovery Areas 1.1
Oxy Permian Total 2.5 MM
Net AcresBusiness Area Acreage
*Includes surface and minerals. Slide not updated for transactions announced on June 19, 2017.
NM Delaware Basin
TX Delaware Basin
Midland Basin
Central BasinPlatform
Permian Resources Permian EOR
New Mexico NW Shelf

22
Improved Permian Resources Horizontal Inventory from 4Q2015
0
2,000
4,000
6,000
8,000
10,000
12,000
BE <$50 BE<$60 BE <$70 AdditionalInventory
Total
~5,3002015
Locations8,500
~11,650~11,650
~2,500
~4,100
2016 Added3,150Texas
Delaware Basin
Midland Basin
New Mexico Delaware
Basin
Increased Total Horizontal Drilling Locations ~37%
*Breakeven values based on NPV10.
Locations within 300,000 of 650,000 net acres in Basin Development Areas • Added 1,250 locations
BE < $50
• Added 3,150 total locations
• Increased average length from 5,950’ to 7,100’
SS Characterization +Dev. Plans + Technology
• Traded 10,000 net acres to enable longer lateral and consolidated facilities
• 14 years of inventory <$50 breakeven with 10 rigs

23
Proven Leader in Maximizing Recovery Across the Permian
0
500
1,000
1,500
2,000
FutureDevelopment
Cost <$6
FutureDevelopmentCost <$10
AdditionalUnconventional
Inventory
TotalAdditional Conventional Inventory
Total Identified Barrels
<$10 <$6
Permian EOR Net Resource Potential
MM
BO
E
CO2Floods
TZ/ROZ* Water Floods + Other Infill
Drilling Opportunities
Permian EOR Acreage
Delaware Basin
Midland Basin
Central BasinPlatform
High-gradable Inventory
*Note: TZ/ROZ – Transition Zone and Residual Oil Zone
Permian EOR
Significant inventory in 10-year plan
Geographically diverse
100 active CO2 + water floods covering multiple horizons
2 BBOE of identified net resource potential
870 net MMBOE at < $6.00 Future Development Cost
Future Development Cost ($/BOE)

24
Oman: Assisted with the discovery and started development of Safah Field in
1982. A 15 year contract extension was signed for Block 9 this year. Blocks 27
and 53 expire in 2035. Block 62 expires in 2028.
Oman: Assisted with the discovery and started development of Safah Field in 1982. A 15 year contract extension was signed for Block 9 this year. Blocks 27 and 53 expire in 2035. Block 62 expires in 2028.
Colombia: Discovered giant Cano Limon field in the early 1980’s. Several contracts that currently range from 6 years up to the economic life of field.
Long term contracts
with upside potential
Longest Legacy International Operations: Colombia and Oman

25
ISND and ISSD: Offshore development in Qatar. ISND contract for 25 years initiated in 1994. ISSD contract expires in 2022.
Dolphin: Premier transborder pipeline delivering gas from Qatar to Abu Dhabi and Oman. Agreement was initiated in 2007 for a 25 year term.
Al Hosn: 30 year joint venture with the Abu Dhabi National Oil Company, (“ADNOC”) began in 2011 to develop the giant sour gas field in Abu Dhabi. Largest ultra sour gas plant in the world. Al Hosn is a world-scale mega-project.
Additional Core Middle East Assets

26Source: Factset, 05/26/17
0.0%0.4%
0.7% 0.7%
1.5%
2.0% 2.1% 2.1% 2.2% 2.3%
3.8%4.1%
5.0%5.2%
0.0%
1.0%
2.0%
3.0%
4.0%
5.0%
6.0%
PXD APC DVN EOG MRO SP500 APA HES 10 YearTreasury
COP XOM CVX OXY TOT
Integrated O&GIndependent E&P
2002 – 2016 Average Oxy Dividend Yield
Dividend yield should revert close to historical levels as we execute plan to a lower cash flow breakeven
Current Dividend Yield vs. Competitors

27
Strong Balance Sheet - Oxy Credit Ratings Vs. Peers
Company S&P Ratings
S&P Outlook
Moody’s Ratings
Moody’s Outlook
New Issue Indications(10-year)
XOM AA+ Negative Aaa Negative 2.95%CVX AA- Negative Aa2 Stable 3.05%OXY A Stable A3 Stable 3.25%EOG BBB+ Stable Baa1 Stable 3.35%COP A- Stable Baa2 Positive 3.35%PXD BBB Stable Baa2 Stable 3.55%APA BBB Stable Baa3 Stable 3.65%NBL BBB Negative Baa3 Stable 3.75%DVN BBB Stable Ba1 Stable 3.75%APC BBB Stable Ba1 Stable 4.05%MRO BBB- Stable Ba1 Stable 4.05%HES BBB- Stable Ba1 Stable 4.25%CXO BB+ Positive Ba2 Stable 4.50%CLR BB+ Stable Ba3 Positive 5.00%WPX B+ Stable B3 Stable 5.875%WLL BB- Stable B3 Positive 7.75%

28Source: Factset, 6/26/2017
Company Market Cap ($Bn)XOM $344RDS $237CVX $197TOT $120BP $117ENI $54
Characteristics• Low or no growth• Higher returns• Stronger Balance Sheet• Lower risk• Free cash flow• Consistent dividend growth
Company Market Cap ($Bn)COP $55EOG $50PXD $26APC $25APA $18DVN $16
Characteristics• Generally higher growth• Lower returns• Weaker Balance Sheet • Higher risk• Little or no free cash flow• Little or no dividends• Moved from gassy to oily
Oxy Uniquely
Positioned
$46 Bn Market Cap
Independent E&PsLarge Integrated Majors
Unique Investment Proposition

29
2016 ROCE* Consistent Dividend Growth
• Oxy dividend CAGR doubled S&P CAGR since 2002
• Highest yield vs. US peers
• Historical dividend yield of 2.85%
Moderate Value-Based Growth
• Averaged better than 5% production growth
• Upper quartile ROCE
• Portfolio optimization complete for stronger future returns
Strong Balance Sheet
SuccessfulValue Proposition
Oxy has delivered positive results on each component of our value proposition
• 1Q17 cash balance of $1.5 Bn
• Received tax refund of $750 million during 2Q17
• Low debt-to-capital ratio
• Historical net debt-to-capital ratio of 11%
• “A” level credit rating from Moody’s, S&P and Fitch

Q&A