Embed Size (px)
Citation preview
I{I UTTERWQRTH E I N E M A N N
International Journal of Project Management Vol. 13, No. 3, pp. 151-155, 1995 Copyright © 1995 Elsevier Science Ltd
Printed in Great Britain. All rights reserved 0263-7863/95 $10.00 + 0.00
0263-7863 (95) 00034-8
Vicious circles of parallelism
Terry Williams, Colin Eden, Fran Ackermann and Andrew Tait Department of Management Science, Strathclyde Business School, Strathclyde University, Livingstone Tower, 26 Richmond Street, Glasgow G1 1XH, UK
Manufacturing development projects are frequently highly parallel and time-constrained. A study was undertaken of such a project as par t of a delay and disruption (D&D) litigation to show the effects of delays and in-development product enhancements. The use of the cognitive- mapping technique revealed some key vicious circles, and in part icular that increasing crossrelations between concurrent activities increases activity durations, which under time constraints causes activities to become more parallel and hence increases crossrelations. System dynamics was used to model these loops quantitatively, explaining the level of D&D experienced within the project, which was more than the sum of each individual causal effect as the effects compounded each other. A case study is used as a basis to analyse these effects, and discuss the wider implications for modelling projects for which project networks are the normal modelling medium, and possible ways in which the inadequacies of networks can be overcome.
Keywords: system dynamics, delay and disruption, litigation
The issues and difficulties involved in managing large engineering projects have been the subject of much study, and project management is now a science in its own right L2. Project management is often said to have started with the Polaris programme, which essentially saw the birth of a fully developed network-analysis methodology (although Morris 3 argues that this was used as a smokescreen rather than as a planning method). The key to the network methodology is its description of which activities must be carried out serially, and which can be carried out in parallel.
As the technology being developed by projects and the economic environment within which projects are carried out both develop, two trends can be seen, as described by Williams4:
• As technology and thus products become more complex and more intraconnected, the projects developing the products become more parallel, and it is proposed that these projects are more difficult to manage, and more likely to escalate.
• Time-constraints on projects are becoming tighter, and time-based liquidated damages heavier, and it is proposed that this exacerbates the effect of the first trend.
This paper discusses these two proposals in the light of a recent major litigation in which the authors were involved, describes some of the key vicious circles
(undesirable positive-feedback loops) that cause problems in such projects, and describes and discusses the modelling used to quantify such effects. The paper concludes by arguing that classical network analysis cannot fully delineate the progress of a project, as it neglects the feedback loops inherent in parallelism. The improvements required to such analysis are described.
Case study
The project consisted of the design and short-run manufacture of a specialised vehicle, involving consider- able leading-edge development. The project was very time- constrained, and there was a highly parallel design stage, as well as a degree of concurrent engineering, with vehicle manufacture starting before the end of the design stage. The company concerned is one of the most successful in the world at this size of manufacture, but, despite this, the project had resulted in considerable overspend, and some lateness, and was by that time the subject of a formal claim. The bulk of the claim was for product changes requested by the purchaser (but not the subject of a formal contract change or variation order); this was termed the direct claim. The remainder was for delay and disruption, both that caused by the events that were the subject of the direct claim, and other delay and disruption felt to be caused by the purchaser, and in particular delays in approving documentation. The authors were commissioned to discover the reasons for, and extent of, the delay and disruption,
151
Vicious circles of parallelism: T Williams et al.
and to quantify the effects using an auditable model which could support the advocacy of a delay and disruption claim.
The key technique used to interview managers and subsequently model the explanations given for the various circumstances of the project was 'cognitive mapping'. There is insufficient scope here for a discussion of the methods, but Eden 5 gives a general description, and Ackermann and Tait 6 provide a discussion relating to this study. This technique structures the way in which humans construe and make sense of their experiences, and specialist computer software called Graphics COPE* was used to record and analyse the extensive maps developed. Each person's cognitive map was input, and these were then combined (through crossrelationships and the merging of identical ideas) into a single model which gave an overall representative view. This model was developed and validated working in a visual interactive mode with groups of senior members of the project team 7.
The analysis and clustering methods within the software were then used to locate all the positive-feedback loops which form the basis of understanding delay and disruption as it is generated by the dynamic impact of events. The critical feedback loops are described below. The overall feedback-loop structure was complex (with over 90 feedback loops), as was the dynamics of the real situation; the overall behaviour of interconnected and nested feedback loops is characteristically difficult to discern subjectively.
L o o p s
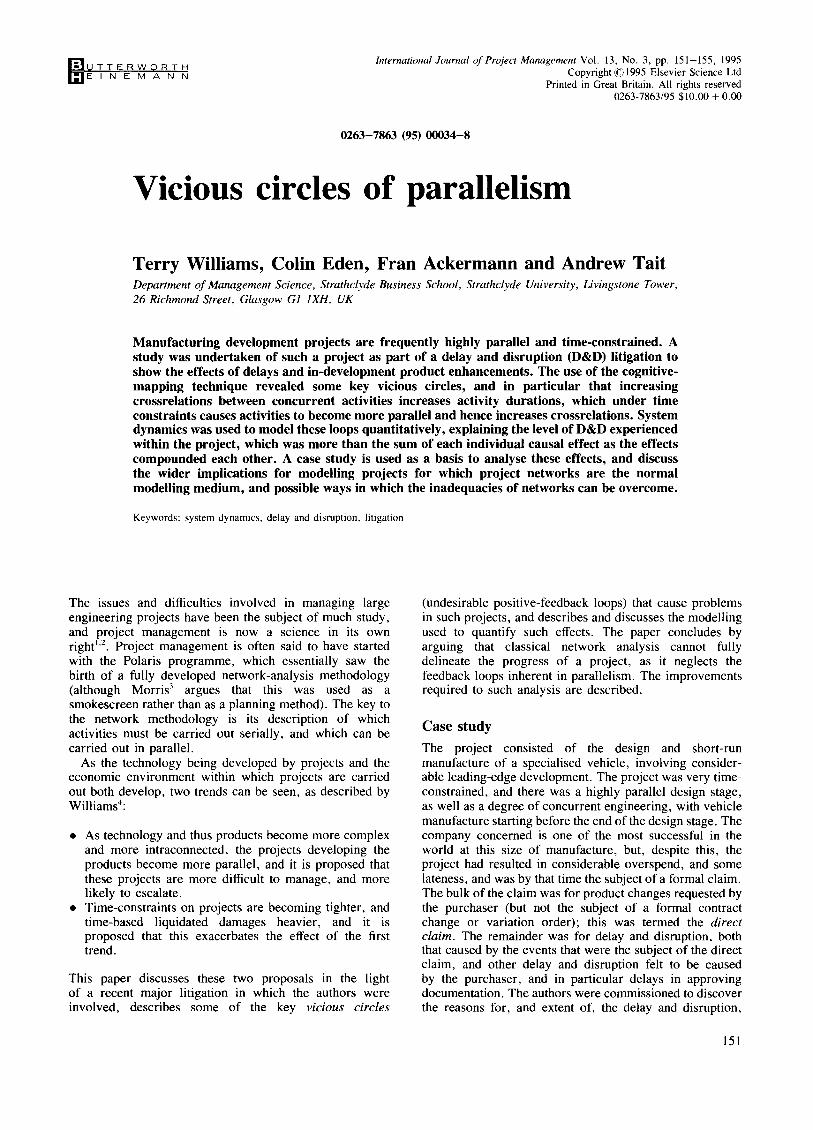
The key loop is shown in Figure 1. In a design process in which the design of crossrelated parts of the product occurs in parallel, this causes the design activities to take longer, since each activity has to take cognisance of the other(s). This causes delay in the overall program. If there are tight timescale constraints, so that the delay cannot be absorbed by extending the total project duration, this means that the project must becomes more parallel as delayed activities overlap more with succeeding nondelayed activities.
This deterministic effect is, of course, taken into account in the initial planning. However, the process becomes very nonrobust, so that a small increase in one element causes a positive feedback loop to be set up, with each of the four elements in the loop in Figure 1 magnifying the next (a positive-feedback loop which promotes undesirable effects, such as this, is generally called a vicious circle). This can (and in this case did) give rise to significant escalation. In particular, and with relevance to this case study, an increase in delay (such as purchaser approval delays, or delays due to purchaser changes) will start up this feedback.
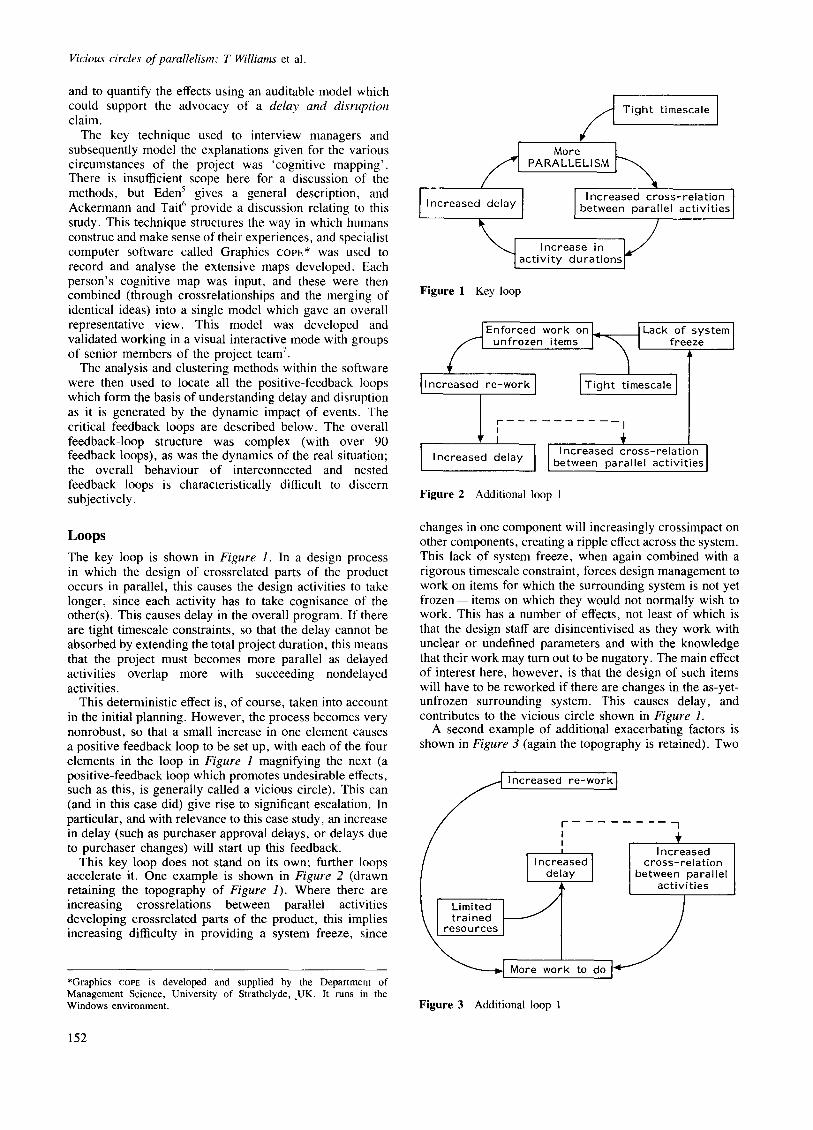
This key loop does not stand on its own; further loops accelerate it. One example is shown in Figure 2 (drawn retaining the topography of Figure 1). Where there are increasing crossrelations between parallel activities developing erossrelated parts of the product, this implies increasing difficulty in providing a system freeze, since
*Graphics COPE is developed and supplied by the Department of Management Science, University of Strathclyde, .UK. It runs in the Windows environment.
152
Tight timescale I ore
PARALLELISM
I 1 I Increased cr°ss-relati°n 1 Increased delay between parallel activities
Figure 1 Key loop
Enforced work o n - - L a c k of systeml unfrozen items I free[ze I
I Increased re-work] I Tight timescale
I Increased delay } Increased cross-relation between para le act vities
Figure 2 Additional loop 1
changes in one component will increasingly crossimpact on other components, creating a ripple effect across the system. This lack of system freeze, when again combined with a rigorous timescale constraint, forces design management to work on items for which the surrounding system is not yet f r o z e n - items on which they would not normally wish to work. This has a number of effects, not least of which is that the design staff are disincentivised as they work with unclear or undefined parameters and with the knowledge that their work may turn out to be nugatory. The main effect of interest here, however, is that the design of such items will have to be reworked if there are changes in the as-yet- unfrozen surrounding system. This causes delay, and contributes to the vicious circle shown in Figure 1.
A second example of additional exacerbating factors is shown in Figure 3 (again the topography is retained). Two
,ncreased re-__ or_k]
F ; I ,ncreasedl t de,ay I betw ?v IIe'
I I "im'tedt / \ I trained I / ~ urces I
" ~ - - - ~ [ More work to do ] "~ "~
Figure 3 Additional loop 1
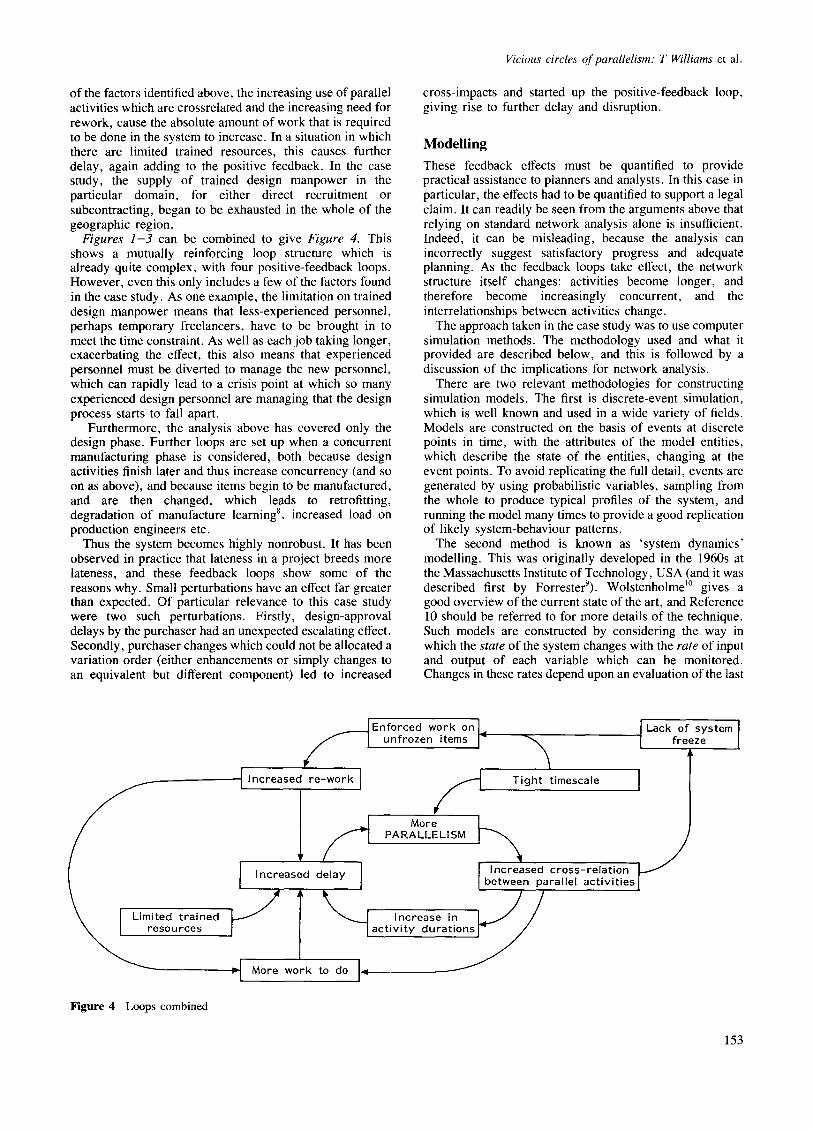
of the factors identified above, the increasing use of parallel activities which are crossrelated and the increasing need for rework, cause the absolute amount of work that is required to be done in the system to increase. In a situation in which there are limited trained resources, this causes further delay, again adding to the positive feedback. In the case study, the supply of trained design manpower in the particular domain, for either direct recruitment or subcontracting, began to be exhausted in the whole of the geographic region.
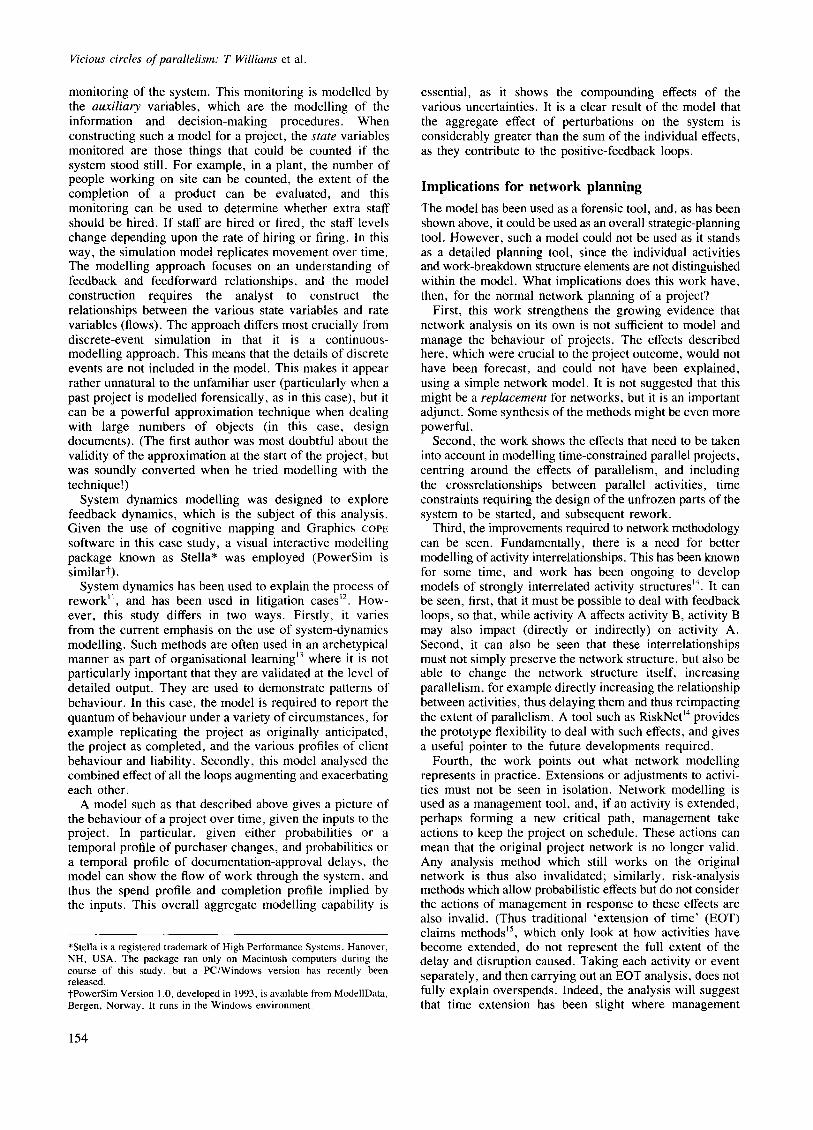
Figures 1 -3 can be combined to give Figure 4. This shows a mutually reinforcing loop structure which is already quite complex, with four positive-feedback loops. However, even this only includes a few of the factors found in the case study. As one example, the limitation on trained design manpower means that less-experienced personnel, perhaps temporary freelancers, have to be brought in to meet the time constraint. As well as each job taking longer, exacerbating the effect, this also means that experienced personnel must be diverted to manage the new personnel, which can rapidly lead to a crisis point at which so many experienced design personnel are managing that the design process starts to fall apart.
Furthermore, the analysis above has covered only the design phase. Further loops are set up when a concurrent manufacturing phase is considered, both because design activities finish later and thus increase concurrency (and so on as above), and because items begin to be manufactured, and are then changed, which leads to retrofitting, degradation of manufacture learning 8, increased load on production engineers etc.
Thus the system becomes highly nonrobust. It has been observed in practice that lateness in a project breeds more lateness, and these feedback loops show some of the reasons why. Small perturbations have an effect far greater than expected. Of particular relevance to this case study were two such perturbations. Firstly, design-approval delays by the purchaser had an unexpected escalating effect. Secondly, purchaser changes which could not be allocated a variation order (either enhancements or simply changes to an equivalent but different component) led to increased
Vicious circles of parallelism: T Williams et al.
cross-impacts and started up the positive-feedback loop, giving rise to further delay and disruption.
Modelling These feedback effects must be quantified to provide practical assistance to planners and analysts. In this case in particular, the effects had to be quantified to support a legal claim. It can readily be seen from the arguments above that relying on standard network analysis alone is insufficient. Indeed, it can be misleading, because the analysis can incorrectly suggest satisfactory progress and adequate planning. As the feedback loops take effect, the network structure itself changes: activities become longer, and therefore become increasingly concurrent, and the interrelationships between activities change.
The approach taken in the case study was to use computer simulation methods. The methodology used and what it provided are described below, and this is followed by a discussion of the implications for network analysis.
There are two relevant methodologies for constructing simulation models. The first is discrete-event simulation, which is well known and used in a wide variety of fields. Models are constructed on the basis of events at discrete points in time, with the attributes of the model entities, which describe the state of the entities, changing at the event points. To avoid replicating the full detail, events are generated by using probabilistic variables, sampling from the whole to produce typical profiles of the system, and running the model many times to provide a good replication of likely system-behaviour patterns.
The second method is known as 'system dynamics' modelling. This was originally developed in the 1960s at the Massachusetts Institute of Technology, u s a (and it was described first by Forresterg). Wolstenholme ~° gives a good overview of the current state of the art, and Reference 10 should be referred to for more details of the technique. Such models are constructed by considering the way in which the state of the system changes with the rate of input and output of each variable which can be monitored. Changes in these rates depend upon an evaluation of the last
ited trained esources
Figure 4 Loops combined
~__~Enforced work on]. I Lack of system I unfrozen items l- ~ [ freeze l
I More L _ ! I S'I PARALLELIS~ l ~ / - - ] I Increlased c ross- re la t ion 'I.~ - I / increase(:] oelay ] {between parallel a c t i v i t i e s ~
~ ' ~ J ~ act, Iv?t;e, Ser ait?o n s ~ /
_I More work r I
153
Vicious circles of parallelism: T Williams et al.
monitoring of the system. This monitoring is modelled by the auxiliary variables, which are the modelling of the information and decision-making procedures. When constructing such a model for a project, the state variables monitored are those things that could be counted if the system stood still. For example, in a plant, the number of people working on site can be counted, the extent of the completion of a product can be evaluated, and this monitoring can be used to determine whether extra staff should be hired. If staff are hired or fired, the staff levels change depending upon the rate of hiring or firing. In this way, the simulation model replicates movement over time. The modelling approach focuses on an understanding of feedback and feedforward relationships, and the model construction requires the analyst to construct the relationships between the various state variables and rate variables (flows). The approach differs most crucially from discrete-event simulation in that it is a continuous- modelling approach. This means that the details of discrete events are not included in the model. This makes it appear rather unnatural to the unfamiliar user (particularly when a past project is modelled forensically, as in this case), but it can be a powerful approximation technique when dealing with large numbers of objects (in this case, design documents). (The first author was most doubtful about the validity of the approximation at the start of the project, but was soundly converted when he tried modelling with the technique!)
System dynamics modelling was designed to explore feedback dynamics, which is the subject of this analysis. Given the use of cognitive mapping and Graphics COPE software in this case study, a visual interactive modelling package known as Stella* was employed (PowerSim is similart).
System dynamics has been used to explain the process of rework '1, and has been used in litigation cases ~2. How- ever, this study differs in two ways. Firstly, it varies from the current emphasis on the use of system-dynamics modelling. Such methods are often used in an archetypical manner as part of organisational learning ~3 where it is not particularly important that they are validated at the level of detailed output. They are used to demonstrate patterns of behaviour. In this case, the model is required to report the quantum of behaviour under a variety of circumstances, for example replicating the project as originally anticipated, the project as completed, and the various profiles of client behaviour and liability. Secondly, this model analysed the combined effect of all the loops augmenting and exacerbating each other.
A model such as that described above gives a picture of the behaviour of a project over time, given the inputs to the project. In particular, given either probabilities or a temporal profile of purchaser changes, and probabilities or a temporal profile of documentation-approval delays, the model can show the flow of work through the system, and thus the spend profile and completion profile implied by the inputs. This overall aggregate modelling capability is
*Stella is a registered trademark of High Performance Systems, Hanover, NH, USA. The package ran only on Macintosh computers during the course of this study, but a PC/Windows version has recently been released. tPowerSim Version 1.0, developed in 1993, is available from ModellData, Bergen, Norway. It runs in the Windows environment.
154
essential, as it shows the compounding effects of the various uncertainties. It is a clear result of the model that the aggregate effect of perturbations on the system is considerably greater than the sum of the individual effects, as they contribute to the positive-feedback loops.
Implications for network planning The model has been used as a forensic tool, and, as has been shown above, it could be used as an overall strategic-planning tool. However, such a model could not be used as it stands as a detailed planning tool, since the individual activities and work-breakdown structure elements are not distinguished within the model. What implications does this work have, then, for the normal network planning of a project?
First, this work strengthens the growing evidence that network analysis on its own is not sufficient to model and manage the behaviour of projects. The effects described here, which were crucial to the project outcome, would not have been forecast, and could not have been explained, using a simple network model. It is not suggested that this might be a replacement for networks, but it is an important adjunct. Some synthesis of the methods might be even more powerful.
Second, the work shows the effects that need to be taken into account in modelling time-constrained parallel projects, centring around the effects of parallelism, and including the crossrelationships between parallel activities, time constraints requiring the design of the unfrozen parts of the system to be started, and subsequent rework.
Third, the improvements required to network methodology can be seen. Fundamentally, there is a need for better modelling of activity interrelationships. This has been known for some time, and work has been ongoing to develop models of strongly interrelated activity structures ~4. It can be seen, first, that it must be possible to deal with feedback loops, so that, while activity A affects activity B, activity B may also impact (directly or indirectly) on activity A. Second, it can also be seen that these interrelationships must not simply preserve the network structure, but also be able to change the network structure itself, increasing parallelism, for example directly increasing the relationship between activities, thus delaying them and thus reimpacting the extent of parallelism. A tool such as RiskNet H provides the prototype flexibility to deal with such effects, and gives a useful pointer to the future developments required.
Fourth, the work points out what network modelling represents in practice. Extensions or adjustments to activi- ties must not be seen in isolation. Network modelling is used as a management tool, and, if an activity is extended, perhaps forming a new critical path, management take actions to keep the project on schedule. These actions can mean that the original project network is no longer valid. Any analysis method which still works on the original network is thus also invalidated; similarly, risk-analysis methods which allow probabilistic effects but do not consider the actions of management in response to these effects are also invalid. (Thus traditional 'extension of time' (EOT) claims methods ~5, which only look at how activities have become extended, do not represent the full extent of the delay and disruption caused. Taking each activity or event separately, and then carrying out an EOT analysis, does not fully explain overspends. Indeed, the analysis will suggest that time extension has been slight where management
Vicious circles o f parallelism: T Williams et al.
has acted swiftly and effectively (albeit expensively) to keep a project on schedule).
Finally, the work provides a prototype capability for the strategic modelling of projects. This is useful in itself, both as a planning tool and as a forensic post mortem tool. It also, however, provides a vital check on the modified network analysis described above, since it is able to take into account the compounding effects as the perturbations and uncertainties combine.
R e f e r e n c e s 1 Turner, J R The Handbook of Project Based Management McGraw-
Hill, UK (1993) 2 Cleland, D 1 and King, W R (eds) The Project Management Handbook
(2nd ed) Van Nostrand Reinhold, USA (1988) 3 Morris, P W G "Interface management: an organisational theory approach
to project management' Project Management Quarterly 1979 10 (2) 4 Williams, T M 'Taking the risk manager to 2020' Presented 1st British
Project Management Colloquium Henley Management College, UK (Dec 1993)
5 Eden, C 'Cognitive mapping: a review' European J Operational Research 1988 36 (1) 1-13
6 Ackermann, F and Tai l A 'COPE-ing with system dynamics - - a story about soft and hard OR' (to be presented at the Young Operational Research Conference York, UK (Mar 1994))
7 Eden, C L and Ackermann, F 'Strategy development and implementation - - the role of a group decision support system' in Bostrom, R, Watson, R and Kinney, S (eds) Computer Augmented Teamwork -- A Guided Tour Van Nostrand Reinhold, USA (1992)
8 Eden, C, Williams, T M, Tait, A and Ackermann, F 'Dismantling the learning curve: the role of learning in understanding disruption' (submitted to Euro XIII Conference Operational Research University of Strathclyde, UK (1994))
9 Forrester, J W Industrial Dynamics MIT Press (1961) 10 Wolstenholme, E F System Enquiry: A System Dynamics Approach
John Wiley (1990) 11 Cooper, K G 'The rework cycle: benchmarks for the project manager'
Project Management J 1993 24 (1) 12 Weil, H B and Etherton, R L 'System dynamics in dispute resolution'
Proc 1990 lnt Systems Dynamics Conference (1990) 1311-1324 13 Senge, P M The Fifth Discipline: The Art and Practise of the Learning
Organization Doubleday Currency, USA (1990) 14 Williams, T M 'Risk analysis using an embedded CPA package' Int J
Project Management 1990 8 84-88 15 Scott, S 'Dealing with delay claims - - a survey' lnt J Project
Management 1993 11 (3) 143-154
Terry Williams holds" an MA in mathematics from the University of Oxford, UK, and an MSc and PhD in operational research from the University of Birmingham, UK. After lecturing in operational research, he spent nine years in an engineering consultancy, where he started up work in project risk management. In a wide range of major development projects, mainly in defence, he carried out/led risk assessments and advised on management infrastruc- tures, and acted as risk manager on l ~ major multicompany defence contracts; he developed the prototype project risk-analysis tool RiskNet. He (re)joined the Management Science Department of Strathclyde University, UK, in 1992, and con- tinued this research. He was part of a team led by Professor Eden supporting a delay and disruption claim in a major European litigation.
Professor Colin Eden has a BSc in control engineering from the University of Leicester, UK, and a PhD in production management from the University o f Southampton, UK. He has worked as an operational researcher in the engineering in- dustry, an operational research manager in the engineering industry and the printing and paper industry, and a management consultant. He lectured in management science at the University of Bath, UK. He is a professor and the head of the Department of Management Science, Strathclyde Business School, UK. His research interests include mana- gerial cognition, the provision of computer-aided decision support for management teams working on strategic issues, the implementation and performance of strategy in large and small organisations with par- ticular emphasis on the public sector, the changing nature of problem solving in relation to the use of computer networks, and research methodology for management research.
Fran Ackermann is a lecturer in the Department of Management Science at the Strathclyde Business School, UK. She obtained a doctorate for research into the use of group decision-support systems, basing it upon work undertaken with organisa- tions using a specific GDSS. She has continued to research into GDSSs focusing particularly on messy and complex problems. She has worked with a large number of client groups at all levels, in both the public and private sectors. Other current research interests include exploring the transferability of models between groups and individuals, develop- ing a method for allowing groups to work in an "any-time~any-place' paradigm rather than 'same-time/same-place ', and expanding research into strategic development and implementation.
Andrew Tait is a research assistant in the Department of Management Science at the Strathclyde Business School, UK. He has degrees in artificial intelligence and operational research, and his current work involves research into the use of distributed group decision-support systems.
155