Embed Size (px)
Citation preview

Journal of Molecular Structure, 224 (1990) 7-20 Elsevier Science Publishers B.V., Amsterdam
VIBRATIONAL STUDIES OF THE DISULFIDE GROUP IN PROTEINS Part II. Ab initio force fields and normal mode frequencies of dimethyl, methylethyl, and diethyl disulfides*,**
WENYUN ZHAO*** and SAMUEL KRIMM
Biophysics Research Division and Department of Physics, University of Michigan, Ann Arbor, MI 48109 (U.S.A.)
(Received 14 March 1989)
ABSTRACT
The geometric parameters and quadratic force constants of dimethyl disulfide, methylethyl disulfide, and diethyl disulfide in all their stable conformations and transition state conformations have been obtained from ab initio Hartree-Fock calculations with a 3-21G* basis set. Thirteen scale factors applied to the ab initio force field allow the reproduction of 62 observed frequencies with an average error of 0.5%. Relationships between the SS and CS stretch frequencies and the conformer internal rotation geometry are obtained. The results reported here provide a good basis for further investigation of the vibrational spectra of proteins containing cystine residues.
INTRODUCTION
Raman spectroscopy has been widely used to investigate the conformation of S-S bridges in proteins [l-6], since it is not difficult to obtain spectra in both solid and aqueous systems and the SS stretch, v (SS), and CS stretch, v (CS ) , modes are relatively stronger than other bands in the spectra. However, as reviewed in our previous paper [ 71, considerable controversy exists regard- ing the correlation of these frequencies with the internal rotation angles as- sociated with the disulfide group.
We have initiated a vibrational spectroscopic study of this group by analyz- ing the spectra of alkyl disulfides through ab initio and normal mode calcula- tions (see ref. 7, designated I, for the first paper in this series). Although sev- eral normal mode calculations have been done on dialkyl disulfides [8-lo] and on a model of the S-S bridge in proteins [ 61, there are two major problems with these calculations. First, empirical force fields were used in which it was
*Dedicated to Professor Bryce L. Crawford, Jr. **Part I is ref. 7. ***Permanent address: Institute of Theoretical Chemistry, Jilin University, Changchun, P.R. China.
0022-2860/90/$03.50 0 1990 Elsevier Science Publishers B.V.

assumed that force constants are independent of the SS, 7( SS), and CS, 7( CS), dihedral angles. This contradicts results from CNDO/B [ 111 and ab initio [ 121 calculations, which show that the SS bond length varies with 7(SS). There- fore, the correlation between vibrational frequencies and the internal torsion angles could not be obtained in reliable detail. Ab initio calculations, which are presented in this paper, provide the variation of force field with 7(SS) and 7( CS ), and allow, with relatively few scale factors, the satisfactory reproduc- tion of experimental frequencies. Based on such a scaled ab initio force field, normal mode calculations can thus provide a clear and reliable description of the correlation between the frequencies and torsion angles of the disulfide group. The second problem with the previous calculations is that they overlooked the difference between the structure in the real protein and that in the simple alkyl disulfides. We will treat this subject in later publications.
AB INITIO CALCULATIONS
The LCAO-MO-SCF restricted Hartree-Fock calculations were performed with the 3-21G* basis set, using the Gaussian 82 program for diethyl disulfide and methylethyl disulfide and the Gaussian 86 program for dimethyl disulfide. The geometries of conformers of C,H,SSC,H, were obtained, at energy min- ima and maxima with respect to the nuclear coordinates, for 7(CS) corre- sponding to the truns (T) andguuche (G ) (minima) and cis (C ) and skew (S ) (maxima) structures by simultaneous relaxation of all geometric parameters. (While we use these designations for angles near 180 ‘, 60 O, 0’) and 120 ‘, re- spectively, we describe the minimum energy position of 7( SS), for conve- nience, as G even though its value is close to 90’. ) Similarly, calculations were done for structures at the energy minima of CH,SSC,H, as a function of 7( CS) and for structures at both energy minima and maxima of CH,SSCH, as a func- tion z(SS). In contrast to previous studies, the conformations with respect to the z(CS) in C,H,SSC,H, are more properly classified in terms of C, G, S, T, S’, and G’, where the prime means a rotation of z(CS) opposite to that of 7( SS) , because we believe that the relative stability, geometry, and character- istic vibrational frequencies should be different for G and G’, as well as for S and S’.
Some geometric parameters of C2H5SSC2H, are listed in Table 1. Torsion angles together with relative energies of all conformers are listed in Table 2. These parameters will be used in normal mode calculations of protein model structures, which will be published later. (The geometry optimization for the transition state of the S’GG’ conformation did not converge with our proce- dure. Therefore 7( CS ) had to be fixed at a constant value, - 125.5”, which is the z(CS) for the S’GS’ conformation, in optimizing all the other geometric parameters. ) The relative energies of GXG conformations of C,H,SSC,H, as

TABLE 1
Some geometric parameters of symmetric C,H5SSC2H, conformers’
Parameterb CGC GGG SGS TGT S’GS’ G’GG’
R(C-H)’ 1.0848 1.0849 1.0848 1.0839 1.0848 1.0850 R(C-H)ds’ 1.0809 1.0825 1.0829 1.0833 1.0831 1.0822 R(C-H)en’ 1.0815 1.0827 1.0809 1.0805 1.0806 1.0825 R(C-C) 1.535 1.536 : 1.539 1.541 1.539 1.533 R(C-S) 1.849 1.827 ,1.838 1.828 1.839 1.829 R(S-S) 2.035 2.045 2.042 2.044 2.043 2.056
B(HCC)” 110.4 110.3 110.4 110.4 110.5 110.3 tI(CCS) 116.9 113.5 111.4 109.0 111.4 115.5 B(HCS)” 105.7 106.8 107.8 109.0 107.8 106.0 8(CSS) 107.7 103.1 104.4 102.9 104.4 103.7
“C, cis; G, gauche; S, skew; T, trans. bR in A, 0 in degrees. “Methyl group, H truns to S. dMethyl group, H gauche to S. ‘Average value. fMethylene group.
TABLE 2
Relative energies, torsion angles, and SS and CS stretch frequencies of C,H,SSC,H, conformers’
Conformer E 7(CS) 7(SS) 7(SC) UC%) v(CS)
(kcal mol-‘) (deg) (deg) (deg) (cm-‘) (cm- )
GGG 0.00 GGT 0.20 TGT 0.40 GGG’ 0.66 TGG’ 0.82 GGS 1.80 GGS’ 1.93 SGT 1.98 SGG’ 2.06 TGS’ 2.09 G’GG’ 2.36 S’GG’ 2.42 SGS 3.69 SGS’ 3.83 CGG 3.93 S’GS’ 3.98 CGT 4.03 CGG’ 4.97 CGS 5.52 CGS’ 6.09 CGC 7.54
69.4 86.3 69.4 504 69.4 86.6 177.6 525
177.6 86.6 177.6 542 68.6 98.0 -69.1 499
174.8 97.5 - 68.6 523 68.2 87.2 119.9 513 68.2 86.5 - 123.9 511
120.0 87.4 177.1 532 117.4 94.6 -69.5 508 176.5 86.9 - 123.8 531
-71.0 114.5 - 71.0 497 - 125.5 95.6 - 74.4 507
118.7 89.8 118.7 520 118.6 89.2 - 125.5 518 -5.2 90.8 68.3 507
- 125.5 88.6 - 125.5 519 -4.7 90.8 174.0 527
- 12.6 105.7 - 70.5 503 - 1.8 89.3 116.5 513 -6.7 97.3 - 115.0 509
-11.6 95.7 - 11.6 510
638 (B) 646 (A) 642 669 667 (B) 670 (A) 638 646 640 669 639 649 641 649 646 668 639 648 648 669 635 (B) 642 (A) 639 649 641 (B) 650 (A) 644 650 622 642 645 (B) 650 (A) 625 668 622 640 623 646 623 646 616 (B) 630 (A)
“C, cis; G, gauche; S, skew; T, trans

10
a function of 7(SS) are given in Fig. 1. The 21 possible conformations of C,H,SSC,H, are shown on a relative energy versus R (Cy -CTf ) plot in Fig. 2, where R (Cy-CF) is the distance between the two methyl carbon atoms, which would correspond to the P-C” distance in the cystine bridge of proteins. Most disulfides prefer the lowest energy conformations, GGG and GGT. However if strain exists, for example in a crystal or a protein molecule, conformations with relatively higher energies can occur, and in small ring structures G’GG’ and S’GG’ are possible. Almost all of the 21 disulfide conformations are found in proteins. In a survey of the crystal structures of 15 proteins [ 61, encompassing
T(SS).degrees
Fig. 1. Relative energy of GXG conformers of C,H,SSC,H, as a function of z( SS), the SS dihedral angle (the energy of GGG is taken as zero).
8.0 C$C
60\ c cps’ cgs
CGT S’GS’ %
CGG SES’
\---.__
GGS’ ‘iG’ TGS’ l GGS
‘\‘____-
sp
--
S$T
--
l.O- GGGa TGG’ . l
GGT,GGG TiT
I I I J 3.0 4.0 5.0 6.0 10
R(C+;d
Fig. 2. Relative energy of C,H,SSC,H, conformers as a function of R (C;Y-C;Y ), the (H,)C-C (H3) distance (see text for definitions of regions I, II, and III).

11
61 disulfide bridges, 42 conformers (69%) fell into the group of 7 designated as class I in Fig. 2, 12 (20%) into the 6 of class II, and 8 (11%) into the re- maining 8 of class III. (The G’ GG’ and S’ GG’ conformers are included in class I even though they have a higher energy because they are relatively numerous and represent the lowest energy strained, viz., small R (Cy -CF ), structures. )
The force fields in Cartesian coordinates for the disulfide molecules were calculated using the ab initio Gaussian 82 and Gaussian 86 (only for CH$SCHB) programs. Only the Gaussian 86 program calculated Raman and IR intensities, and because at this time we could not use it to calculate mole- cules larger than CH,SSCH,, such intensities were not obtained for CH,SSC,H, and C,H,SSC,H,. The calculations were carried out on an IBM-3090, except that the force fields of CH,SSC,H, and C2H5SSC2H5 were carried out on a Micro VAX II. Because of the extensive computations, the force field calcula- tions for C,H,SSC,H, were carried out only for the six symmetric conformers, CGC, GGG, SGS, TGT, S’GS’, G’GG’, and one asymmetric conformer GGT, which is the second most stable conformer and for which some experimental frequencies are known.
NORMAL MODE CALCULATIONS
A total of 26, 36, and 46 internal coordinates were defined for dimethyl, methylethyl, and diethyl disulfides, respectively, in the traditional way [ 131, 2,3, and 4 of these, respectively, being redundant coordinates. The B matrices of these molecules in their various conformations were calculated in the stan- dard manner. The F, matrices in Cartesian coordinates from the ab initio cal- culations were transformed into F matrices in internal coordinates in the fol- lowing way. By diagonalizing the product matrix BB (where N indicates the transpose) with a unitary matrix U, the eigenvalue matrix r is obtained
~(BB)U=r
The non-zero eigenvalue matrix, To, and corresponding eigenvectors U.
u= wcJul) l-00 r= 0 0 ( > are used to calculate the generalized inverse matrix of B by
B+=BU,r,‘~J,
The force constants are then transformed from Cartesian coordinates to inter- nal coordinates by
F=f%+F,B+
Since ab initio force constants generally give vibrational frequencies that are considerably higher than experimental values, the force constants must be
12
scaled. The scaling procedure used was as follows. The internal coordinates were separated into different groups according to their chemical types, for ex- ample, CH stretch, CCH bend, HCH bend, etc., and a scale factor Ci was as- signed to group i. Then the diagonal force constant Fii was multiplied by Ci and the off-diagonal force constant Fij by (CiCj) 1’2, or in matrix notation [ 141
where Fab is the F matrix in internal coordinates from the ab initio calculation. The Fab matrix obtained by the above procedure is a canonic F matrix [ 151. To keep the F matrix after scaling canonic, the following transformation was performed.
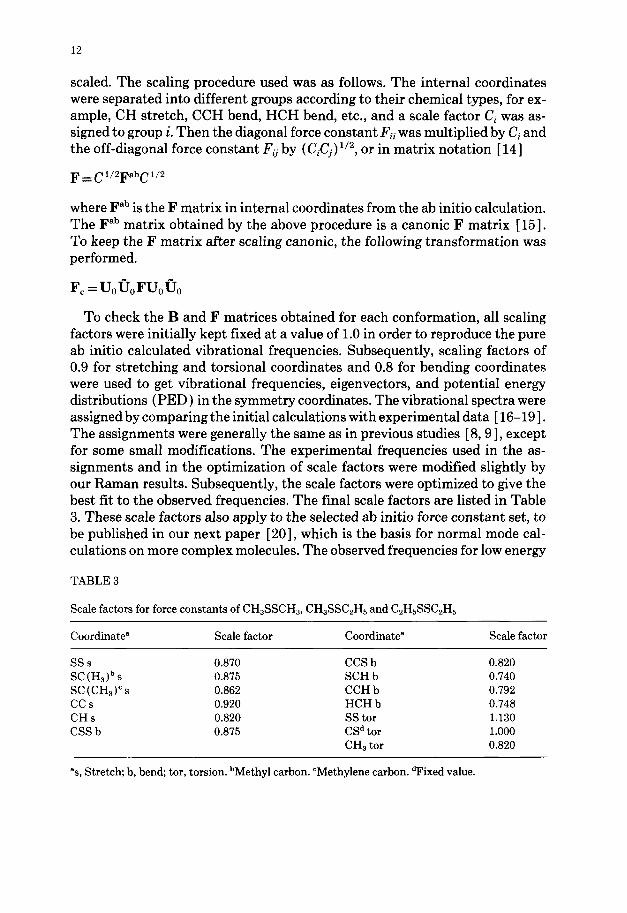
To check the B and F matrices obtained for each conformation, all scaling factors were initially kept fixed at a value of 1.0 in order to reproduce the pure ab initio calculated vibrational frequencies. Subsequently, scaling factors of 0.9 for stretching and torsional coordinates and 0.8 for bending coordinates were used to get vibrational frequencies, eigenvectors, and potential energy distributions (PED ) in the symmetry coordinates. The vibrational spectra were assigned by comparing the initial calculations with experimental data [ 16-191. The assignments were generally the same as in previous studies [ 8,9], except for some small modifications. The experimental frequencies used in the as- signments and in the optimization of scale factors were modified slightly by our Raman results. Subsequently, the scale factors were optimized to give the best fit to the observed frequencies. The final scale factors are listed in Table 3. These scale factors also apply to the selected ab initio force constant set, to be published in our next paper [ 201, which is the basis for normal mode cal- culations on more complex molecules. The observed frequencies for low energy
TABLE 3
Scale factors for force constants of CHBSSCHB, CH,SSC,HS and C,H$SC,H,
Coordinate” Scale factor Coordinate” Scale factor
sss 0.870 CCS b 0.820 SC(H,Jbs 0.875 SCH b 0.740 SC(CH,)‘s 0.862 CCH b 0.792 ccs 0.920 HCH b 0.748 CHs 0.820 SS tor 1.130 CSS b 0.875 CSd tor 1.000
CH, tar 0.820
%, Stretch; b, bend, tor, torsion. bMethyl carbon. ‘Methylene carbon. dFixed value.

13
conformers, with associated calculated values using the full ab initio force field, are listed in Tables 4-6.
It can be seen from these results that the ab initio force field allows for a more detailed description than do the empirical force fields [ 8,9]. For exam- ple, the best of these previous calculations [ 91 gave almost the same frequen- cies (2 cm-l difference) for the four v (CS) frequencies of the GGG and GGT conformers of C,H,SSC,H,. This is not consistent with the experimental data, which show that the v (CS) frequency of the GGT conformer is about 27 cm-’ higher than that of the GGG conformer, in good agreement with our calcula- tions. Moreover, in our Raman polarization experiments [ 201, when the elec- tric vector of the scattered beam is rotated from the parallel to the perpendic-
TABLE 4
Observed and calculated frequencies and intensities of CH3SSCH3
Observed” Calculated
Raman IR Freq Sym Z(R) I(IR) PEDb
2990 m
2983 m
2913 s
1426 m
1419 m
1311 mw
949 m
694 vs
691 m 509 vs 274 ms 240 s
114ms
2997 A 2986 2997 B s
2980 A 2978 B
2915 2912 A vs
i
2910 B 1430 vs 1430 B
1426 A
1415 vs 1422 A 1417 B 1323 A
1303 vs 1317 B
955 vs 958 B 952 A 945 A 937 B
691 m 694 A 688 B
’ 511 mw 508 A 276 m 274 B 241 m 240 A
157 B 150 A 114 A
111 5.2 0 8.1
149 7.4 11 3.3
227 19.1 2 19.6
25 22.7 7 0.8
41 10.5 11 15.9 3 0.2 2 1.1 5 22.0 9 7.3
11 2.7 0 3.4
26 0.9 21 1.1 27 0.3 3 1.2 4 1.5 0 0.5 1 0.1 2 1.5
CH, as(100) CH, as(100) CHB as(99) CH, as(99) CH, ss(98) CH, ss (98) CH, ab(96) CHa ab(96) CH3 ab (95) CH, ab(96) CH3sb(107) CHa sb ( 109) CHs r(84) CH, r(94) CH:, r(85) CH, r(95)
cs s(104) cs s(107) ss s(100) CSS b(97) CH,r(14) CSS b(88) CH, r(10) CS tor(96) CS tor(91) CSS b(19) SS tor(93)
“Ref. 16; in cm-‘. bPotentiaI energy distribution, components 2 10%; a=antisymmetric, s = symmetric; s = stretch, b = bend, r = rock, tor = torsion.

14
TABLE 5
Observed and calculated frequencies of CH,SSC,H,
Obs. GG Conformer GT Conformer
Calc. PEDb talc. PEDb
2962*
2907*
1453*
1437*
1418*
1380* 1307* 1282* 1255* 1050*
I 2979 2960 2954 2919 2910 2901 1452 1444 1428 1420 1415 1382 1320 1266 1250 1051
1030*
969* 954*
1031
967 955 941
781 759 692 669 641 524 509 362 327
757 692
641
506 361
280
246
286
236 (H,)CSS b(49) (H,)CC tor(47)
196 195
2997
2980
150 118 75
(S)CH, as(lOO) (C)CH, as(58) CH2 as(29) (S)CH,as(l2) (S)CHs as(86) (C)CH, as(58) CHa as(34) (C)CH,as(70) CH2as(29) CH, ss(90) (S)CH, ss(98) (C)CH, ss(93) (C)CH, ab(91) (C)CH, ab(90) (S)CH,ab(94) (S)CH,ab(70) CH,b(26) CH2b(71) (S)CH,ab(27) (C)CH, sb(105) (S)CHs sb(107) CH, ~(85) CH, tw(53) (C)CH, r(19) (C)CH, r(53) CC ~(30) CH,w(13) CH, tw(41) (C)CH, r(40) CH, r(1’7) CC ~(66) (C)CH,r(lS) (S)CHs r(83) (SK& r(94)
CH, r(74) (C)CH,r(32) (H&S ~(105)
(H,)CS s(94) SCC b(l1)
ss s(99) SCC b(68) SSC(H,) b(18)
(H,)CSS b(41) SSC(H,) b(23) (H,)CC tor(29)
(H,)CSS b(46) (H,)CC tor(16) SCC b(14) (Hs)CS tor(l4) (H3)CS tor(85) (H,)CSS b(l9) SS tor(46) (H,)CS tor(45) (H,)CS tor(58) SS tor(49)
2997 (S)CH,as(lOO) 2989 CH, as(82) (C)CHs as(16)
2979
2962
2958
2935 2911 2903 1449 1446 1431 1427 1419 1382 1320 1264 1242 1050
1019
966 955 941 774
(S)CH,as(99) (C)CH,as(SO) (C)CH, as(89) CH, as( 12) CH, ss (92) (S)CH, ss(98) (C)CH, ~~(100) (C)CHs ab(91) (C)CH, ab(90) (C)CH, r(10) CH, b(71) (S)CH, ab(26) (S)CH, ab(69) CH, b(29) (S)CH, ab(95) (C)CH,sb(lOG) (S)CH,sb(l07) CH, w(91) CH* tw(52) (C)CH, r(22) (C)CH, r(58) CC s(19) CH,w(ll) CH, tw(48) (C)CH, r(3’7) CH, r(19) CC ~(77) (C)CH,r(ll) (SW& r(83) (S)CHs r(W) CHsr(73) (C)CH,r(35)
692 668
528
(H,)CS ~(105) (H,)CS s(91) (C)CH, r(10)
ss s(93)
329 SCC b(37) SSC(H,) b(13) (H,)CSS b(l2)
248 (H,)CSSb(82) (S)CH,r(lO)
226 193
143 106 66
(H,)CC tor(82) (H,)CSS b(51) SCC b(29) (H,)CS tor(23) (Ha)CS tor(77) (H,)CSS b(30) SS tor(87) (H,)CS tor(97)
“Refs. 17 and 18; in cm-‘. Values marked with an asterisk are from infrared spectrum; others from Raman spectrum. bPotential energy distribution, components 2 10%: a=antisymmetric, s = symmetric; s = stretch, b = bend, w = wag, tw = twist, r = rock, tor = torsion.

15
TABLE 6
Observed and calculated frequencies of CPH,SSCZH,
Ohs.” GGG Conformer GGT Conformer
Calc. PEDb Calc. PEDb
2980 A
2980 B
[ 2961A
2959 2960 B 2954 A 2954 B
2915 29194 2918 B
2901 A 2900 B 1452 B
1446 1452 A 1444 A 1444 B
1418 {
1417A 1416 B
1374* {
1383 B 1382 A
1278* 1272 A 1260 B
1254 i 1251 A 1250 B
c 1053 A
1050
I
1048 B
( 1033 B
1029 1028 A
967 967 A 967 B
781*
760 758 B 755 A
’ 668 643 646 A 640* 638 B 523 508 504 A
CH, as (66) CH2 as (33 ) CH, as(70) CH, as(29) CH, as(55) CH2 as(35) CH, as(59) CH, as(33) CH, as(73) CH,as(26) CH, as(65) CH, as(33) CH, ss(89) CH2 ss(91) CH3 ss(93) CH3 ~~(93) CH3 ab(91) CH3 ab(91) CHB ab(90) CHB ab(90) CH, b(98) CH, b(99) CH, sb (105) CH, sb( 105) CH2 ~(83) CH2 w (88) CH, tw(51) CH, r(19) CH,tw(55) CH,r(19) CHB r(53) CC s(29) CH, ~(12) CH, r(52) CC ~(30) CH, ~(13) CH, tw(41) CH, r(40) CH, r( 17) CH2 tw(41) CH, r(40) CH* r(17) CC ~(66) CH, r(20) CCs(67) CH,r(20)
CH, r(74) CH, r(32) CH, r(75) CH,r(31)
CSs(92) CCS b(l1) CSs(98) CCSb(l1)
ss s(97)
2988
2980
2961 2960 2958 2954 2935 2918 2903 2900 1449 1452 1444 1446 1430 1416 1382 1382 1270 1260 1241 1251 1051
1049
1031
1019
967 966 774 757
CH, as(83) CH, as(16) CH, as(66) CH, as(33) CH, as(89) CH, as(57) CH, as(35) CH,as(87) CH,as(l3) CH, as(73) CH, as(26) CH, ss(92) CH, ss(90) CH, ss( 100) CH, ss(93) CH,ab(91) CH, ab(91) CH, ab (90) CH, ab(90) CH, b(100) CH, b(99) CH, sb(105) CH, sb (105) CH, ~(84) CH, w(91) CH, tw(52) CH, r(22) CH,tw(52) CH,r(19) CH, r(54) CC ~(27) CH, ~(12) CH, r(59) CC ~(22) CH,w(ll) CH, tw(41) CH, r(41) CH, r(17) CH, tw(48) CH, r(37) CH,r(19) CC s(69) CH, r(19) CC ~(77) CH, r(13) CH, r(73) CHB r(35) CH,r(74) CHBr(32)
669 CS s(92) CH, r( 10)
642 CS s(94) CCS b(l1) 525 ss s(91)
16
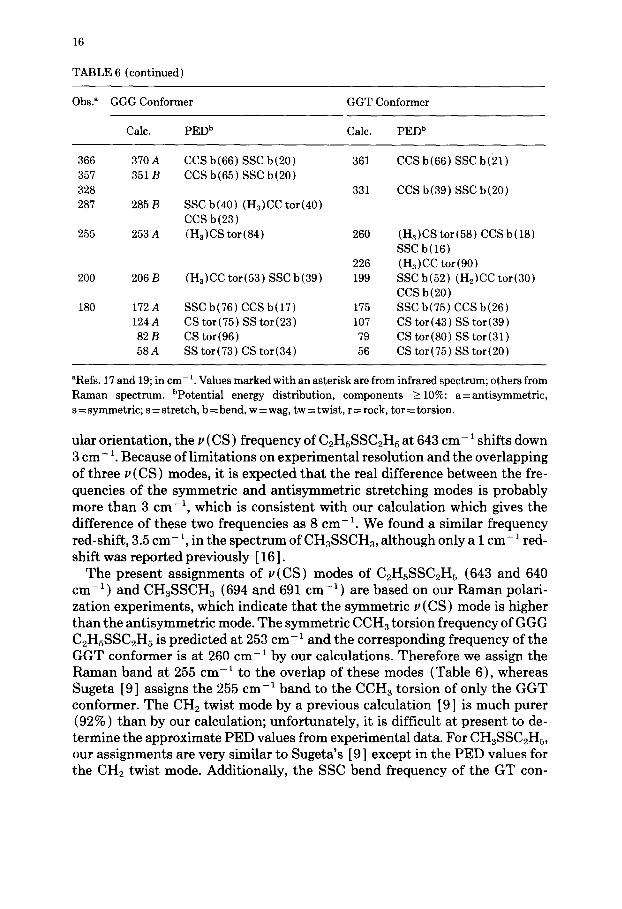
TABLE 6 (continued)
Obs.” GGG Conformer GGT Conformer
Calc. PEDb Calc. PEDb
366 357 328 287
255
200
180
370 A 351 B
285 B
253 A
206 B
172 A 124 A 82B 58A
CCS b(66) SSC b(20) CCS b(65) SSC b(20)
SSC b(40) (H,)CC tor(40) CCS b(23) (H,)CStor(84)
(H,)CC tor(53) SSCb(39)
SSC b(76) CCS b(17) CS tor(75) SS tor(23) CS tor(96) SS tor(73) CS tor(34)
361
331
260
226 199
175 107 79 56
CCS b(66) SSC b(21)
CCS b(39) SSC b(20)
(H,)CStor(58) CCSb(l8) SSC b(16) (H,)CC tor(90) SSC b(52) (H,)CC tor(30) CCS b(20) SSC b(75) CCS b(26) CS tor(43) SS tor(39) CS tor(80) SS tor(31) CS tor(75) SS tor(20)
“Refs. 17 and 19; in cm-‘. Values marked with an asterisk are from infrared spectrum; others from Raman spectrum. bPotential energy distribution, components 2 10%: a=antisymmetric, s = symmetric; s = stretch, b = bend, w = wag, tw = twist, r = rock, tor = torsion.
ular orientation, the v (CS) frequency of C,H,SSC,H, at 643 cm-l shifts down 3 cm-l. Because of limitations on experimental resolution and the overlapping of three Y (CS) modes, it is expected that the real difference between the fre- quencies of the symmetric and antisymmetric stretching modes is probably more than 3 cm-l, which is consistent with our calculation which gives the difference of these two frequencies as 8 cm-‘. We found a similar frequency red-shift, 3.5 cm-‘, in the spectrum of CH,SSCH,, although only a 1 cm-l red- shift was reported previously [ 161.
The present assignments of v (CS) modes of C,H,SSC,H, (643 and 640 cm-l) and CH3SSCH3 (694 and 691 cm-‘) are based on our Raman polari- zation experiments, which indicate that the symmetric v (CS) mode is higher than the antisymmetric mode. The symmetric CCH, torsion frequency of GGG C,H,SSC,H, is predicted at 253 cm-’ and the corresponding frequency of the GGT conformer is at 260 cm-’ by our calculations. Therefore we assign the Raman band at 255 cm-’ to the overlap of these modes (Table 6), whereas Sugeta [9] assigns the 255 cm-’ band to the CCH3 torsion of only the GGT conformer. The CH, twist mode by a previous calculation [9] is much purer (92% ) than by our calculation; unfortunately, it is difficult at present to de- termine the approximate PED values from experimental data. For CH3SSC2H5, our assignments are very similar to Sugeta’s [ 91 except in the PED values for the CH2 twist mode. Additionally, the SSC bend frequency of the GT con-

17
former, 248 cm-l, is by our calculation 12 cm-’ lower than Sugeta’s value [9] and is thus closer to the experimental value. The only difference in the assign- ments for CH,SSCH, is in the CH3 rock vibration. The calculation of Sugeta et al. [2] gives the symmetric CH, rock a higher frequency, 950 cm-‘, than the corresponding antisymmetric mode, 948 cm-‘, whereas our calculation pre- dicts the opposite, 958 (B) and 952 (A) cm-‘, which is consistent with the ob- served and calculated Raman and IR intensities (see Table 4).
FORCE CONSTANTS AND VIBRATIONAL FREQUENCIES AS A FUNCTION OF CS
TORSION ANGLE
The variation of the SS stretch force constant, f(SS), and the SS stretch frequency with r( SS) in CH,SSCH, were shown in Fig. 1 of our previous paper [ 71. A similar variation was found in C,H,SSC,H, from our present calcula- tions. We have therefore assumed that f(SS) in C,H,SSC,H, varies in the same way as in CH,SSCH,. Since we found that the v(SS) and v (CS) fre- quencies are more dependent on r(CS) than on r(SS), we have studied the correlation with r( CS ) in more detail. (The variation off( SS) and v (SS) with r( SS ) in CH,SSCH, is quite small near the optimum conformation [ 71: f( SS) decreases by -0.03 mdyn A-’ for a ? 15” change from r(SS) =84”,and~(SS) decreases by -1.5 cm-’ for a 215” change from r(SS)=93”. In our next paper [ 201, we will show how to make corrections to the following results for small changes in r(SS).)
Normal mode calculations were done for all 21 possible conformers of C,H,SSC,H, using the full scaled ab initio force field described above. All of the geometric parameters for the asymmetric conformers were taken directly from the ab initio calculations (see Table 1)) while the F matrices had to be determined by approximation. Our method is illustrated by the CGG con- former. In this case, all the force constants for the cis side were taken from the values for the CGC conformer, and for the gauche side from the GGG con- former. The diagonal SS stretch and SS torsion force constants and all the off- diagonal constants belonging to both sides were taken as the average value from both CCC and GGG conformers. The off-diagonal elements of SS stretch and SS torsion received 3/4 of their value from the symmetric conformation corresponding to the side of the molecule in which the internal coordinate other than SS stretch or SS torsion was located and l/4 from the other sym- metric conformation. The frequencies calculated using this algorithm for the GGT conformer were very close to those obtained directly from the scaled ab initio force field, with at most 1 or 2 cm-l difference.
The I, (SS) and v(CS) frequencies of the symmetric conformer of C,H,SSC,H, are plotted as a function of r(CS) in Fig. 3 and the V( SS) and v(CS) frequencies for all 21 conformations are listed in Table 2. Because the v(CS) frequency splits for the symmetric C2H5SSC2H5, the average value of

I I I I I I I 0 60 !20 160 240 300 360
VCS)
Fig. 3. Dependence of v (CS), the CS stretch frequency (-), and v (SS), the SS stretch frequency (---), on T(CS), the CS dihedral angle, for XGX C,H,SSC,H6.
the symmetric and antisymmetric v(CS) frequencies is used in Fig. 3. It is interesting that the v( SS) frequency has two maxima, at the tram and cis conformations, whereas the v (CS ) frequency has only one. From the ab initio calculations, we know that the SS and CS force constants vary by about 4% as 7( CS) changes; therefore the variation of the force constants themselves prob- ably gives rise to only about a 2% variation in the frequencies. Since these frequencies vary by about 7% as z(CS) changes (cf. Fig. 3), we conclude that the geometric factor is more responsible for the variation in v (SS) and v (CS) frequencies than are the force constants. However, keeping the force constants fixed will also cause considerable error if a more detailed description of the normal modes is needed. The v (SS) frequencies follow the order: TT > SS > S’ S’ > CC z=- GG > G’ G’ whereas the v (CS ) frequencies follow a slightly different order: TT > S’S’ > SS > GG > G’G’ > CC.
Our results show for the first time that the frequencies of the G and G’ conformers are not the same, the v (SS) of these two conformers differing by 7 cm-l. The frequencies of the S and S’ conformers are also different, although the difference is much smaller. Another important conclusion from our cal- culations is that the v (CS) frequency depends mainly on the geometry of one side of the SS bridge, the effect of 7(CS) of the other side of the SS bridge being very small. However, the v (SS ) frequency depends on the 7 (CS ) angles on both sides. This dependence has already been shown by Sugeta et al. [2] based on experimental data.
According to our calculations, the v (SS ) frequency of the GGG conformer of C,H,SSC,H, is 21 cm-’ lower than that of the GGT conformer, whereas the observed difference is 15 cm-‘. It seems that our calculations overstate the difference between different conformers. Although we tried to avoid this dif- ficulty by reducing the scale factor for the interaction force constants between SS stretch and other coordinates, it could not be eliminated. Based on this

19
argument, the v (SS) frequency of the TGT conformer may not be as high as given by our calculation, viz., 542 cm-l. We attempted to observe the v(SS) band of the TGT conformer by increasing the temperature of the C,H,SSC,H, sample, but no clear effect was seen. This is puzzling in view of the calculated energy difference of only 0.4 kcal mol-’ between the TGT and GGG conformers.
CONCLUSIONS
The use of 13 refined scale factors to the ab initio force constants of CH,SSCH,, CH,SSC,H, and C,H,SSC,H, has permitted the reproduction of 62 observed IR and Raman frequencies with an average error of 0.5%. These results enable us to use a selected set of these force constants [ 201 to calculate the normal modes of more complex disulfide molecules. We have also been able to show how the SS and CS stretch frequencies depend on the internal rotation geometry of the disulfide group. Such studies should permit a more detailed characterization of the cystine bridge geometry in proteins by Raman spec- troscopy than has heretofore been possible.
ACKNOWLEDGEMENT
We are indebted to Dr. J. Bandekar for the Raman polarization studies. This research was supported by a grant from the Monsanto Company, St. Louis, MO.
REFERENCES
8 9
10
11 12 13
14
15
R.C. Lord and Nai-teng Yu, J. Mol. Biol., 50 (1970) 509. H. Sugeta, A. Go and T. Miyazawa, Chem. Lett., 83 (1972). H. Brunner and M. Holz, Biochim. Biophys. Acta, 379 (1975) 408. H.E. Van Wart and H.A. Scheraga, J. Phys. Chem., 80 (1976) 1812,1823. T. Takamatsu, I. Harada and K. Hayashi, Biochim. Biophys. Acta, 622 (1980) 189. A.H. Kuptsov and V.I. Trofimov, J. Biomol. Struct. Dyn., 3 (1985) 185. W. Zhao, J. Bandekar and S. Krimm, J. Am. Chem. Sot., 110 (1988) 6891, and references cited therein. D.W. Scott and M.Z. El-Sabban, J. Mol. Spectrosc., 31 (1969) 362. H. Sugeta, Spectrochim. Acta, Part A, 31 (1975) 1729. B.E. Weiss-Lopez, M.H. Goodrow, W.K. Musker and C.P. Nash, J. Am. Chem. Sot., 108 (1986) 1271. H.E. Van Wart, L.L. Shipman and H.A. Scheraga, J. Phys. Chem., 78 (1974) 1848. M. Aida and C. Nagata, Theor. Chim. Acta, 70 (1986) 73. E.B. Wilson, Jr., J.C. Decius and P.C. Cross, Molecular Vibrations, McGraw-Hill, New York, 1955. G. Fogarasi and P. Pulay, in J.R. Durig (Ed.), Vibrational Spectra and Structure, Vol. 4, Elsevier, Amsterdam, 1985. K. Kuczera and R. Czerminksi, J. Mol. Struct., 105 (1983) 269.

20
16 S.G. Frankiss, J. Mol. Struct., 3 (1969) 89. 17 H. Sugeta, A. Go and T. Miyazawa, Bull. Chem. Sot. Jpn., 46 (1973) 3407. 18 K.G. Allum, J.A. Creighton, J.H. Green, G.J. Minkoff and L.J.S. Prince, Spectrochim. Acta,
Part A, 24 (1968) 927. 19 D.W. Scott, H.L. Finke, J.P. McCullough, M.E. Gross, R.E. Pennington and G. Waddington,
J. Am. Chem. Sot., 74 (1952) 2478. 20 W. Zhao, J. Bandekar, and S. Krimm, J. Mol. Strut., in press.