Embed Size (px)
Citation preview
N Wellner
Institute of Food Research
Norwich, UK
Vibrational spectroscopy study of starch
and cell wall polysaccharide structures
Outline
IR spectroscopy, normal modes and molecular structure
Composition of plant tissue
Functional imaging of film fracture
Investigation of starch granules
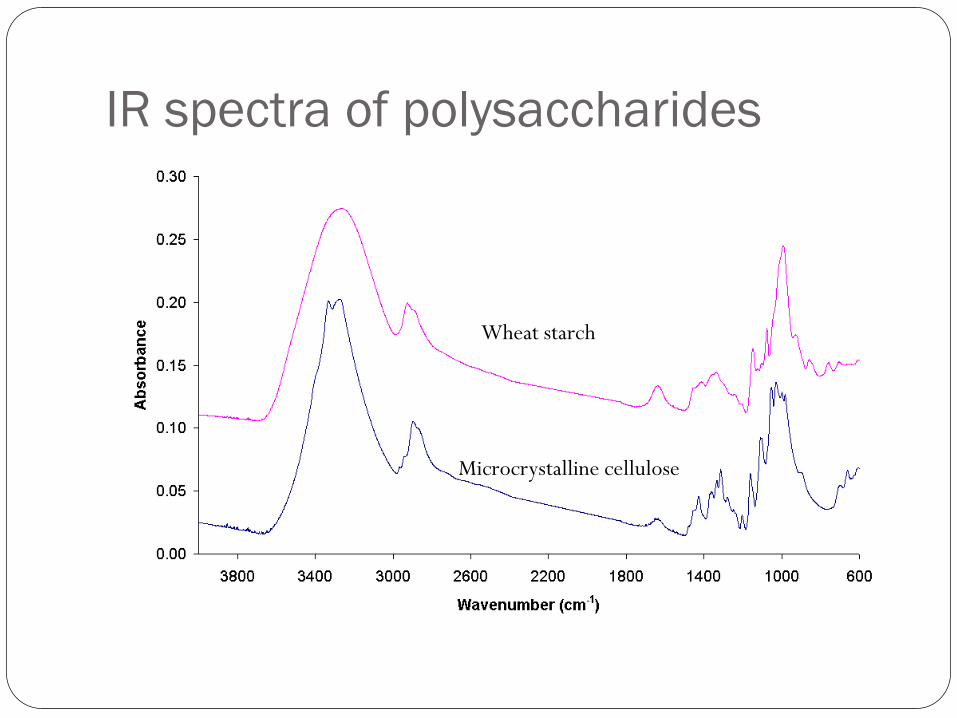
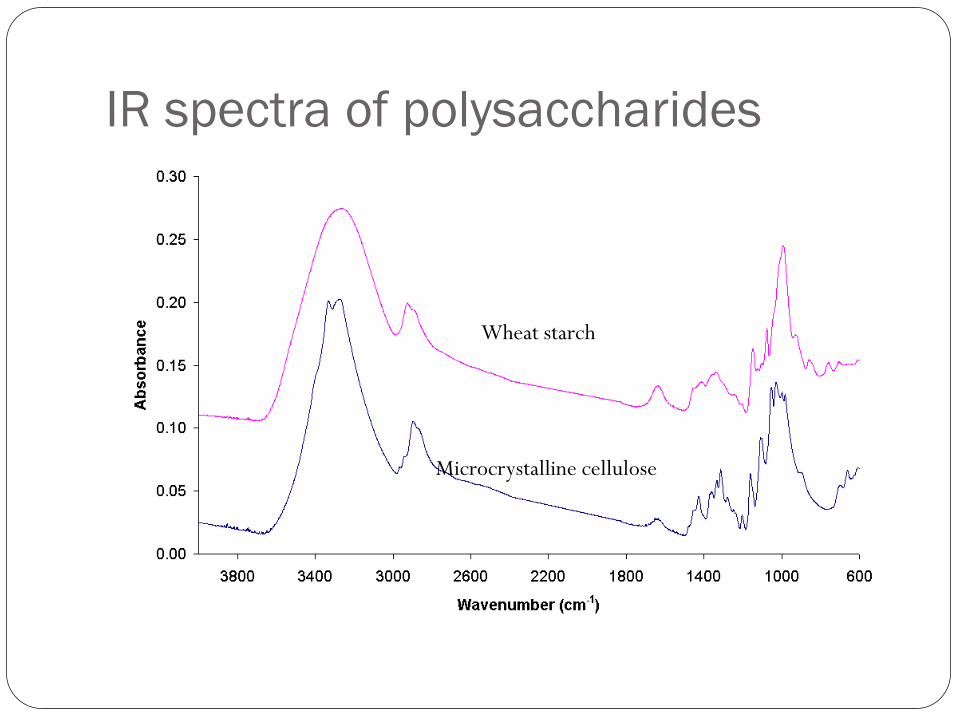
IR spectra of polysaccharides
Wheat starch
Microcrystalline cellulose
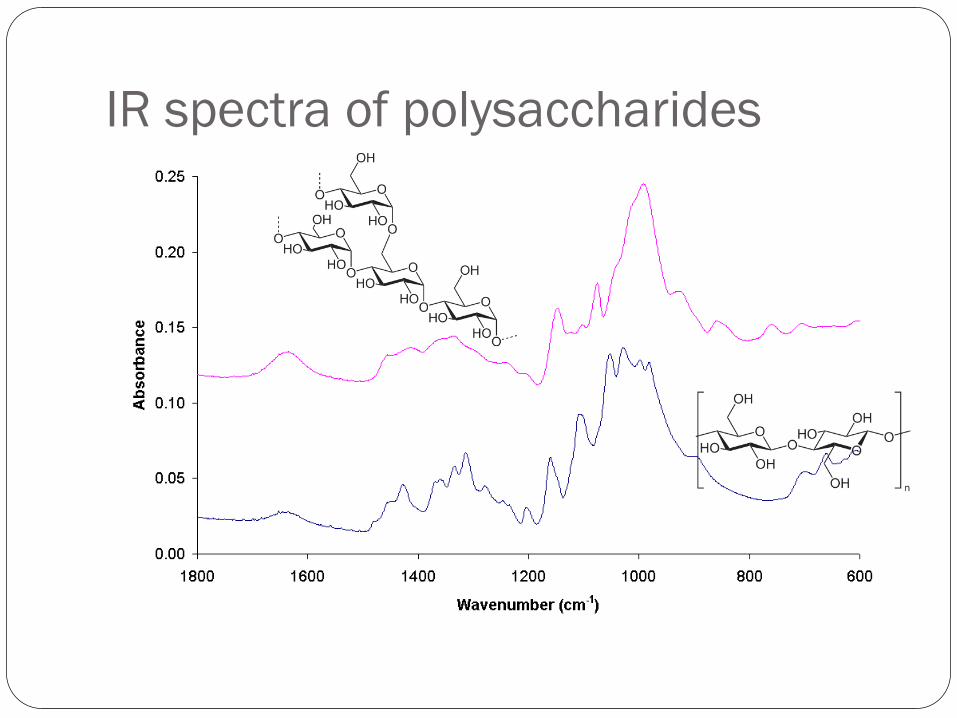
IR spectra of polysaccharides
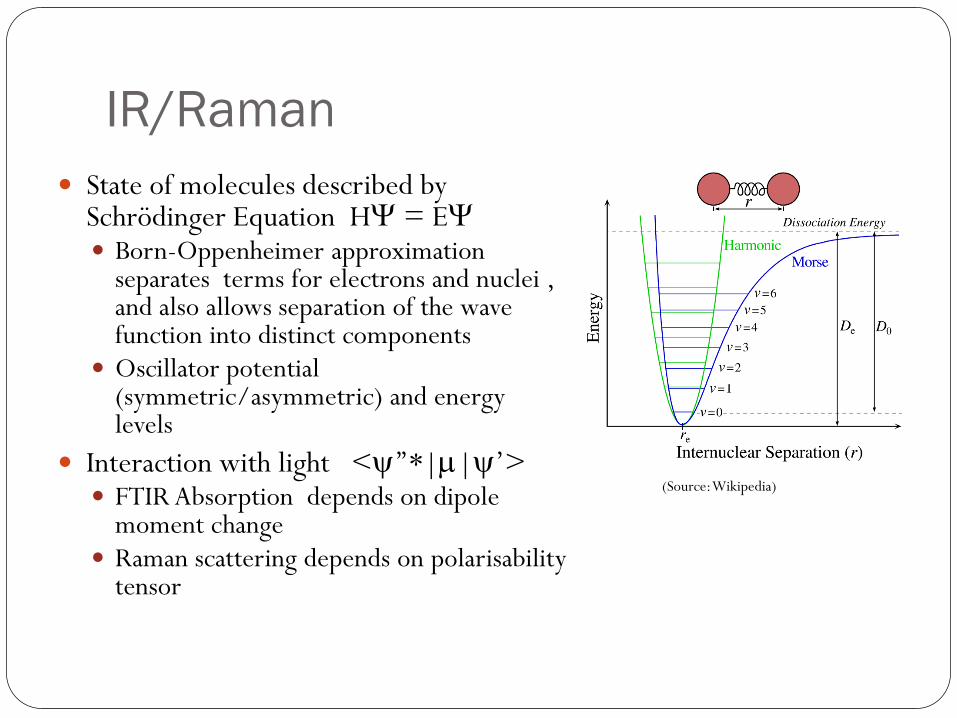
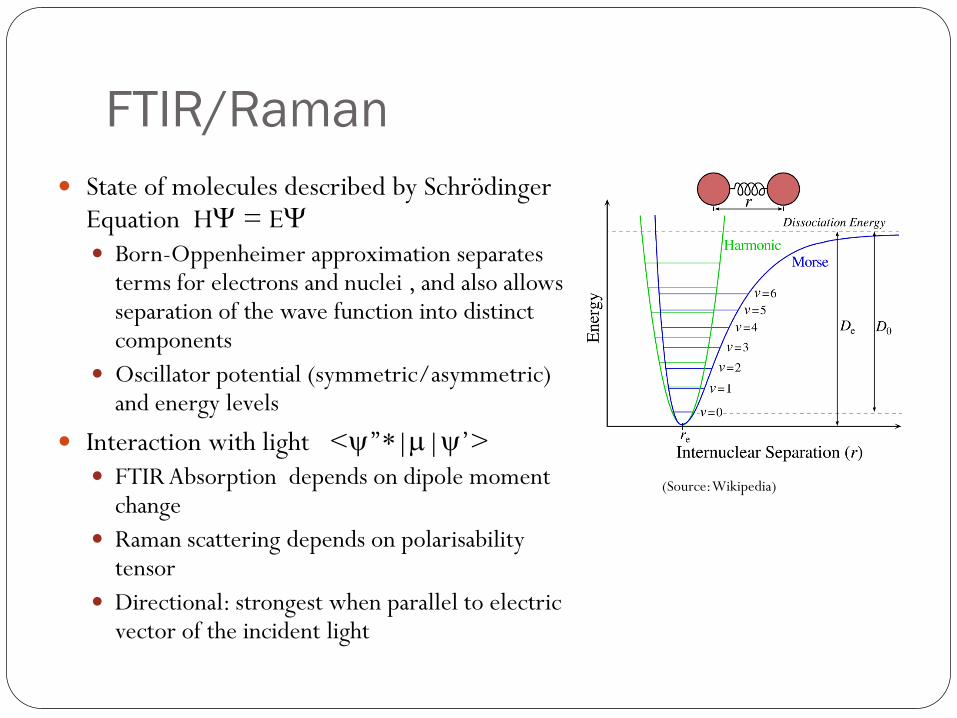
IR/Raman
State of molecules described by Schrödinger Equation HY = EY Born-Oppenheimer approximation
separates terms for electrons and nuclei , and also allows separation of the wave function into distinct components
Oscillator potential (symmetric/asymmetric) and energy levels
Interaction with light <y’’*|m|y’> FTIR Absorption depends on dipole
moment change Raman scattering depends on polarisability
tensor
(Source: Wikipedia)
IR spectra of polysaccharides
Wheat starch
Microcrystalline cellulose
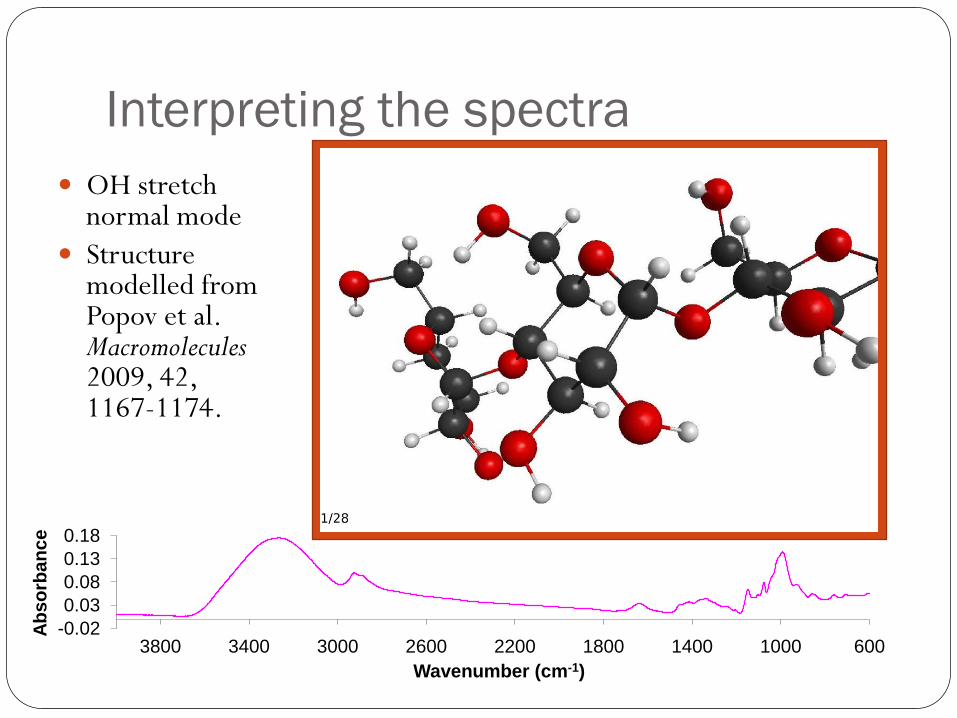
Interpreting the spectra
OH stretch normal mode
Structure modelled from Popov et al. Macromolecules 2009, 42, 1167-1174.
-0.02
0.03
0.08
0.13
0.18
60010001400180022002600300034003800
Ab
so
rba
nc
e
Wavenumber (cm-1)
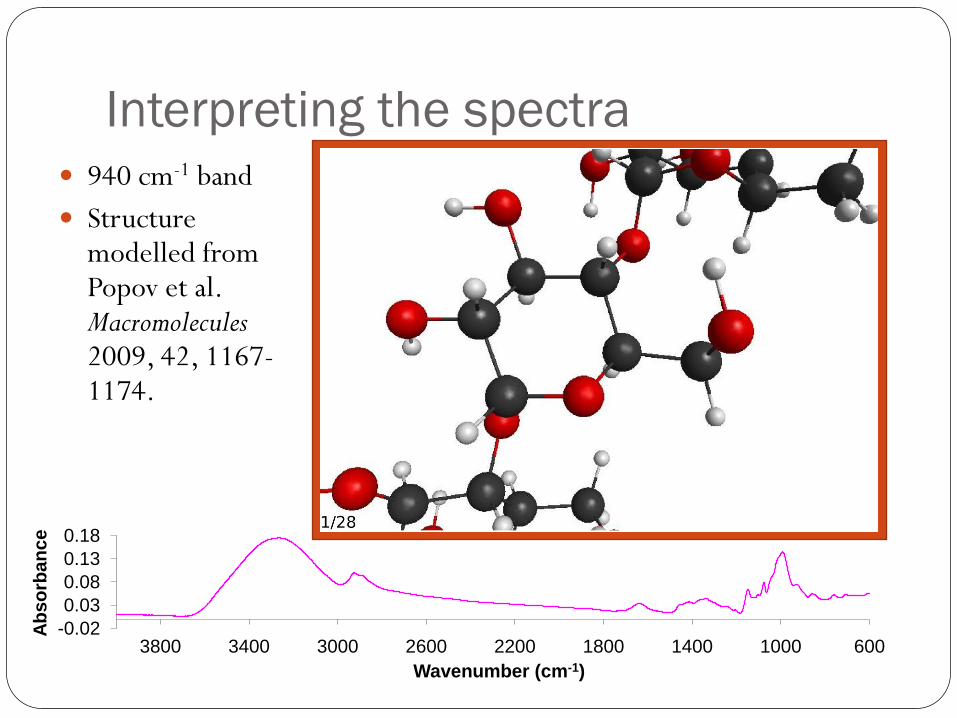
Interpreting the spectra 940 cm-1 band
Structure modelled from Popov et al. Macromolecules 2009, 42, 1167-1174.
-0.02
0.03
0.08
0.13
0.18
60010001400180022002600300034003800
Ab
so
rba
nc
e
Wavenumber (cm-1)
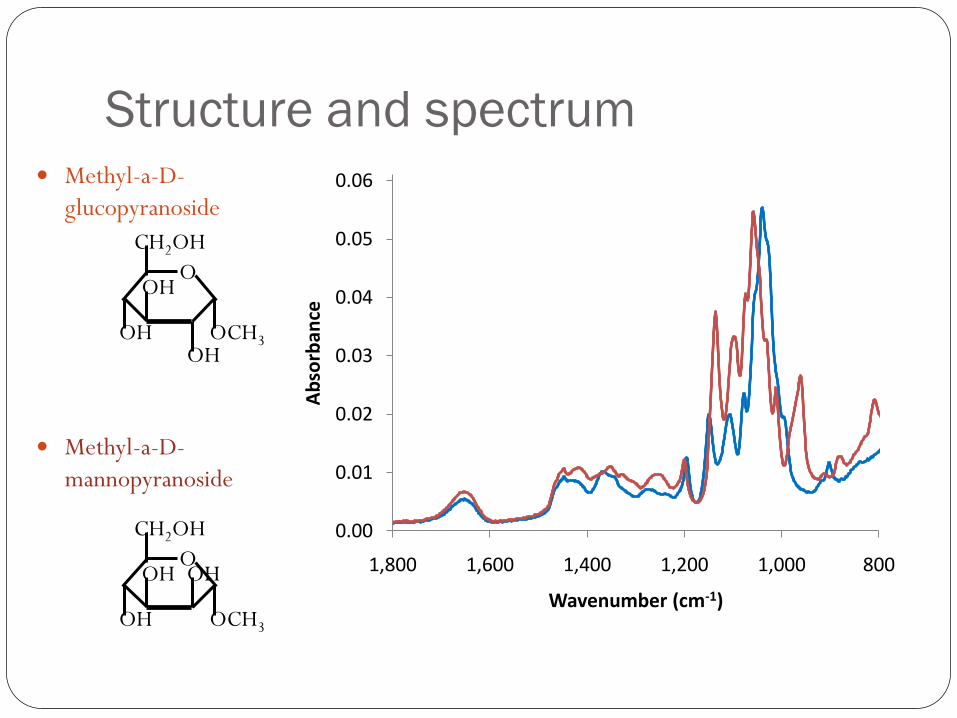
Structure and spectrum Methyl-a-D-
glucopyranoside
Methyl-a-D-
mannopyranoside
0.00
0.01
0.02
0.03
0.04
0.05
0.06
8001,0001,2001,4001,6001,800
Ab
sorb
ance
Wavenumber (cm-1)
CH2OH
OOH OH
OH OCH3
CH2OH
OOH
OHOH OCH3
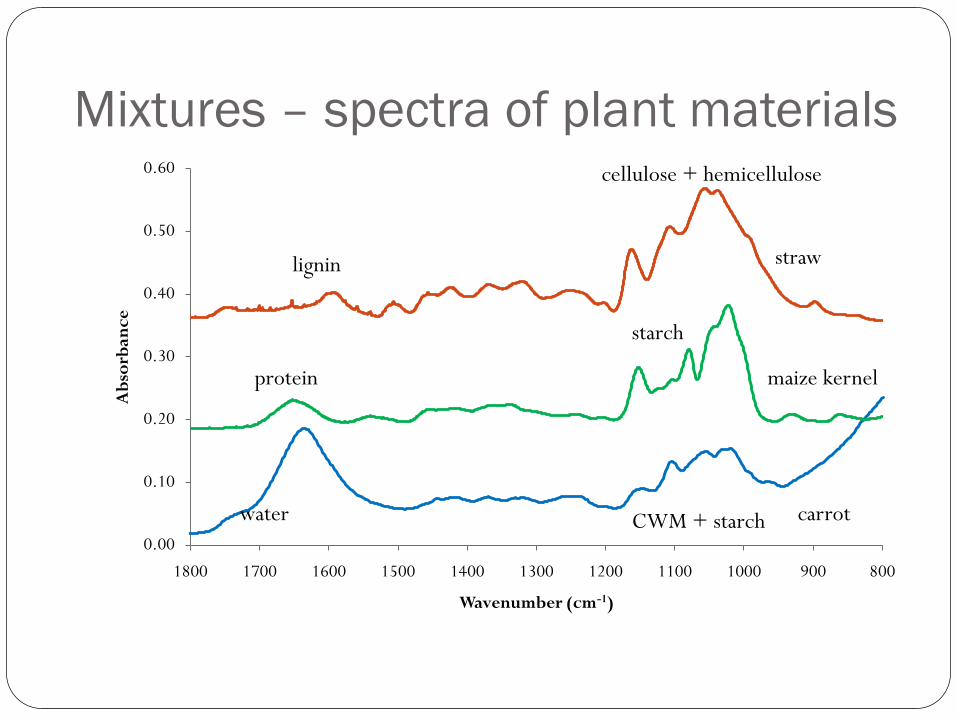
Mixtures – spectra of plant materials
0.00
0.10
0.20
0.30
0.40
0.50
0.60
800900100011001200130014001500160017001800
Ab
sorb
anc
e
Wavenumber (cm-1)
straw
maize kernel
carrot
lignin
cellulose + hemicellulose
protein
starch
water CWM + starch
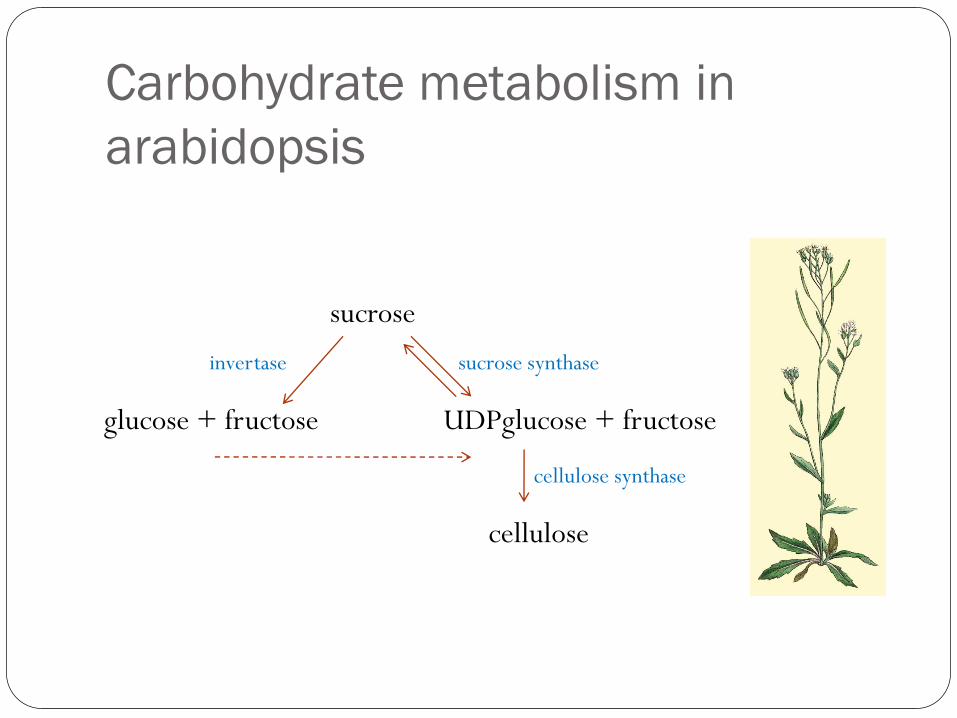
Carbohydrate metabolism in
arabidopsis
sucrose
invertase sucrose synthase
glucose + fructose UDPglucose + fructose
cellulose
cellulose synthase
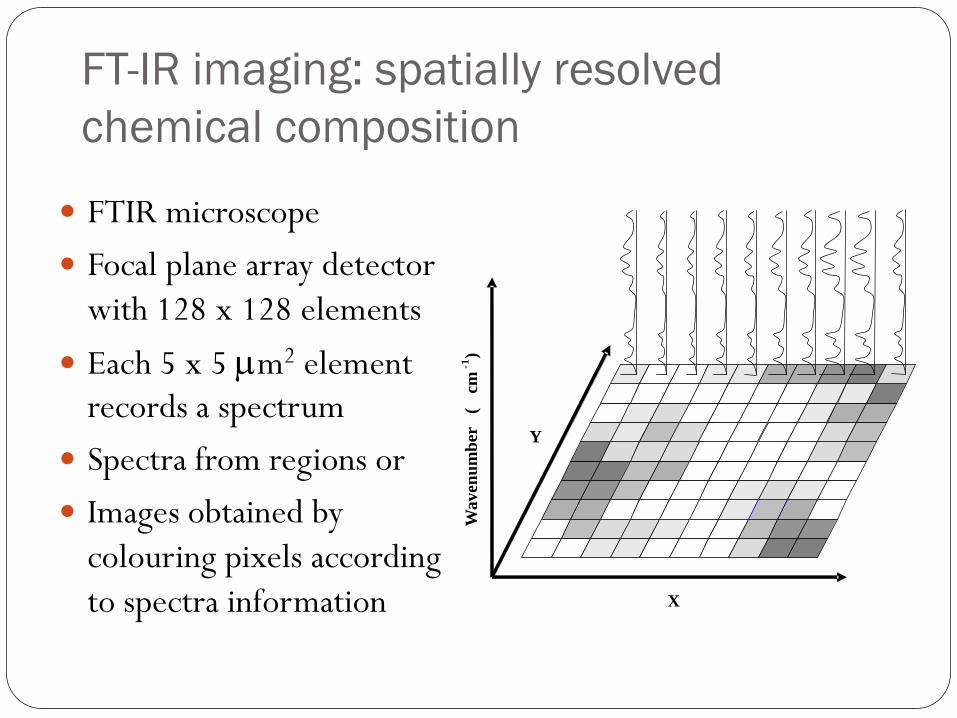
FT-IR imaging: spatially resolved
chemical composition
FTIR microscope
Focal plane array detector
with 128 x 128 elements
Each 5 x 5 mm2 element
records a spectrum
Spectra from regions or
Images obtained by
colouring pixels according
to spectra information X
Y
Waven
um
ber
(cm
- 1)
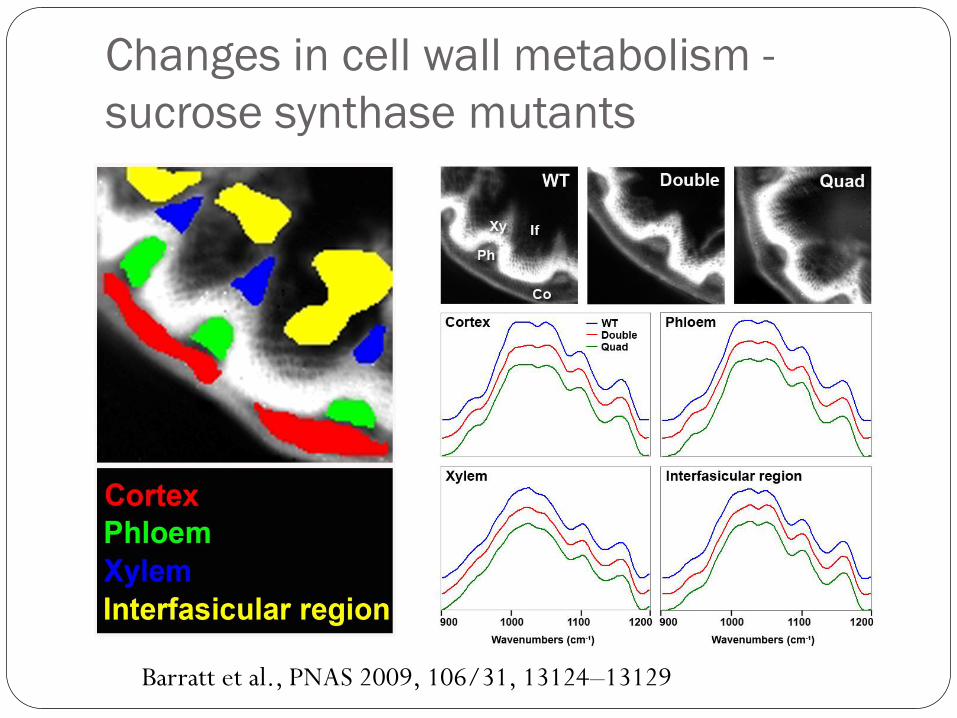
Changes in cell wall metabolism -
sucrose synthase mutants
Barratt et al., PNAS 2009, 106/31, 13124–13129
FTIR/Raman
State of molecules described by Schrödinger Equation HY = EY Born-Oppenheimer approximation separates
terms for electrons and nuclei , and also allows separation of the wave function into distinct components
Oscillator potential (symmetric/asymmetric) and energy levels
Interaction with light <y’’*|m|y’> FTIR Absorption depends on dipole moment
change
Raman scattering depends on polarisabilitytensor
Directional: strongest when parallel to electric vector of the incident light
(Source: Wikipedia)
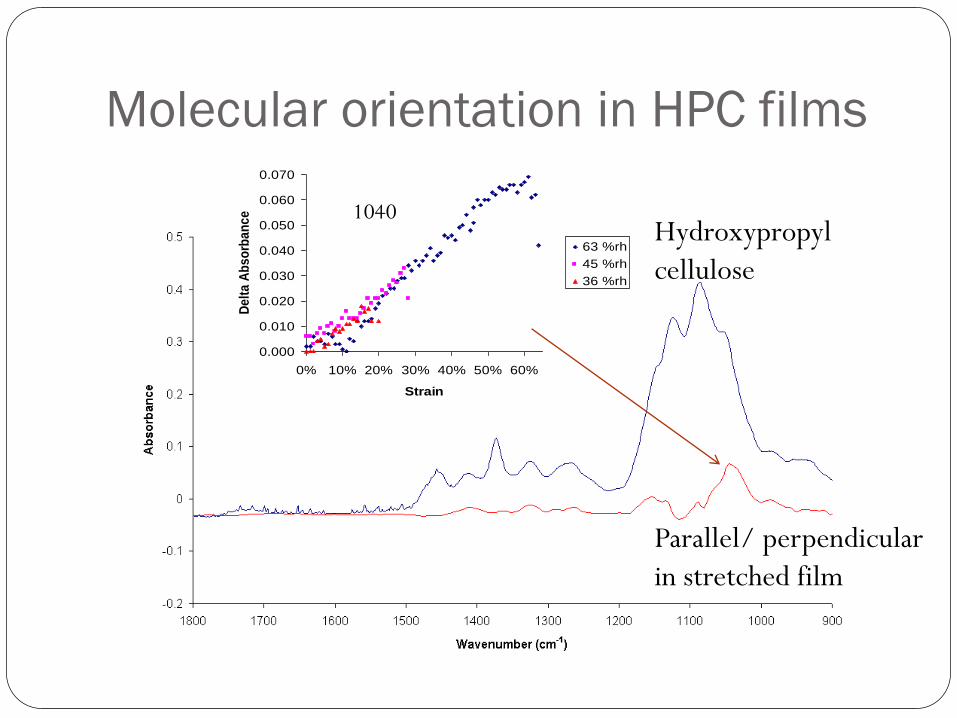
Molecular orientation in HPC films
0.000
0.010
0.020
0.030
0.040
0.050
0.060
0.070
0% 10% 20% 30% 40% 50% 60%
Strain
De
lta
Ab
so
rba
nc
e63 %rh
45 %rh
36 %rh
Hydroxypropyl
cellulose
Parallel/ perpendicular
in stretched film
1040
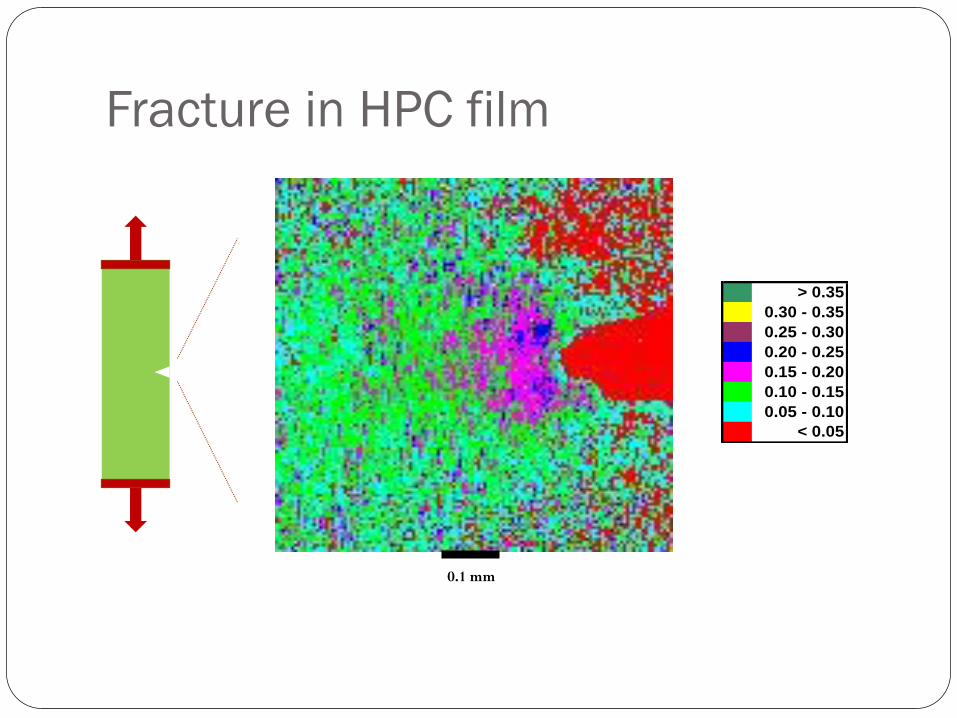
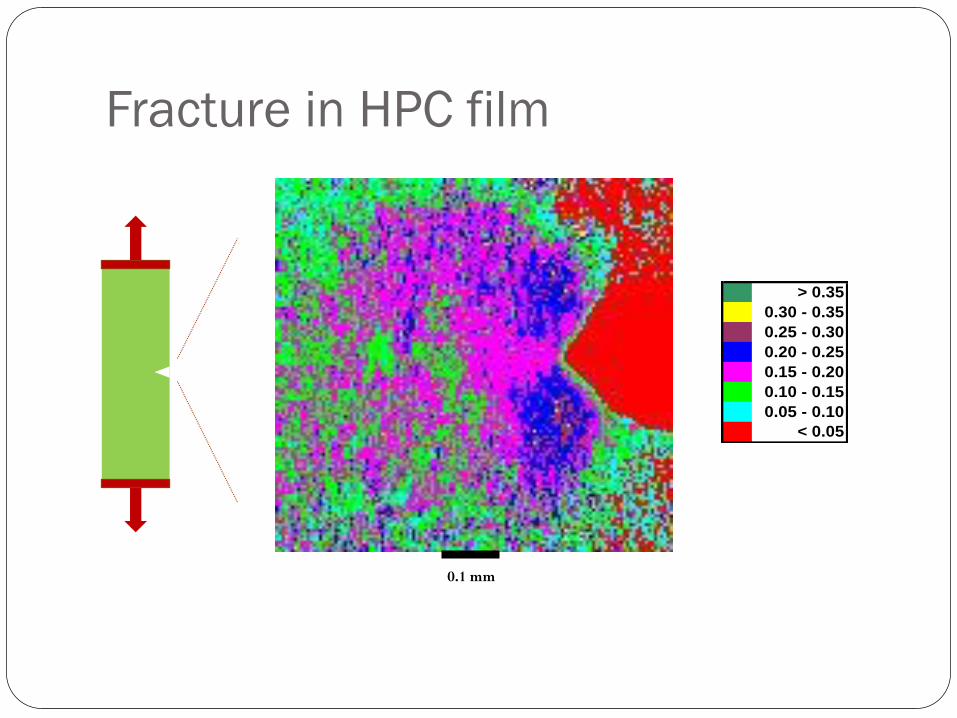
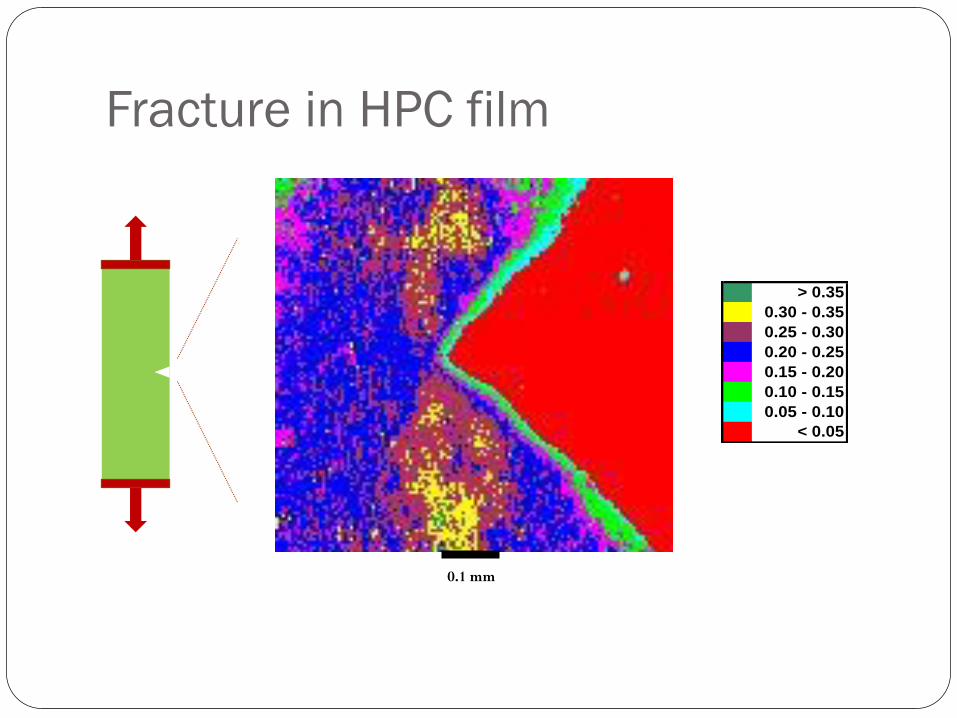
Fracture in HPC film
> 0.35
0.30 - 0.35
0.25 - 0.30
0.20 - 0.25
0.15 - 0.20
0.10 - 0.15
0.05 - 0.10
< 0.05
0.1 mm
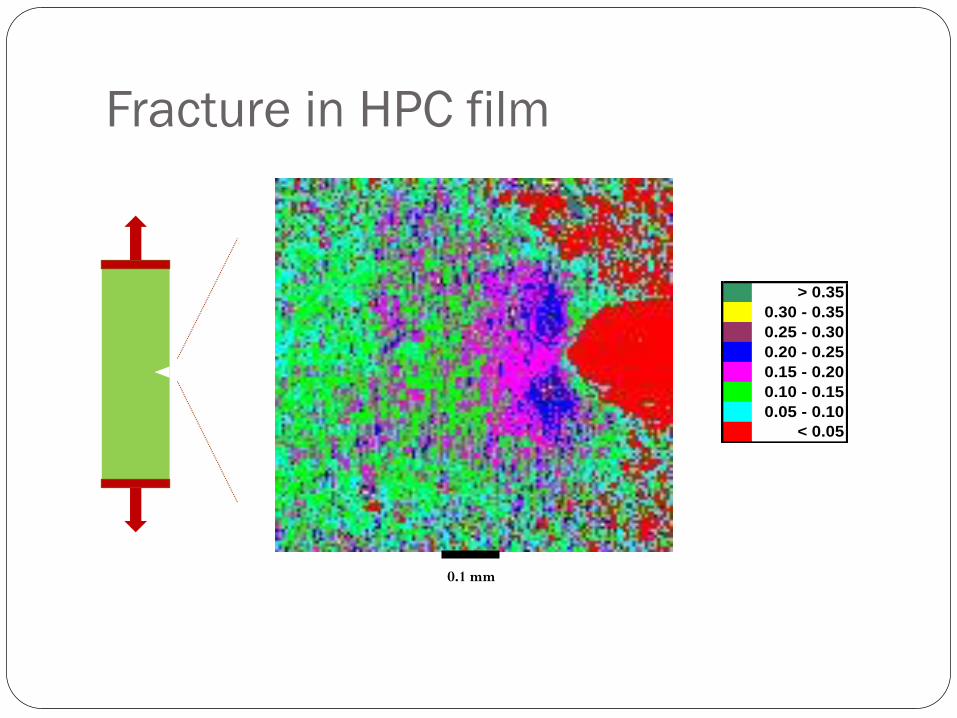
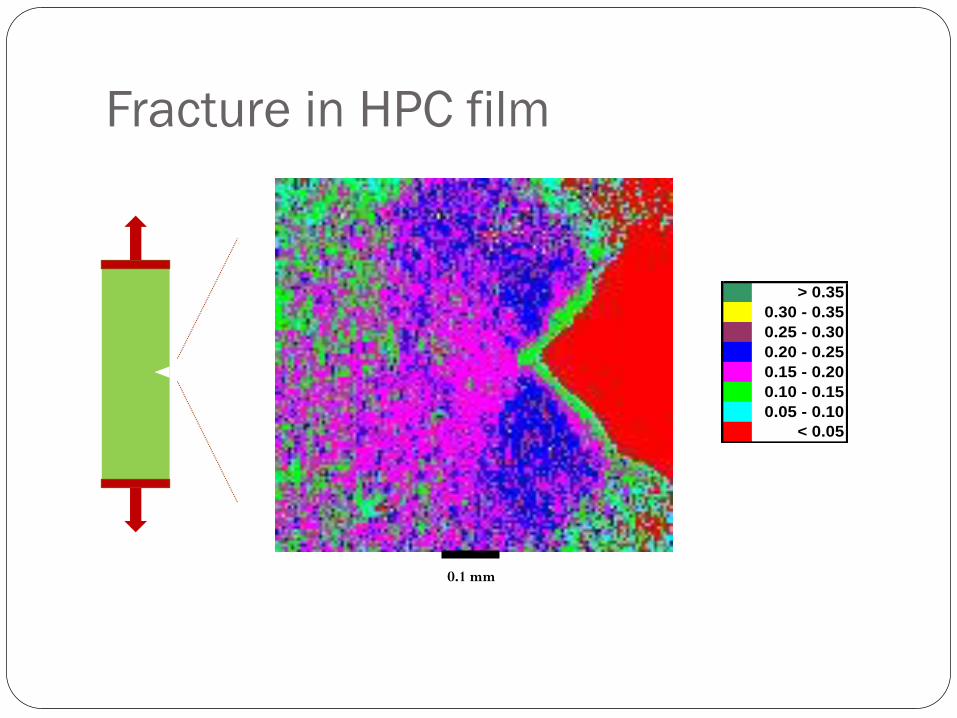
Fracture in HPC film
> 0.35
0.30 - 0.35
0.25 - 0.30
0.20 - 0.25
0.15 - 0.20
0.10 - 0.15
0.05 - 0.10
< 0.05
0.1 mm
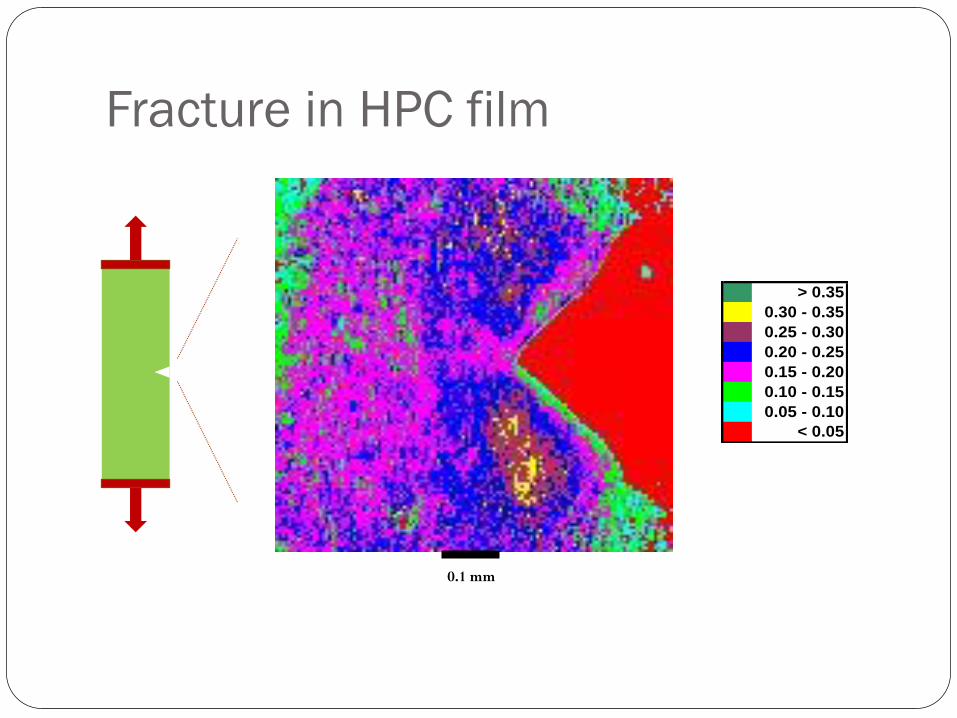
Fracture in HPC film
> 0.35
0.30 - 0.35
0.25 - 0.30
0.20 - 0.25
0.15 - 0.20
0.10 - 0.15
0.05 - 0.10
< 0.05
0.1 mm
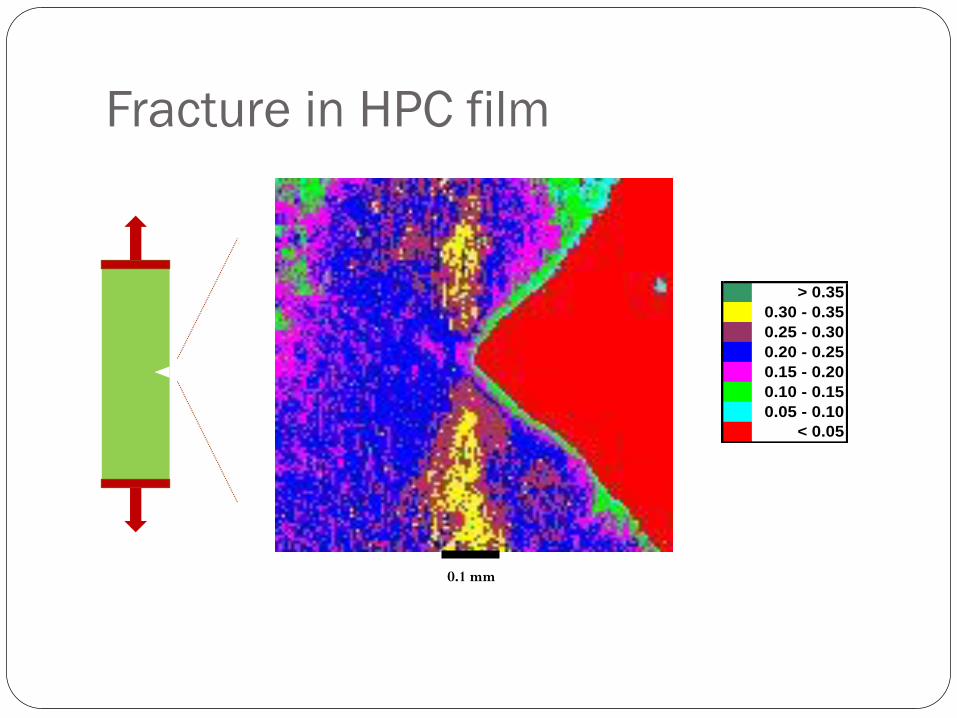
Fracture in HPC film
> 0.35
0.30 - 0.35
0.25 - 0.30
0.20 - 0.25
0.15 - 0.20
0.10 - 0.15
0.05 - 0.10
< 0.05
0.1 mm
Fracture in HPC film
> 0.35
0.30 - 0.35
0.25 - 0.30
0.20 - 0.25
0.15 - 0.20
0.10 - 0.15
0.05 - 0.10
< 0.05
0.1 mm
Fracture in HPC film
> 0.35
0.30 - 0.35
0.25 - 0.30
0.20 - 0.25
0.15 - 0.20
0.10 - 0.15
0.05 - 0.10
< 0.05
0.1 mm
Fracture in HPC film
> 0.35
0.30 - 0.35
0.25 - 0.30
0.20 - 0.25
0.15 - 0.20
0.10 - 0.15
0.05 - 0.10
< 0.05
0.1 mm
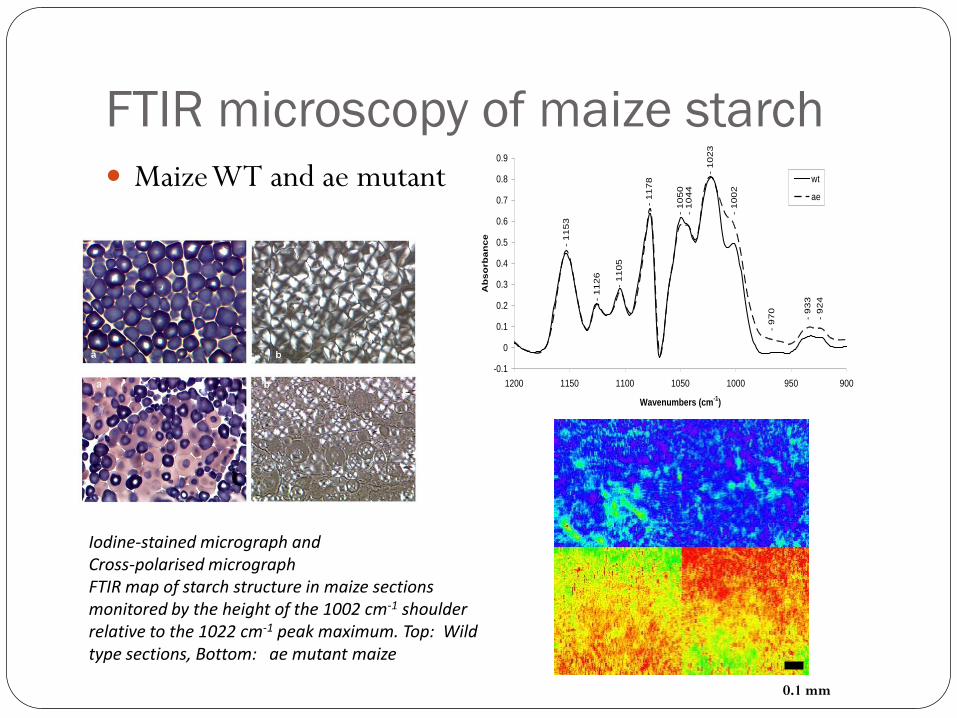
FTIR microscopy of maize starch
Maize WT and ae mutant
-0.1
0
0.1
0.2
0.3
0.4
0.5
0.6
0.7
0.8
0.9
90095010001050110011501200
Wavenumbers (cm-1
)
Ab
so
rb
an
ce
wt
ae
- 1
15
3
- 1
12
6
- 1
10
5
- 1
17
8
- 1
05
0-
10
44
- 1
02
3
- 1
00
2
- 9
33
- 9
24
- 9
70
Iodine-stained micrograph and Cross-polarised micrographFTIR map of starch structure in maize sections monitored by the height of the 1002 cm-1 shoulder relative to the 1022 cm-1 peak maximum. Top: Wild type sections, Bottom: ae mutant maize
0.1 mm
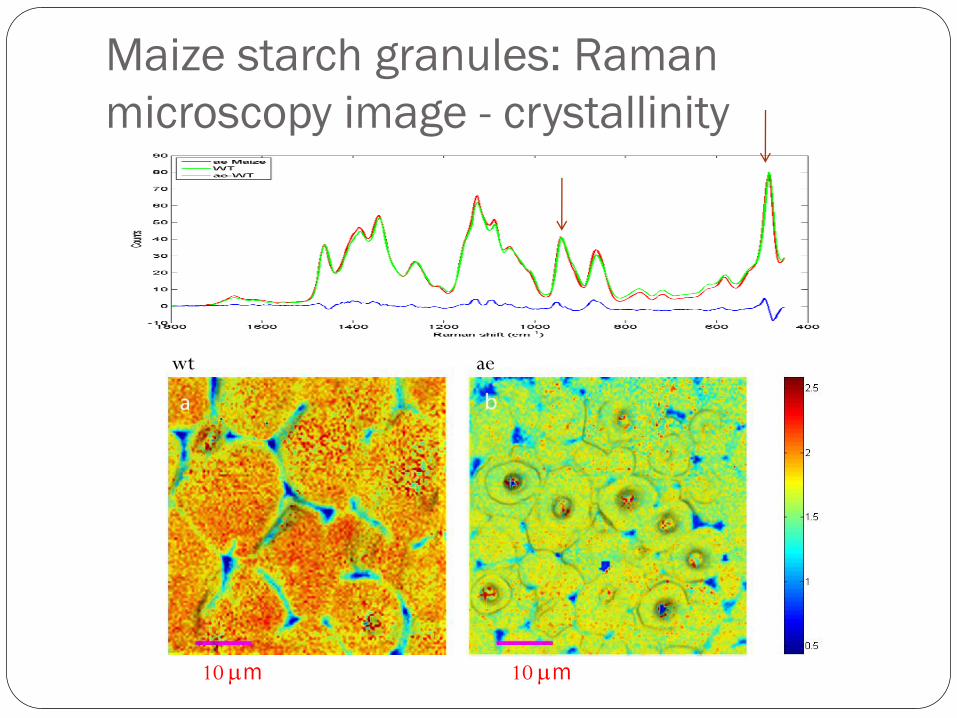
Maize starch granules: Raman
microscopy image - crystallinity
10 mm10 mm
wt ae
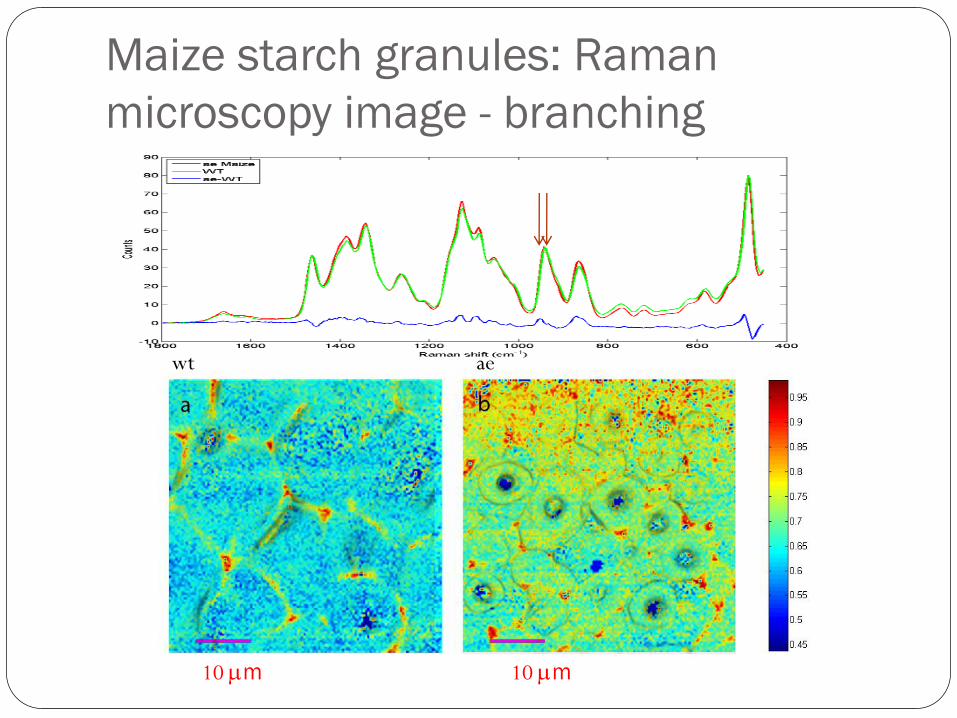
Maize starch granules: Raman
microscopy image - branching
10 mm10 mm
wt ae
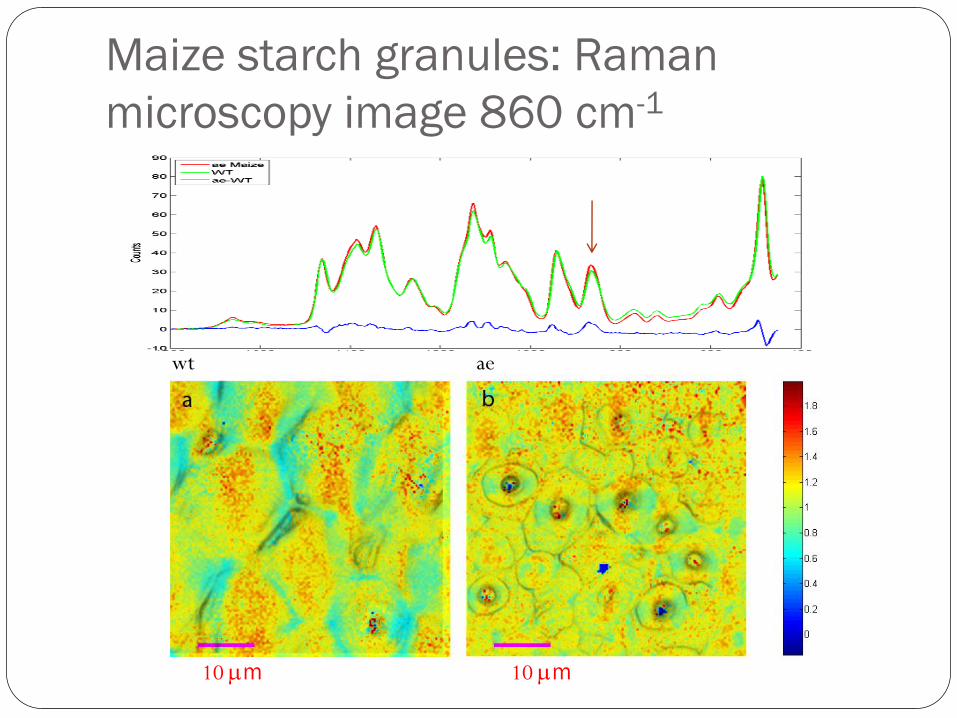
Maize starch granules: Raman
microscopy image 860 cm-1
10 mm10 mm
wt ae
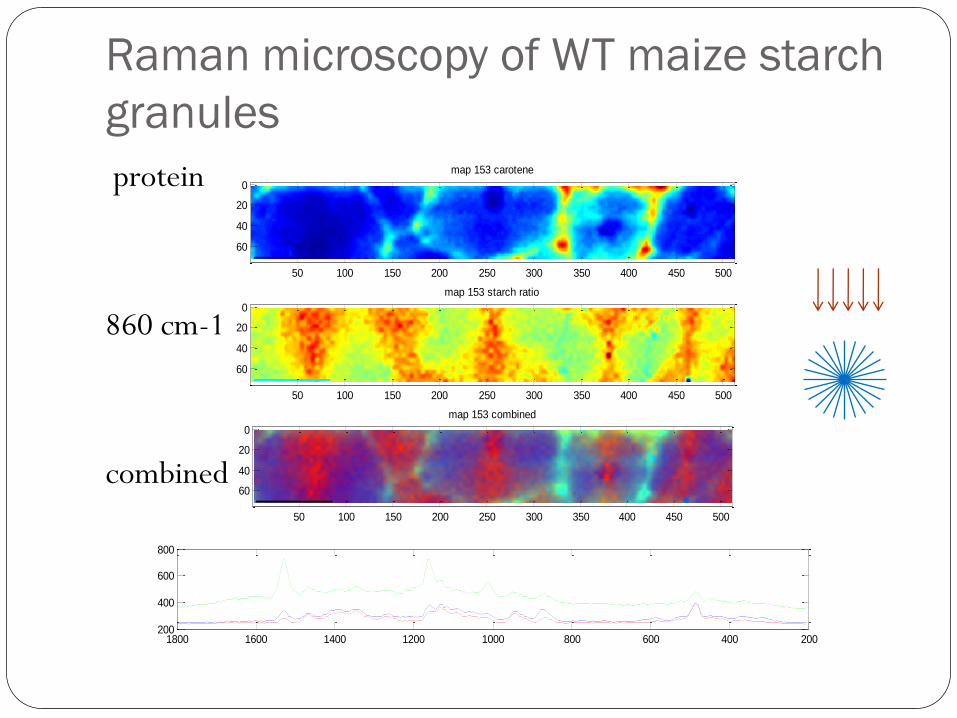
map 153 carotene
50 100 150 200 250 300 350 400 450 500
0
20
40
60
map 153 starch ratio
50 100 150 200 250 300 350 400 450 500
0
20
40
60
map 153 combined
50 100 150 200 250 300 350 400 450 500
0
20
40
60
20040060080010001200140016001800200
400
600
800
Raman microscopy of WT maize starch
granules
protein
860 cm-1
combined
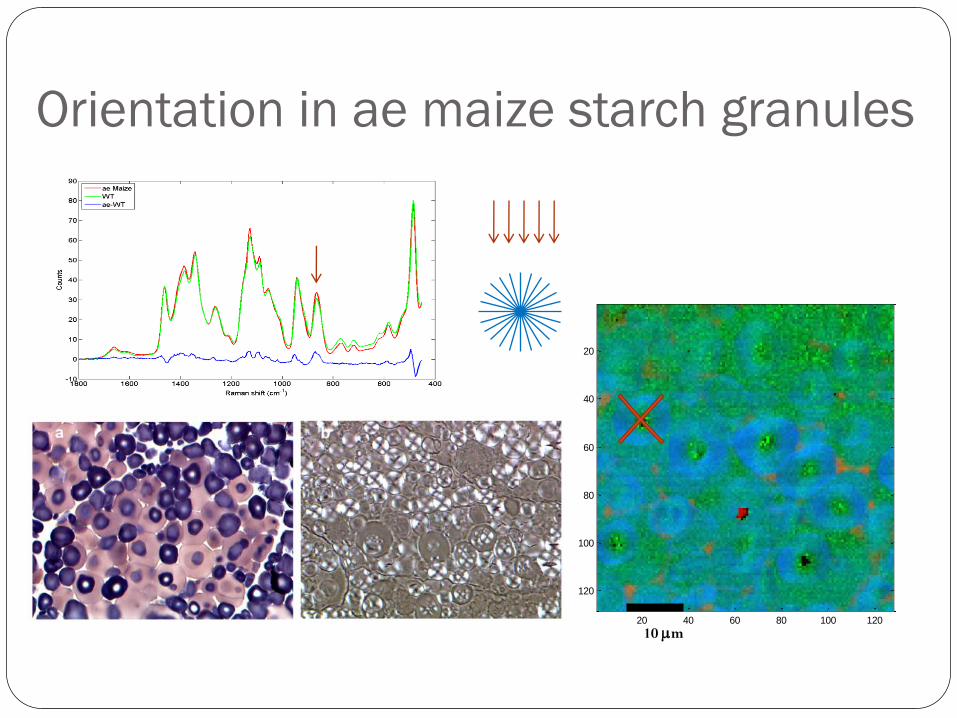
Orientation in ae maize starch granules
20 40 60 80 100 120
20
40
60
80
100
120
10 mm
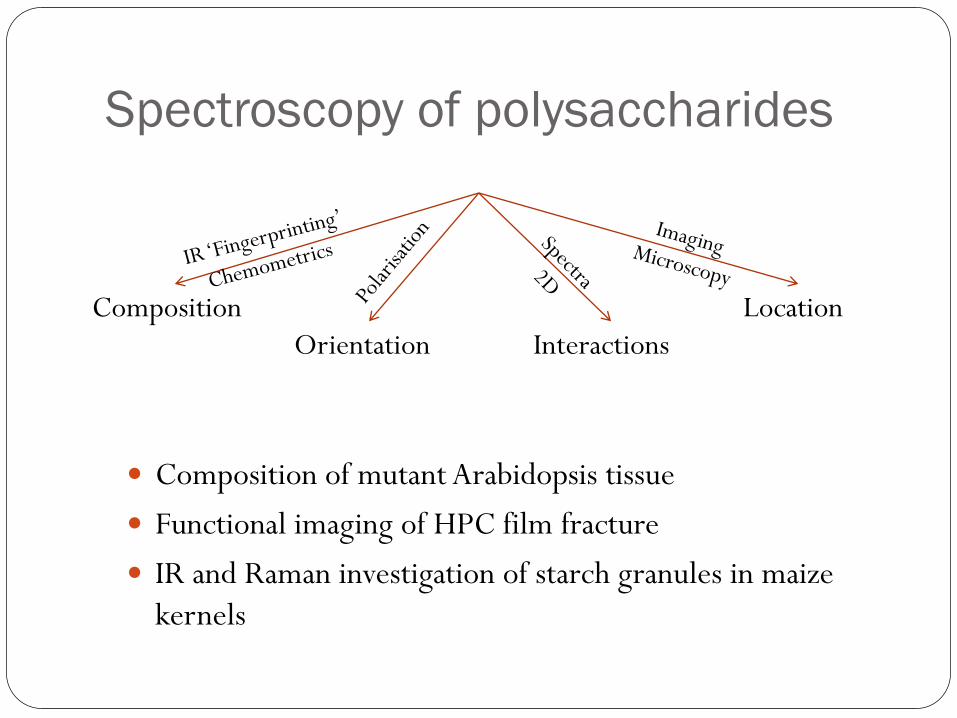
Spectroscopy of polysaccharides
Composition
Orientation Interactions
Location
Composition of mutant Arabidopsis tissue
Functional imaging of HPC film fracture
IR and Raman investigation of starch granules in maize
kernels

Thanks to …
IFR JIC
Mary Parker
Yuri Alexeev
Vic Morris
Reg Wilson
Paul Derbyshire
Alison Smith
And you!