Embed Size (px)
Citation preview

Vibration studies and on-site balancing of GT-1 assembly
Report No. DE/2009-10/125 Date: 21.9.2009
Page 1 of 32 Diagnostic Engineers
Fig-1 showing the bump test measurements made on exciter rear end. A predominant frequency at 220 Hz was seen in the spectrum

Vibration studies and on-site balancing of GT-1 assembly
Report No. DE/2009-10/125 Date: 21.9.2009
Page 2 of 32 Diagnostic Engineers
Fig-2 showing bump test measurements made on generator NDE fan blade showing predominant frequencies at 338 Hz and 414 Hz which are quite far away from operating speeds

Vibration studies and on-site balancing of GT-1 assembly
Report No. DE/2009-10/125 Date: 21.9.2009
Page 3 of 32 Diagnostic Engineers
Fig-3 showing bump test measurements made on generator NDE fan showing predominant frequencies at 414 Hz which are quite far away from operating speeds

Vibration studies and on-site balancing of GT-1 assembly
Report No. DE/2009-10/125 Date: 21.9.2009
Page 4 of 32 Diagnostic Engineers
The above snap showing the existing balancing correction mass provided initially by the manufacturer on the generator rear fan assembly

Vibration studies and on-site balancing of GT-1 assembly
Report No. DE/2009-10/125 Date: 21.9.2009
Page 5 of 32 Diagnostic Engineers
Picture-1
Picture-2
Picture-1 and 2 shows the mass correction provided on the exciter rear end. This might have been added on the exciter assembly during static balancing (slow speed balancing) at shop conditions.

Vibration studies and on-site balancing of GT-1 assembly
Report No. DE/2009-10/125 Date: 21.9.2009
Page 6 of 32 Diagnostic Engineers
The above snaps showing dial gauge being used on the low speed coupling to check the run outs and was found to be within limits. The above snap showing physical inspection of the outer surface of the low speed coupling which was carried out at site conditions
Vibration studies and on-site balancing of GT-1 assembly
Report No. DE/2009-10/125 Date: 21.9.2009
Page 7 of 32 Diagnostic Engineers
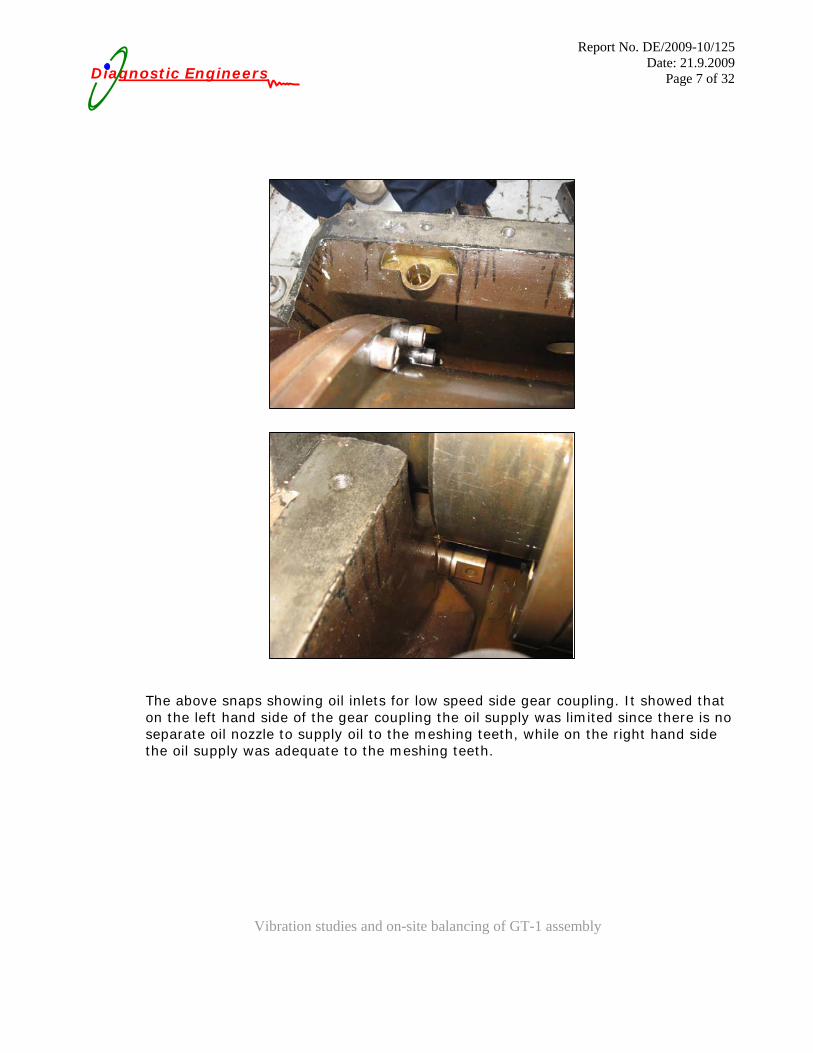
The above snaps showing oil inlets for low speed side gear coupling. It showed that on the left hand side of the gear coupling the oil supply was limited since there is no separate oil nozzle to supply oil to the meshing teeth, while on the right hand side the oil supply was adequate to the meshing teeth.

Vibration studies and on-site balancing of GT-1 assembly
Report No. DE/2009-10/125 Date: 21.9.2009
Page 8 of 32 Diagnostic Engineers
Table-1 showing overall vibration levels recorded on GT-1 train before and after balancing at no load
Horizontal Vertical Axial Location
Before After Before After Before After Turbine front 1.83 1.35 3.16 2.97 1.21 1.02 Turbine rear 4.33 3.77 3.49 3.35 2.56 2.08 Generator front 2.66 1.63 3.02 1.51 3.91 2.19 Generator rear 6.17 4.00 4.11 2.96 1.80 1.18 Table-2 showing vibration levels recorded on gearbox input and output bearing after balancing
Location Horizontal Vertical Axial Gearbox input 7.81 5.28 3.22 Gearbox output 6.22 6.44 1.76 Table-3 showing vibration levels recorded on Generator front and Generator Rear bearing after balancing and the set loaded to 12 MW
Location Horizontal Vertical Axial Gearbox input 3.89 1.47 2.62 Gearbox output 5.84 5.00 1.87
Comparative casing vibration levels of Turbine front before and after balancing
00.5
11.5
22.5
33.5
Horizontal Vertical Axial
Direction of measurement
Vib
rati
on
le
ve
ls in
m
m/
se
c R
MS
Before balancing
After balancing

Vibration studies and on-site balancing of GT-1 assembly
Report No. DE/2009-10/125 Date: 21.9.2009
Page 9 of 32 Diagnostic Engineers
Comparative casing vibration levels of Turbine rear before and after balancing
0
1
2
3
4
5
Horizontal Vertical Axial
Direction of measurement
Vib
rati
on
le
ve
ls in
m
m/
se
c R
MS
Before balancing
After balancing
Comparative casing vibration levels of Generator front before and after balancing
0
1
2
3
4
5
Horizontal Vertical Axial
Direction of measurement
Vib
rati
on
le
ve
ls in
m
m/
se
c R
MS
Before balancing
After balancing
Comparative casing vibration levels of Generator rear before and after balancing
01234567
Horizontal Vertical Axial
Direction of measurement
Vib
rati
on
le
ve
ls in
m
m/
se
c R
MS
Before balancing
After balancing

Vibration studies and on-site balancing of GT-1 assembly
Report No. DE/2009-10/125 Date: 21.9.2009
Page 10 of 32 Diagnostic Engineers
Fig-4 showing comparative frequency spectrum of turbine front in HVA direction after balancing, all vibrations are in mm/sec RMS
Axial
Horizontal
Vertical
Vibration studies and on-site balancing of GT-1 assembly
Report No. DE/2009-10/125 Date: 21.9.2009
Page 11 of 32 Diagnostic Engineers
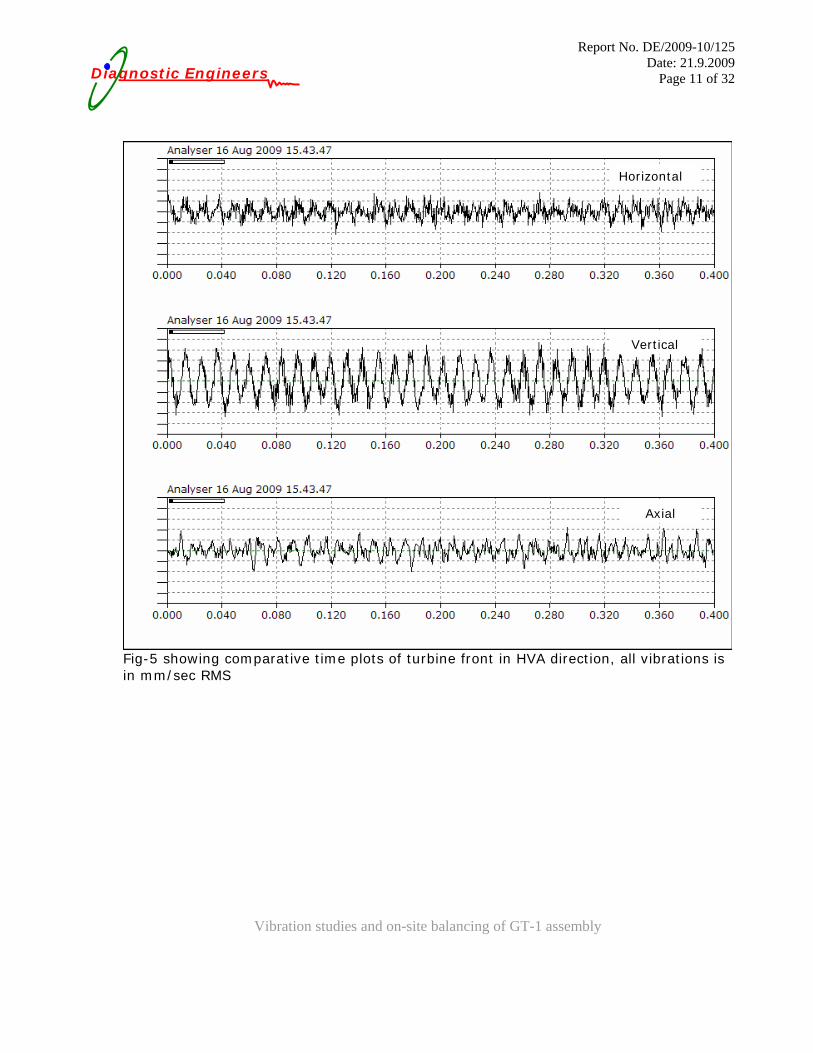
Fig-5 showing comparative time plots of turbine front in HVA direction, all vibrations is in mm/sec RMS
Axial
Horizontal
Vertical
Vibration studies and on-site balancing of GT-1 assembly
Report No. DE/2009-10/125 Date: 21.9.2009
Page 12 of 32 Diagnostic Engineers
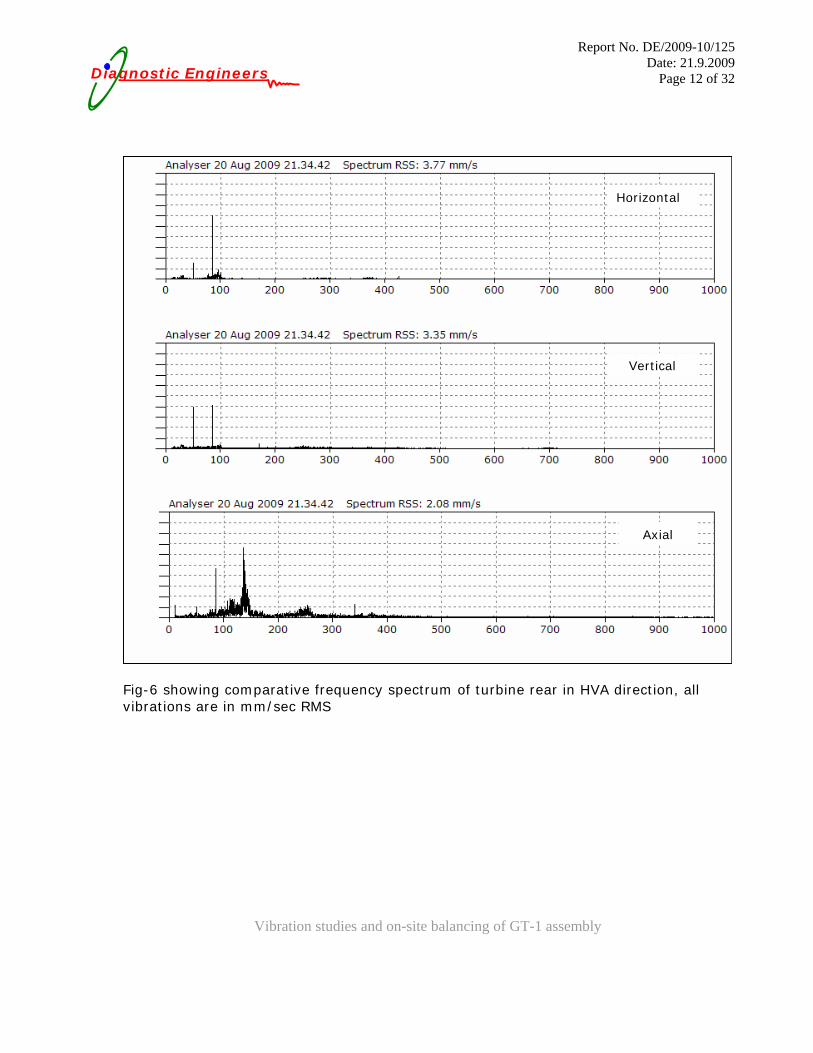
Fig-6 showing comparative frequency spectrum of turbine rear in HVA direction, all vibrations are in mm/sec RMS
Axial
Horizontal
Vertical

Vibration studies and on-site balancing of GT-1 assembly
Report No. DE/2009-10/125 Date: 21.9.2009
Page 13 of 32 Diagnostic Engineers
Fig-7 showing comparative frequency spectrum of gearbox input in HVA direction, all vibrations are in mm/sec RMS
Axial
Horizontal
Vertical

Vibration studies and on-site balancing of GT-1 assembly
Report No. DE/2009-10/125 Date: 21.9.2009
Page 14 of 32 Diagnostic Engineers
Fig-8 showing comparative frequency spectrum of gearbox output in HVA direction, all vibrations is in mm/sec RMS
Axial
Horizontal
Vertical

Vibration studies and on-site balancing of GT-1 assembly
Report No. DE/2009-10/125 Date: 21.9.2009
Page 15 of 32 Diagnostic Engineers
Fig-9 showing comparative frequency spectrum of generator front in horizontal direction before and after balancing, all vibrations are in mm/sec RMS
Before Balancing
After Balancing

Vibration studies and on-site balancing of GT-1 assembly
Report No. DE/2009-10/125 Date: 21.9.2009
Page 16 of 32 Diagnostic Engineers
Fig-10 showing comparative frequency spectrum of generator front in vertical direction before and after balancing, all vibrations are in mm/sec RMS
After Balancing
Before Balancing

Vibration studies and on-site balancing of GT-1 assembly
Report No. DE/2009-10/125 Date: 21.9.2009
Page 17 of 32 Diagnostic Engineers
Fig-11 showing comparative frequency spectrum of generator front in axial direction before and after balancing, all vibrations are in mm/sec RMS
After Balancing
Before Balancing

Vibration studies and on-site balancing of GT-1 assembly
Report No. DE/2009-10/125 Date: 21.9.2009
Page 18 of 32 Diagnostic Engineers
Fig-12 showing comparative frequency spectrum of generator rear in horizontal direction before and after balancing, all vibrations are in mm/sec RMS
After Balancing
Before Balancing

Vibration studies and on-site balancing of GT-1 assembly
Report No. DE/2009-10/125 Date: 21.9.2009
Page 19 of 32 Diagnostic Engineers
Fig-13 showing comparative frequency spectrum of generator rear in vertical direction before and after balancing, all vibrations are in mm/sec RMS
After Balancing
Before Balancing

Vibration studies and on-site balancing of GT-1 assembly
Report No. DE/2009-10/125 Date: 21.9.2009
Page 20 of 32 Diagnostic Engineers
Fig-14 showing comparative frequency spectrum of generator rear in axial direction before and after balancing, all vibrations are in mm/sec RMS
After Balancing
Before Balancing

Vibration studies and on-site balancing of GT-1 assembly
Report No. DE/2009-10/125 Date: 21.9.2009
Page 21 of 32 Diagnostic Engineers
Fig-15 showing comparative frequency spectrum of generator front bearing in HVA directions after balancing and at 12 MW load
Axial
Horizontal
Vertical

Vibration studies and on-site balancing of GT-1 assembly
Report No. DE/2009-10/125 Date: 21.9.2009
Page 22 of 32 Diagnostic Engineers
Fig-16 showing comparative frequency spectrum of generator rear bearing in HVA directions after balancing and at 12 MW load
Axial
Horizontal
Vertical

Vibration studies and on-site balancing of GT-1 assembly
Report No. DE/2009-10/125 Date: 21.9.2009
Page 23 of 32 Diagnostic Engineers
On-site balancing protocol: The above snap showing the correction mass of 154 gm was added at 55 deg on the Generator front in the direction of rotating from the reflecting sticker which is being the 0 deg reference. It was ensured that all the allen bolts with split mass was tightened with metal lock.
1. A 2-plane balancing was attempted on the generator assembly by taking generator front as plane-1 and generator rear as plane-2
2. Based on the correction mass as shown by the balancing software a correction mass of 550 gm at 355 deg was added on generator front fan assembly and 300 gm at 55 deg on generator rear fan assembly
3. The train was rolled to FSNL, but there was increase in vibrations on generator front.
4. Hence a calculated mass of 154 gm was added on generator front at 55 deg while the above masses were removed
5. With 154 gm there was a considerable decrease in vibration levels on both generator front and rear in HVA directions and hence this mass was retained on the assembly

Vibration studies and on-site balancing of GT-1 assembly
Report No. DE/2009-10/125 Date: 21.9.2009
Page 24 of 32 Diagnostic Engineers
Comparison of panel vibration readings with DI 440 FFT analyser The above snap showing the vibration junction box from where the vibration readings were recorded. The settings of DI 440 were made as per the parameters shown on the panel box Frequency band width: 2-2000 Hz Sensitivity: 200 mv/unit Measuring parameter: ‘Peak’ Table-4 showing comparative vibration levels recorded directly from the vibration panel and also from DI 440 FFT vibration analyzer, GT-1 at FSNL
Turbine front Turbine rear Gen front Gen rear All vibrations are in inch/sec (ips), pk
Panel 0.21 0.08 0.22 0.26 DI 440 0.166 0.067 0.21 0.184
All vibrations are in mm/sec, pk Panel 5.7 2.2 5.7 6.8
DI 440 4.16 1.59 5.32 4.62 All vibrations are in mm/sec, RMS
DI 440 3.03 1.12 3.94 3.21

Vibration studies and on-site balancing of GT-1 assembly
Report No. DE/2009-10/125 Date: 21.9.2009
Page 25 of 32 Diagnostic Engineers
Comparative vibration levels recorded from the vibration panel and DI 440 FFT analyser
0
2
4
6
8
Turbine front Turbine rear Gen front Gen rear
Bearing locations
Vib
rati
on
le
ve
ls in
m
m/
se
c P
ea
k
Panel
DI 440
Comparative vibration levels recorded from the vibration panel and DI 440 FFT analyser
00.050.1
0.150.2
0.250.3
Turbine front Turbine rear Gen front Gen rear
Bearing locations
Vib
rati
on
le
ve
ls in
in
ch
/se
c P
ea
k
Panel
DI 440
Vibration studies and on-site balancing of GT-1 assembly
Report No. DE/2009-10/125 Date: 21.9.2009
Page 26 of 32 Diagnostic Engineers
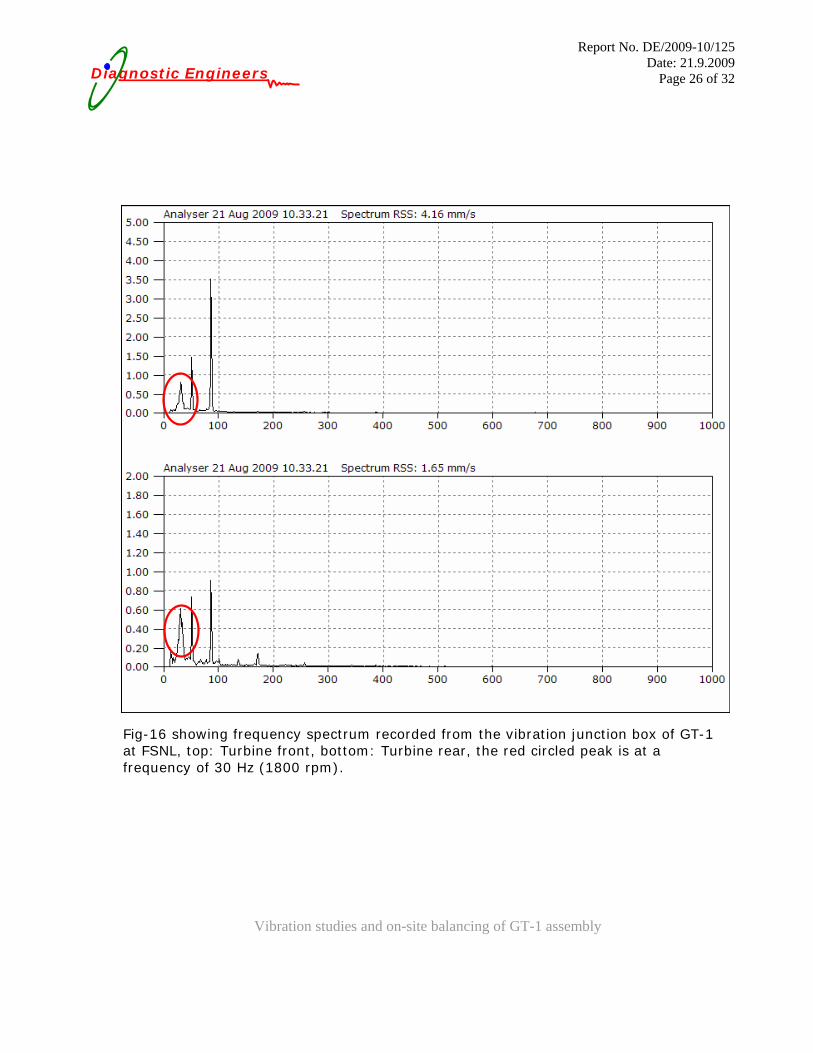
Fig-16 showing frequency spectrum recorded from the vibration junction box of GT-1 at FSNL, top: Turbine front, bottom: Turbine rear, the red circled peak is at a frequency of 30 Hz (1800 rpm).

Vibration studies and on-site balancing of GT-1 assembly
Report No. DE/2009-10/125 Date: 21.9.2009
Page 27 of 32 Diagnostic Engineers
Fig-17 showing frequency spectrum recorded from the vibration junction box of GT-1 at FSNL, top: Gen front, bottom: Gen rear, the red circled peak is at a frequency of 15 Hz (900 rpm). Also this 15 Hz frequency was not seen on the Gen rear data.

Vibration studies and on-site balancing of GT-1 assembly
Report No. DE/2009-10/125 Date: 21.9.2009
Page 28 of 32 Diagnostic Engineers
High temperatures in the Gen front and Gen rear bearing assembly area The above snap showing the poor ventilation and it is suspected that the hot air may have a churning action heating the generator front bearing as well as the vibration probe assembly It is recommended to have a better cooling system for the generator rear bearing assembly area as here also the hot air is being circulated during full speed which may be over heating the vibration probe. Needs to be studied.

Vibration studies and on-site balancing of GT-1 assembly
Report No. DE/2009-10/125 Date: 21.9.2009
Page 29 of 32 Diagnostic Engineers
Observations and Conclusive Remarks:
1. The vibration levels recorded from the vibration panel was high as compared to the data recorded using DI 440 FFT vibration analyzer.
2. All the vibration probes mounted on the train needs calibration 3. Inspection and replacement of electronic vibration panels if required 4. All the couplings can be changed to diaphragm flexible couplings for better
reliability and maintenance free operation 5. For the time being it is recommended to check the physical condition of the gear
coupling for any dust accumulation or muck formation or deposits 6. Based on the trend data from the panel 960 rpm is the generator critical speed,
2000 rpm is the turbine rotor critical speed 7. The mass addition effected on the generator front fan assembly for the purpose
of unbalance correction should not be altered in any manner. Doing so would alter the balance quality achieved.
8. Any change / alteration in the rotating mass of the generator front fan assembly will change the balance quality achieved.
9. The temperatures at generator front and rear are very high and due to this the vibration probe is misbehaving. Proper exhaust facility is to be provided for hot air coming out of generator. It is recommended to design a chimney or exhaust fan, or copy the cooling system of the GT-2.
10.It is recommended to inspect the thermal insulation of the gas turbine exhaust. 11.It is preferable to have new vibration probes which can withstand at least 150 to
200 deg temperatures. 12.A portable handheld vibration meter is recommended to take frequent
measurements. Model will be selected and recommended shortly to BAFA. 13.It was observed that there is no any mechanical issues as such for the generator
front or rear vibrations to reach 25 or 27 mm/sec as the vibration data from DI 440 were recorded at this location several times which showed no higher vibrations
14.If the spikes still exist before replacing the probes, for the time being it is advisable to disconnect generator bearing probes and take periodic measurements with handheld equipment till the system gets established to avoid unwanted trips.
15.As such with these defects, the machine cannot run with unpredictable trips due to high temperature.
16. The spectrums recorded from the vibration panel box from turbine front and rear showed 1800 rpm (30 Hz) and from generator front showed 900 rpm (15 Hz) frequency components. Mostly likely it is attributed for temperatures or probe fixing related issues. However, if the critical speeds of the respective machines happen to be these components, it will appear if there may be rotating looseness.

Vibration studies and on-site balancing of GT-1 assembly
Report No. DE/2009-10/125 Date: 21.9.2009
Page 30 of 32 Diagnostic Engineers
17. After taking care of all other corrections, if still this appears, it is advisable to check the health of rotating components and their fitment. For such investigations, detailed rotor dynamic calculations will help.
18. Several failures were recorded earlier at other gas turbine sites. Failures were seen on first two stage blades because of location problems like sea coast.
19. Hence to reduce the extensive damage it is better to install probes near to the tip of the blade to monitor blade crack growth so that the equipment can be stopped and the damaged blade can be replaced to avoid further secondary damages.
20. Whenever there is an opportunity it is advisable to carry out natural frequency tests on all blades to prepare a document and check the structural integrity
21. It is advisable to take each component and prepare manufacturing drawings of all important components like bearings, couplings etc.
22. A few balance masses that can be fit into the fan slot of generator front and rear assembly are to be made ready for any field balancing activity in future.
23. It can be in the range of 20, 30, 40, 50 and 60 gm.
>>>>BAFA<<<<