Embed Size (px)
Citation preview

Vibration of the steel frame of the primary sand classifier
Josef Soukup1,*
, Blanka Skočilasová1, Jan Skočilas
2
1Faculty of Production Technology and Management, J. E. Purkyne University in Usti nad Labem.
Pasteurova 3334/7, 400 96 Usti nad Labem. Czech Republic 2Czech Technical University in Prague, Faculty of Mechanical Engineering, Department of Process
Engineering, Technická 4, 166 07 Praha 6, Czech Republic
Abstract. Article deals with the presentation of measurement that have been carried
out on the steel frame of the primary sand classifier. The aim of the investigation was
to identify the sources of the abnormal vibration of the frame. The vibration
significantly reduces the effective performance of the classifier. The frame anchorage
has been stripped out from concrete footing by these vibrations. The measurement of
dynamic properties of the frame were performed. The displacements of the particular
trusses have been experimentally investigated by accelerometers. The tensile test were
performed in the places of expected maximum amplitude of the vibration. Based on
the experiment results and new design calculation of the steel frame (truss
construction), the new construction design was developed and improved by frame
reinforcing. The new designed construction was investigated by vibration
measurements again. The acceleration and total amplitude of particular trusses were
recorded. The steel construction of the supporting frame has frequencies in range from
13.07 to 13.10 Hz. The significant enhancement of the noise and vibration of the main
bearing have been observed during the classifier operation. The system of precautions
was proposed to improve operation of the classifier and after realization the classifier
run with no limitation.
Keywords: vibration, frame, acceleration, steel structures
1 Introduction
The reduction of the maximum amplitude of the vibration of the rigid construction and
related noise is an optimization process which can be solved by several methods, e.g.
experimental or numerical [1]. The improvement of the measuring methods or developing
new methods of measurement allows to obtain more detailed or high accuracy information
about investigated systems [2 - 4]. For the numerical simulation the actual common
methods are used for investigation of the dynamic system, e.g. SEM or FEM [5]. The
nowadays dynamic system observation has been based on classical approach of
identification of the modal parameters of the system [6]. By increasing the computing
capabilities, the new algorithms of numerical methods were developed, e.g. OKID [7],
* Corresponding author: [email protected]
Reviewers: Robert Grega, Ján Vavro Jr.

MLK [8] or FDD [9]. But usually the customer needs the analysis and improvement of the
system in very short period. In such cases there is no time for numerical study and its
validation. Therefore this study is pure experimental and arises from preliminary analysis
[10]. From measurements the new design construction is proposed and validated its positive
effect on the noise and vibration reduction.
The technological line for exploited gravel sand treatment consists of two vibrating
classifiers, a coarse (with sand washer) and fine one; the screens are fitted with the
respective conveying routes (belt conveyors). The gravel sand is exploited from water using
a chain-bucket dredger, conveyed by the belt conveyor to the technical facility of the sand
pit where the above-mentioned classifiers and aggregate yards are located.
The excavated gravel sand is conveyed by the 800 mm wide and 40 m long belt
conveyor to a METSO CVB 2661 III spraying coarse vibrating classifier; the sand then
travels from the classifier to a two-shaft knife washer. Big rocks are conveyed from the
classifier to the rock crusher, from where the crushed rocks return to the coarse classifier,
non-crushed rocks are sorted and stored for other purposes. The sand is conveyed from the
coarse classifier by a steep 650 mm wide and 27 mm long conveyor to another METSO
CVB 2050 III spraying vibrating classifier (not subject of the design) that classifies the
sand to the individual fractions, storing them in the sand year by fraction.
In operation, the coarse classifier makes high vibrations, which are transmitted by the steel
structure to the foundations and further to its surroundings. Vibrations are caused by the
crusher itself; high structural deviations reducing durability of the classifier bearings.
The facility operator requested the measurement of the steel structure and casing and
mechanism vibrations of the coarse classifier.
The steel structure is anchored to the reinforced-concrete foundation slab. Drawing
documentation of the reinforced-concrete slab was not provided. According to the investor
and findings noted in the submitted technical documentation, the reinforced-concrete slab is
1,000 mm thick, anchoring axes of supporting posts are spaced in the longitudinal direction
at 4,800 mm and 3,900 mm, the total span between the end posts is 8,700 mm. Anchoring
axes of the posts in the transversal direction are spaced at 3,230 mm, the post base is 400
mm wide, total anchoring width is 3,630 mm (total foundation slab width in transversal
direction is 4,200 mm). The steel structure scheme is shown in Figure 1.
Fig. 1. Classifier steel structure scheme Fig. 2. View of the classifier
The classifier supporting structure consists of 6 posts with transversal and longitudinal
spokes. The classifier is placed on longitudinal spokes. A gallery is attached to the consoles
around the classifier (on spokes). The walkway floor is made from floor grids; the
walkways and gallery are fitted with railing. Posts have foundation slabs, anchored to the
foundation using pasted-in HILTI M30 anchors (effective anchoring depth is 270 mm). The
posts are made from HEB 240 profile (classifier installation); the main longitudinal spokes

from profile HEB 240, HEA 160, U 240, U 200. Post height in longitudinal direction (3
posts) varies. Post 1 (the longest one) is 6,574 mm long, post 2 (the middle one) is 5,018
mm long, post 3 is 4,780 mm long.
The main longitudinal spoke is a welded assembly of 3 parts, welded from HEA 240
profile. The oblique part (according to placement on posts) is 6.147 mm long, 2 pieces (one
from each side) made from HEA 240 profile with the length of 1,938 mm are welded to it
(free bearing on the tallest post) and 2,990 mm in case of the shortest post. Welding is
missing in the support area (in the centre of the post); the posts are missing in area of the
classifier supports. The steel structure is made of S235 galvanised steel.
Empty coarse classifier placed on the steel structure weighs 12,640 kg, material inside
the classifier weighs 1,500 to 2,000 kg (depends on the filling of the classifier).
2 Methodology
Regarding the fact that during the first assessment, the steel structure displayed design
errors, the requirements for steel structure completion were not met, particularly the
requirements for completing nodal points, completing transversal spatial reinforcements,
spatial dimensioning (too narrow structure), insufficient dimensions of foundation slam,
etc.
Sub-base in the area of the classifier steel structure contains an approx. 1 m layer of
floury soil with gravel sand underneath with the thickness of as much as 12 m and the
underground water level reaches as high as to the floury soil (almost to the surface in the
areal of the borrow pit). As the steel structure vibrations are transmitted to the
surroundings, it was not possible to directly measure the steel structure deviations.
The measurement methodology has been processed, dividing the measurements into 3
stages. In stage 1, an indicative measurement of acceleration on one web was conducted,
based on which the acceleration measurement methodology was drafted. This indicative
measurement provided the initial information about the steel structure vibrations, in
particular, about the frequency and dominating direction of oscillation. It was determined
that the steel structure oscillation frequency is 13 Hz in constant operation of the classifier,
the main oscillation direction is along the transversal axis. The frequency of the frame
resonance was identified during the classifier deceleration and fixed at 10 Hz. Regarding
the fact that the classier driving motor speed cannot be adjusted, it is impossible to state
with certainty that the frequency of 13 Hz is the frequency of resonance.
Fig. 3. Location of the 3-axis acceleration sensor Fig. 4. Time progression of deviation

Based on the above-mentioned
measurement, a more detailed measurement
was subsequently conducted, using
Brül&Kjaer three-axis (4506 type, 2 pcs)
and single-axis (4507 B004 type, 2 pcs)
accelerometers with a PULSE (6/1)
analyser, type 3560 C.
A reference accelerometer was installed
on the rear post to measure acceleration
along the axis. Another 3 accelerometers
were relocated during the classifier steel
structure measurement as required.
Effective deviation values (RMS) were
recorded, including their spectrum and wave
shape. Maximum deviations occurred at the
frequency of 13 Hz.
Another step was strain measurement.
The measurement was conducted using
HBM strain gauges, type 1-LY11-10/20,
with an active length of 10 mm, resistance
of 120 , application of Z70 bonding agent. Fig. 5. Acceleration (shift) measurement model
This measurement was used to determine the steel structure oscillation frequency of
13.1 Hz (FFT analysis which indicates whether it is the dominating frequency), maximum
stress range 17.92 MPa. In terms of strength, the structure is compliant, which is normal in
such situations.
These measurements indicate that the steel structure is a little rigid in the horizontal
plane (x, z axes) and it was recommended to reinforce the structure.
Regarding the fact that it was impossible to prepare a brand new design of the steel
structure for operating and economic reasons, we did the new (static and dynamic)
calculation and proposed a design adjustment.
The steel structure supplier performed internal reinforcement of the structure by
inserting diagonal reinforcements in the structure (Figure 6). However, the reinforcement
was performed inconsistently with the recommendation, conditions for lattice work were
not met, nodal points were not created, etc. This introduced torsional and bending stress to
the structure.
3 Experimental examination of reinforced steel structure
Acceleration values at selected points were measured on the reinforced steel structure.
Deviations were then determined by integration (the direct determination of deviations was
impossible to perform due to vibrations in the surroundings). For purposes of acceleration
measurement, points between the steel structure nodes were selected so that shifts can be
determined in the next step if it turns out to be meaningful (for eventual further
specification of results). Acceleration in the selected points was measured in dependence on
movement of the classifier (identical time axis). Measurement was conducted using 7
single-axis acceleration sensors, of which one was always installed on the classifier. The
other 6 sensors were installed in various points on the steel structure (see the respective
figures of the layout in the text to follow). There were 6 measurements conducted
(according to layout of sensors), each measurement for 3 conditions of classifier operation
a) classifier start-up (marked x-1),

b) operation with material (marked x-2),
c) machine deceleration without material (marked x-3),
where x is the sequence number of measurement (from 1 to 6). The individual sensors are
numbered from 0 to 6. Measurement time was fixed at 20 seconds. Measurement was
conducted with the use of:
- Type HBM B12/200acceleration sensors, serial No. 51587, 073810245, 073810249,
073810242, 52918, 110410320, 104810051. All sensors have been calibrated
- measuring AD card NI 6225, serial No. 121B821 (HA 4198431) – calibrated
- standard laptop.
Figures 6 and 7 show positioning of acceleration sensors in 2 measurement cases (cases 1
and 6)
Fig.6. Reinforced steel structure scheme
Location of acceleration sensors –
measurement 1
Fig. 7.Reinforced steel structure scheme
Location of acceleration sensors —
measurement 6
Loading forces of the steel structure from the classifier were determined based on
maximum and minimum values of acceleration
F = m.a (1)
where F – force [N], m – mass [kg], a – acceleration [ms-1
].
The forces were determined in both the horizontal direction (x, y) and in vertical the
direction (z), where the vertical acceleration values were measured (measurements 4, 5 and
6). The forces were determined based on the amount of the raw material in the classifier,
which was determined from the classifier output. Weight during operation with material is
based on the line output (1,000 t.hour-1
i.e. about 0.3 t.s-1
). The gravel sand holding time in
the classifier is about 5-6 seconds.
The graphical acceleration presentation (Figures 8-10) only includes a part of the
measured values, however, they always include the critical section. They show the
acceleration trend for sensors 0 and 1 according to Figure 6. This is acceleration along the x
axis on the same web in different heights from the foundation (the distance from the
foundation and upper web end is shown in Figure 6).
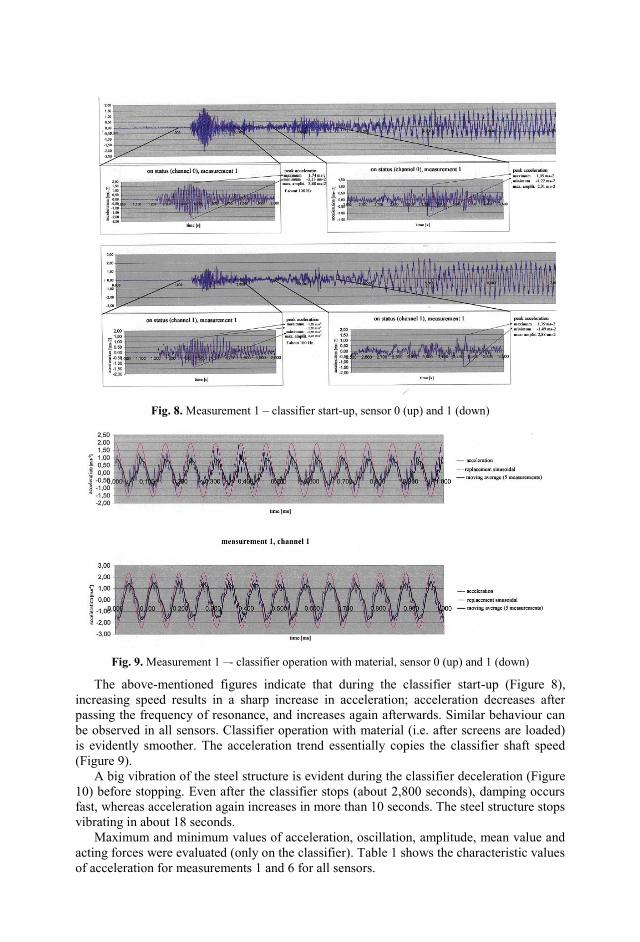
Fig. 8. Measurement 1 – classifier start-up, sensor 0 (up) and 1 (down)
Fig. 9. Measurement 1 –- classifier operation with material, sensor 0 (up) and 1 (down)
The above-mentioned figures indicate that during the classifier start-up (Figure 8),
increasing speed results in a sharp increase in acceleration; acceleration decreases after
passing the frequency of resonance, and increases again afterwards. Similar behaviour can
be observed in all sensors. Classifier operation with material (i.e. after screens are loaded)
is evidently smoother. The acceleration trend essentially copies the classifier shaft speed
(Figure 9).
A big vibration of the steel structure is evident during the classifier deceleration (Figure
10) before stopping. Even after the classifier stops (about 2,800 seconds), damping occurs
fast, whereas acceleration again increases in more than 10 seconds. The steel structure stops
vibrating in about 18 seconds.
Maximum and minimum values of acceleration, oscillation, amplitude, mean value and
acting forces were evaluated (only on the classifier). Table 1 shows the characteristic values
of acceleration for measurements 1 and 6 for all sensors.

Fig. 10. Measurement 1, classifier deceleration Sensors 0 (up) and 1 (down)
Table 1. Acceleration values of the individual sensors in measurements 1 and 6
Acceleration Unit Sensor
0 1 2 3 4 5 6
Measurement 1
Classifier start-up (without material) interval 1.0-2.0 seconds
amax m.s-2 1.74 1.58 1.17 0.82 1.93 2.57 3.11
amin m.s-2 2.13 1.36 1.19 -0.85 -1.25 -2.44 -3.67
Classifier operation with material interval 0.0-1.0 second
amax m.s-2 1.85 2.09 0.32 2.28 1.90 2.11 29.94
amin m.s-2 -1.16 -2.05 -3.27 -1.71 -2.14 -1.79 -30.68
Classifier deceleration interval 3.0-5.0 seconds
amax m.s-2 0.83 1.30 1.44 1.49 1.40 3.30 *
amin m.s-2 -1.09 -1.04 -1.50 -1.75 -1.70 3.49
Measurement 6
Classifier start-up (without material) interval 0.0-2.0 seconds
amax m.s-2 3.28 0.79 1.84 4.52 0.20 1.23 1.40
amin m.s-2 -3.08 -0.75 -1.74 -6.64 -0.17 -0.87 -1.20
Classifier operation with material interval 0.0-1.0 second
amax m.s-2 47.11 0.94 3.01 1.46 0.51 1.33 42.12
amin m.s-2 -42.91 -1.25 -3.62 -1.99 -0.31 -0.97 -41.03

Table 1. (continued)
Acceleration Unit Sensor
0 1 2 3 4 5 6
Classifier deceleration interval 4.0-5.0 seconds
amax m.s-2 10.15 0.96 0.91 0.79 0.21 0.67 17.25
amin m.s-2 -9.61 -0.88 -1.61 -0.71 -0.23 -0.65 -12.96
amax – maximum acceleration value
amin – minimum acceleration value
The acceleration trend on sensors 2 (transversal acceleration of classifier casing) and 3
(vertical acceleration in classifier placement on supporting steel structure under silent-
blocks) is shown in Figures 11-13.
Fig. 11. Measurement 6 – classifier start-up, sensor 2 (up) and 3 (down)
Fig. 12. Measurement 6 – with material, sensor 2 (up) and 3 (down)
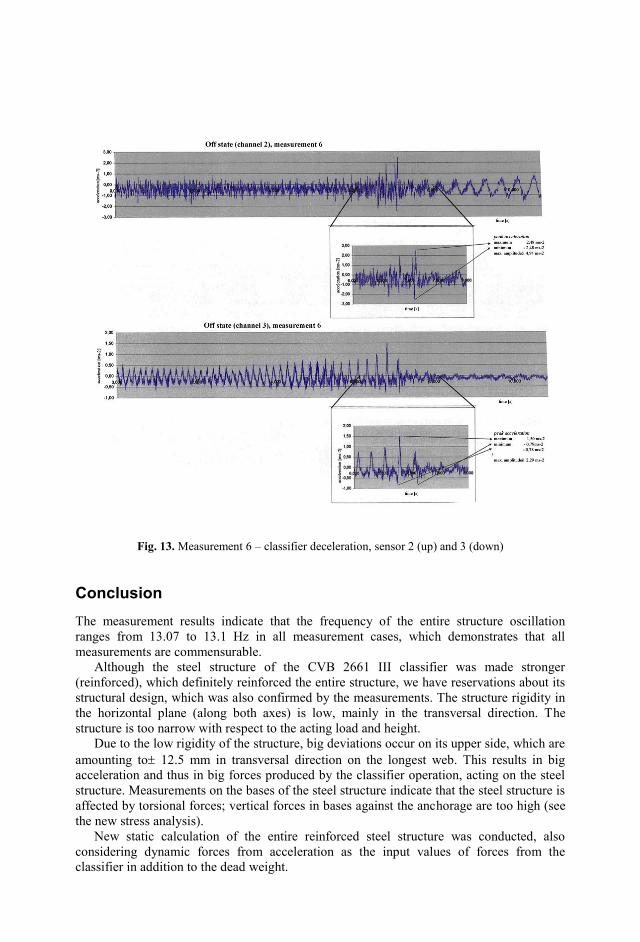
Fig. 13. Measurement 6 – classifier deceleration, sensor 2 (up) and 3 (down)
Conclusion
The measurement results indicate that the frequency of the entire structure oscillation
ranges from 13.07 to 13.1 Hz in all measurement cases, which demonstrates that all
measurements are commensurable.
Although the steel structure of the CVB 2661 III classifier was made stronger
(reinforced), which definitely reinforced the entire structure, we have reservations about its
structural design, which was also confirmed by the measurements. The structure rigidity in
the horizontal plane (along both axes) is low, mainly in the transversal direction. The
structure is too narrow with respect to the acting load and height.
Due to the low rigidity of the structure, big deviations occur on its upper side, which are
amounting to 12.5 mm in transversal direction on the longest web. This results in big
acceleration and thus in big forces produced by the classifier operation, acting on the steel
structure. Measurements on the bases of the steel structure indicate that the steel structure is
affected by torsional forces; vertical forces in bases against the anchorage are too high (see
the new stress analysis).
New static calculation of the entire reinforced steel structure was conducted, also
considering dynamic forces from acceleration as the input values of forces from the
classifier in addition to the dead weight.

This new calculation indicates that the steel structure is compliant in terms of strength;
however, the structure deflection is not compliant. This is the reason why it was
recommended to refit all internal reinforcements of the steel structure according to the
original proposal (create nodal points) and design the steel structure reinforcement from the
outside. This will require the foundation slab to be expanded for purposes of brace
anchoring.
Insufficient rigidity of the steel structure and thus high values of vibrations result in the
limited durability of the main shaft bearings of the coarse gravel sand classifier.
References
1. V. Wowk, Machinery vibration: measurement and analysis. Boston: McGraw-Hill,
358 p., ISBN 0-07-071936-5, (1991)
2. S. P. Hyo, P. Keunhyoung, K. Yousok, W. Ch. Se, Deformation Monitoring of a
Building Structure Using a Motion Capture System. IEEE/ASME Transactions on
Mechatronics 20 (5), 2276-2284 (2014)
3. T. U. Yılmaz, U. O. Özugurel, K. Bulut, M. N. Inci, Vibration amplitude analysis with
a single frame using a structured light pattern of a four-core optical fibre. Optics
Communications 249 (4–6), 515-522 (2005)
4. D. Zhu, J. Guo, Ch. Cho, Y. Wang, K. Lee, Wireless Mobile Sensor Network for the
System Identification of a Space Frame Bridge. IEEE/ASME Transactions on
Mechatronics 17 (3), 499-507 (2012)
5. S. L. Zuo, F. M. Li, Ch. Zhang, Numerical and experimental investigations on the
vibration band-gap properties of periodic rigid frame structures. Acta Mechanica 227
(6), 1653-1669 (2016)
6. G. Fraraccioa, A. Bruggerb, R. Bettic, Experimental studies on damage detection in
frame structures using vibration measurements. Shock and Vibration 17, 697-721
(2010)
7. J. N. Juang, M. Phan, L. G. Horta, R.W. Longman, Identification of Observer/Kalman
FilterMarkov Parameters: Theory and Experiments. Journal of Guidance, Control, and
Dynamics 2, 320–329 (1993)
8. R. Brincker, L. Zhang, P. Andersen, Modal identification of output-only systems using
frequency domain decomposition. Smart Material and Structure 10, 441–445 (2001)
9. M. De Angelis, H. Lus, R. Betti, R. W. Longman, Extracting Physical Parameters of
Mechanical Models From Identified State Space Representations. Journal of Applied
Mechanics 69, 617–625 (2002)
10. B. Skočilasová, J. Volek, J. Soukup, Report on Steel Structure Experimental
Examination Results. Ústí n. L., (2009)