Embed Size (px)
Citation preview

VIA E-MAIL ndash Rule-CommentsSECgov
November 10 2015
Secretary Securities and Exchange Commission 100 F Street NE Washington DC 20549-1090
RE File Number SR-FINRA-2015-036 Notice of Filing of a Proposed Rule Change to Amend FINRA Rule 4210 (Margin Requirements) to Establish Margin Requirements for the TBA Market
Dear SirMadam
Over the past several days I have spoken with a number of affected parties and come across additional information such that I would like to amend my earlier comments and addreiterate the following
1) Newly issued GNMA and FNMA Mortgage Backed Securities (MBS) for multifamily and healthcare facilities are not of a scale to cause systemic risk The MBA prepared the attached (Attachment 1) showing in 2014 there was $32B of FNMA multifamily MBS issuance In comparison there was $376B of single family issuance FNMA MBS In 2014 GNMA issued $18B of MBS securities for multifamily and healthcare facilities and $296B for single family MBS Newly issued Multifamily and Healthcare MBS totaled $50B and constitutes just 74 of this combined MBS market
2) While both SF and MFHC GNMA and FNMA MBS are forward deliveries MFHC MBS are much different than SF MBS MFHC MBS represent one distinct property for which the MBS is issued The MFHC MBS has already been extensively underwritten (in terms of the ownersprincipals as well as the property itself) Due diligence on the property used in underwriting includes commercial appraisals environmental assessments engineering assessments intrusive studies architectural drawings etc These materials are costly and can total anywhere between $50000 - $500000 In addition a good faith deposit has been collect from the borrower and forwarded to the brokerdealer at the time of rate lock Owners and lenders have aligned interests with the brokerdealer to close on the transaction The only way the Owner will be able to be reimbursed for their out of pocket costs for these due diligence costs and to receive the good faith rate lock deposit back from the brokerdealer is to close on the transaction Likewise the only way the lender will collect their fee is to close on the transaction If the Borrower wanted to back out of the transaction once the rate is locked with the brokerdealer they would have to start the loan application process over again ndash a process that can take anywhere between 6-12 months or longer to accomplish They simply would not be willing to do that if rates dropped even significantly between rate lock and delivery of the GNMA MBS Furthermore the Lender cannot back out of the trade without incurring liquidated damages which are a standard provision in any rate lock agreement and damage to their reputation within the brokedealer community Since there are only 50 approved MF GNMA issuers and an equally limited number of brokerdealers that trade these securities any bad faith on the part of the lenderissuer will prevent them from accessing future funding and effectively put them out of business In the Single Family MBS market trades are based upon prospective transactions that have not been completed yet and there is no initial or maintenance margin collected as in the MFHC
Forest City Capital Corporation bull 50 Public Square Suite 1170 bull Cleveland Ohio 44113-2267 (216) 621-6060 bull Fax (216) 263-6207 bull wwwforestcitynet
MBS market
3) There is also extensive oversight of the FHA Lender and GNMA Issuer by both HUD and GNMA Both agencies require annual audited financial statements and require minimum net worth and liquidity based on servicing volumes Lenders portfolios are carefully monitored and if they demonstrate poor performance HUD and GNMA can and will take steps to curtail the lenders activity
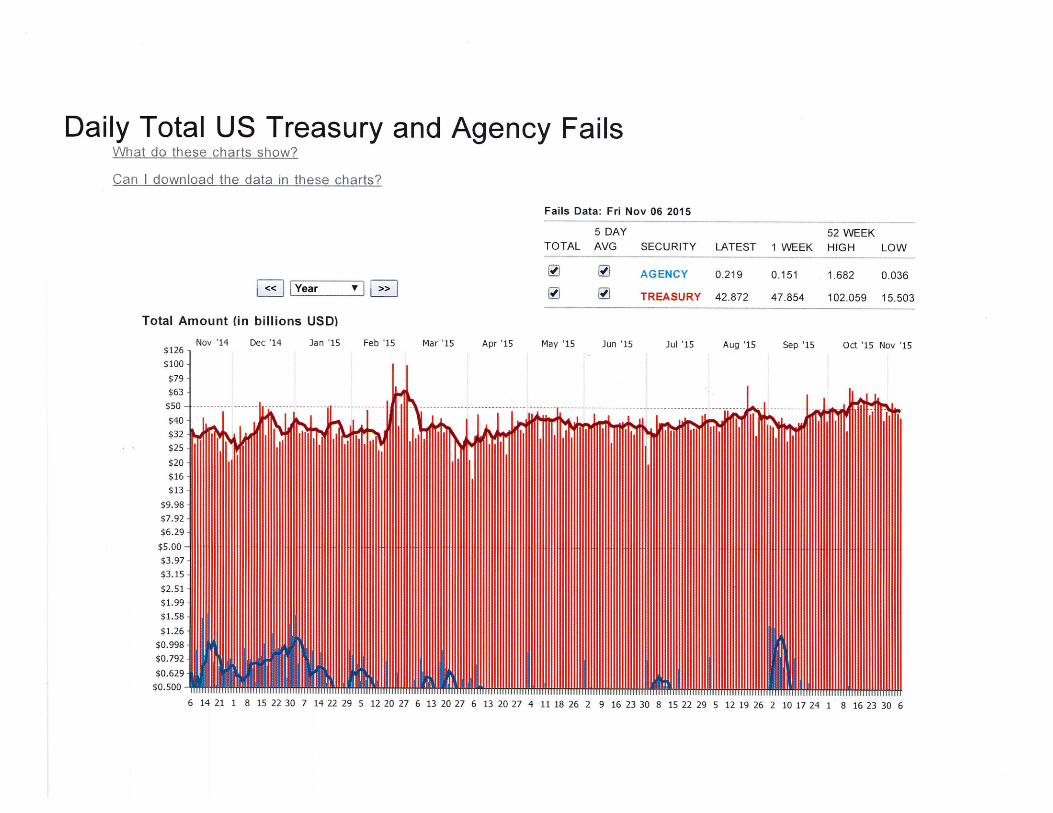
4) I was made aware of daily Treasury and MBS failure data available at Depository Trust Clearing Corporation (DTCC) and was surprised to see the large volume of daily trades that fail to deliver - over $50B of US Treasuries and as much as $15B ofMBS see Attachment 2 Presumably this is what the proposed rule is intending to impact If so you will find no argument from me However I would suggest that a further examination is necessary so as to determine the participants and reasons for these failures I and many other multifamily lenders suspect that this failure data reflects trades among large financial institutions who are using these securities for hedging purposes and findthemselves in a position where they must settle their trades but don t have access to the securities pledged I am certain that if one looks closely at this data one will not find any newly issued MFHC GNMA or FNMA MBS Indeed the proposed rule admitted that the TRACE data that was reviewed did not provide sufficient detail to answer these questions As a regulating body it is imperative that the regulations do not encompass innocent bystanders who are not contributing to this serious issue
5) Lastly I would ask the SEC and FINRA staff to carefully examine the proposed rule s impact on small lenders and borrowers Many of the smaller lenders and borrowers operate in secondary and tertiary markets and will not have access to low cost capital to meet margin requirements as proposed Even if smaller lenders and borrowers are successful in arranging for a line of credit to meet margin requirements it will come at a cost and may very well not be available at times of market stress - exactly when the need for margining will be at its highest While not an academic I did find the Gibson and Muawski 2007 paper The Price of Protection Derivatives Default Risk and Margining to make a compelling argument along these lines and concluded Capturing some of the main characteristics of derivatives markets we identify situations where margining may increase default risk while reducing welfare This the case in particular when collateral is scarce such as during periods of market stress
Again we certainly understand the need to take steps that reduce the likihood of another financial crisis and avoiding the economic damage this can wreak on the economy We believe the robust measures we have in place along with the size of the newly issued MFHC MBS market do not pose a systemic risk to the financial markets We are eager to engage in thoughtful dialogue with FINRA staff to ensure that the proposed rule is well crafted to address this underlying concern without inadvertently disrupting the multifamily and healthcare facilities market Thank you again for your consideration of these comments
Sincerely
FOREST CITY CAPITAL CORPORATION
~~ Tony Love Vice President
2014 Fannie Mae And Freddie Mac Issuance of Single-family MBS and Fannie Mae Issuance of Multifamily MBS ($billions)
700
600
500
400
300
200
100
0 Sing le-family MBS Multifamily MBS
bull Single-family MBS- Fannie Mae bull Sing le-family MBS- Freddie Mac
bull Multifamily MBS - Fannie Mae
ISource Fannie Mae and Freddie Mac Annual Reports Fannie Mae Single-family Fannie Mae MBS issuances Freddie Mac Issuance - Single-family credit guarantees (Includes conversions of previously issued other guarantee 1 commitments into Freddie Mac mortgage-related securities) Multifamily Fannie Mae MBS issuances (Reflects unpaid MBaprincipal balance of multifamily Fannie Mae MBS issued during the period)
Daily Total US Treasury and Agency Fails What do these charts show
Can I download the data in these charts
Fails Data Fri Nov 06 2015
5 DAY 52 WEEK TOTAL AVG SECURITY LATEST 1 WEEK HIGH LOW
~ ~ AGENCY 0219 0151 1682 0036 B l vear TIG 0 0 TREASURY 42872 47 854 102059 15503
Total Amount (in billions USO)
Nov 14 Dec 14 Jan 15 Feb 15 Mar 15 Apr 15 May 15 Jun 15 Jul 15 Aug 15 Sep 15 Oct 15 Nov 15 $199
6 14 21 1 8 15 22 30 7 14 22 29 5 12 20 27 6 13 20 27 6 13 20 27 4 11 18 26 2 9 16 23 30 8 15 22 29 5 12 19 26 2 10 17 24 1 8 16 23 30 6
Daily Total US Treasury and Agency Fails What do these charts show
Can I download the data in these charts
Fails Data Fri Nov 06 2015
5 DAY TOTAL AVG SECURITY LATEST 1 WEEK
52 WEEK HIGH LOW
B __IY_e_ar___shy__I G Total Amount (in billions USO)
$126
$100
$79
$63
$50
$40
$32
$25
$20
$16
$13
$998
$792
$629
$500
$397
$315
$251
$199
$158
$126
$0998
$0792
Nov 14 Dec 14 Jan 15 Feb 15 Mar 15 Apr 15
~
~
May 15
~
~
Jun 15
AGENCY
TREASURY
Jul 15
0219
42 872
Aug 15
0151
47 854
Sep 15
1682
102059
Oct 15
0036
15503
Nov 15
$0500
6 14 21 1 8 15 22 30 7 14 22 29 5 12 20 27 6 13 20 27 6 13 20 27 4 11 18 26 2 9 16 23 30 8 15 22 29 5 12 19 26 2 10 17 24 1 8 16 23 30 6

MBS market
3) There is also extensive oversight of the FHA Lender and GNMA Issuer by both HUD and GNMA Both agencies require annual audited financial statements and require minimum net worth and liquidity based on servicing volumes Lenders portfolios are carefully monitored and if they demonstrate poor performance HUD and GNMA can and will take steps to curtail the lenders activity
4) I was made aware of daily Treasury and MBS failure data available at Depository Trust Clearing Corporation (DTCC) and was surprised to see the large volume of daily trades that fail to deliver - over $50B of US Treasuries and as much as $15B ofMBS see Attachment 2 Presumably this is what the proposed rule is intending to impact If so you will find no argument from me However I would suggest that a further examination is necessary so as to determine the participants and reasons for these failures I and many other multifamily lenders suspect that this failure data reflects trades among large financial institutions who are using these securities for hedging purposes and findthemselves in a position where they must settle their trades but don t have access to the securities pledged I am certain that if one looks closely at this data one will not find any newly issued MFHC GNMA or FNMA MBS Indeed the proposed rule admitted that the TRACE data that was reviewed did not provide sufficient detail to answer these questions As a regulating body it is imperative that the regulations do not encompass innocent bystanders who are not contributing to this serious issue
5) Lastly I would ask the SEC and FINRA staff to carefully examine the proposed rule s impact on small lenders and borrowers Many of the smaller lenders and borrowers operate in secondary and tertiary markets and will not have access to low cost capital to meet margin requirements as proposed Even if smaller lenders and borrowers are successful in arranging for a line of credit to meet margin requirements it will come at a cost and may very well not be available at times of market stress - exactly when the need for margining will be at its highest While not an academic I did find the Gibson and Muawski 2007 paper The Price of Protection Derivatives Default Risk and Margining to make a compelling argument along these lines and concluded Capturing some of the main characteristics of derivatives markets we identify situations where margining may increase default risk while reducing welfare This the case in particular when collateral is scarce such as during periods of market stress
Again we certainly understand the need to take steps that reduce the likihood of another financial crisis and avoiding the economic damage this can wreak on the economy We believe the robust measures we have in place along with the size of the newly issued MFHC MBS market do not pose a systemic risk to the financial markets We are eager to engage in thoughtful dialogue with FINRA staff to ensure that the proposed rule is well crafted to address this underlying concern without inadvertently disrupting the multifamily and healthcare facilities market Thank you again for your consideration of these comments
Sincerely
FOREST CITY CAPITAL CORPORATION
~~ Tony Love Vice President
2014 Fannie Mae And Freddie Mac Issuance of Single-family MBS and Fannie Mae Issuance of Multifamily MBS ($billions)
700
600
500
400
300
200
100
0 Sing le-family MBS Multifamily MBS
bull Single-family MBS- Fannie Mae bull Sing le-family MBS- Freddie Mac
bull Multifamily MBS - Fannie Mae
ISource Fannie Mae and Freddie Mac Annual Reports Fannie Mae Single-family Fannie Mae MBS issuances Freddie Mac Issuance - Single-family credit guarantees (Includes conversions of previously issued other guarantee 1 commitments into Freddie Mac mortgage-related securities) Multifamily Fannie Mae MBS issuances (Reflects unpaid MBaprincipal balance of multifamily Fannie Mae MBS issued during the period)
Daily Total US Treasury and Agency Fails What do these charts show
Can I download the data in these charts
Fails Data Fri Nov 06 2015
5 DAY 52 WEEK TOTAL AVG SECURITY LATEST 1 WEEK HIGH LOW
~ ~ AGENCY 0219 0151 1682 0036 B l vear TIG 0 0 TREASURY 42872 47 854 102059 15503
Total Amount (in billions USO)
Nov 14 Dec 14 Jan 15 Feb 15 Mar 15 Apr 15 May 15 Jun 15 Jul 15 Aug 15 Sep 15 Oct 15 Nov 15 $199
6 14 21 1 8 15 22 30 7 14 22 29 5 12 20 27 6 13 20 27 6 13 20 27 4 11 18 26 2 9 16 23 30 8 15 22 29 5 12 19 26 2 10 17 24 1 8 16 23 30 6
Daily Total US Treasury and Agency Fails What do these charts show
Can I download the data in these charts
Fails Data Fri Nov 06 2015
5 DAY TOTAL AVG SECURITY LATEST 1 WEEK
52 WEEK HIGH LOW
B __IY_e_ar___shy__I G Total Amount (in billions USO)
$126
$100
$79
$63
$50
$40
$32
$25
$20
$16
$13
$998
$792
$629
$500
$397
$315
$251
$199
$158
$126
$0998
$0792
Nov 14 Dec 14 Jan 15 Feb 15 Mar 15 Apr 15
~
~
May 15
~
~
Jun 15
AGENCY
TREASURY
Jul 15
0219
42 872
Aug 15
0151
47 854
Sep 15
1682
102059
Oct 15
0036
15503
Nov 15
$0500
6 14 21 1 8 15 22 30 7 14 22 29 5 12 20 27 6 13 20 27 6 13 20 27 4 11 18 26 2 9 16 23 30 8 15 22 29 5 12 19 26 2 10 17 24 1 8 16 23 30 6

Daily Total US Treasury and Agency Fails What do these charts show
Can I download the data in these charts
Fails Data Fri Nov 06 2015
5 DAY 52 WEEK TOTAL AVG SECURITY LATEST 1 WEEK HIGH LOW
~ ~ AGENCY 0219 0151 1682 0036 B l vear TIG 0 0 TREASURY 42872 47 854 102059 15503
Total Amount (in billions USO)
Nov 14 Dec 14 Jan 15 Feb 15 Mar 15 Apr 15 May 15 Jun 15 Jul 15 Aug 15 Sep 15 Oct 15 Nov 15 $199
6 14 21 1 8 15 22 30 7 14 22 29 5 12 20 27 6 13 20 27 6 13 20 27 4 11 18 26 2 9 16 23 30 8 15 22 29 5 12 19 26 2 10 17 24 1 8 16 23 30 6
Daily Total US Treasury and Agency Fails What do these charts show
Can I download the data in these charts
Fails Data Fri Nov 06 2015
5 DAY TOTAL AVG SECURITY LATEST 1 WEEK
52 WEEK HIGH LOW
B __IY_e_ar___shy__I G Total Amount (in billions USO)
$126
$100
$79
$63
$50
$40
$32
$25
$20
$16
$13
$998
$792
$629
$500
$397
$315
$251
$199
$158
$126
$0998
$0792
Nov 14 Dec 14 Jan 15 Feb 15 Mar 15 Apr 15
~
~
May 15
~
~
Jun 15
AGENCY
TREASURY
Jul 15
0219
42 872
Aug 15
0151
47 854
Sep 15
1682
102059
Oct 15
0036
15503
Nov 15
$0500
6 14 21 1 8 15 22 30 7 14 22 29 5 12 20 27 6 13 20 27 6 13 20 27 4 11 18 26 2 9 16 23 30 8 15 22 29 5 12 19 26 2 10 17 24 1 8 16 23 30 6