Embed Size (px)
Citation preview
AnalyticalBiochemistry
P A R T
VI
“There is no higher or lower knowledge but only one flowing out of experimentation”
–Leanardo da Vinci (LT, 1452–1519)
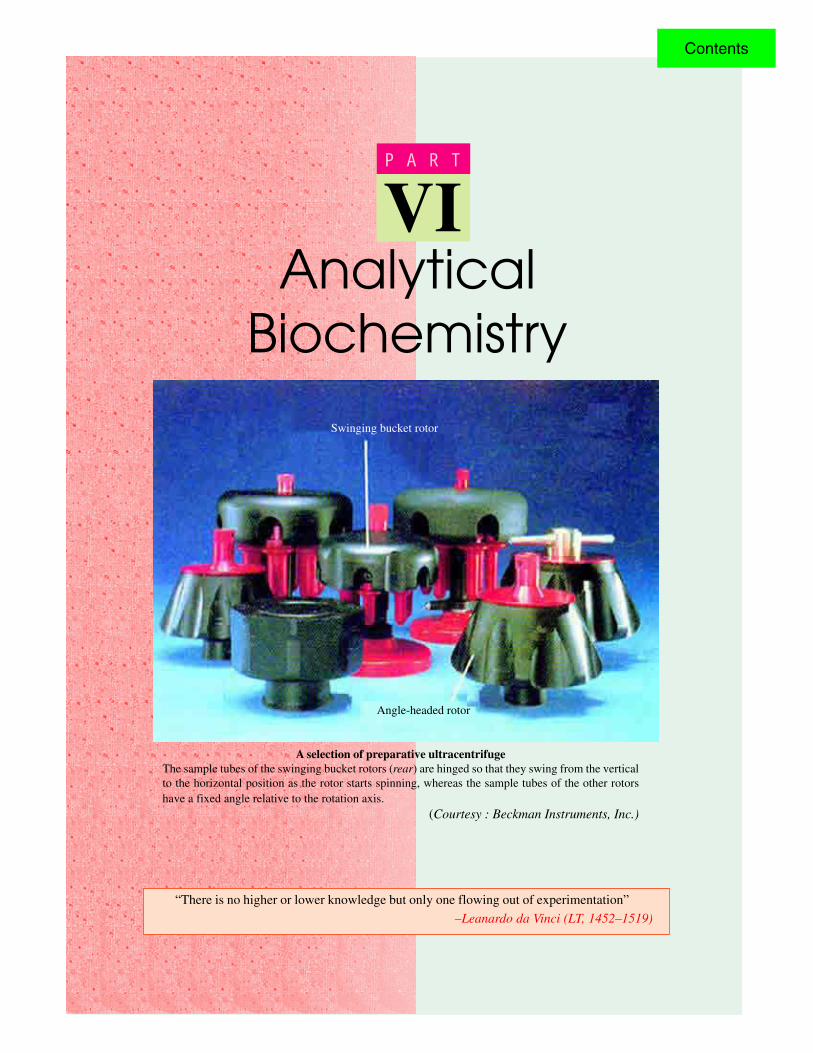
A selection of preparative ultracentrifugeThe sample tubes of the swinging bucket rotors (rear) are hinged so that they swing from the verticalto the horizontal position as the rotor starts spinning, whereas the sample tubes of the other rotorshave a fixed angle relative to the rotation axis.
(Courtesy : Beckman Instruments, Inc.)
Angle-headed rotor
Swinging bucket rotor
Contents

Contents
CONTENTS
• Observations on TissuesPerfusionTissues Slices
• Homogenization
• Differential Centrifugation
• ChromatographyPaper Chromatography,
PPCThin Layer Chromatography,
TLCIon Exchange
Chromatography
• Isotopic Tracer Technique
• Spectrophotometry
• Electrophoresis
• Ultracentrifugation
BiochemicalTechniques
35C H A P T E R
OBSERVATIONS ON TISSUES
It is often desirable to conduct biochemical studies onan individual organ or individual cells rather than onthe body as a whole. But since the growing of single
cells in multicelled organisms is not easy and also that aftermany generations cells from specialized tissues tend to revertto a more primitive type, the biochemist is forced to studyeither intact organs or preparations from these organs. Hecan also follow another technique of breaking up the tissuesand studying the behaviour of a broken cell preparation.
PERFUSION
This is the simplest way to study intact cells organizedin tissues. Here the whole organs is perfused in situ or invitro with blood or an isotonic saline solution. The solutionis kept recirculating and is also reoxygenated. Arrangementsare also made to remove CO2 from the system. The entirepreparation is kept at 37°C by means of a water jacket. Insuch experiments the tissue itself can be analyzed at theend of perfusion and the changes noted and compared withreference to the composition of the organ before perfusion.
The method, however, suffers from certain drawbacks :
(a) During perfusion experiments, one is sure to losecertain of the regulatory mechanism such ashormonal and nervous control which operate uponthe organ in its normal locus.
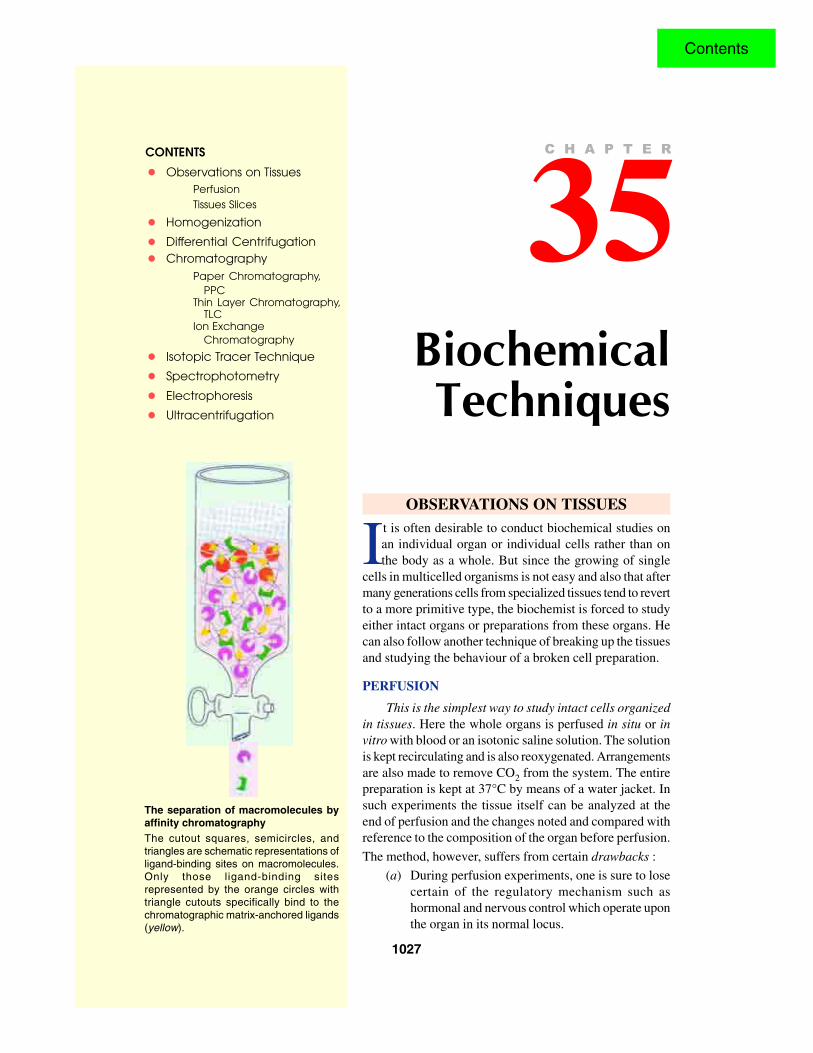
The separation of macromolecules byaffinity chromatographyThe cutout squares, semicircles, andtriangles are schematic representations ofligand-binding sites on macromolecules.Only those ligand-binding sitesrepresented by the orange circles withtriangle cutouts specifically bind to thechromatographic matrix-anchored ligands(yellow).
1027
Contents
1028 FUNDAMENTALS OF BIOCHEMISTRY
(b) Moreover, inferences drawn from such experiments are always those obtained under artificialconditions in which the tissue is operating.
TISSUES SLICESThis techinque has been much used in the past for organs such as liver, kidney and brain and also
for certain plant tissues like roots and tubers. Here thin slices (approx. 50 µ thick) of tissues are cut.Many of the cells are, of course, damaged but some between 50–70% remain intact. Slicing alsooffers sufficient surface to the bathing fluid to permit adequate exchange of materials and wasteproducts so that the tissues remain viable for several hours. These slices are then suspenced in bufferedisotonic saline solutions in airtight vessel to prevent evaporation. Excess O2 is given by filling thelarge airspace, present above the liquid, with pure O2. The vessel is maintained at 37°C and is frequentlyshaken to promote diffusion. The changes in cellular composition are then studied.
The two serious drawbacks with this techniques are as follows :(a) The cells are feared to ‘die’ early during such operations. Henceforth, it is best to conduct
the experiments for the shortest possible time but consistent with accuracy in analysis of thevarious changes.
(b) Although a fraction of cell membranes is cut in slicing, most cellular constituents still remaincontained within the cells.
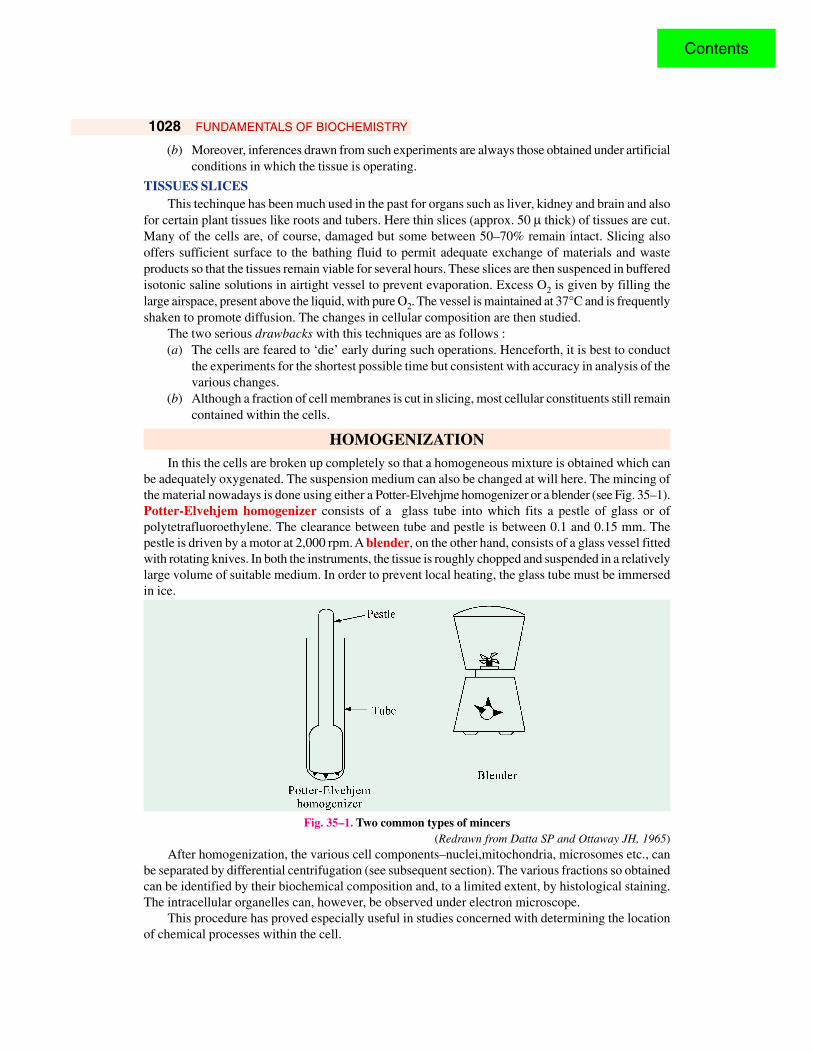
HOMOGENIZATIONIn this the cells are broken up completely so that a homogeneous mixture is obtained which can
be adequately oxygenated. The suspension medium can also be changed at will here. The mincing ofthe material nowadays is done using either a Potter-Elvehjme homogenizer or a blender (see Fig. 35–1).Potter-Elvehjem homogenizer consists of a glass tube into which fits a pestle of glass or ofpolytetrafluoroethylene. The clearance between tube and pestle is between 0.1 and 0.15 mm. Thepestle is driven by a motor at 2,000 rpm. A blender, on the other hand, consists of a glass vessel fittedwith rotating knives. In both the instruments, the tissue is roughly chopped and suspended in a relativelylarge volume of suitable medium. In order to prevent local heating, the glass tube must be immersedin ice.
Fig. 35–1. Two common types of mincers(Redrawn from Datta SP and Ottaway JH, 1965)
After homogenization, the various cell components–nuclei,mitochondria, microsomes etc., canbe separated by differential centrifugation (see subsequent section). The various fractions so obtainedcan be identified by their biochemical composition and, to a limited extent, by histological staining.The intracellular organelles can, however, be observed under electron microscope.
This procedure has proved especially useful in studies concerned with determining the locationof chemical processes within the cell.
Contents

BIOCHEMICAL TECHNIQUES 1029
Supernatant is that part of the cell materialnot sediemented by a centrifugal forceknown to sediment any subcellular structure.
Homogenateforms
Centrifugeat 500 × g
for 10 minutes
Supernatant
10,000 × g20 minutes
1,00,000 × g1 hour
Cytosol(soluble proteins)
Pellet: Microsomalfraction
Pellet: Mitochondrialfraction
Pellet: Nuclearfraction
DIFFERENTIAL CENTRIFUGATIONThe centrifugal force exerted on a particle in the solution is expressed in multiples of the force
exerted by gravity. The centrifugal force isproportional to the radius of the centrifugal head andto the square of angular velocity. Hence, it is moreconvenient to use relatively small heads rotating athigh speeds. Thus, a head of approximately 10 cmdiameter rotating at about 40,000 rpm will producenearly 100,000 g. At such high speeds, the head isrun in a vacuum to prevent the heat produced by air friction. The tube containing the homogenate isusually held at an angle to the axis of rotating to keep the path of particles through the solution asshort as possible (Fig. 35–2).
The homogenate is first diluted and thencentrifuged at a low speed to remove nuclei etc. Thesupernatant liquid is then poured off and centri-fuged at a higher speed to remove next fraction. The
Fig. 35–2. Differential centrifugationCell are disrupted in a homogenizer and the resulting mixture, called the homogenate, is centrifuged in a step-by-step fashion of increasing centrifugal force. The denser material will form a pellet at lower centrifugal forcethan will the less-denser material. The isolated fractions can be used for further purification.
(Photo courtesy : S Fleischer and B Flesischer)
The broken cell preparation is looselyreferred to as cell-free preparation or‘homogenate’. Properly prepared, ahomogenate is the sum of all the cellcomponents obtained by rupturing the cellmembrane.
Contents
1030 FUNDAMENTALS OF BIOCHEMISTRY
supernatant is then again contrifuged at still a higher speed and fraction separated. The removal ofparticles of a particular size depends on the magnitude of the field and also on the time for which thefield is applied (refer Table 35–1).
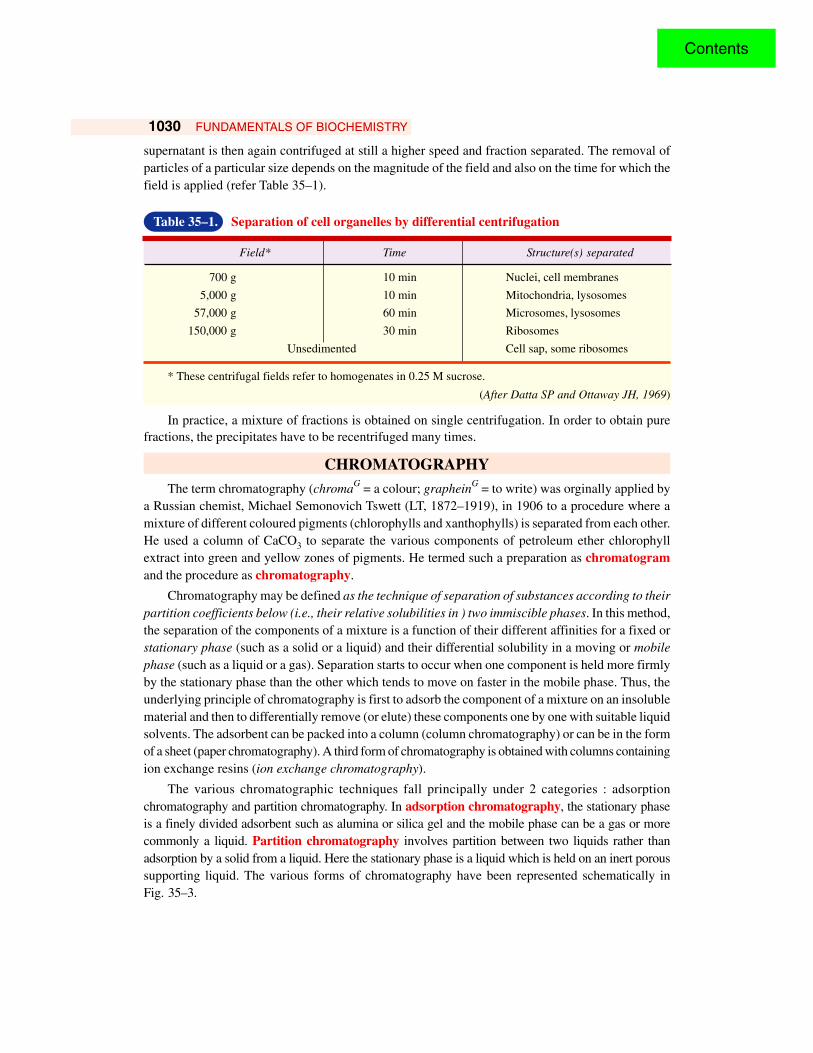
Table 35–1. Separation of cell organelles by differential centrifugation
Field* Time Structure(s) separated
700 g 10 min Nuclei, cell membranes
5,000 g 10 min Mitochondria, lysosomes
57,000 g 60 min Microsomes, lysosomes
150,000 g 30 min Ribosomes
Unsedimented Cell sap, some ribosomes
* These centrifugal fields refer to homogenates in 0.25 M sucrose.
(After Datta SP and Ottaway JH, 1969)
In practice, a mixture of fractions is obtained on single centrifugation. In order to obtain purefractions, the precipitates have to be recentrifuged many times.
CHROMATOGRAPHY
The term chromatography (chromaG = a colour; grapheinG = to write) was orginally applied bya Russian chemist, Michael Semonovich Tswett (LT, 1872–1919), in 1906 to a procedure where amixture of different coloured pigments (chlorophylls and xanthophylls) is separated from each other.He used a column of CaCO3 to separate the various components of petroleum ether chlorophyllextract into green and yellow zones of pigments. He termed such a preparation as chromatogramand the procedure as chromatography.
Chromatography may be defined as the technique of separation of substances according to theirpartition coefficients below (i.e., their relative solubilities in ) two immiscible phases. In this method,the separation of the components of a mixture is a function of their different affinities for a fixed orstationary phase (such as a solid or a liquid) and their differential solubility in a moving or mobilephase (such as a liquid or a gas). Separation starts to occur when one component is held more firmlyby the stationary phase than the other which tends to move on faster in the mobile phase. Thus, theunderlying principle of chromatography is first to adsorb the component of a mixture on an insolublematerial and then to differentially remove (or elute) these components one by one with suitable liquidsolvents. The adsorbent can be packed into a column (column chromatography) or can be in the formof a sheet (paper chromatography). A third form of chromatography is obtained with columns containingion exchange resins (ion exchange chromatography).
The various chromatographic techniques fall principally under 2 categories : adsorptionchromatography and partition chromatography. In adsorption chromatography, the stationary phaseis a finely divided adsorbent such as alumina or silica gel and the mobile phase can be a gas or morecommonly a liquid. Partition chromatography involves partition between two liquids rather thanadsorption by a solid from a liquid. Here the stationary phase is a liquid which is held on an inert poroussupporting liquid. The various forms of chromatography have been represented schematically inFig. 35–3.
Contents

BIOCHEMICAL TECHNIQUES 1031
Fig. 35–3. Various forms of chromatography
* Other than gas chromatography.
A few chromatographic techniques are described below.
PAPER CHROMATOGRAPHY, PPC
Two Russian workers, Izmailov and Schraiber (1938) discovered this important technique.Thismethod is especially useful for the detection and separation of amino acids. Here the filter paperstrips are used to support a stationary water phase while a mobile organic phase moves down thesuspended paper strip in a cylinder. Separation is based on a liquid-liquid partition of the compounds.Thus, this is essentially a form of partition chromatography between two liquid phases, althoughadsorption to the paper may also take place.
In this method, a drop of solution containing amixture of amino acids (or other compounds) to beseparated is applied at a marked point, about 3 cm fromone end of a strip of filter paper. Whatman No. 1 paperis most frequently used for this purpose. The chemicalcomposition of Whatman filter paper No. 1 is :
α-cellulose 98 – 99%
β-cellulose 0.3 – 1%
Pentosans 0.4 – 0.8%
Ash 0.07 – 0.1%
Ether soluble matter 0.015 – 0.1%
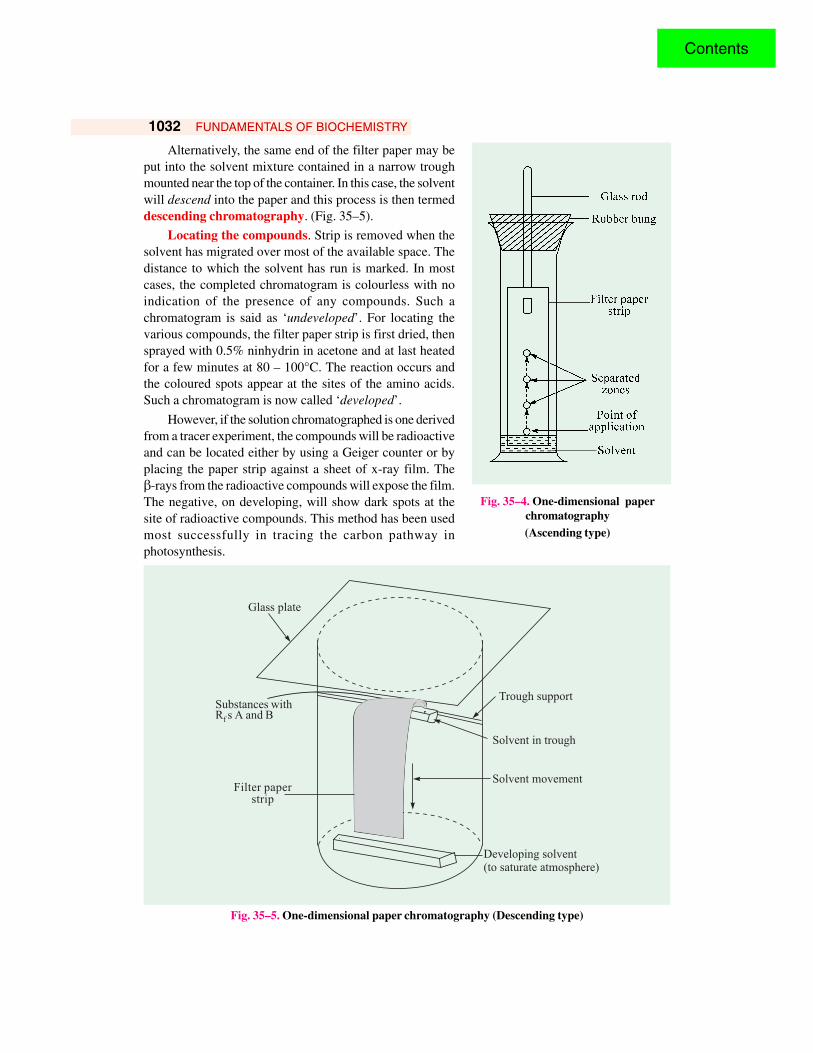
The filter paper is then dried and ‘equilibrated’ by putting it into an air-tight cylidrical jar whichcontains an aqueoues solution of a solvent. The most widely applicable solvent mixture is n-butanol: acetic acid : water (4 : 1 : 5), which is abbreviated as BAW. The end of the filter paper nearest theapplied drop is inserted into the solvent mixture at the bottom of the jar, taking care that the markedpoint of application remains well above the level of the solvent in the jar. The paper is suspendedin such a manner so that it hangs freely without touching the sides of the container. Thus, the solventwill ascend into the paper and this process is, therefore, termed ascending chromatography(Fig. 35–4).
Whatman No. 3 MM is a thick paper and isbest employed for separating largequantities of material; the resolution is,however, inferior to whatman No.1. For arapid separation, Whatman Nos. 4 and 5are convenient, although the spots are lesswell-defined. In all cases, the flow rate isfaster in the ‘machine direction’, which isnormally noted on the box containing thepapers. The paper may be impregnated witha buffer solution before use or chemicallymodified by acetylation. Ion exchangepapers are also available commercially.
Contents
1032 FUNDAMENTALS OF BIOCHEMISTRY
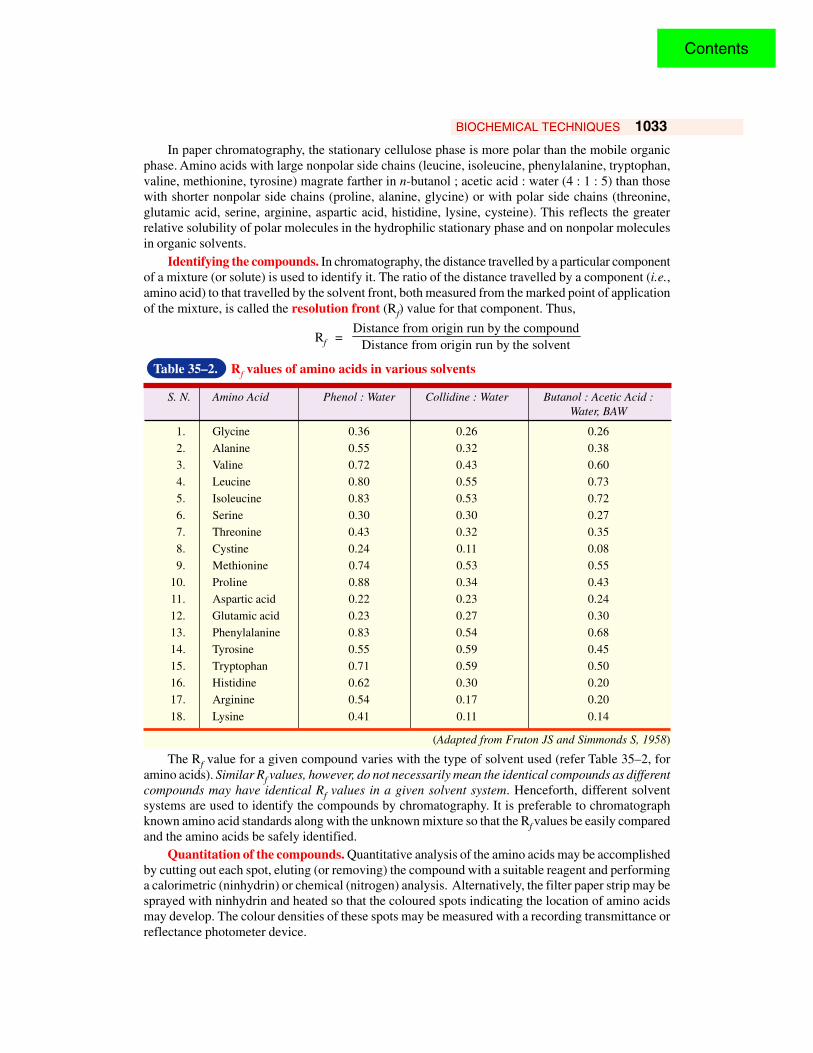
Alternatively, the same end of the filter paper may beput into the solvent mixture contained in a narrow troughmounted near the top of the container. In this case, the solventwill descend into the paper and this process is then termeddescending chromatography. (Fig. 35–5).
Locating the compounds. Strip is removed when thesolvent has migrated over most of the available space. Thedistance to which the solvent has run is marked. In mostcases, the completed chromatogram is colourless with noindication of the presence of any compounds. Such achromatogram is said as ‘undeveloped’. For locating thevarious compounds, the filter paper strip is first dried, thensprayed with 0.5% ninhydrin in acetone and at last heatedfor a few minutes at 80 – 100°C. The reaction occurs andthe coloured spots appear at the sites of the amino acids.Such a chromatogram is now called ‘developed’.
However, if the solution chromatographed is one derivedfrom a tracer experiment, the compounds will be radioactiveand can be located either by using a Geiger counter or byplacing the paper strip against a sheet of x-ray film. Theβ-rays from the radioactive compounds will expose the film.The negative, on developing, will show dark spots at thesite of radioactive compounds. This method has been usedmost successfully in tracing the carbon pathway inphotosynthesis.
Filter paperstrip
Developing solvent(to saturate atmosphere)
Solvent movement
Solvent in trough
Trough supportSubstances withR s A and Bf
Glass plate
Fig. 35–5. One-dimensional paper chromatography (Descending type)
Fig. 35–4. One-dimensional paperchromatography(Ascending type)
Contents
BIOCHEMICAL TECHNIQUES 1033
In paper chromatography, the stationary cellulose phase is more polar than the mobile organicphase. Amino acids with large nonpolar side chains (leucine, isoleucine, phenylalanine, tryptophan,valine, methionine, tyrosine) magrate farther in n-butanol ; acetic acid : water (4 : 1 : 5) than thosewith shorter nonpolar side chains (proline, alanine, glycine) or with polar side chains (threonine,glutamic acid, serine, arginine, aspartic acid, histidine, lysine, cysteine). This reflects the greaterrelative solubility of polar molecules in the hydrophilic stationary phase and on nonpolar moleculesin organic solvents.
Identifying the compounds. In chromatography, the distance travelled by a particular componentof a mixture (or solute) is used to identify it. The ratio of the distance travelled by a component (i.e.,amino acid) to that travelled by the solvent front, both measured from the marked point of applicationof the mixture, is called the resolution front (Rf) value for that component. Thus,
Rf = Distance from origin run by the compound
Distance from origin run by the solvent
Table 35–2. Rf values of amino acids in various solvents
S. N. Amino Acid Phenol : Water Collidine : Water Butanol : Acetic Acid :Water, BAW
1. Glycine 0.36 0.26 0.26
2. Alanine 0.55 0.32 0.38
3. Valine 0.72 0.43 0.60
4. Leucine 0.80 0.55 0.73
5. Isoleucine 0.83 0.53 0.72
6. Serine 0.30 0.30 0.27
7. Threonine 0.43 0.32 0.35
8. Cystine 0.24 0.11 0.08
9. Methionine 0.74 0.53 0.55
10. Proline 0.88 0.34 0.43
11. Aspartic acid 0.22 0.23 0.24
12. Glutamic acid 0.23 0.27 0.30
13. Phenylalanine 0.83 0.54 0.68
14. Tyrosine 0.55 0.59 0.45
15. Tryptophan 0.71 0.59 0.50
16. Histidine 0.62 0.30 0.20
17. Arginine 0.54 0.17 0.20
18. Lysine 0.41 0.11 0.14
(Adapted from Fruton JS and Simmonds S, 1958)
The Rf value for a given compound varies with the type of solvent used (refer Table 35–2, foramino acids). Similar Rf values, however, do not necessarily mean the identical compounds as differentcompounds may have identical Rf values in a given solvent system. Henceforth, different solventsystems are used to identify the compounds by chromatography. It is preferable to chromatographknown amino acid standards along with the unknown mixture so that the Rf values be easily comparedand the amino acids be safely identified.
Quantitation of the compounds. Quantitative analysis of the amino acids may be accomplishedby cutting out each spot, eluting (or removing) the compound with a suitable reagent and performinga calorimetric (ninhydrin) or chemical (nitrogen) analysis. Alternatively, the filter paper strip may besprayed with ninhydrin and heated so that the coloured spots indicating the location of amino acidsmay develop. The colour densities of these spots may be measured with a recording transmittance orreflectance photometer device.
Contents
1034 FUNDAMENTALS OF BIOCHEMISTRY
The chromatographic technique described above allows vertical separation of amino acid and istermed as one-dimensional paper chromatography.
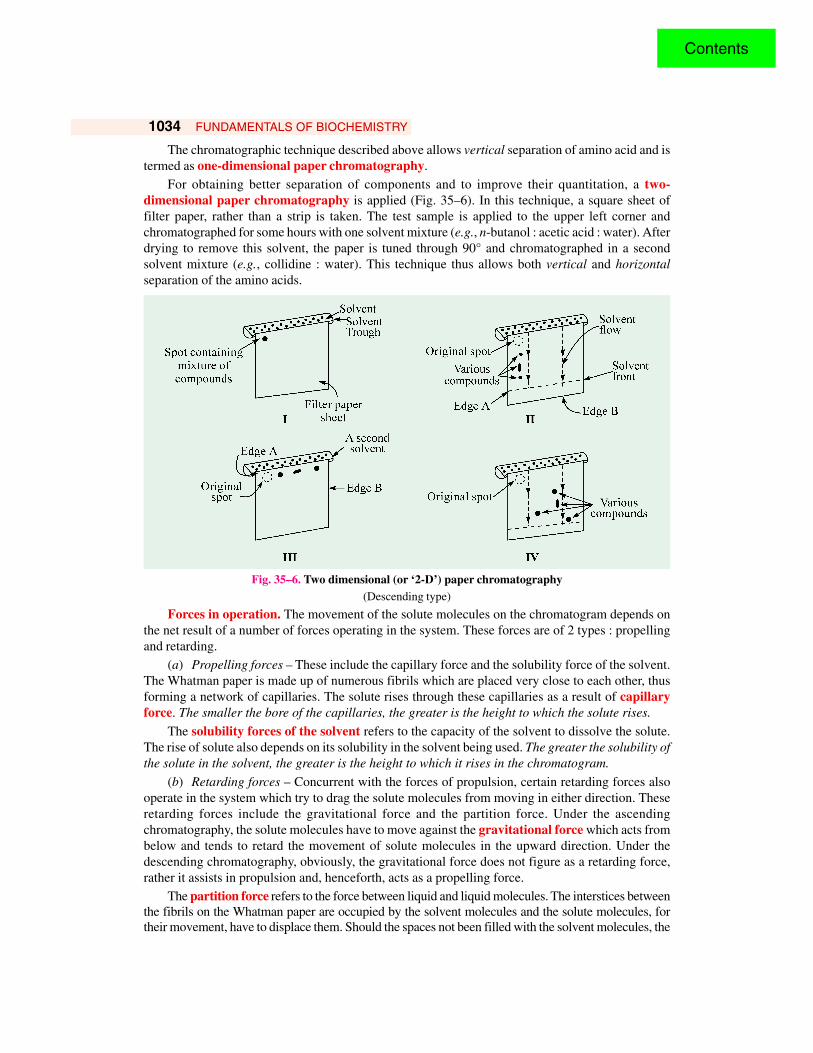
For obtaining better separation of components and to improve their quantitation, a two-dimensional paper chromatography is applied (Fig. 35–6). In this technique, a square sheet offilter paper, rather than a strip is taken. The test sample is applied to the upper left corner andchromatographed for some hours with one solvent mixture (e.g., n-butanol : acetic acid : water). Afterdrying to remove this solvent, the paper is tuned through 90° and chromatographed in a secondsolvent mixture (e.g., collidine : water). This technique thus allows both vertical and horizontalseparation of the amino acids.
Fig. 35–6. Two dimensional (or ‘2-D’) paper chromatography(Descending type)
Forces in operation. The movement of the solute molecules on the chromatogram depends onthe net result of a number of forces operating in the system. These forces are of 2 types : propellingand retarding.
(a) Propelling forces – These include the capillary force and the solubility force of the solvent.The Whatman paper is made up of numerous fibrils which are placed very close to each other, thusforming a network of capillaries. The solute rises through these capillaries as a result of capillaryforce. The smaller the bore of the capillaries, the greater is the height to which the solute rises.
The solubility forces of the solvent refers to the capacity of the solvent to dissolve the solute.The rise of solute also depends on its solubility in the solvent being used. The greater the solubility ofthe solute in the solvent, the greater is the height to which it rises in the chromatogram.
(b) Retarding forces – Concurrent with the forces of propulsion, certain retarding forces alsooperate in the system which try to drag the solute molecules from moving in either direction. Theseretarding forces include the gravitational force and the partition force. Under the ascendingchromatography, the solute molecules have to move against the gravitational force which acts frombelow and tends to retard the movement of solute molecules in the upward direction. Under thedescending chromatography, obviously, the gravitational force does not figure as a retarding force,rather it assists in propulsion and, henceforth, acts as a propelling force.
The partition force refers to the force between liquid and liquid molecules. The interstices betweenthe fibrils on the Whatman paper are occupied by the solvent molecules and the solute molecules, fortheir movement, have to displace them. Should the spaces not been filled with the solvent molecules, the
Contents

BIOCHEMICAL TECHNIQUES 1035
movement of the solute molecules through them would have been much more facilitated.Thus, the movement of the solute molecules on the Whatman paper in either direction is the net
result of the interaction between various forces of propulsion and retardation. Movement of the solutemolecules is exhibited only when the propelling forces exceed the retarding forces in magnitude.
THIN LAYER CHROMATOGRAPHY, TLC
Thin layer chromatography is adsorption chromatography performed on open layers of adsorbentmaterials supported on glassplates. This technique combines many of the advantages of paperchromatography with those of column chromatography. Here a thin uniform film of adsorbent (likesilica gel or alumina powder) containing a binding medium (like calcium sulfate) is spread onto aglass plate. The thin layer is allowed to dry at room temperature and is then activated by heating in anoven between 100° to 250°C. The activated plate is then placed flat and samples spotted withmicropipettes carefully on the surface of the thin layer. After the solvent has evaporated, the platesare placed vertically in a glass tank containing a suitable solvent. Within a short time (5 to 30) minutes),the various components get separated by the solvent rising through the thin layer. The glass plate isthen taken out from the tank, allowed to dry and then the spots are detected by spraying the plate witha variety of reagents.
Superiority of TLC – The superiority of TLC over paper chromatography lies in the followingfacts :
(a) Because of the inorganic nature of the adsorbent (supporting medium), concentrated sulfuricacid spray followed by heating may be used to develop (or locate substances on) thechromatogram by charring and rendering visible any spots of organic nature.
(b) Moreover, amino acid mixtures, which require 18 hours for separation on paper, require aslittle as 3 hours using cellulose TLC.
(c) The advantage of this technique also lies in the choice of the adsorbents which allow separationnot possible on paper.
Thus, the speed, efficiency and sensitivity of TLC has made this technique most valuable to thebiochemists. Lipids including sterols may be neatly separated by TLC on alumina. Also after localizationof these substances on the glass plate with reagents, selected spots of the plate's surface may bescrapped off and the compounds isolated by extraction of the alumina powder with suitable solvents.
ION EXCHANGE CHROMATOGRAPHY
Ion exchange chromatography is in wide use for the separation of amino acids. It employssynthetic resins such as a strongly acidic cation exchanger, Dowex-50 and a strongly basic anionexchanger, Dowex-1. The former is a polystyrene sulfonic acid and the latter a polystyrene quaternaryammonium salt.
Two common cellulose derivatives, carboxymethyl cellulose (CMC) and diethylaminoethylcellulose (DEAE) are successfully used in protein purification. CMC is a cationic derivative andDEAE, an anionic derivative. An even more versatile substance for the separation of protein is across-linked dextran called sephadex. When packed in a column and equilibrated with buffer, thepolysaccharide acts as a molecular sieve for protein molecules. Five grades of sephadex are available.Sephadex G-25 beads retain molecules with molecular weights up to 5,000. In other words, the‘exclusion limit’ of G-25, is 5,000. The exclusion limits of the remaining four grades, G-50, G75,G-100 and G-200-- are 10,000, 50,000, 100,000 and 200,000 respectively.
Thus, electrostatic attraction of oppositely charged ions on a polyelectrolyte surface forms thebasis of ion exchange chromatography. In principle, the ionized groups of the ion exchange materialsform salts with ions of opposite charge and they exchange these ions for others when the relative saltconcentrations in the solution are varied. Ion exchange chromatography is especially useful in separation
Contents

1036 FUNDAMENTALS OF BIOCHEMISTRY
and purification of nucleotides owing to their low molecular weights and the presence of ionizablegroups.
In practice, the protein mixture is passed through a column of the modified cellulose contained ina glass tube and allowed to become attached to the column material. Increasing salt concentrationand/or buffers of varying pH values are then passed through the column. Proteins will be washed offthe column at different times depending on their molecular structure, net charge and side group. Theessential process is depicted in Fig. 35–7.
Fig. 35–7. Ion exchange chromatographyThe various processes occurirng as protein is absorbed by and eluted from an ion exchange column are illustratedhere. The ion exchange material is assumed to be an insoluble polymer having free substituted amine groups.
(Adapted from Fariley JL and Kilgour GL, 1966)
ISOTOPIC TRACER TECHNIQUEIn the studies of metabolic transformation of a particular substance, the primary objective of the
biochemists remains to observe the fate of that substance in vivo under experimental conditions whichcause minimum physiological disturbance to the test organism. Isotopic tracer technique has beenmost successfully used for such type of studies. Here one or more of the atoms in metabolite understudy is “labelled” by means of one of the rare or artificially produced isotopes and its path followedwhile frequently testing the intermediary compounds at intervals.
The nucleus of each elementary species is characterized by an atomic number, which is equal tothe number of protons and is also equal to the number of electrons around the nucleus when the atomexists in an electrically neutral state. All atoms of a particular element have the same atomic number.Each nucleus is also characterized by what is called as the mass number and which is equal to thetotal number of protons and neutrons contained therein. The difference between the two numbers isobviously the number of neutrons contained in the nucleus. The various isotopes of an element havethe same atomic number but different atomic mass. Conventionally, the atomic number is written assubscript that precedes the elementry symbol and the mass number as superscript that follows thesymbol. For example, nitrogen (atomic number 7) is found in nature both with a mass of 14 (designatedas 7N14) and with a mass of 15 (designated as 7N15). Similarly, carbon with atomic number 6 hasdifferent mass number of 11, 12, 13 and 14 and the various isotopes are accordingly written as 6C
11,
6C12, 6C
13 and 6C14. Being implicit in the symbol, the atomic number is often not written. Thus, the
two common isotopes of carbon are simply written as C12 and C14.
Contents

BIOCHEMICAL TECHNIQUES 1037
Isotopes are of 2 types – stable and radioactive. The stable isotopes are those whose nuclei donot undergo spontaneous decomposition. N14, N15, O18, C13, S33 and S34 belong to this category.Atoms whose nuclei decompose spontaneously with the emission of radiations are termed radioactiveisotopes. C14, S35, P32 and H3 belong to this group.
Stable Isotopes. The stable isotopes of biological importance are available in enrichedconcentrations. The important ones are H2, N15, C13 and O18. These atoms occur in nature in thefollowing relative abundance :
H1/H2 – 99.98/0.02
N14/N15 – 99.63/0.37C12/C13 – 98.09/1.10
O16/O18 – 99.80/0.20
The concentration of these stable isotopes, 0.37% of N15 for example, is called the normalabundance. The concentration of a heavy isotope is usually measured as atom per cent excess i.e., theamount in per cent by which the isotope exceeds its normal abundance. As an illustration, if a sampleof nitrogen gas contains 3% N15 (and 97% N14), the concentration of N15 in this sample is said to be(3.0–0.37) or 2.63 atom per cent excess.
The stable isotopes are measured quantitatively with a mass spectrometer. Devised by Aston in1919, this instrument has now been greatly improved. In fact, this apparatus converts the unchargedatoms or molecules into positively charged ions (cations). These are then accelerated into the field ofa powerful magnet. In the magnetic field, the ions will be deflected to an extent corresponding to theirmass. The path of the heaviest particles is bent least and that of the lightest particles is bent most.The relative amounts of the ions of different mass is then determined by collecting them on a plateand measuring the current produced.
This technique for measuring stable isotopes is less sensitive and more tedious than that formeasuring radioactive isotopes. However, since no useful radioactive isotopes of oxygen and nitrogenexist, the mass spectrometer remains an essential tool for studies involving these elements.
Table 35–3. Properties of useful radioactive isotopes
S.N. Isotope Half Life* Type of Energy of RadiationRadiation (in million electronvolts, mev)
1. H3 12.5 years β 0.018
2. C14 5760 years β 0.155
3. P32 14.3 days β 1.712
4. S35 87.1 days β 0.167
5. Cl36 3.1 × 10⁵ years β 0.714
6. K42 12.5 hours β 3.550
7. Ca45 152 days β 0.255
8. Fe55 2.94 years x-rays –9. I125 60 days γ 0.035
10. I131 8.1 days β 0.610
γ 0.280
* Half life is the required for the loss of 50% of radioactivity. In other words, the time taken for half theatoms is a quantity of a radioactive substance to disintegrate is known as the half life.
Radioactive Isotopes. The radioactive isotopes are usually more useful as tracers than thestable isotopes since the analytical methods for their measurement are extremely sensitive. Thebiochemically-important redioactive isotopes are H3, C14, P32, S35 and Ca45. All these emit β-rays and
Contents

1038 FUNDAMENTALS OF BIOCHEMISTRY
their nuclei, upon disintegration, produce electrons. The β-rays interact with the molecules throughwhich they traverse causing ionization of the molecules. It is this ionization property which is used tomeasure quantitatively the amount of radioactive isotope present. Table 34–3 lists some properties ofuseful radioactive isotopes.
The most widely-used apparatus for the determination of radioactive isotopes is Geiger-Müllercounter or G-M tube (Fig. 35–8). The functioning of this apparatus is based on the ability of theemitted radiation to ionize atoms. It consists of a large, round tube forming cathode with a fine wirestretched in the centre as anode. The fine wire is maintained at a high potential (1,000–2,500 volts)with respect of the outer cathode. The tube is filled with an easily ionized gas such as helium or argonand an organic quenching substance such as ethanol. The voltage as well as the gas filling is soadjusted that normally no current flows. The open end of the tube is covered with an extremely thin
Fig. 35–8. Geiger-Müller tube and a scaler[A = source of potential, B = Geiger-Müller tube, C = leadshield, D = sample pan holder, E = cathode shield, F= anode wire, G = mica window, H = scaler]
(After Cowgill and Pardee, 1957)
window of mica (1.5 to 2.0 mg/cm2) or synthetic plastic.The radioactive material which is usually a solid is placedbeneath this window. The radioactive particle enters the tubeand ionizes the gas molecules with a subsequent release of ashower of electrons. These free electrons are then acceleratedto the positive wire. As they progress through the gas, additional molecules are ionized. Thus, thetube becomes momentarily conductive. The resultant electrical pulse is collected in an electroniccomputing machine (called scaler) which records the number of such pulses in a predetermined time.
The radioactivity of a sample is given in terms of its specific radioactivity, i.e., the number ofcounts per minute (cpm) per unit weight (milligram or micromole etc). The relationship of this quantityto the number of disintegrations per unit time depends on the counting efficiency of the system.The absolute unit of disintegration rate is the curie. A curie is defined as the amount of emitterwhich exhibits 3.7 × 10¹⁰ disintegrations per second (dps). More common units are a millicurie,mc (10–3 curie) and a microcurie, µc (10–6 curie).
The Geiger-Muller technique is being rapidly replaced nowadays by an alternative method calledscintillation counting. It involves transformation of β or γ radiation into ultraviolet or visible lightby the use of a phosphor. The phosphors are often highly aromatic substances such as p-terphenyl andhave the property of emitting a light flash (or a scintillation) when they absorb radiation from aradioactive compound. The scintillations are detected by a sensitive photomultiplier and the resultantelectrical pulses are collected in a scaler. The scintillation technique has proved particularly usefulfor isotopes which emit low energy β particles such as H3, C14 etc.
Although extremely sensitive, this method also suffers from certain drawbacks. They are :
(a) quenching of light flashes by coloured samples, and
The radioactive sample to be countedis, however, in some instances a gasand is actually included in the fillingof the counter tube.
Contents
BIOCHEMICAL TECHNIQUES 1039
(b) limited solubility of highly polar compounds in nonpolar solvents.Therapeutic applications of radioactive emissions. Radioactive emissions, particularly of
γ-rays, are frequently used to kill unwanted tissues. Some common examples are the radioactivesterilization of surgical accessories, partial destruction of over-active thyroids by I131 and the irradiationof tumours by Co60 and by Au198 or Ra226.
Neutron activation. The radioactive isotopes are made usually by bombarding a suitable targetwith neutrons in an atomic pile. But sometimes it becomes also possible to bombard a biologicalsample directly so that a little element is converted into a radioactive isotope. Thus, O18 has beenconverted into F18 by neutron activation. Of special interest was the dramatic example of bombardmentof a single hair of the Emperor Napoleon Bonaparte. The hair was, in fact, taken at the end of his lifeand is preserved since then. The hair, after this treatment, was found to possess a radioactive isotopeof arsenic which could only have come from arsenic already present in the hair. This finding wasevidenced to the fact that Napoleon died of arsenic poisoning.
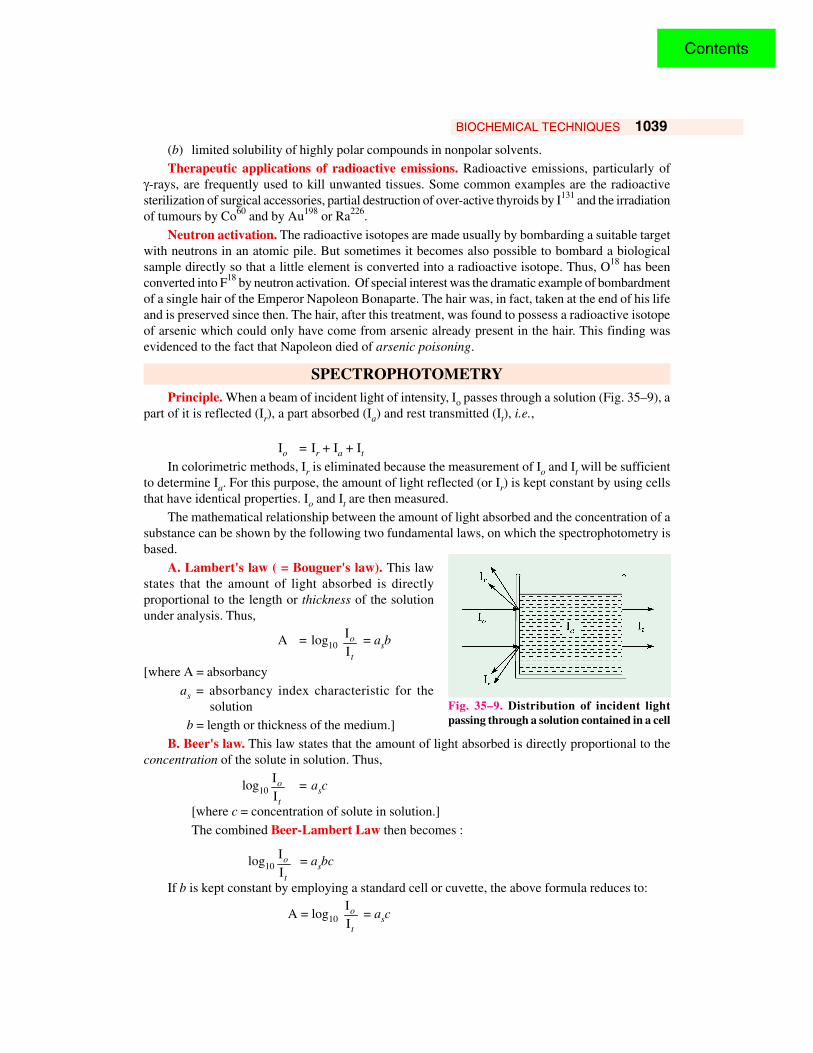
SPECTROPHOTOMETRYPrinciple. When a beam of incident light of intensity, Io passes through a solution (Fig. 35–9), a
part of it is reflected (Ir), a part absorbed (Ia) and rest transmitted (It), i.e.,
Io = Ir + Ia + It
In colorimetric methods, Ir is eliminated because the measurement of Io and It will be sufficientto determine Ia. For this purpose, the amount of light reflected (or Ir) is kept constant by using cellsthat have identical properties. Io and It are then measured.
The mathematical relationship between the amount of light absorbed and the concentration of asubstance can be shown by the following two fundamental laws, on which the spectrophotometry isbased.
A. Lambert's law ( = Bouguer's law). This lawstates that the amount of light absorbed is directlyproportional to the length or thickness of the solutionunder analysis. Thus,
A = log10 IIo
t
= asb
[where A = absorbancy
as = absorbancy index characteristic for the solution
b = length or thickness of the medium.]
B. Beer's law. This law states that the amount of light absorbed is directly proportional to theconcentration of the solute in solution. Thus,
log10IIo
t
= asc
[where c = concentration of solute in solution.]
The combined Beer-Lambert Law then becomes :
log10IIo
t
= asbc
If b is kept constant by employing a standard cell or cuvette, the above formula reduces to:
A = log10 IIo
t
= asc
Fig. 35–9. Distribution of incident lightpassing through a solution contained in a cell
Contents
1040 FUNDAMENTALS OF BIOCHEMISTRY
The absorbancy index, as is defined as :
as = ACL
[where C = concentration of absorbing material in gms/litre L =distance in cms travelled by the light in solution.]
If one wishes to express the light absorption in terms of the molar concentration of the absorbingmaterial, the molar absorbancy index, am will be equal to :
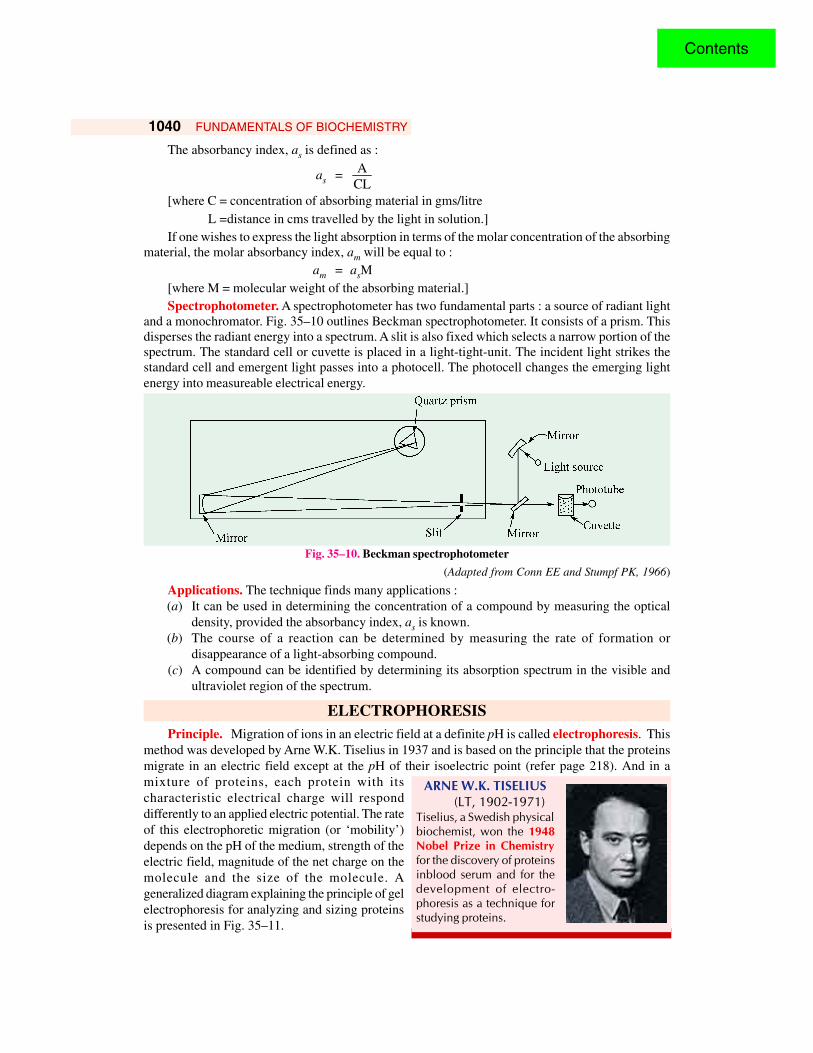
am = asM[where M = molecular weight of the absorbing material.]Spectrophotometer. A spectrophotometer has two fundamental parts : a source of radiant light
and a monochromator. Fig. 35–10 outlines Beckman spectrophotometer. It consists of a prism. Thisdisperses the radiant energy into a spectrum. A slit is also fixed which selects a narrow portion of thespectrum. The standard cell or cuvette is placed in a light-tight-unit. The incident light strikes thestandard cell and emergent light passes into a photocell. The photocell changes the emerging lightenergy into measureable electrical energy.
Fig. 35–10. Beckman spectrophotometer
(Adapted from Conn EE and Stumpf PK, 1966)
Applications. The technique finds many applications :(a) It can be used in determining the concentration of a compound by measuring the optical
density, provided the absorbancy index, as is known.(b) The course of a reaction can be determined by measuring the rate of formation or
disappearance of a light-absorbing compound.(c) A compound can be identified by determining its absorption spectrum in the visible and
ultraviolet region of the spectrum.
ELECTROPHORESISPrinciple. Migration of ions in an electric field at a definite pH is called electrophoresis. This
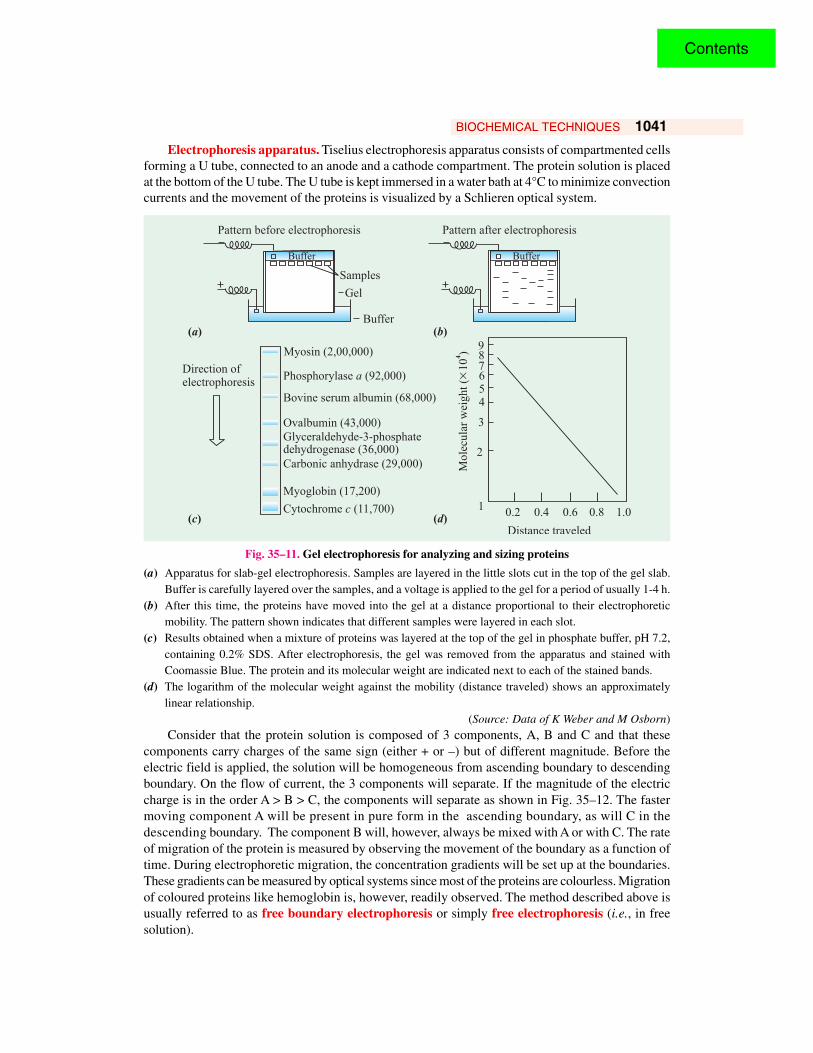
method was developed by Arne W.K. Tiselius in 1937 and is based on the principle that the proteinsmigrate in an electric field except at the pH of their isoelectric point (refer page 218). And in amixture of proteins, each protein with itscharacteristic electrical charge will responddifferently to an applied electric potential. The rateof this electrophoretic migration (or ‘mobility’)depends on the pH of the medium, strength of theelectric field, magnitude of the net charge on themolecule and the size of the molecule. Ageneralized diagram explaining the principle of gelelectrophoresis for analyzing and sizing proteinsis presented in Fig. 35–11.
ARNE W.K. TISELIUS (LT, 1902-1971)
Tiselius, a Swedish physicalbiochemist, won the 1948Nobel Prize in Chemistryfor the discovery of proteinsinblood serum and for thedevelopment of electro-phoresis as a technique forstudying proteins.
Contents
BIOCHEMICAL TECHNIQUES 1041
Electrophoresis apparatus. Tiselius electrophoresis apparatus consists of compartmented cellsforming a U tube, connected to an anode and a cathode compartment. The protein solution is placedat the bottom of the U tube. The U tube is kept immersed in a water bath at 4°C to minimize convectioncurrents and the movement of the proteins is visualized by a Schlieren optical system.
Pattern before electrophoresis
Buffer
Samples
Gel
Buffer( )a
Pattern after electrophoresis
Buffer
( )b
( )c ( )d
Direction ofelectrophoresis
Myosin (2,00,000)
Phosphorylase (92,000)a
Bovine serum albumin (68,000)
Ovalbumin (43,000)
Glyceraldehyde-3-phosphatedehydrogenase (36,000)
Carbonic anhydrase (29,000)
Myoglobin (17,200)
Cytochrome (11,700)c
987654
3
2M
ole
cula
rw
eight
(10
)4
×
1
Distance traveled
0.2 0.4 0.6 0.8 1.0
Fig. 35–11. Gel electrophoresis for analyzing and sizing proteins
(a) Apparatus for slab-gel electrophoresis. Samples are layered in the little slots cut in the top of the gel slab.Buffer is carefully layered over the samples, and a voltage is applied to the gel for a period of usually 1-4 h.
(b) After this time, the proteins have moved into the gel at a distance proportional to their electrophoreticmobility. The pattern shown indicates that different samples were layered in each slot.
(c) Results obtained when a mixture of proteins was layered at the top of the gel in phosphate buffer, pH 7.2,containing 0.2% SDS. After electrophoresis, the gel was removed from the apparatus and stained withCoomassie Blue. The protein and its molecular weight are indicated next to each of the stained bands.
(d) The logarithm of the molecular weight against the mobility (distance traveled) shows an approximatelylinear relationship.
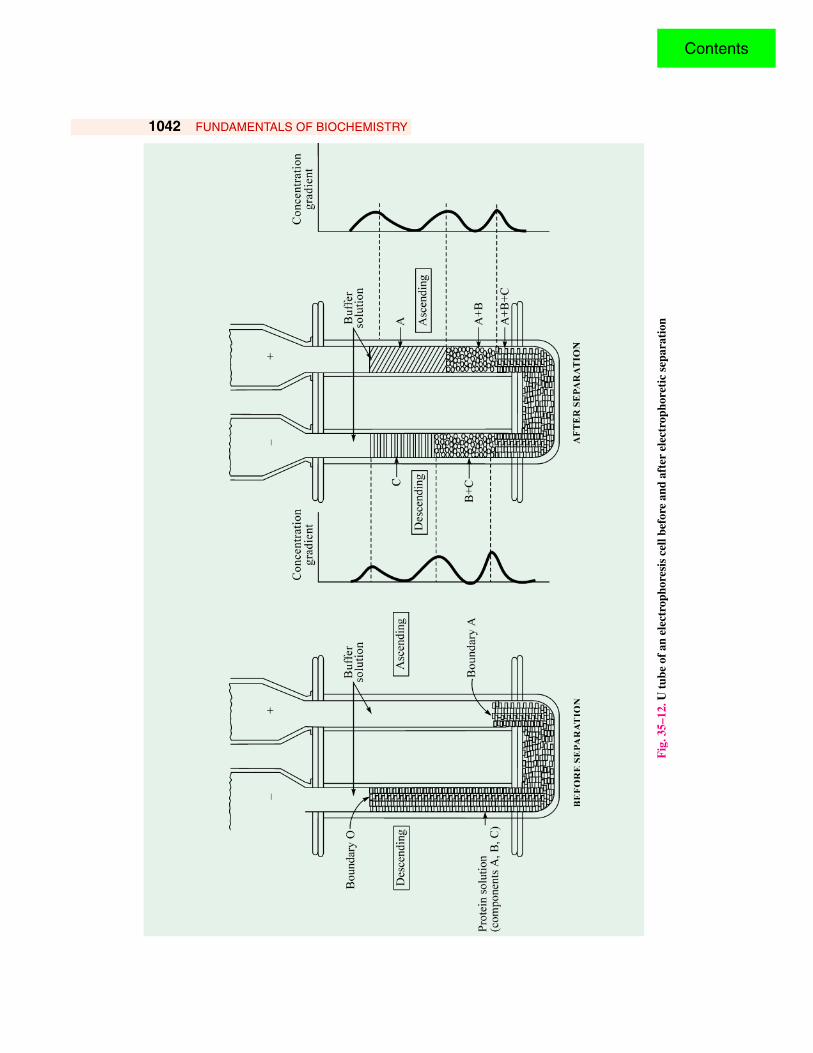
(Source: Data of K Weber and M Osborn)Consider that the protein solution is composed of 3 components, A, B and C and that these
components carry charges of the same sign (either + or –) but of different magnitude. Before theelectric field is applied, the solution will be homogeneous from ascending boundary to descendingboundary. On the flow of current, the 3 components will separate. If the magnitude of the electriccharge is in the order A > B > C, the components will separate as shown in Fig. 35–12. The fastermoving component A will be present in pure form in the ascending boundary, as will C in thedescending boundary. The component B will, however, always be mixed with A or with C. The rateof migration of the protein is measured by observing the movement of the boundary as a function oftime. During electrophoretic migration, the concentration gradients will be set up at the boundaries.These gradients can be measured by optical systems since most of the proteins are colourless. Migrationof coloured proteins like hemoglobin is, however, readily observed. The method described above isusually referred to as free boundary electrophoresis or simply free electrophoresis (i.e., in freesolution).
Contents
1042 FUNDAMENTALS OF BIOCHEMISTRY
Fig
. 35–
12. U
tube
of a
n el
ectr
opho
resi
s ce
ll be
fore
and
aft
er e
lect
roph
oret
ic s
epar
atio
n
Contents
BIOCHEMICAL TECHNIQUES 1043
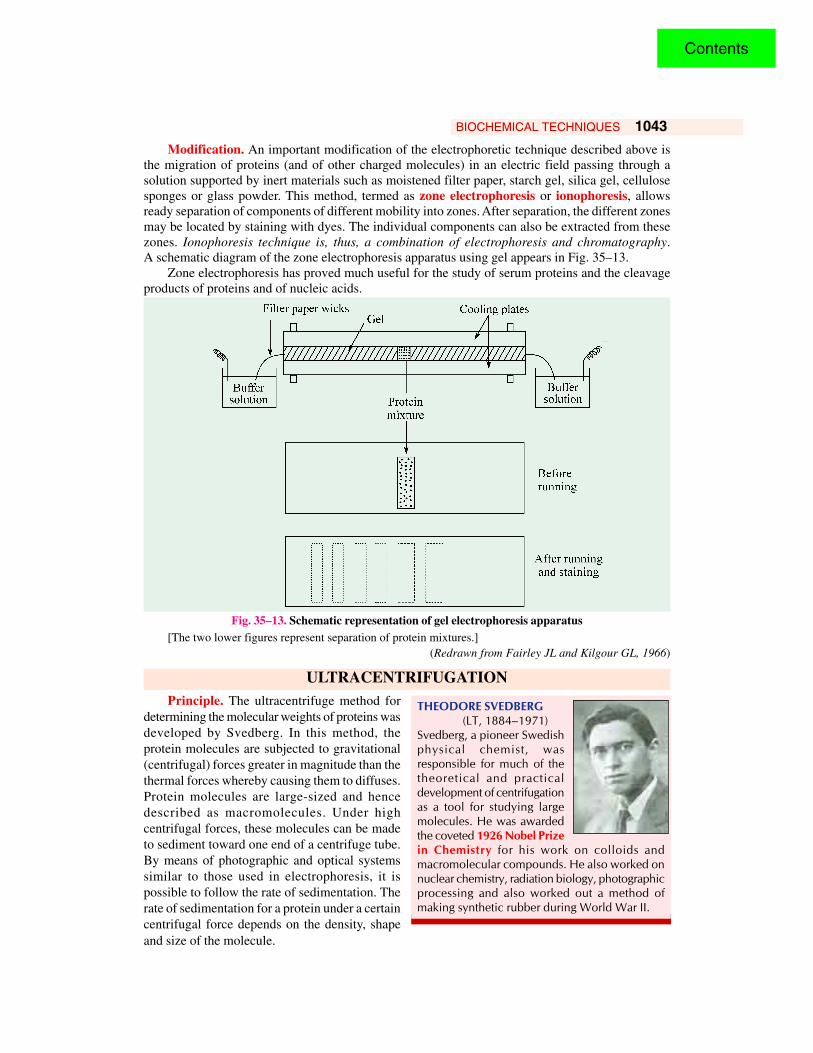
Modification. An important modification of the electrophoretic technique described above isthe migration of proteins (and of other charged molecules) in an electric field passing through asolution supported by inert materials such as moistened filter paper, starch gel, silica gel, cellulosesponges or glass powder. This method, termed as zone electrophoresis or ionophoresis, allowsready separation of components of different mobility into zones. After separation, the different zonesmay be located by staining with dyes. The individual components can also be extracted from thesezones. Ionophoresis technique is, thus, a combination of electrophoresis and chromatography.A schematic diagram of the zone electrophoresis apparatus using gel appears in Fig. 35–13.
Zone electrophoresis has proved much useful for the study of serum proteins and the cleavageproducts of proteins and of nucleic acids.
Fig. 35–13. Schematic representation of gel electrophoresis apparatus[The two lower figures represent separation of protein mixtures.]
(Redrawn from Fairley JL and Kilgour GL, 1966)
ULTRACENTRIFUGATIONPrinciple. The ultracentrifuge method for
determining the molecular weights of proteins wasdeveloped by Svedberg. In this method, theprotein molecules are subjected to gravitational(centrifugal) forces greater in magnitude than thethermal forces whereby causing them to diffuses.Protein molecules are large-sized and hencedescribed as macromolecules. Under highcentrifugal forces, these molecules can be madeto sediment toward one end of a centrifuge tube.By means of photographic and optical systemssimilar to those used in electrophoresis, it ispossible to follow the rate of sedimentation. Therate of sedimentation for a protein under a certaincentrifugal force depends on the density, shapeand size of the molecule.
THEODORE SVEDBERG (LT, 1884–1971)Svedberg, a pioneer Swedishphysical chemist, wasresponsible for much of thetheoretical and practicaldevelopment of centrifugationas a tool for studying largemolecules. He was awardedthe coveted 1926 Nobel Prizein Chemistry for his work on colloids andmacromolecular compounds. He also worked onnuclear chemistry, radiation biology, photographicprocessing and also worked out a method ofmaking synthetic rubber during World War II.
Contents

1044 FUNDAMENTALS OF BIOCHEMISTRY
The fundamental equation, devised by Svedberg, for the molecular weight (M) of a protein is :
M =RTs
D (1 - Vp)
where, R = gas constantT = absolute temperatures = sedimentation constant
D = diffusion constant in cm2/secV = partial specific volume of the proteinp = density of the solvent.
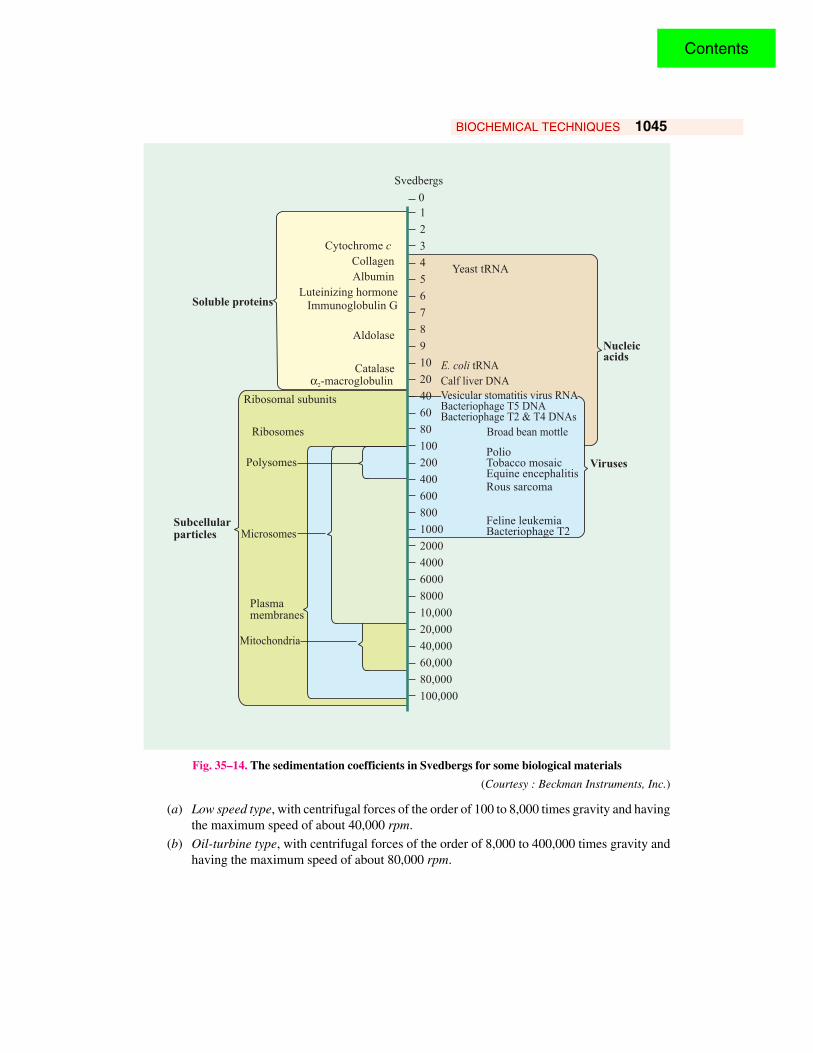
The rate of sedimentation is usually expressed in terms of sedimentation constant, s which hasthe dimensions of time per unit of gravitational field and which usually lies between 1 × 10–13 and200 × 10–13 sec. For convenience, the sedimentation constant of 1 × 10–13 is referred to as 1 Svedbergunit (S) and all sedimentation constants are then expressed in Svedberg units. A Svedberg unit is,thus, defined as the velocity of sedimenting molecule per unit of gravitational field or 1 × 10–13 cm/sec/dyne/g. The S value of an organelle or macromolecule is related to its molecular weight andshape. Typical S values are 1.83 for cytochrome c, 4.4 for bovine serum albumin and 185 for TMV.For the sake of uniformity, the sedimentation coefficient is customarily corrected to the value thatwould be obtained at 20 ºC in a solvent with the density and viscosity of pure water. This issymbolized S20, W. Table 35-4 and Fig. 35-14 indicate the values of S20,W Svedbergs for a variety ofbiological materials.
Table 35–4. Physical constants of some proteins
Protein Molecular Partial specific Sedimentationmass volume, V20,W coefficient, S20,W(kD) (cm3. g-1) (S)
Lipase (milk) 6.7 0.714 1.14
Ribonuclease A (bovine pancreas) 12.6 0.707 2.00
Cytochrome c (bovine heart) 13.4 0.728 1.71
Myoglobin (horse heart) 16.9 0.741 2.04
α-chymotrypsin (bovine pancreas) 21.6 0.736 2.40
Diphtheria toxin 70.4 0.736 4.60
Cytochrome oxidase (P. aeruginosa) 89.8 0.730 5.80
Lactate dehydrogenase H (chicken) 150 0.740 7.31
Catalase (horse liver) 222 0.715 11.20
Fibrinogen (human) 340 0.725 7.63
Glutamate dehydrogenase (bovine liver) 1015 0.750 26.60
Turnip yellow mosaic virus protein 3013 0.740 48.80
(Adapted from Smith MH, 1970)
The diffusion coefficient or constant D may be defined as the quantity of material that diffusesper second across a surface 1 cm2 in area. The partial specific volume V is equal to the reciprocal ofthe density of the molecule. For most proteins, however, the value of V is in the range of 0.70 to 0.75.
Ultracentrifuge. Using the above principle, Svedberg in 1925 devised an instrument calledultracentrifuge (Figs. 35-15 and 35-16). By this instrument, it is possible to get information on thepurity of a protein, its, molecular weight and approximate dimensions. Two types of ultracentrifugesare now known :
Contents
BIOCHEMICAL TECHNIQUES 1045
1
2
3
4
5
6
7
8
9
10
20
40
60
80
100
200
400
600
800
1000
2000
4000
6000
8000
10,000
20,000
40,000
60,000
80,000
100,000
Svedbergs
Cytochrome c
Collagen
Albumin
Luteinizing hormone
Aldolase
Soluble proteins
-macroglobulin�2
Immunoglobulin G
Catalase
Yeast tRNA
VirusesPolioTobacco mosaicEquine encephalitisRous sarcoma
Feline leukemiaBacteriophage T2
Ribosomal subunits
Ribosomes
Polysomes
MicrosomesSubcellularparticles
Plasmamembranes
Mitochondria
Nucleicacids
Vesicular stomatitis virus RNABacteriophage T5 DNABacteriophage T2 & T4 DNAs
E. coli tRNA
0
Calf liver DNA
Broad bean mottle
Fig. 35–14. The sedimentation coefficients in Svedbergs for some biological materials
(Courtesy : Beckman Instruments, Inc.)
(a) Low speed type, with centrifugal forces of the order of 100 to 8,000 times gravity and havingthe maximum speed of about 40,000 rpm.
(b) Oil-turbine type, with centrifugal forces of the order of 8,000 to 400,000 times gravity andhaving the maximum speed of about 80,000 rpm.
Contents

1046 FUNDAMENTALS OF BIOCHEMISTRY
Lightsource
Light absorption record
Direction of sedimentation
Min
ute
saf
ter
reac
hin
gsp
eed
22
12
2
Opticalanalyzer
Film
Driveshaft
Rotor
Samplecell
Counter-balancingcell
( )a ( )b
Fi.g 35–15. Apparatus for analytical ultracentrifugation(a) The centrifuge rotor and method of making optical measurements.
(b) The optical recordings as a function of certifugation time. As the light-absorbing molecule sediments,the solution becomes transparent.
Fi.g 35–16. Centre section of ultracentrifuge cell[The solute molecules which are initially evenly distributed are forced towards the botom of the cell by thecentrifugal force. This migration creates at the top of the cell a region that is without solute molecules andcontains only solvent molecules. A boundary is set up in the cell between solvent and solution in whichconcentration varies with the distance from the axis of rotation. The measurement of boundary movement whichrepresents its movement of protein molecules, is the basis of analytical ultracentrifugation.]
(Courtesy : Beckman Instruments, Inc.)
Contents
BIOCHEMICAL TECHNIQUES 1047
REFRENCES1. Alexander P, Lundgren HP : A Laboratory Manual of Analytical Methods of Protein
Chemistry. Vols. 1–5, Pergamon Press, Oxford. 1966–69.2. Andrews AT : Electrophoresis : Theory, Techniques and Biochemical and Clinical
Applications. 2 nd ed. Clarendon Press, Oxford (U.K.). 1986.3. Bailey JL : Techniques in Protein Chemistry. 2nd ed. Elsevier, Amsterdam. 1967.4. Bergmeyer HU : Principles of Enzymatic Analysis. Verlag Chemie. New York. 1978.5. Bier M (editor) : Electrophoresis : Theory, Methods and Applications. Vols. I and II.
Academic Press, Inc., New York. 1958, 1967.6. Bowen TJ : An Introduction to ultracentrifugation. Wiley-Interscience. New York. 1970.7. Bragg L : X-ray Crystallography. Sci. Amer., 219 : 58, 1968.8. Bruening G, Criddle R, Preiss J, Rudert F : Biochemical Experiment. Wiley-Interscience,
New York. 1970.9. Campbell ID, Dwek RA : Biological Spectroscopy. Benjamin/cummings, Menlo Park. 1984.
10. Chaykin S : Biochemistry Laboratory Techniques. Wiley Eastern Private Ltd., New Delhi.1970.
11. Cooper TG : The Tools of Biochemistry. Wiley, New York. 1977.12. Determan H: Gel Chromatography. Springer-Verlag, Berlin. 1969.13. Dayl Z : Separation Methods. Elsevier, Amsterdam. 1984.14. Frais F : Practical Biochemistry. Butter Worths, London. 1972.15. Francis GE, Mulligan W, Wormall A : Isotopic Tracers. The Athlone Press, London.
1954.16. Giddings JC, Keller RA (editors) : Advances in Chromatography. 8 vols., Marcel Dekker,
Inc., New York. 1966-1969.17. Grossman L, Moldave K : Methods in Enzymology. Vol. 12–Nucleic Acids. Academic
Press, Inc., New York. 1968.18. Harborne JB : Phytochemical Methods. Ist ed., Chapman and Hall, London. 1973.19. Heftmann E (editor) : Chromatography. 2nd ed., Reinhold Publishing Corp., New York.
1967.20. Hudson L, Hay PC : Practical Immunology. Blackwell Scientific Publications, Oxford.
1980.21. James A, Prichard M : Practical Physical Chemistry. 3rd ed., Longmans, London. 1975.22. Kates M : Techniques in Lipidology. North Holland, Amsterdam. 1972.23. Morris C, Morris P : Separation Methods in Biochemistry, Pitman, London. 1963.24. Parish JH : Principles and Practice of Experiments with Nucleic Acids. Longmans, London.
1972.25. Plummer DT : An Introduction to Practical Biochemistry. 3rd ed., McGraw-Hill, London.
1987.26. Schachman HK : Ultracentrifugation in Biochemistry. Academic Press, Inc., New York.
1959.27. Segel IH : Biochemical Calculations. John Wiley and Sons, Inc., New York. 1968.28. Shaw DJ : Electrophoresis Academic Press, Inc., New York. 1969.29. Smith I : Chromatographic and Electrophoretic Techniques. 4th ed., Vol. I –Chromatography.
Vol II– Electrophoresis. William Heinemann Ltd., London. 1976.30. Stahl E : Thin-layer Chromatography. A Laboratory Handbook. 2nd ed., Springer-Verlag,
Berlin. 1969.31. Stein WH, Moore S : Chromatography. Sci. Amer. 184 (3) : 35, 1951.32. Svedberg T, Pedersen KO : The Ultracentrifuge. Oxford Univ. Press., New York. 1940.33. Touchstone JC : Practice of Thin Layer Chromatography. Wiley-Interscience. 1978.
Contents

1048 FUNDAMENTALS OF BIOCHEMISTRY
34. Umbreit WW, Burris RH, Stauffer JF : Manometric Techniques and Related Methods forthe Study of Tissue Metabolism. 4th ed., Burgess Publishing Co., Minneapolis. 1964.
35. Van Holde, KE : Physical Biochemistry. 2nd ed., Englewood Cliffs, N. J., 1971.36. Wang CH, Wills DL : Radiotracer Methodology in Biological Science. Prentice-Hall, New
Jersey. 1965.37. Wilson K, Goulding KH (editors) : A Biologist's Guide to Principles and Techniques of
Practical Biochemistry. 3rd ed., Edward Arnold (Publisher’s) Ltd., London. 1986.38. Williams VR, Williams HB : Basic Physical Chemistry for the Life Sciences. W.H. Freeman
and Co., San Francisco. 1967.
PROBLEMS1. The absorbance A of a solution is defined as
A = log10 (I0/I)in which I0 is the incident light intensity and I is the transmitted light intensity. The absorbanceis related to the molar absorption coefficient (extinction coefficient) ∈ (in M−1 cm−1),concentration c (in M), and path length l (in cm) by
A = ∈lcThe absorption coefficient of myoglobin at 580 nm is 15,000 M−1 cm−1. What is theabsorbance of a 1 mg ml−1 solution across a 1-cm path ? What percentage of the incidentlight is transmitted by this solution ?
2. Tropomyosin, a 93-kd muscle protein, sediments more slowly than does hemoglobin(65 kd). Their sedimentation coefficients are 2.6S and 4.31S, respectively. Which structuralfeature of tropomyosin accounts for its slow sedimentation ?
3. The relative electrophoretic mobilities of a 30-kd protein and a 92-kd protein used as standardson an SDS-polyacrylamide gel are 0.80 and 0.41, respectively. What is the apparent mass ofa protein having a mobility of 0.62 on this gel ?
4. Suppose that an enzyme is dissociated into 4 identical subunits and that you want to test forthe enzymatic activity of the individual subunits. However, you must be sure that there areno tetramers remaining in the sample.(a) What chromatographic procedure would you choose to free the monomers from the
tetramers ?(b) How would you know where the tetramer would be if it were present ?
5. The density of DNA in CsCl is approximately 1.7 g/cm3 and that of most proteins isapproximately 1.3 g/cm3. What would you expect to be the density of a typical bacteriophagewhich is 50% protein and 50% DNA ?
6. A solution of a substance at a concentration of 32 µg/ml, having a MW of 423, has anabsorbance of 0.27 at 540 nm measured with a 1-cm light path. What is the molar extinctioncoefficient at 540 nm, assuming that Beer’s law is obeyed at an absorbance of 0.27 ?
7. Details of the citric acid cycle were worked out by the use of :(a) x-ray crystallography(b) radioactive carbon compounds(c) ultracentrifugation(d) electron microscopy
8. In two-dimensional chromatography and electrophoresis, such as is employed in finger-printing technique, does it matter which is done first ? Explain.
9. A mixture of proteins is subjected to electrophoresis in 3 polyacrylamide gels, each havinga different pH value. In each gel five bands are seen.(a) Can one reasonably conclude that there are only 5 proteins in the mixture. Explain.(b) Would the conclusion be different if a mixture of DNA fragments was being studied ?
Contents