Embed Size (px)
Citation preview
ReseaRch aRticle
VHL Deficiency Drives Enhancer Activation of Oncogenes in Clear Cell Renal Cell Carcinoma Xiaosai Yao1,2, Jing Tan3,4, Kevin Junliang Lim5, Joanna Koh1, Wen Fong Ooi1, Zhimei Li3, Dachuan Huang3, Manjie Xing1,5,6, Yang Sun Chan1, James Zhengzhong Qu1, Su Ting Tay5, Giovani Wijaya3, Yue Ning Lam1, Jing Han Hong5, Ai Ping Lee-Lim1, Peiyong Guan3, Michelle Shu Wen Ng2, Cassandra Zhengxuan He1, Joyce Suling Lin1, Tannistha Nandi1, Aditi Qamra1,7, Chang Xu5,8, Swe Swe Myint3, James O. J. Davies9, Jian Yuan Goh1, Gary Loh1, Bryan C. Tan10, Steven G. Rozen5, Qiang Yu1, Iain Bee Huat Tan1,11, Christopher Wai Sam Cheng12, Shang Li5, Kenneth Tou En Chang13, Puay Hoon Tan14, David Lawrence Silver9, Alexander Lezhava15, Gertrud Steger16, Jim R. Hughes9, Bin Tean Teh2,3,5,8,17, and Patrick Tan1,5,8,17
15-CD-17-0375_p1284-1305.indd 1284 10/23/17 2:18 PM
Research. on May 13, 2020. © 2017 American Association for Cancercancerdiscovery.aacrjournals.org Downloaded from
Published OnlineFirst September 11, 2017; DOI: 10.1158/2159-8290.CD-17-0375
November 2017 CANCER DISCOVERY | 1285
aBstRact Protein-coding mutations in clear cell renal cell carcinoma (ccRCC) have been exten-sively characterized, frequently involving inactivation of the von Hippel– Lindau ( VHL )
tumor suppressor. Roles for noncoding cis -regulatory aberrations in ccRCC tumorigenesis, however, remain unclear. Analyzing 10 primary tumor/normal pairs and 9 cell lines across 79 chromatin profi les, we observed pervasive enhancer malfunction in ccRCC, with cognate enhancer-target genes associated with tissue-specifi c aspects of malignancy. Superenhancer profi ling identifi ed ZNF395 as a ccRCC-specifi c and VHL-regulated master regulator whose depletion causes near-complete tumor elimination in vitro and in vivo . VHL loss predominantly drives enhancer/superenhancer deregulation more so than promoters, with acquisition of active enhancer marks (H3K27ac, H3K4me1) near ccRCC hallmark genes. Mechanistically, VHL loss stabilizes HIF2α–HIF1β heterodimer binding at enhancers, subsequently recruiting histone acetyltransferase p300 without overtly affecting preexisting promoter–enhancer interactions. Subtype-specifi c driver mutations such as VHL may thus propagate unique pathogenic dependencies in ccRCC by modulating epigenomic landscapes and cancer gene expression.
SIGnIFICAnCE: Comprehensive epigenomic profi ling of ccRCC establishes a compendium of somati-cally altered cis -regulatory elements, uncovering new potential targets including ZNF395, a ccRCC master regulator. Loss of VHL , a ccRCC signature event, causes pervasive enhancer malfunction, with binding of enhancer-centric HIF2α and recruitment of histone acetyltransferase p300 at preexisting lineage-specifi c promoter–enhancer complexes. Cancer Discov; 7(11); 1284–305. ©2017 AACR.
See related commentary by Ricketts and Linehan, p. 1221.
1 Cancer Therapeutics and Stratifi ed Oncology, Genome Institute of Singapore, Singapore. 2 Institute of Molecular and Cell Biology, Singapore. 3 Laboratory of Cancer Epigenome, Department of Medical Sciences, National Cancer Centre, Singapore. 4 State Key Laboratory of Oncology in South China, Sun Yat-Sen University Cancer Center, Guangzhou, China. 5 Cancer and Stem Cell Biology Program, Duke-NUS Medical School, Sin-gapore. 6 NUS Graduate School for Integrative Sciences and Engineering, National University of Singapore, Singapore. 7 Department of Physiol-ogy, Yong Loo Lin School of Medicine, National University of Singapore, Singapore. 8 Cancer Science Institute of Singapore, National University of Singapore, Singapore. 9 Medical Research Council (MRC) Molecular Haematology Unit, Weatherall Institute of Molecular Medicine, Oxford University, United Kingdom. 10 Cardiovascular and Metabolic Disorders Programme, Duke-NUS Medical School, Singapore. 11 Division of Medi-cal Oncology, National Cancer Centre Singapore, Singapore. 12 Depart-ment of Urology, Singapore General Hospital, Singapore. 13 Department of Pathology and Laboratory Medicine, KK Women’s and Children’s Hos-pital, Singapore. 14 Department of Pathology, Singapore General Hospital,
iNtRODUctiON
Clear cell renal cell carcinoma (ccRCC) is the most com-mon subtype of kidney cancer, with 338,000 new cases in 2012 worldwide ( 1 ). With most ccRCCs being radiochemoresistant, patients with metastatic ccRCC exhibit dismal 8% fi ve-year overall survival ( 2 ). Although targeted therapies inhibiting angiogenesis and mTOR pathways can lead to initial tumor control, most patients develop resistance in less than a year ( 3, 4 ). A better understanding of ccRCC molecular dependen-cies and vulnerabilities is thus needed to develop new therapeu-tic strategies for patients who fail standard-of-care treatment.
Loss of the von Hippel–Lindau ( VHL ) tumor suppressor is a defi ning feature of ccRCC ( 5, 6 ). When partnered with inactivation of additional tumor suppressors ( Pbrm1, Bap1, Trp53, Rb1, and/or Cdkn2a ) and/or activation of oncogenes
Singapore. 15 Translational Research, Genome Institute of Singapore, Singapore. 16 Institute of Virology, University of Cologne, Fuerst-Pueckler-Strasse, Cologne, Germany. 17 SingHealth/Duke-NUS Institute of Precision Medicine, National Heart Centre Singapore, Singapore . note: Supplementary data for this article are available at Cancer Discovery Online (http://cancerdiscovery.aacrjournals.org/). X. Yao, J. Tan, and K.J. Lim contributed equally to this article. Corresponding Authors: Patrick Tan, Duke-NUS Medical School, 8 Col-lege Road, Singapore 169857, Singapore. Phone: 65-6516-1783; Fax: 65-6221-2402; E-mail: [email protected] ; and Bin Tean Teh, Duke-NUS Medical School , 8 College Road, Singapore 169857, Singapore. Phone: 65-6601-1324; Fax: 65-6221-2402; E-mail: teh.bin.tean@ singhealth.com.sg doi: 10.1158/2159-8290.CD-17-0375 ©2017 American Association for Cancer Research.
( Myc ), Vhl loss drives spontaneous ccRCC formation in mouse models ( 7–11 ). VHL encodes an E3 ubiquitin ligase ( 12, 13 ) that targets HIF1α ( HIF1A ) and HIF2α ( EPAS1 ) for degrada-tion ( 14, 15 ). VHL loss in ccRCC results in constitutive activa-tion of HIF1/2α and subsequent transactivation ( 16, 17 ) of downstream genes regulating angiogenesis, glycolysis ( 18 ), lipogenesis ( 19, 20 ), cell cycle ( 21 ), and antiapoptosis ( 22 ).
Most reports studying VHL/HIF transcriptional activation have focused on HIF-bound promoters ( 23–28 ). However, recent evidence suggests an emerging role for distal enhancer elements in VHL/HIF transcriptional control ( 29, 30 ). For example, HIF2α-bound distal enhancers activate the proto-oncogenes MYC ( 31 ) and CCND1 ( 21 ) and coincide with ccRCC genetic risk alleles. Nevertheless, such studies focused on individual enhancers, and the majority of distal elements in ccRCC remain largely unexplored.
15-CD-17-0375_p1284-1305.indd 1285 10/23/17 2:18 PM
Research. on May 13, 2020. © 2017 American Association for Cancercancerdiscovery.aacrjournals.org Downloaded from
Published OnlineFirst September 11, 2017; DOI: 10.1158/2159-8290.CD-17-0375
Yao et al.RESEARCH ARTICLE
1286 | CANCER DISCOVERY November 2017 www.aacrjournals.org
Delineating the global ccRCC cis-regulatory landscape may also identify master regulators involved in tissue-specific disease processes. Compared with promoters that are largely cell-type invariant, distal enhancers integrate multiple line-age- and context-dependent signals, catering to the special-ized needs of diverse cell types and diseases (32, 33). In cancer, such master regulators are frequently located near “super-enhancers” or “stretch-enhancers” marked by long stretches of H3K27ac signals (34, 35). For example, subtype-specific genomic alterations such as EGFRvIII in glioblastoma (36) and EWS–FLI in Ewing sarcoma (37) induce de novo enhanc-ers, causing reactivation of developmental master regula-tors required for self-renewal and lineage specification (36). Although VHL inactivation has been shown to modulate protein levels of different histone modifiers (e.g., KDM5C/JARID1C, ref. 38; HDAC1, ref. 39; JMJD1A, ref. 40; JMJD2B, ref. 40; JMJD2C, ref. 41), the impact of these protein altera-tions at specific epigenomic loci remains unclear. Moreover, previous studies profiling histone modifications in ccRCCs have also been limited by small sample sizes (2 cases; ref. 42), reliance on in vitro systems, and the lack of long-range inter-actome data and functional enhancer testing to accurately assign cognate enhancer targets.
In this study, we establish the most comprehensive collec-tion of ccRCC histone profiles to date, annotating the pre-cise genomic locations of altered promoters, enhancers, and superenhancers in ccRCC. Using isogenic cell lines with or without wild-type VHL, we further demonstrate that besides its well-defined role in oxygen sensing, VHL also safeguards the chromatin landscape; its loss induces tumor-specific enhancer gains around ccRCC hallmark genes such as angiogenic and metabolic targets through the stabilization of HIF2α/HIF1β (ARNT) heterodimers and recruitment of p300 histone acetyl-transferase (EP300). One important target of epigenetic activa-tion is ZNF395, a master regulator of ccRCC tumorigenesis. Taken collectively, our results reveal an epigenetic framework by which the major ccRCC-specific driver mutation, VHL, induces de novo enhancers, contributing to oncogenic transcription.
ResUltsCis-Regulatory Landscapes in ccRCC Tumors Are Aberrant
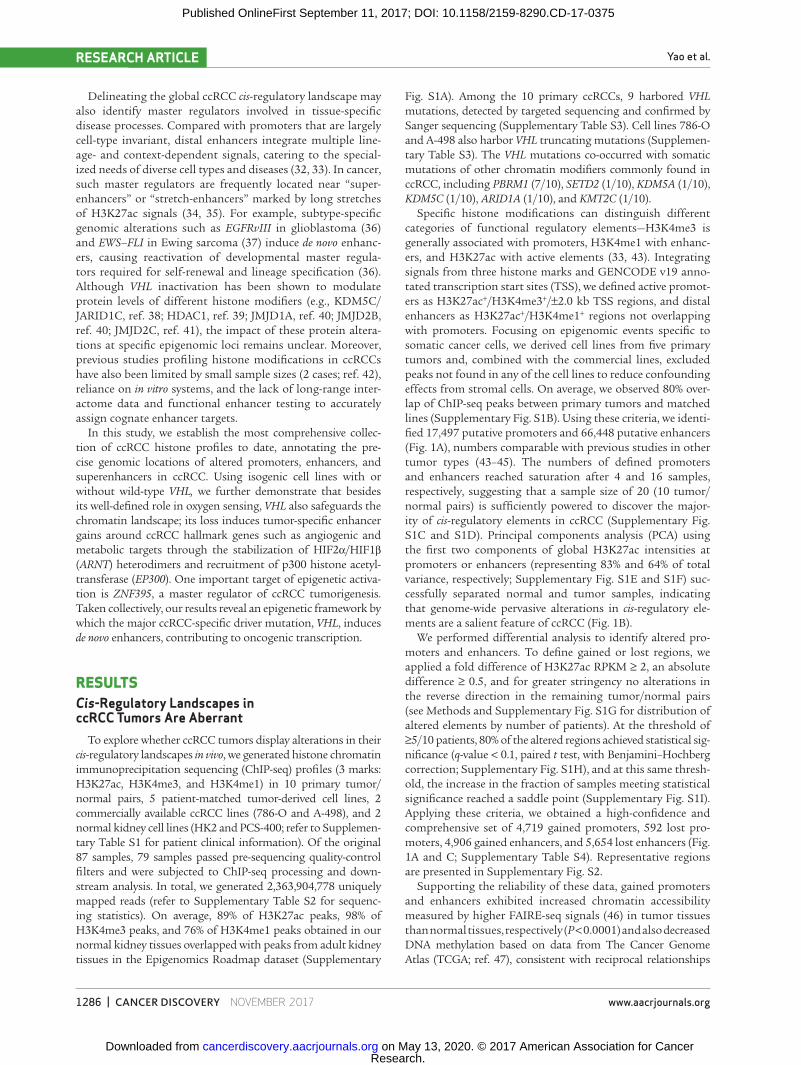
To explore whether ccRCC tumors display alterations in their cis-regulatory landscapes in vivo, we generated histone chromatin immunoprecipitation sequencing (ChIP-seq) profiles (3 marks: H3K27ac, H3K4me3, and H3K4me1) in 10 primary tumor/normal pairs, 5 patient-matched tumor-derived cell lines, 2 commercially available ccRCC lines (786-O and A-498), and 2 normal kidney cell lines (HK2 and PCS-400; refer to Supplemen-tary Table S1 for patient clinical information). Of the original 87 samples, 79 samples passed pre-sequencing quality-control filters and were subjected to ChIP-seq processing and down-stream analysis. In total, we generated 2,363,904,778 uniquely mapped reads (refer to Supplementary Table S2 for sequenc-ing statistics). On average, 89% of H3K27ac peaks, 98% of H3K4me3 peaks, and 76% of H3K4me1 peaks obtained in our normal kidney tissues overlapped with peaks from adult kidney tissues in the Epigenomics Roadmap dataset (Supplementary
Fig. S1A). Among the 10 primary ccRCCs, 9 harbored VHL mutations, detected by targeted sequencing and confirmed by Sanger sequencing (Supplementary Table S3). Cell lines 786-O and A-498 also harbor VHL truncating mutations (Supplemen-tary Table S3). The VHL mutations co-occurred with somatic mutations of other chromatin modifiers commonly found in ccRCC, including PBRM1 (7/10), SETD2 (1/10), KDM5A (1/10), KDM5C (1/10), ARID1A (1/10), and KMT2C (1/10).
Specific histone modifications can distinguish different categories of functional regulatory elements—H3K4me3 is generally associated with promoters, H3K4me1 with enhanc-ers, and H3K27ac with active elements (33, 43). Integrating signals from three histone marks and GENCODE v19 anno-tated transcription start sites (TSS), we defined active promot-ers as H3K27ac+/H3K4me3+/±2.0 kb TSS regions, and distal enhancers as H3K27ac+/H3K4me1+ regions not overlapping with promoters. Focusing on epigenomic events specific to somatic cancer cells, we derived cell lines from five primary tumors and, combined with the commercial lines, excluded peaks not found in any of the cell lines to reduce confounding effects from stromal cells. On average, we observed 80% over-lap of ChIP-seq peaks between primary tumors and matched lines (Supplementary Fig. S1B). Using these criteria, we identi-fied 17,497 putative promoters and 66,448 putative enhancers (Fig. 1A), numbers comparable with previous studies in other tumor types (43–45). The numbers of defined promoters and enhancers reached saturation after 4 and 16 samples, respectively, suggesting that a sample size of 20 (10 tumor/normal pairs) is sufficiently powered to discover the major-ity of cis-regulatory elements in ccRCC (Supplementary Fig. S1C and S1D). Principal components analysis (PCA) using the first two components of global H3K27ac intensities at promoters or enhancers (representing 83% and 64% of total variance, respectively; Supplementary Fig. S1E and S1F) suc-cessfully separated normal and tumor samples, indicating that genome-wide pervasive alterations in cis-regulatory ele-ments are a salient feature of ccRCC (Fig. 1B).
We performed differential analysis to identify altered pro-moters and enhancers. To define gained or lost regions, we applied a fold difference of H3K27ac RPKM ≥ 2, an absolute difference ≥ 0.5, and for greater stringency no alterations in the reverse direction in the remaining tumor/normal pairs (see Methods and Supplementary Fig. S1G for distribution of altered elements by number of patients). At the threshold of ≥5/10 patients, 80% of the altered regions achieved statistical sig-nificance (q-value < 0.1, paired t test, with Benjamini–Hochberg correction; Supplementary Fig. S1H), and at this same thresh-old, the increase in the fraction of samples meeting statistical significance reached a saddle point (Supplementary Fig. S1I). Applying these criteria, we obtained a high-confidence and comprehensive set of 4,719 gained promoters, 592 lost pro-moters, 4,906 gained enhancers, and 5,654 lost enhancers (Fig. 1A and C; Supplementary Table S4). Representative regions are presented in Supplementary Fig. S2.
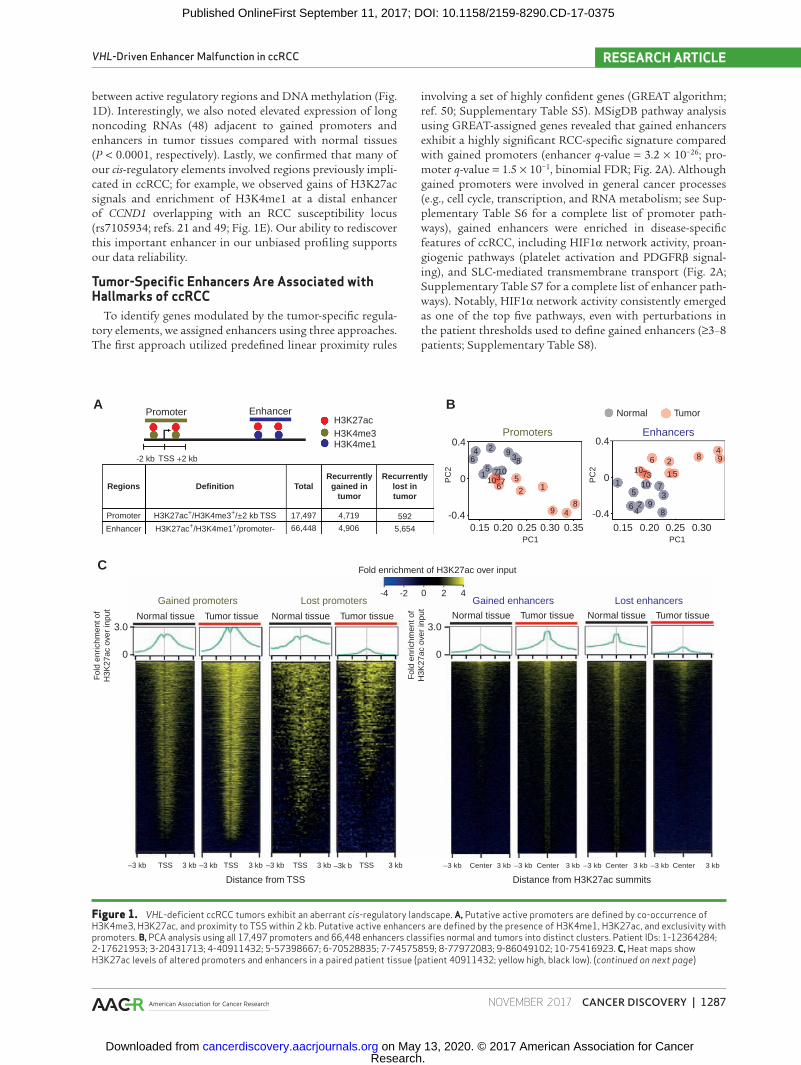
Supporting the reliability of these data, gained promoters and enhancers exhibited increased chromatin accessibility measured by higher FAIRE-seq signals (46) in tumor tissues than normal tissues, respectively (P < 0.0001) and also decreased DNA methylation based on data from The Cancer Genome Atlas (TCGA; ref. 47), consistent with reciprocal relationships
15-CD-17-0375_p1284-1305.indd 1286 10/23/17 2:18 PM
Research. on May 13, 2020. © 2017 American Association for Cancercancerdiscovery.aacrjournals.org Downloaded from
Published OnlineFirst September 11, 2017; DOI: 10.1158/2159-8290.CD-17-0375
VHL-Driven Enhancer Malfunction in ccRCC RESEARCH ARTICLE
November 2017 CANCER DISCOVERY | 1287
Figure 1. VHL-deficient ccRCC tumors exhibit an aberrant cis-regulatory landscape. A, Putative active promoters are defined by co-occurrence of H3K4me3, H3K27ac, and proximity to TSS within 2 kb. Putative active enhancers are defined by the presence of H3K4me1, H3K27ac, and exclusivity with promoters. B, PCA analysis using all 17,497 promoters and 66,448 enhancers classifies normal and tumors into distinct clusters. Patient IDs: 1-12364284; 2-17621953; 3-20431713; 4-40911432; 5-57398667; 6-70528835; 7-74575859; 8-77972083; 9-86049102; 10-75416923. C, Heat maps show H3K27ac levels of altered promoters and enhancers in a paired patient tissue (patient 40911432; yellow high, black low). (continued on next page)
A
C
Promoter H3K27ac+/H3K4me3+/±2 kb TSS
H3K27ac+/H3K4me1+/promoter-
Regions Definition
Gained promoters Lost promoters Gained enhancers Lost enhancers
Normal tissue3.0
0
Normal tissue
Distance from TSS
Tumor tissue Tumor tissue Normal tissue Normal tissueTumor tissue Tumor tissue
Total
17,497 4,719 592
5,6544,906
Fold enrichment of H3K27ac over input
Fol
d en
richm
ent o
fH
3K27
ac o
ver
inpu
t
3.0
0.42
1
9
2
48
37
46
51 710
10 5
839
6
0.15 0.20 0.25 0.30 0.35
0
0
–3 kb TSS 3 kb –3 kb TSS 3 kb –3 kb TSS 3 kb –3k b TSS 3 kb
Distance from H3K27ac summits
–3 kb Center 3 kb –3 kb Center 3 kb –3 kb Center 3 kb –3 kb Center 3 kb
Fol
d en
richm
ent o
fH
3K27
ac o
ver
inpu
t
-4
-0.4
-2 0 2 4
66,448
Recurrentlygained in
tumor
Recurrentlylost intumor
Enhancer
H3K27acH3K4me3H3K4me1
-2 kb +2 kbTSS
B
PC
2
PC1
Promoters0.4
Normal Tumor
2
2
1
4
8
37
46
6
51
710
10
8
3
9
9
0.15 0.20 0.25 0.30
0
-0.4
PC
2
PC1
Enhancers
Promoter Enhancer
5
between active regulatory regions and DNA methylation (Fig. 1D). Interestingly, we also noted elevated expression of long noncoding RNAs (48) adjacent to gained promoters and enhancers in tumor tissues compared with normal tissues (P < 0.0001, respectively). Lastly, we confirmed that many of our cis-regulatory elements involved regions previously impli-cated in ccRCC; for example, we observed gains of H3K27ac signals and enrichment of H3K4me1 at a distal enhancer of CCND1 overlapping with an RCC susceptibility locus (rs7105934; refs. 21 and 49; Fig. 1E). Our ability to rediscover this important enhancer in our unbiased profiling supports our data reliability.
Tumor-Specific Enhancers Are Associated with Hallmarks of ccRCC
To identify genes modulated by the tumor-specific regula-tory elements, we assigned enhancers using three approaches. The first approach utilized predefined linear proximity rules
involving a set of highly confident genes (GREAT algorithm; ref. 50; Supplementary Table S5). MSigDB pathway analysis using GREAT-assigned genes revealed that gained enhancers exhibit a highly significant RCC-specific signature compared with gained promoters (enhancer q-value = 3.2 × 10⁻²⁶; pro-moter q-value = 1.5 × 10⁻¹, binomial FDR; Fig. 2A). Although gained promoters were involved in general cancer processes (e.g., cell cycle, transcription, and RNA metabolism; see Sup-plementary Table S6 for a complete list of promoter path-ways), gained enhancers were enriched in disease-specific features of ccRCC, including HIF1α network activity, proan-giogenic pathways (platelet activation and PDGFRβ signal-ing), and SLC-mediated transmembrane transport (Fig. 2A; Supplementary Table S7 for a complete list of enhancer path-ways). Notably, HIF1α network activity consistently emerged as one of the top five pathways, even with perturbations in the patient thresholds used to define gained enhancers (≥3–8 patients; Supplementary Table S8).
15-CD-17-0375_p1284-1305.indd 1287 10/23/17 2:18 PM
Research. on May 13, 2020. © 2017 American Association for Cancercancerdiscovery.aacrjournals.org Downloaded from
Published OnlineFirst September 11, 2017; DOI: 10.1158/2159-8290.CD-17-0375
Yao et al.RESEARCH ARTICLE
1288 | CANCER DISCOVERY November 2017 www.aacrjournals.org
Normal tissue
Normal tissue
Roadmap(Normal tissue)
Roadmap(Normal tissue)
Roadmap(Normal tissue)
Normal tissue
Normal tissue
Normal tissue
Normal tissue
Tumor tissue
Tumor tissue
Tumor tissue
Tumor tissue
Tumor tissue
Tumor tissue
Tumor derivedcell line
Tumor derivedcell line
Tumor derivedcell line
Chr11:69,196,493–69,539,519
H3K27ac
25
20
15
10
Rea
d co
vera
ge
5
0
6
5
4
3
Rea
d co
vera
ge
2
1
0
N T N T
120
100
80
60
40R
ead
cove
rage
20
0
N T
1.0
0.8
0.6
0.4
Bet
a va
lue
0.2
0
N T
Chromatinaccessibility
Gained promoters
IncRNADNA
methylation
H3K27ac
25
20
15
10
Rea
d co
vera
ge
5
0
6
5
4
3
Rea
d co
vera
ge
2
1
0
N T N T
120
100
80
60
40
Rea
d co
vera
ge
20
0
N T
1.0
0.8
0.6
0.4
Bet
a va
lue
0.2
0
N T
Chromatinaccessibility
Gained enhancers
IncRNADNA
methylation
Enhancer (known; ref. 21) Promoter
10,000
10,000
100
1000
1000
100
100
0
0
1000
1000
100
50
500
500
50
50
500
0
0
0
0
0
1
1
rs7105934
CCND1D E
RN
A-s
eqH
3K27
acR
ead
cove
rage
H3K
4me3
H3K
4me1
FAIR
E-s
eq
*** *** *** ***
***
***
***
***
Figure 1. (Continued) D, The H3K27ac levels, chromatin accessibility (FAIRE-seq), DNA methylation of gained promoters and enhancers, and gene expression of the nearest ccRCC lncRNA are compared between normal and tumor tissues. ***, P < 0.001, two-sided t test. E, Shown are tracks of histone ChIP-seq (H3K27ac, H3K4me1, and H3K4me3) and RNA sequencing (RNA-seq) at the CCND1 locus in a tumor–normal pair of patient 40911432. The histone ChIP-seq profiles of normal adult kidney tissue from the Epigenome Roadmap are displayed above the normal tissue generated by Nano-ChIP-seq for comparison. A cell line was derived from the tumor tissue, and its histone profile is displayed below its matching primary tissue. This enhancer is known to interact with the CCND1 promoter from a previous study (21) and is situated close to an RCC susceptibility SNP rs7105934 (49).
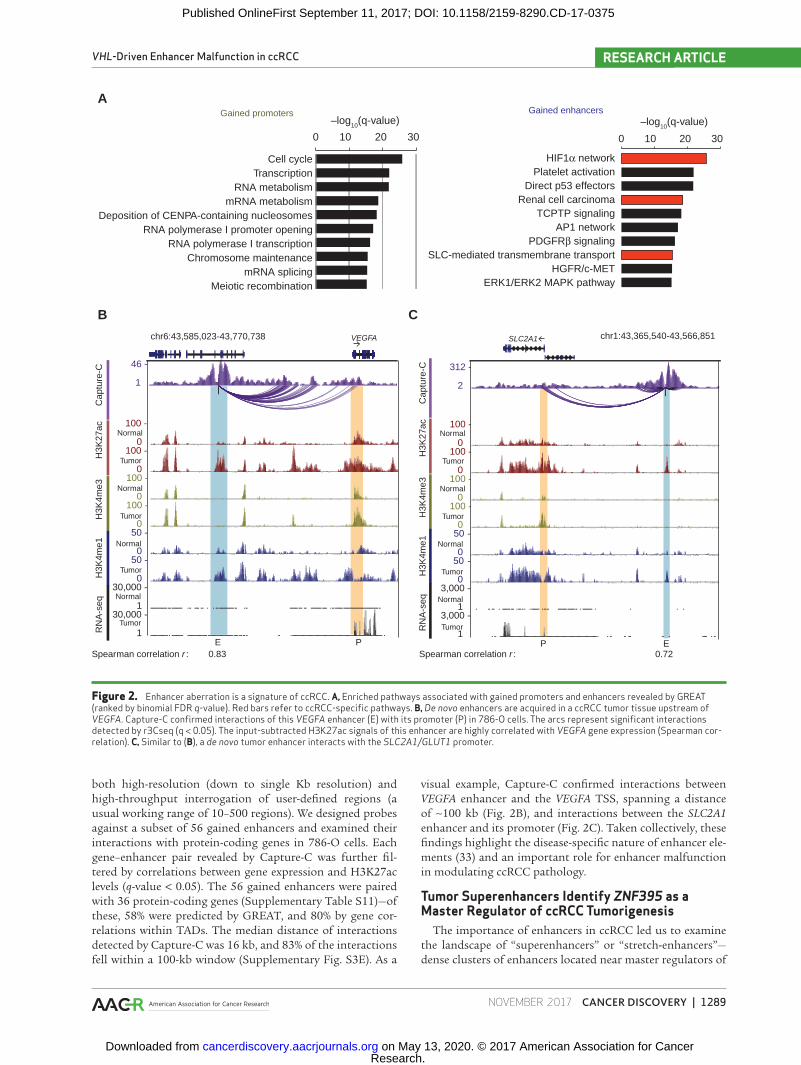
Individual genes associated with gained enhancers included well-known hypoxic targets (VEGFA, Fig. 2B; CXCR4) and metabolic genes involved in glycolysis, glutamine intake, and lipid storage (GLUT1/SLC2A1, Fig. 2C; HK2, PFKFB3, PLIN2, Supplementary Fig. S3A) and SLC38A1 (Supplemen-tary Fig. S3B; ref. 51). The presence of enhancers around met-abolic enzymes and transporters is largely consistent with the metabolic contexture of ccRCC, which involves increased gly-colysis and glutaminolysis (19, 52–55). Indeed, gene ontology (GO) analysis of gained enhancers strongly reflected hallmark metabolic changes associated with ccRCC, including mono-carboxylic acid transmembrane transporter activity (binomial FDR q-value = 1.6 × 10⁻¹⁰; Supplementary Fig. S3C).
We also used a second method of enhancer–gene assignment based on correlations between H3K27ac signals and expression of genes within the same topologic associated domain (TAD; ref. 34). Using a q-value of <0.05 based on Spearman correlation, we assigned 2,311 gained enhancers to 2,186 protein- coding
targets (Supplementary Table S9). Reassuringly, H3K27ac sig-nals of many gained enhancers were highly correlated with gene expression of their putative target genes. For example, H3K27ac levels of a VEGFA enhancer exhibited high correlation with VEGFA gene expression (r = 0.83, Spearman correlation), whereas H3K27ac signals of an SLC2A1 enhancer were highly correlated with SLC2A1 gene expression (r = 0.72, Spearman correla-tion; Fig. 2B; Supplementary Fig. S3D). Similar to the GREAT approach, the TAD correlation approach also highlighted hypoxia (Krieg_Hypoxia_not_via_KDM3A, FDR q-value = 7 × 10−120) and metabolism (Chen_Metabolic_Syndrome_ Network, FDR q-value = 2 × 10−91) as highly enriched pathways (Supplementary Table S10).
Third, to independent validate the GREAT and TAD approaches in the specific context of ccRCC, we experimen-tally explored the interactome of ccRCC tumor-specific enhancers by performing Capture-C assays (56). Compared with other chromatin capture techniques, Capture-C offers
15-CD-17-0375_p1284-1305.indd 1288 10/23/17 2:18 PM
Research. on May 13, 2020. © 2017 American Association for Cancercancerdiscovery.aacrjournals.org Downloaded from
Published OnlineFirst September 11, 2017; DOI: 10.1158/2159-8290.CD-17-0375
VHL-Driven Enhancer Malfunction in ccRCC RESEARCH ARTICLE
November 2017 CANCER DISCOVERY | 1289
Figure 2. Enhancer aberration is a signature of ccRCC. A, Enriched pathways associated with gained promoters and enhancers revealed by GREAT (ranked by binomial FDR q-value). Red bars refer to ccRCC-specific pathways. B, De novo enhancers are acquired in a ccRCC tumor tissue upstream of VEGFA. Capture-C confirmed interactions of this VEGFA enhancer (E) with its promoter (P) in 786-O cells. The arcs represent significant interactions detected by r3Cseq (q < 0.05). The input-subtracted H3K27ac signals of this enhancer are highly correlated with VEGFA gene expression (Spearman cor-relation). C, Similar to (B), a de novo tumor enhancer interacts with the SLC2A1/GLUT1 promoter.
A
chr6:43,585,023-43,770,738
E P
–log10(q-value)
0 10 20 30
HIF1α networkPlatelet activation
Direct p53 effectorsRenal cell carcinoma
TCPTP signalingAP1 network
PDGFRβ signalingSLC-mediated transmembrane transport
HGFR/c-METERK1/ERK2 MAPK pathway
Cell cycleTranscription
RNA metabolismmRNA metabolism
Deposition of CENPA-containing nucleosomesRNA polymerase I promoter opening
RNA polymerase I transcriptionChromosome maintenance
mRNA splicingMeiotic recombination
Bchr1:43,365,540-43,566,851
46 -
1
100 -
0 100 -
0 100 -
0 100 -
0 50 -
0 50 -
0 30,000 -
1 30,000 -
1
Normal
Tumor
Normal
Tumor
Normal
Tumor
Normal
Tumor
VEGFA
312 -
2
100 -
0 100 -
0 100 -
0 100 -
0 50 -
0 50 -
0 3,000 -
1 3,000 -
1
Normal
Tumor
Normal
Tumor
Normal
Tumor
Normal
Tumor
SLC2A1
P E Spearman correlation r : 0.83 Spearman correlation r : 0.72
Gained promoters Gained enhancers
RN
A-s
eq
H
3K4m
e1
H
3K4m
e3
H
3K27
ac
C
aptu
re-C
RN
A-s
eq
H
3K4m
e1
H
3K4m
e3
H
3K27
ac
C
aptu
re-C
C
–log10(q-value)
0 10 20 30
both high-resolution (down to single Kb resolution) and high-throughput interrogation of user-defined regions (a usual working range of 10–500 regions). We designed probes against a subset of 56 gained enhancers and examined their interactions with protein-coding genes in 786-O cells. Each gene–enhancer pair revealed by Capture-C was further fil-tered by correlations between gene expression and H3K27ac levels (q-value < 0.05). The 56 gained enhancers were paired with 36 protein-coding genes (Supplementary Table S11)—of these, 58% were predicted by GREAT, and 80% by gene cor-relations within TADs. The median distance of interactions detected by Capture-C was 16 kb, and 83% of the interactions fell within a 100-kb window (Supplementary Fig. S3E). As a
visual example, Capture-C confirmed interactions between VEGFA enhancer and the VEGFA TSS, spanning a distance of ∼100 kb (Fig. 2B), and interactions between the SLC2A1 enhancer and its promoter (Fig. 2C). Taken collectively, these findings highlight the disease-specific nature of enhancer ele-ments (33) and an important role for enhancer malfunction in modulating ccRCC pathology.
Tumor Superenhancers Identify ZNF395 as a Master Regulator of ccRCC Tumorigenesis
The importance of enhancers in ccRCC led us to examine the landscape of “superenhancers” or “stretch-enhancers”—dense clusters of enhancers located near master regulators of
15-CD-17-0375_p1284-1305.indd 1289 10/23/17 2:18 PM
Research. on May 13, 2020. © 2017 American Association for Cancercancerdiscovery.aacrjournals.org Downloaded from
Published OnlineFirst September 11, 2017; DOI: 10.1158/2159-8290.CD-17-0375
Yao et al.RESEARCH ARTICLE
1290 | CANCER DISCOVERY November 2017 www.aacrjournals.org
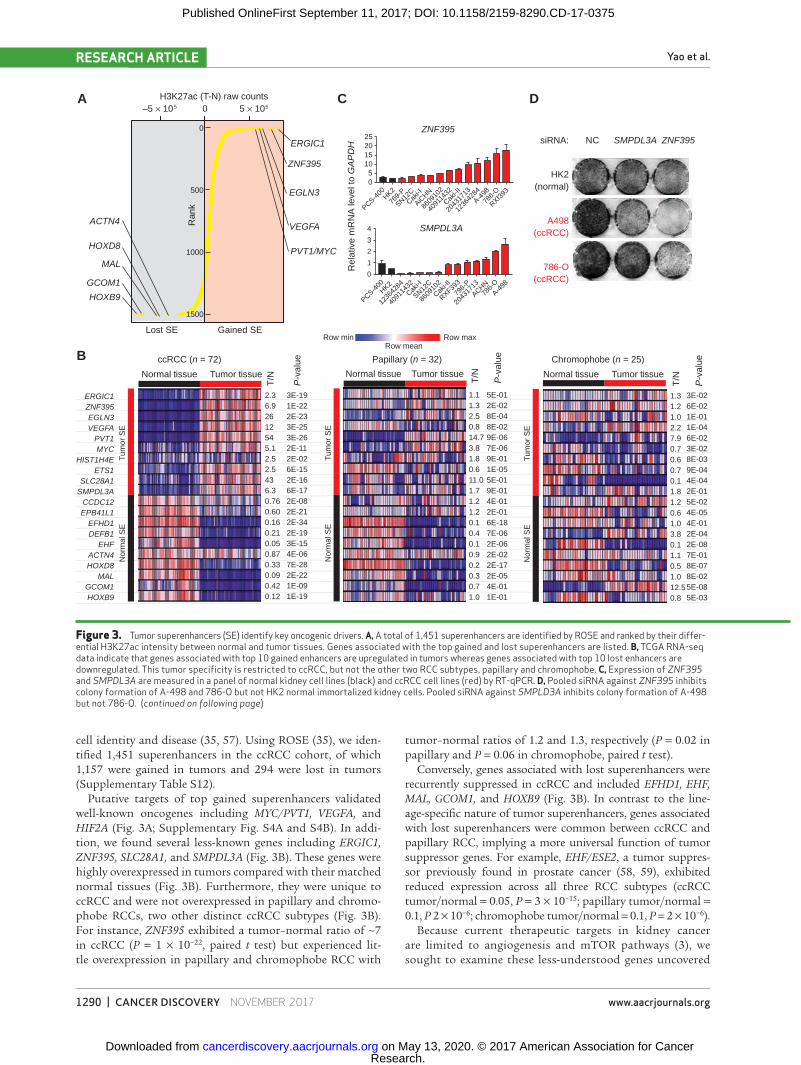
cell identity and disease (35, 57). Using ROSE (35), we iden-tified 1,451 superenhancers in the ccRCC cohort, of which 1,157 were gained in tumors and 294 were lost in tumors (Supplementary Table S12).
Putative targets of top gained superenhancers validated well-known oncogenes including MYC/PVT1, VEGFA, and HIF2A (Fig. 3A; Supplementary Fig. S4A and S4B). In addi-tion, we found several less-known genes including ERGIC1, ZNF395, SLC28A1, and SMPDL3A (Fig. 3B). These genes were highly overexpressed in tumors compared with their matched normal tissues (Fig. 3B). Furthermore, they were unique to ccRCC and were not overexpressed in papillary and chromo-phobe RCCs, two other distinct ccRCC subtypes (Fig. 3B). For instance, ZNF395 exhibited a tumor–normal ratio of ∼7 in ccRCC (P = 1 × 10⁻²², paired t test) but experienced lit-tle overexpression in papillary and chromophobe RCC with
tumor–normal ratios of 1.2 and 1.3, respectively (P = 0.02 in papillary and P = 0.06 in chromophobe, paired t test).
Conversely, genes associated with lost superenhancers were recurrently suppressed in ccRCC and included EFHD1, EHF, MAL, GCOM1, and HOXB9 (Fig. 3B). In contrast to the line-age-specific nature of tumor superenhancers, genes associated with lost superenhancers were common between ccRCC and papillary RCC, implying a more universal function of tumor suppressor genes. For example, EHF/ESE2, a tumor suppres-sor previously found in prostate cancer (58, 59), exhibited reduced expression across all three RCC subtypes (ccRCC tumor/ normal = 0.05, P = 3 × 10⁻¹⁵; papillary tumor/normal = 0.1, P 2 × 10⁻⁶; chromophobe tumor/normal = 0.1, P = 2 × 10⁻⁶).
Because current therapeutic targets in kidney cancer are limited to angiogenesis and mTOR pathways (3), we sought to examine these less-understood genes uncovered
Figure 3. Tumor superenhancers (SE) identify key oncogenic drivers. A, A total of 1,451 superenhancers are identified by ROSE and ranked by their differ-ential H3K27ac intensity between normal and tumor tissues. Genes associated with the top gained and lost superenhancers are listed. B, TCGA RNA-seq data indicate that genes associated with top 10 gained enhancers are upregulated in tumors whereas genes associated with top 10 lost enhancers are downregulated. This tumor specificity is restricted to ccRCC, but not the other two RCC subtypes, papillary and chromophobe. C, Expression of ZNF395 and SMPDL3A are measured in a panel of normal kidney cell lines (black) and ccRCC cell lines (red) by RT-qPCR. D, Pooled siRNA against ZNF395 inhibits colony formation of A-498 and 786-O but not HK2 normal immortalized kidney cells. Pooled siRNA against SMPLD3A inhibits colony formation of A-498 but not 786-O. (continued on following page)
ERGIC1ZNF395EGLN3VEGFA
PVT1MYC
HIST1H4EETS1
SLC28A1SMPDL3A
CCDC12EPB41L1
EFHD1DEFB1
EHFACTN4HOXD8
MALGCOM1HOXB9
3E-191E-222E-233E-253E-262E-112E-026E-152E-166E-172E-082E-212E-342E-193E-154E-067E-282E-221E-091E-19
2.36.92612545.12.52.5436.30.760.600.160.210.050.870.330.090.420.12
T/N
P-v
alue
Normal tissue Tumor tissue
Nor
mal
SE
T
umor
SE
A
B
Nor
mal
SE
T
umor
SE
ccRCC (n = 72) Papillary (n = 32) Chromophobe (n = 25)
Nor
mal
SE
T
umor
SE
T/N
P-v
alue
3E-026E-021E-011E-046E-023E-028E-039E-044E-042E-015E-024E-054E-012E-042E-087E-018E-078E-025E-085E-03
T/N
P-v
alue
Normal tissue Tumor tissue Normal tissue Tumor tissue
5E-012E-028E-048E-029E-067E-069E-011E-055E-019E-014E-012E-016E-187E-062E-062E-022E-172E-054E-011E-01
1.31.21.02.27.90.70.60.70.11.81.20.61.03.80.11.10.51.012.50.8
1.11.32.50.814.73.81.80.611.01.71.21.20.10.40.10.90.20.30.71.0
H3K27ac (T-N) raw counts–5 × 10⁵ 0 5 × 10⁵
0
500
1000
1500
ERGIC1
ZNF395
EGLN3
VEGFA
PVT1/MYC
HOXB9
HOXD8
GCOM1
MAL
ACTN4
Gained SELost SE
NC SMPDL3A ZNF395
C
siRNA:
HK2(normal)
A498(ccRCC)
786-O(ccRCC)
D
PCS-400
HK2
769-
P
SN12CCak
i-I
AiCHN
8609
102
4091
1432
Caki-I
I
2043
1713
1236
4284
A-498
786-
O
RXf393
05
10152025
PCS-400
HK2
1236
4284
Caki-I
SN12C
Caki-I
I
RXF393
796-
P
2043
1713
ACHN78
6-OA-4
980
1
2
3
4
ZNF395
Rel
ativ
e m
RN
A le
vel t
o G
AP
DH
SMPDL3A
4091
1432
8609
102
Row min Row maxRow mean
Ran
k
15-CD-17-0375_p1284-1305.indd 1290 10/23/17 2:18 PM
Research. on May 13, 2020. © 2017 American Association for Cancercancerdiscovery.aacrjournals.org Downloaded from
Published OnlineFirst September 11, 2017; DOI: 10.1158/2159-8290.CD-17-0375
VHL-Driven Enhancer Malfunction in ccRCC RESEARCH ARTICLE
November 2017 CANCER DISCOVERY | 1291
by superenhancer profiling. We chose ZNF395 and SMPDL3A for their differential tumor expression (6–7 tumor–normal ratio; Fig. 3B) and high abundance (average RPKM of ZNF395 ∼112; average RPKM of SMPDL3A ∼58). Even though ZNF395 was previously identified as a potential ccRCC biomarker (60), its functional role in ccRCC malig-nancy remains unexplored. SMPDL3A shares 31% amino acid identity with the acid sphingomyelinase SMPD1 and is a target of a master regulator of cholesterol metabolism, liver X receptors (LXR; ref. 61).
Quantitative PCR (Fig. 3C) and immunoblotting (Supple-mentary Fig. S4C) confirmed that A-498 and 786-O ccRCC cells exhibited high expression of ZNF395 and SMPDL3A, whereas normal kidney proximal tubule cells, PCS-400 and HK2, exhibited low expression of both genes. siRNA medi-ated knockdown of SMPDL3A had a cell line–dependent effect on colony formation, inhibiting the growth of A-498 cells but having no observable effect on 786-O cells (Fig. 3D).
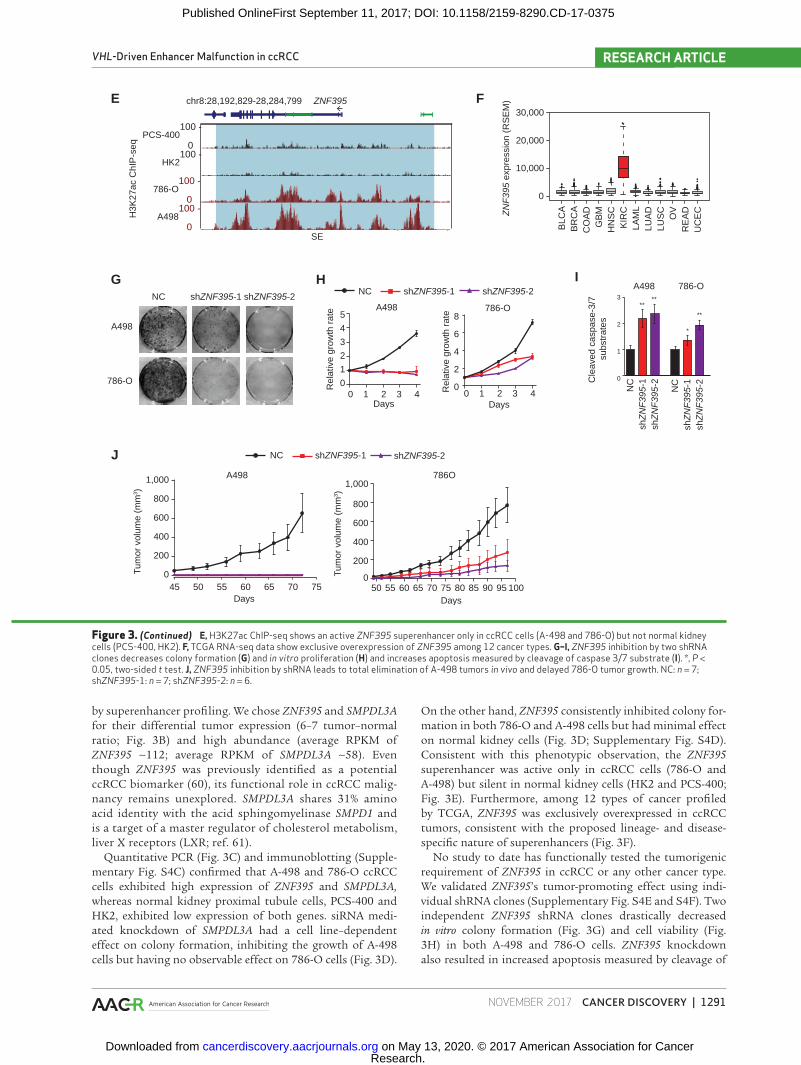
On the other hand, ZNF395 consistently inhibited colony for-mation in both 786-O and A-498 cells but had minimal effect on normal kidney cells (Fig. 3D; Supplementary Fig. S4D). Consistent with this phenotypic observation, the ZNF395 superenhancer was active only in ccRCC cells (786-O and A-498) but silent in normal kidney cells (HK2 and PCS-400; Fig. 3E). Furthermore, among 12 types of cancer profiled by TCGA, ZNF395 was exclusively overexpressed in ccRCC tumors, consistent with the proposed lineage- and disease-specific nature of superenhancers (Fig. 3F).
No study to date has functionally tested the tumorigenic requirement of ZNF395 in ccRCC or any other cancer type. We validated ZNF395’s tumor-promoting effect using indi-vidual shRNA clones (Supplementary Fig. S4E and S4F). Two independent ZNF395 shRNA clones drastically decreased in vitro colony formation (Fig. 3G) and cell viability (Fig. 3H) in both A-498 and 786-O cells. ZNF395 knockdown also resulted in increased apoptosis measured by cleavage of
E
A498
786-O
NC shZNF395-1 shZNF395-2
A498
Tum
or v
olum
e (m
m3 )
45 50 55 60 65 70 750
200
400
600
800
1,000
NC shZNF395-1 shZNF395-2
786O
50 55 60 65 70 75 80 85 90 95 1000
200
400
600
800
1,000
Days Days
F
Rel
ativ
e gr
owth
rat
e
Days
5
4
3
2
1
0
A498
NC
Rel
ativ
e gr
owth
rat
e
0 1 2 3 4Days
786-O
shZNF395-1 shZNF395-2
0 1 2 3 4
8
6
4
2
0
G H
30,000
20,000
10,000
0
BLC
AB
RC
AC
OA
DG
BM
HN
SC
KIR
CLA
ML
LUA
DLU
SC
OV
RE
AD
UC
ECZN
F39
5 ex
pres
sion
(R
SE
M)
3
2
1
0
NC
shZ
NF
395-
1 s
hZN
F39
5-2C
leav
ed c
aspa
se-3
/ 7 s
ubst
rate
s
** **
**
*
A498 786-O
NC
shZ
NF
395-
1 s
hZN
F39
5-2
I
ZNF395chr8:28,192,829-28,284,799
100 -
0 100 -
0
100 -
0 100 -
786-O
A498
PCS-400
HK2
J
Tum
or v
olum
e (m
m3 )
SE
H3K
27ac
ChI
P-s
eq
Figure 3. (Continued) E, H3K27ac ChIP-seq shows an active ZNF395 superenhancer only in ccRCC cells (A-498 and 786-O) but not normal kidney cells (PCS-400, HK2). F, TCGA RNA-seq data show exclusive overexpression of ZNF395 among 12 cancer types. G–I, ZNF395 inhibition by two shRNA clones decreases colony formation (G) and in vitro proliferation (H) and increases apoptosis measured by cleavage of caspase 3/7 substrate (I). *, P < 0.05, two-sided t test. J, ZNF395 inhibition by shRNA leads to total elimination of A-498 tumors in vivo and delayed 786-O tumor growth. NC: n = 7; shZNF395-1: n = 7; shZNF395-2: n = 6.
15-CD-17-0375_p1284-1305.indd 1291 10/23/17 2:18 PM
Research. on May 13, 2020. © 2017 American Association for Cancercancerdiscovery.aacrjournals.org Downloaded from
Published OnlineFirst September 11, 2017; DOI: 10.1158/2159-8290.CD-17-0375
Yao et al.RESEARCH ARTICLE
1292 | CANCER DISCOVERY November 2017 www.aacrjournals.org
caspase 3/7 substrates (Fig. 3I) and Annexin V staining (Sup-plementary Fig. S4G). In vivo, tumor formation studies in mouse xenograft models revealed marked tumor suppression by ZNF395 depletion (Fig. 3J). Knockdown of ZNF395 led to elimination of A-498 tumors up to day 74, when tumors in the control group began to exceed the size limits imposed by institutional animal protocols. Similarly, ZNF395 deple-tion significantly slowed in vivo tumor growth of 786-O cells (Fig. 3J). Taken together, we showed the indispensable role ZNF395 plays in ccRCC tumorigenesis.
VHL Deficiency Remodels ccRCC Enhancer Landscapes
To explore the extent to which epigenetic changes observed in primary ccRCCs (Fig. 1) are directly driven by VHL loss, we examined chromatin changes in isogenic cell lines with and
without VHL restoration. Consistent with earlier functional studies of VHL (62–64), VHL restoration in 786-O, A-498, and 12364284 cells had negligible effects on proliferation, colony formation, and apoptosis in vitro, but profoundly delayed tumor growth in vivo (Supplementary Fig. S5A–S5D), suggest-ing the importance of VHL in modulating processes required for in vivo tumorigenesis, including tumor–stroma cross-talk, angiogenesis, cell–matrix interactions, or tumor metabolism.
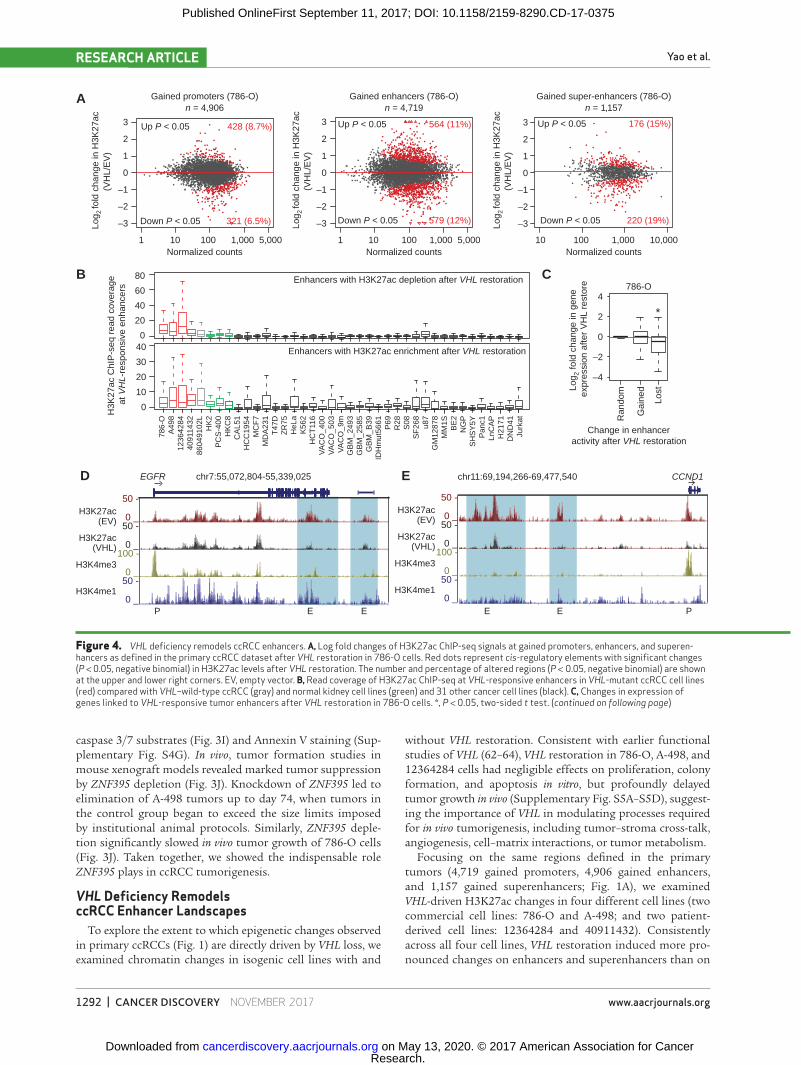
Focusing on the same regions defined in the primary tumors (4,719 gained promoters, 4,906 gained enhancers, and 1,157 gained superenhancers; Fig. 1A), we examined VHL-driven H3K27ac changes in four different cell lines (two commercial cell lines: 786-O and A-498; and two patient-derived cell lines: 12364284 and 40911432). Consistently across all four cell lines, VHL restoration induced more pro-nounced changes on enhancers and superenhancers than on
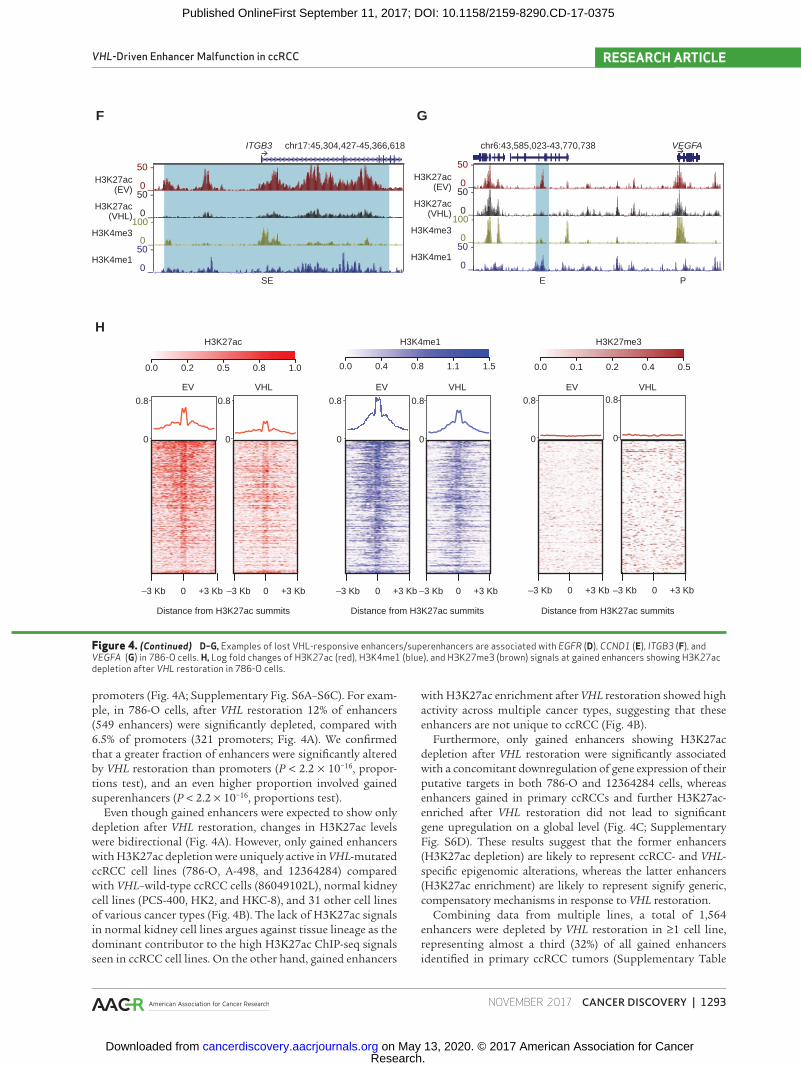
Figure 4. VHL deficiency remodels ccRCC enhancers. A, Log fold changes of H3K27ac ChIP-seq signals at gained promoters, enhancers, and superen-hancers as defined in the primary ccRCC dataset after VHL restoration in 786-O cells. Red dots represent cis-regulatory elements with significant changes (P < 0.05, negative binomial) in H3K27ac levels after VHL restoration. The number and percentage of altered regions (P < 0.05, negative binomial) are shown at the upper and lower right corners. EV, empty vector. B, Read coverage of H3K27ac ChIP-seq at VHL-responsive enhancers in VHL-mutant ccRCC cell lines (red) compared with VHL–wild-type ccRCC (gray) and normal kidney cell lines (green) and 31 other cancer cell lines (black). C, Changes in expression of genes linked to VHL-responsive tumor enhancers after VHL restoration in 786-O cells. *, P < 0.05, two-sided t test. (continued on following page)
A
Down P < 0.05 579 (12%)
Up P < 0.05 564 (11%)
1 10 100 1,000 5,000
3
2
1
0
–1
–2
–3 Down P < 0.05 220 (19%)
Up P < 0.05 176 (15%)3
2
1
0
–1
–2
–3
Up P < 0.05 428 (8.7%)
Down P < 0.05 321 (6.5%)
3
2
1
0
–1
–2
–3
1 10 100 1,000 5,000
(V
HL/
EV
)
4
2
0
–2
–4
Ran
dom
Gai
ned
Lost
*
Log 2
fold
cha
nge
in g
ene
expr
essi
on a
fter
VH
L re
stor
e
Change in enhancer activity after VHL restoration
786-O
Normalized counts Normalized countsNormalized counts
Log
2 fo
ld c
hang
e in
H3K
27ac
(V
HL/
EV
)
(V
HL/
EV
)
B C
H3K
27ac
ChI
P-s
eq r
ead
cove
rage
at V
HL-
resp
onsi
ve e
nhan
cers
786-
OA
498
1236
4284
4091
1432
8604
9102
LH
K2
PC
S-4
00H
KC
8C
AL5
1H
CC
1954
MC
F7
MD
A23
1T
47D
ZR
75H
eLa
K56
2H
CT
116
VA
CO
_400
VA
CO
_503
VA
CO
_9m
GB
M_2
493
GB
M_2
585
GB
M_B
39ID
Hm
ut56
61P
69R
28S
08S
F26
8u8
7G
M12
878
MM
1SB
E2
NG
PS
HS
Y5Y
Pan
c1Ln
CA
PH
2171
DN
D41
Jurk
at
Enhancers with H3K27ac depletion after VHL restoration80
60
40
20
040
30
20
10
0
Gained enhancers (786-O) Gained super-enhancers (786-O)Gained promoters (786-O)n = 4,906 n = 1,157n = 4,719
10 100 1,000 10,000
Log
2 fo
ld c
hang
e in
H3K
27ac
Log
2 fo
ld c
hang
e in
H3K
27ac
Enhancers with H3K27ac enrichment after VHL restoration
chr11:69,194,266-69,477,540 CCND1
E E P
EGFR chr7:55,072,804-55,339,025
E EP
D E
50 -
0 _50 -
0 _100 -
0 _50 -
0 _
H3K27ac
H3K27ac
H3K4me3
H3K4me1
(EV)
(VHL)
50 -
0 _50 -
0 _100 -
0 _50 -
0 _
H3K27ac
H3K27ac
H3K4me3
H3K4me1
(EV)
(VHL)
15-CD-17-0375_p1284-1305.indd 1292 10/23/17 2:18 PM
Research. on May 13, 2020. © 2017 American Association for Cancercancerdiscovery.aacrjournals.org Downloaded from
Published OnlineFirst September 11, 2017; DOI: 10.1158/2159-8290.CD-17-0375
VHL-Driven Enhancer Malfunction in ccRCC RESEARCH ARTICLE
November 2017 CANCER DISCOVERY | 1293
promoters (Fig. 4A; Supplementary Fig. S6A–S6C). For exam-ple, in 786-O cells, after VHL restoration 12% of enhancers (549 enhancers) were significantly depleted, compared with 6.5% of promoters (321 promoters; Fig. 4A). We confirmed that a greater fraction of enhancers were significantly altered by VHL restoration than promoters (P < 2.2 × 10⁻¹⁶, propor-tions test), and an even higher proportion involved gained superenhancers (P < 2.2 × 10⁻¹⁶, proportions test).
Even though gained enhancers were expected to show only depletion after VHL restoration, changes in H3K27ac levels were bidirectional (Fig. 4A). However, only gained enhancers with H3K27ac depletion were uniquely active in VHL-mutated ccRCC cell lines (786-O, A-498, and 12364284) compared with VHL–wild-type ccRCC cells (86049102L), normal kidney cell lines (PCS-400, HK2, and HKC-8), and 31 other cell lines of various cancer types (Fig. 4B). The lack of H3K27ac signals in normal kidney cell lines argues against tissue lineage as the dominant contributor to the high H3K27ac ChIP-seq signals seen in ccRCC cell lines. On the other hand, gained enhancers
with H3K27ac enrichment after VHL restoration showed high activity across multiple cancer types, suggesting that these enhancers are not unique to ccRCC (Fig. 4B).
Furthermore, only gained enhancers showing H3K27ac depletion after VHL restoration were significantly associated with a concomitant downregulation of gene expression of their putative targets in both 786-O and 12364284 cells, whereas enhancers gained in primary ccRCCs and further H3K27ac-enriched after VHL restoration did not lead to significant gene upregulation on a global level (Fig. 4C; Supplementary Fig. S6D). These results suggest that the former enhancers (H3K27ac depletion) are likely to represent ccRCC- and VHL-specific epigenomic alterations, whereas the latter enhancers (H3K27ac enrichment) are likely to represent signify generic, compensatory mechanisms in response to VHL restoration.
Combining data from multiple lines, a total of 1,564 enhancers were depleted by VHL restoration in ≥1 cell line, representing almost a third (32%) of all gained enhancers identified in primary ccRCC tumors (Supplementary Table
H3K27ac
0.0 0.2 0.5 0.8 1.0 0.0 0.4 0.8 1.1 1.5
–3 Kb 0 +3 Kb –3 Kb 0 +3 Kb –3 Kb 0 +3 Kb –3 Kb 0 +3 Kb
EV VHL
H3K4me1
EV VHL
0.8
0
–3 Kb 0 +3 Kb –3 Kb 0 +3 Kb
0.8
0
0.8
0
0.8
0
0.8
0
0.8
0
0.0 0.1 0.2 0.4 0.5
H3K27me3
EV VHL
H
50 -
0 _50 -
0 _100 -
0 _50 -
0 _
chr6:43,585,023-43,770,738 VEGFAITGB3 chr17:45,304,427-45,366,618
SE E P
H3K27ac
H3K27ac
H3K4me3
H3K4me1
(EV)
(VHL)
F G
Distance from H3K27ac summitsDistance from H3K27ac summits Distance from H3K27ac summits
50 -
0 _50 -
0 _100 -
0 _50 -
0 _
H3K27ac
H3K27ac
H3K4me3
H3K4me1
(EV)
(VHL)
Figure 4. (Continued) D–G, Examples of lost VHL-responsive enhancers/superenhancers are associated with EGFR (D), CCND1 (E), ITGB3 (F), and VEGFA (G) in 786-O cells. H, Log fold changes of H3K27ac (red), H3K4me1 (blue), and H3K27me3 (brown) signals at gained enhancers showing H3K27ac depletion after VHL restoration in 786-O cells.
15-CD-17-0375_p1284-1305.indd 1293 10/23/17 2:18 PM
Research. on May 13, 2020. © 2017 American Association for Cancercancerdiscovery.aacrjournals.org Downloaded from
Published OnlineFirst September 11, 2017; DOI: 10.1158/2159-8290.CD-17-0375
Yao et al.RESEARCH ARTICLE
1294 | CANCER DISCOVERY November 2017 www.aacrjournals.org
S13). The proportion of VHL-responsive enhancers increased with the level of patient recurrence—only 7.8% of nonrecur-rent gained enhancers (1/10 patients) showed VHL-mediated H3K27ac depletion, whereas 18% of enhancers recurrently gained in 9 of 10 patients and 20% of enhancers gained in 10 of 10 patients showed H3K27ac depletion in 786-O cells (Supplementary Fig. S7A, P = 0.0001, proportions test), consistent with the high prevalence of VHL mutations (9/10 patients) in our discovery set. Interestingly, unsupervised clustering using the 1,564 VHL-responsive gained enhancers segregated the single VHL–wild-type tumor (ID 75416923) away from the remaining 9 VHL-mutant tumors (Supplemen-tary Fig. S7B), with the VHL–wild-type tumor showing low H3K27ac signals at the ZNF395 superenhancer comparable
with its patient-matched normal (Supplementary Fig. S7C). Collectively, pathway analysis of enhancers depleted in ≥2 cell lines highlighted direct p53 effectors, integrin-linked kinase signaling, and HIF1α transcription factor networks as the top five pathways (Supplementary Table S14), covering genes such as EGFR (Fig. 4D), CCND1 (Fig. 4E), ITGB3 (Fig. 4F), VEGFA (Fig. 4G), SLC2A1 (Supplementary Fig. S7D), and HK2 (Supplementary Fig. S7E). These results support a major role for VHL loss in ccRCC enhancer malfunction, even in the presence of other driver mutations.
We also examined whether other histone marks were concomitantly altered with H3K27ac marks. We found a surprisingly high degree of correlation between H3K27ac and H3K4me1 in response to VHL restoration in both 786-O
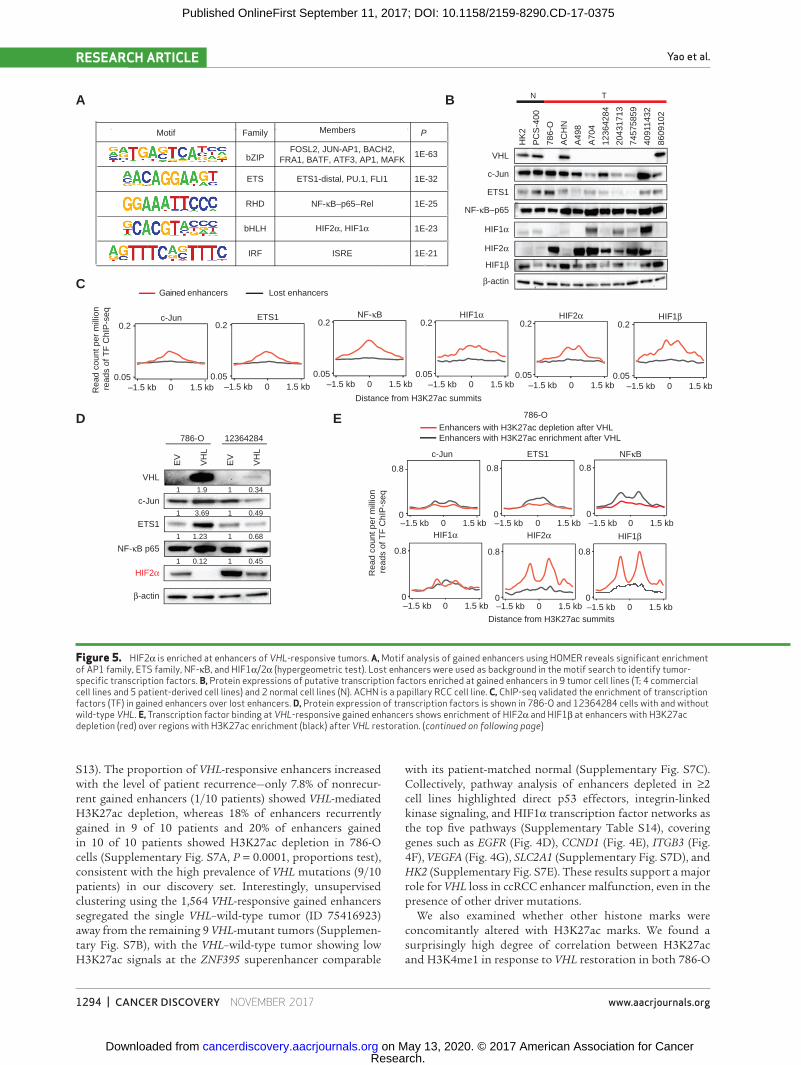
Figure 5. HIF2α is enriched at enhancers of VHL-responsive tumors. A, Motif analysis of gained enhancers using HOMER reveals significant enrichment of AP1 family, ETS family, NF-κB, and HIF1α/2α (hypergeometric test). Lost enhancers were used as background in the motif search to identify tumor-specific transcription factors. B, Protein expressions of putative transcription factors enriched at gained enhancers in 9 tumor cell lines (T; 4 commercial cell lines and 5 patient-derived cell lines) and 2 normal cell lines (N). ACHN is a papillary RCC cell line. C, ChIP-seq validated the enrichment of transcription factors (TF) in gained enhancers over lost enhancers. D, Protein expression of transcription factors is shown in 786-O and 12364284 cells with and without wild-type VHL. E, Transcription factor binding at VHL-responsive gained enhancers shows enrichment of HIF2α and HIF1β at enhancers with H3K27ac depletion (red) over regions with H3K27ac enrichment (black) after VHL restoration. (continued on following page)
A B N T
HK
2
PC
S-4
00
786-
O
AC
HN
A49
8
A70
4
1236
4284
2043
1713
7457
5859
4091
1432
8609
102
Motif Family
FOSL2, JUN-AP1, BACH2,FRA1, BATF, ATF3, AP1, MAFKbZIP
ETS
RHD
bHLH
IRF
1E-63
1E-32
1E-25
1E-23
1E-21
ETS1-distal, PU.1, FLI1
NF-κB–p65–Rel
HIF2α, HIF1α
ISRE
C
EV
VH
L
EV
VH
L
VHL
c-Jun
ETS1
NF-κB p65
HIF2α
β-actin
786-O 12364284
1 1.9 1 0.34
1 3.69 1 0.49
1 1.23 1 0.68
1 0.12 1 0.45
VHL
c-Jun
ETS1
NF-κB–p65
HIF1α
HIF2α
β-actin
D
0.8
0
0.8
0
0.8
0
HIF2αHIF1α HIF1β
–1.5 kb 0 1.5 kb
Enhancers with H3K27ac depletion after VHLEnhancers with H3K27ac enrichment after VHL
–1.5 kb 0 1.5 kb –1.5 kb 0 1.5 kb
E
0.8
0
NFκB
–1.5 kb 0 1.5 kb
0.8
0
ETS1
–1.5 kb 0 1.5 kb
0.8
0
c-Jun
–1.5 kb 0 1.5 kb
HIF2α0.2
0.05–1.5 kb 0 1.5 kb
HIF1α0.2
0.05–1.5 kb 0 1.5 kb
HIF1β0.2
0.05–1.5 kb 0 1.5 kb
ETS10.2
0.05–1.5 kb 0 1.5 kb
c-Jun0.2
0.05–1.5 kb 0 1.5 kb
NF-κB0.2
0.05–1.5 kb 0 1.5 kb
Gained enhancers Lost enhancers
Distance from H3K27ac summits
Distance from H3K27ac summits
HIF1β
786-O
Rea
d co
unt p
er m
illio
n re
ads
of T
F C
hIP
-seq
Rea
d co
unt p
er m
illio
n re
ads
of T
F C
hIP
-seq
PMembers
15-CD-17-0375_p1284-1305.indd 1294 10/23/17 2:18 PM
Research. on May 13, 2020. © 2017 American Association for Cancercancerdiscovery.aacrjournals.org Downloaded from
Published OnlineFirst September 11, 2017; DOI: 10.1158/2159-8290.CD-17-0375
VHL-Driven Enhancer Malfunction in ccRCC RESEARCH ARTICLE
November 2017 CANCER DISCOVERY | 1295
cells (r = 0.77, Pearson correlation, Supplementary Fig. S7F) and 12364284 cells (r = 0.61, Pearson correlation, Supple-mentary Fig. S7G). Globally, enhancers exhibiting H3K27ac depletion also experienced concomitant H3K4me1 deple-tion (Fig. 4H). We next examined whether VHL restoration led to acquisition of the H3K27me3 repressive mark. Despite a moderate anticorrelation of H3K27ac and H3K27me3 (786-O cells: r = −0.28, Pearson correlation, Supplementary Fig. S7H; 12364284 cells: r = −0.22, Pearson correlation, Supplementary Fig. S7I), H3K27me3 levels remained low at gained enhancers even after VHL restoration (Fig. 4H). These findings suggest that VHL restoration may result in a loss of enhancer identity by codepletion of H3K27ac and H3K4me1, but not a formal transition to a poised enhancer state that would have retained H3K4me1 but acquired H3K27me3.
HIF2`–HIF1a Heterodimers Are Enriched at VHL-Responsive Enhancers
We sought to investigate which transcription factors might mediate VHL-dependent chromatin remodeling at gained enhancers. Beginning with the primary ccRCC dataset, we looked for enrichment of trans-regulators in gained enhancers over lost enhancers. Using HOMER (65), we found that the top enriched motifs were the AP1 family, ETS family, and NF-κB–p65–Rel and HIF1α/2α motifs (Fig. 5A, full list of motifs in Supplementary Table S15). For subsequent in vitro validation, we chose c-Jun as a representative AP1 family member because of its activation in ccRCC (66) and ETS1 as an ETS family representative because of its known interaction with HIF2α (67), but acknowledge that other family AP1 and ETS family members may play a role in ccRCC. Immunoblotting of c-Jun,
G
F
HIF1 ̀(40911432) HIF2 ̀(40911432)
Gained prom
Gainedenh
Lost prom Lost prom
Lost enh
Gained enh
Gainedenh
Lost promLost prom
HIF1a (786-O) HIF2a (786-O)
Gained prom
Gained prom
Lost enh
Lost enhLost enh
HIF1α HIF2α0.3
0–1.5 kb 0 1.5 kb–1.5 kb 0 1.5 kb
0.3
0
H
I
JCMIP100 -
0 100 -
0 100 -
0 100 -
0
chr16:81,512,501-81,528,600
H3K27ac
H3K27ac
HIF1`
HIF2`
(EV)
(VHL)
100 -
0 100 -
0 100 -
0 100 -
0
chr1:19,352,768-19,383,967
H3K27ac
H3K27ac
HIF1`
HIF2`
(EV)
(VHL)
Enhancers with H3K27ac depletion after VHLEnhancers with H3K27ac enrichment after VHL
Gainedenh
Gained prom
40911432
Distance from H3K27ac summits
Rea
d co
unt p
er m
illio
nre
ads
of T
F C
hIP
-seq
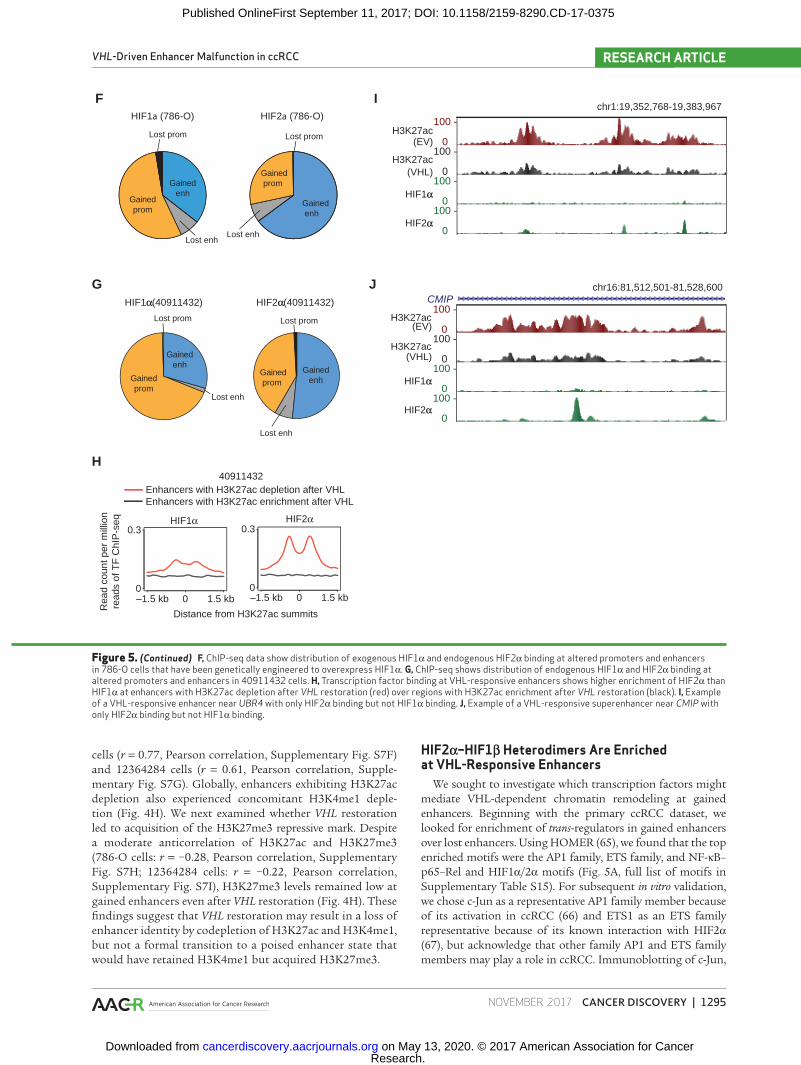
Figure 5. (Continued) F, ChIP-seq data show distribution of exogenous HIF1α and endogenous HIF2α binding at altered promoters and enhancers in 786-O cells that have been genetically engineered to overexpress HIF1α. G, ChIP-seq shows distribution of endogenous HIF1α and HIF2α binding at altered promoters and enhancers in 40911432 cells. H, Transcription factor binding at VHL-responsive enhancers shows higher enrichment of HIF2α than HIF1α at enhancers with H3K27ac depletion after VHL restoration (red) over regions with H3K27ac enrichment after VHL restoration (black). I, Example of a VHL-responsive enhancer near UBR4 with only HIF2α binding but not HIF1α binding. J, Example of a VHL-responsive superenhancer near CMIP with only HIF2α binding but not HIF1α binding.
15-CD-17-0375_p1284-1305.indd 1295 10/23/17 2:18 PM
Research. on May 13, 2020. © 2017 American Association for Cancercancerdiscovery.aacrjournals.org Downloaded from
Published OnlineFirst September 11, 2017; DOI: 10.1158/2159-8290.CD-17-0375
Yao et al.RESEARCH ARTICLE
1296 | CANCER DISCOVERY November 2017 www.aacrjournals.org
ETS1, and NF-κB–p65 showed variable protein expression in both normal and tumor cell lines, but expression of HIF1α and HIF2α restricted to tumor cells only (Fig. 5B). HIF2α was expressed in a higher proportion of ccRCC cell lines than HIF1α (Fig. 5B). We further examined gene expression of these transcription factors in the TCGA cohort and found that ETS1, RELA (subunit of NF-κB–p65), and HIF2a were significantly overexpressed in tumors compared with normal tissues, with a range of tumor-association expression patterns similar to vari-ations in ccRCC lines (Supplementary Fig. S8A).
To further investigate chromatin occupancy of these factors, we generated ChIP-seq binding profiles of c-Jun, ETS1, and NF-κB cells and reexamined HIF2α, HIF1α, and HIF1β bind-ing profiles from the previous literature (21, 30), all performed in 786-O cells. Of note, because 786-O cells have lost endoge-nous HIF1α expression through genomic deletion, the HIF1α ChIP-seq was performed on 786-O cells genetically manip-ulated to reexpress HIF1α protein (30). ChIP-seq results showed that all six transcription factors exhibited increased occupancy at gained enhancers compared with lost enhanc-ers, validating the HOMER predictions (Fig. 5C).
To determine which of these transcription factors might be directly dependent on VHL, we then compared their pro-tein expression in VHL-mutated isogenic cell lines with and without wild-type–VHL restoration. As shown in Fig. 5D, VHL restoration consistently downregulated HIF2α expres-sion in both 786-O and 12364284 cell lines, but protein levels of other factors displayed contrasting trends between the two cell lines, implying that among the six factors examined, HIF2α protein expression was the most VHL dependent. Indeed, supporting an important role for HIF2α in VHL-dependent enhancer remodeling, only HIF2α and HIF1β were significantly enriched at enhancers showing VHL-dependent H3K27ac depletion (Fig. 5E). Moreover, among all known motifs in the HOMER database, HIF2α was the most enriched motif at VHL-responsive enhancers exhibiting H3K27ac depletion (P = 1 × 10⁻¹¹; Supplementary Table S16).
In contrast, HIF1α was not enriched at enhancers showing H3K27ac depletion (Fig. 5E). Despite sharing many binding sites with HIF2α, HIF1α predominantly localized to pro-moter-proximal regions, whereas HIF2α frequently occupied introns and intergenic regions in 786-O cells (Supplementary Fig. S8B), consistent with a promoter-centric occupancy of HIF1α and an enhancer-centric occupancy of HIF2α (Fig. 5F). Gained enhancers displayed a HIF2α occupancy twice that of tumor-specific promoters (P < 1 × 10⁻¹⁶, proportions test) in 786-O cells, suggesting that HIF2α may play a greater role in regulating enhancers than promoters.
To extend these HIF1α and HIF2α occupancy-pattern findings to a system that expresses endogenous levels of both factors, we then performed HIF1α and HIF2α ChIP-seq in 40911432 ccRCC cells, which abundantly coexpress both HIFα subunits (Fig. 5B). Similar to 786-O, in 40911432 cells, HIF1α showed a preferential occupancy at promoter-proxi-mal regions, whereas a large proportion of HIF2α was found in distal regions (introns and distal intergenic regions; Supplementary Fig. S8C). A higher proportion of HIF1α binding sites overlapped with gained promoters than HIF2α (68% of HIF1α vs. 41% of HIF2α, P = 0.002, proportions test; Fig. 5G). Conversely, a higher proportion of HIF2α binding
sites overlapped with gained enhancers than HIF1α (29% of HIF1α vs. 51% of HIF2α, P < 2.2 × 10⁻¹⁶, proportions test). HIF2α’s preferential occupancy at enhancers was further substantiated by its higher enrichment at enhancers show-ing H3K27ac depletion after VHL restoration than HIF1α (Fig. 5H). Specific examples of VHL-responsive enhancers bound exclusively by HIF2α but not HIF1α included an enhancer near UBR4 (Fig. 5I) and a superenhancer near CMIP (Fig. 5J). Therefore, even in HIF1α/HIF2α coexpress-ing ccRCC cells, these results suggest that HIF2α plays a greater role in VHL-mediated enhancer remodeling than HIF1α.
HIF2`–HIF1a-Bound Enhancers Modulate Gene Expression
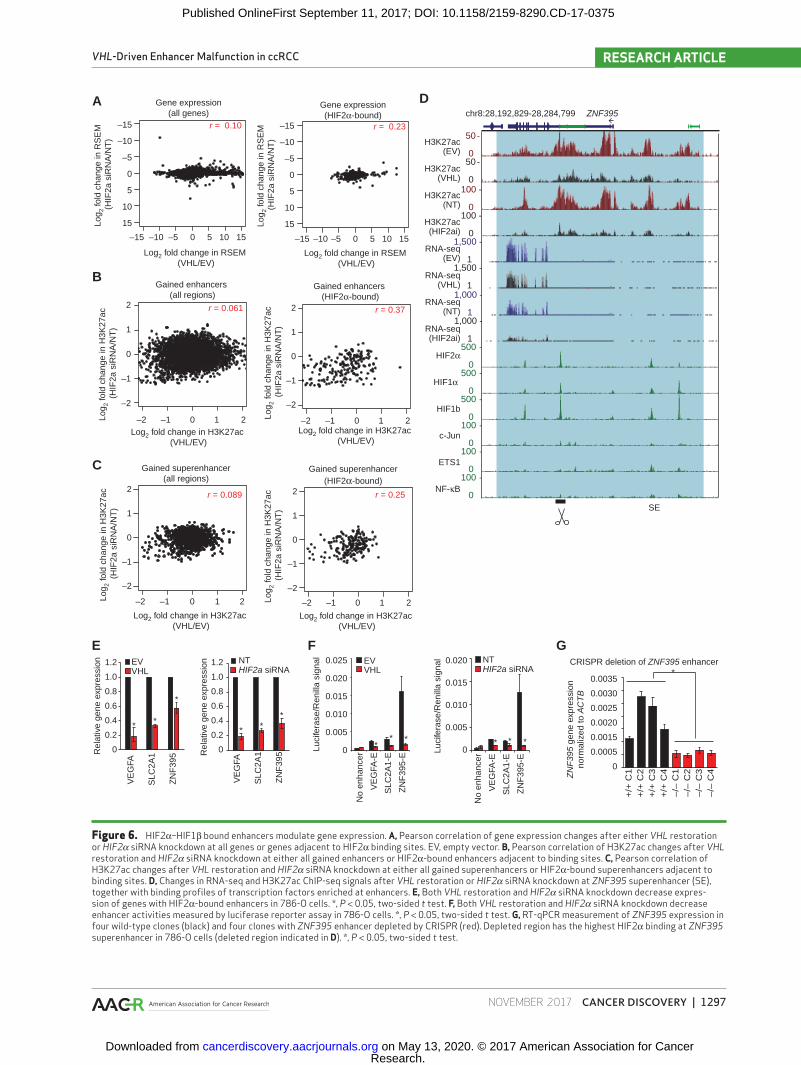
To investigate the extent to which HIF2α silencing is suf-ficient to recapitulate the effects of VHL restoration, we per-formed H3K27ac ChIP-seq and RNA sequencing (RNA-seq) in 786-O cells with HIF2a siRNA-mediated knockdown and analyzed correlations between HIF2a siRNA knockdown and VHL restoration. When assessed against all genes, there was a low correlation (r = 0.1, P = 5.2 × 10⁻³¹) between HIF2a knockdown and VHL restoration. Importantly, however, this correlation increased to 0.23 (P = 5.8 × 10⁻¹⁴) for genes near HIF2α binding sites (Fig. 6A). Similar results were obtained at the epigenomic level, where for gained enhancers the correlation was low at 0.06 across all gained enhancers (P = 1.9 × 10⁻⁵) but increased substantially to 0.37 (P = 9.5 × 10⁻⁸) at HIF2α-bound enhancers (Fig. 6B) and at superenhancers increased from 0.089 (P = 0.0025) to 0.25 (P = 0.00054) at HIF2α-bound superenhancers (Fig. 6C). As a visual exam-ple, H3K27ac signals at the ZNF395 superenhancer were diminished after VHL restoration or HIF2a knockdown, concomitant with decreased ZNF395 gene expression (Fig. 6D). Validation by RT-qPCR showed that HIF2a siRNA knock-down downregulated VEGFA, SLC2A1, and ZNF395 expres-sion to a comparable degree as VHL restoration (Fig. 6E). Decreases in luciferase reporter activity of enhancer ele-ments were also consistent between HIF2a siRNA knock-down and VHL restoration (Fig. 6F).
We sought to establish a causal link between HIF2α-bound enhancers and control of gene expression. We performed CRISPR-mediated genomic depletion of the ZNF395 enhancer region with the highest HIF2α peak (Fig. 6G). All four clones with the homozygous deleted ZNF395 enhancer consistently downregulated their ZNF395 expression compared with clones with the intact enhancer (P < 0.05), providing evidence that ZNF395 expression is epigenetically controlled by this HIF2α–HIF1β-bound enhancer (Fig. 6G). Taken together, these results indicate that that HIF2α is likely an important mediator of VHL-driven enhancer remodeling.
VHL Restoration Reduces p300 Recruitment but Preserves Promoter–Enhancer Interactions
Finally, we sought to investigate why VHL restoration caused a decrease in H3K27ac levels. Previous pulldown assays have reported that both HIF2α and HIF1β can interact with histone acetyltransferase p300 (68–71). Indeed, p300 fre-quently marks enhancers (43) and is thought to be recruited
15-CD-17-0375_p1284-1305.indd 1296 10/23/17 2:18 PM
Research. on May 13, 2020. © 2017 American Association for Cancercancerdiscovery.aacrjournals.org Downloaded from
Published OnlineFirst September 11, 2017; DOI: 10.1158/2159-8290.CD-17-0375
VHL-Driven Enhancer Malfunction in ccRCC RESEARCH ARTICLE
November 2017 CANCER DISCOVERY | 1297
Figure 6. HIF2α–HIF1β bound enhancers modulate gene expression. A, Pearson correlation of gene expression changes after either VHL restoration or HIF2a siRNA knockdown at all genes or genes adjacent to HIF2α binding sites. EV, empty vector. B, Pearson correlation of H3K27ac changes after VHL restoration and HIF2a siRNA knockdown at either all gained enhancers or HIF2α-bound enhancers adjacent to binding sites. C, Pearson correlation of H3K27ac changes after VHL restoration and HIF2a siRNA knockdown at either all gained superenhancers or HIF2α-bound superenhancers adjacent to binding sites. D, Changes in RNA-seq and H3K27ac ChIP-seq signals after VHL restoration or HIF2a siRNA knockdown at ZNF395 superenhancer (SE), together with binding profiles of transcription factors enriched at enhancers. E, Both VHL restoration and HIF2a siRNA knockdown decrease expres-sion of genes with HIF2α-bound enhancers in 786-O cells. *, P < 0.05, two-sided t test. F, Both VHL restoration and HIF2a siRNA knockdown decrease enhancer activities measured by luciferase reporter assay in 786-O cells. *, P < 0.05, two-sided t test. G, RT-qPCR measurement of ZNF395 expression in four wild-type clones (black) and four clones with ZNF395 enhancer depleted by CRISPR (red). Depleted region has the highest HIF2α binding at ZNF395 superenhancer in 786-O cells (deleted region indicated in D). *, P < 0.05, two-sided t test.
–2 –1 0 1 2
2
1
0
–1
–2
–2 –1 0 1 2
2
1
0
–1
–2
–2 –1 0 1 2
2
1
0
–1
–2
–2 –1 0 1 2
2
1
0
–1
–2
Gained enhancers (all regions)
Gained enhancers (HIF2α-bound)
Gained superenhancer(all regions)
Gained superenhancer(HIF2α-bound)
r = 0.25 r = 0.089
r = 0.37 r = 0.061
Log 2
fold
cha
nge
in H
3K27
ac (
HIF
2a s
iRN
A/N
T)
Log2 fold change in H3K27ac (VHL/EV)
Log 2
fold
cha
nge
in H
3K27
ac (
HIF
2a s
iRN
A/N
T)
Log2 fold change in H3K27ac (VHL/EV)
Log 2
fold
cha
nge
in H
3K27
ac (
HIF
2a s
iRN
A/N
T)
Log2 fold change in H3K27ac (VHL/EV)
Log 2
fold
cha
nge
in H
3K27
ac (
HIF
2a s
iRN
A/N
T)
Log2 fold change in H3K27ac (VHL/EV)
r = 0.23
Gene expression(all genes)
r = 0.10
Log 2
fold
cha
nge
in R
SE
M (
HIF
2a s
iRN
A/N
T)
Log2 fold change in RSEM (VHL/EV)
–15 –10 –5 0 5 10 15
–15
–10
–5
0
5
10
15
Gene expression(HIF2α-bound)
Log 2
fold
cha
nge
in R
SE
M (
HIF
2a s
iRN
A/N
T)
–15 –10 –5 0 5 10 15
–15
–10
–5
0
5
10
15
Log2 fold change in RSEM (VHL/EV)
50 -
0 50 -
0
500 -
0 500 -
0 500 -
0 100 -
0 100 -
0 100 -
0 SE
ZNF395chr8:28,192,829-28,284,799
H3K27ac
H3K27ac
H3K27ac
H3K27ac
RNA-seq
RNA-seq
RNA-seq
RNA-seq
HIF2α
HIF1α
HIF1b
c-Jun
ETS1
NF-κB
(EV)
(VHL)
(NT)
(HIF2ai)
(EV)
(VHL)
(NT)
(HIF2ai)
0.0035
0.0030
0.0025
0.0020
0.0015
0.0005
0
CRISPR deletion of ZNF395 enhancer
ZN
F39
5 ge
ne e
xpre
ssio
nno
rmal
ized
to A
CT
B
+/+
C1
+/+
C2
+/+
C3
+/+
C4
–/–
C1
–/–
C2
–/–
C3
–/–
C4
*0.025
0.020
0.015
0.010
0.005
0
NTHIF2a siRNA
EVVHL
0.020
0.015
0.010
0.005
0
No
enha
ncer
VE
GFA
-E
SLC
2A1-
E
ZN
F39
5-E
No
enha
ncer
VE
GFA
-E
SLC
2A1-
E
ZN
F39
5-E
Luci
fera
se/R
enill
a si
gnal
Luci
fera
se/R
enill
a si
gnal1.2
1.0
0.8
0.6
0.4
0.2
0
1.2
1.0
0.8
0.6
0.4
0.2
0
VE
GFA
SLC
2A1
ZN
F39
5
VE
GFA
SLC
2A1
ZN
F39
5Rel
ativ
e ge
ne e
xpre
ssio
n
Rel
ativ
e ge
ne e
xpre
ssio
nEVVHL
NTHIF2a siRNA
E F G
* *
*
* **
** * * * *
100 -
0 100 -
0 1,500 -
1 1,500 -
1
A
B
C
D
1,000 -
1 1,000 -
1
15-CD-17-0375_p1284-1305.indd 1297 10/23/17 2:18 PM
Research. on May 13, 2020. © 2017 American Association for Cancercancerdiscovery.aacrjournals.org Downloaded from
Published OnlineFirst September 11, 2017; DOI: 10.1158/2159-8290.CD-17-0375
Yao et al.RESEARCH ARTICLE
1298 | CANCER DISCOVERY November 2017 www.aacrjournals.org
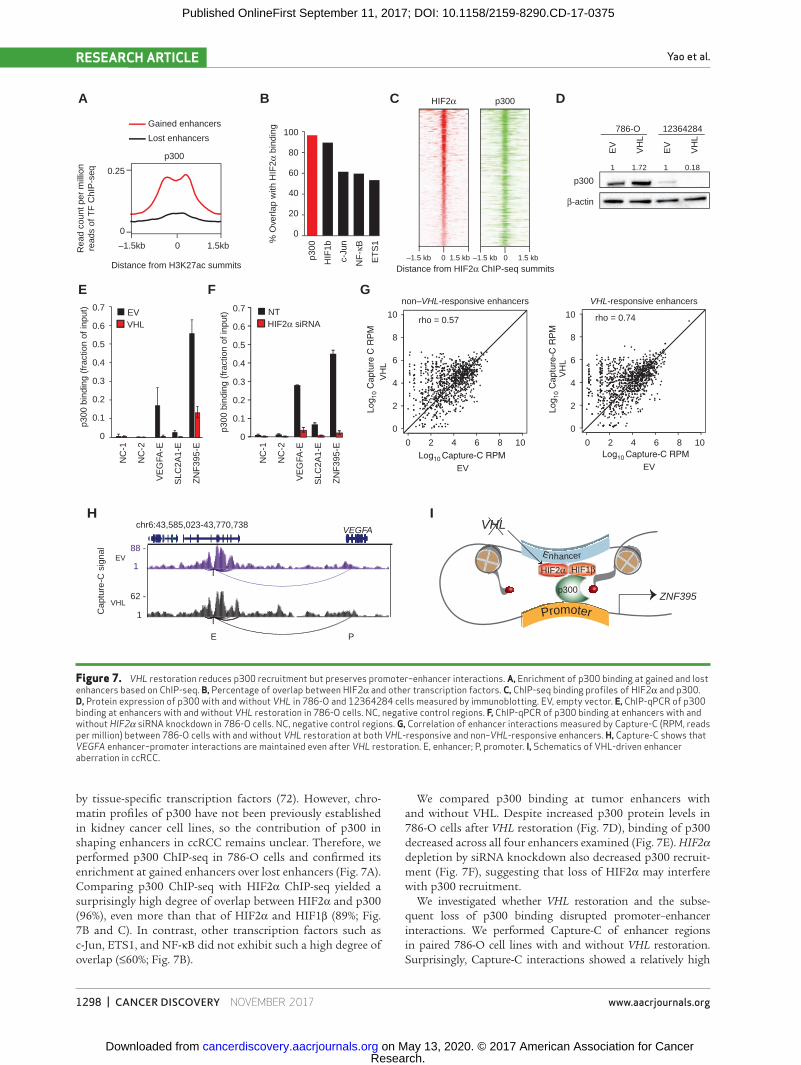
Figure 7. VHL restoration reduces p300 recruitment but preserves promoter–enhancer interactions. A, Enrichment of p300 binding at gained and lost enhancers based on ChIP-seq. B, Percentage of overlap between HIF2α and other transcription factors. C, ChIP-seq binding profiles of HIF2α and p300. D, Protein expression of p300 with and without VHL in 786-O and 12364284 cells measured by immunoblotting. EV, empty vector. E, ChIP-qPCR of p300 binding at enhancers with and without VHL restoration in 786-O cells. NC, negative control regions. F, ChIP-qPCR of p300 binding at enhancers with and without HIF2a siRNA knockdown in 786-O cells. NC, negative control regions. G, Correlation of enhancer interactions measured by Capture-C (RPM, reads per million) between 786-O cells with and without VHL restoration at both VHL-responsive and non–VHL-responsive enhancers. H, Capture-C shows that VEGFA enhancer–promoter interactions are maintained even after VHL restoration. E, enhancer; P, promoter. I, Schematics of VHL-driven enhancer aberration in ccRCC.
C
88 -
1
62 -
1
VEGFAchr6:43,585,023-43,770,738
EV
VHL
E P
p300
HIF
1b
c-Ju
n
NF
-κB
ET
S1
100
80
60
40
20
0
% O
verla
p w
ith H
IF2α
bin
ding
A B
NC
-1
NC
-2
VE
GFA
-E
SLC
2A1-
E
ZN
F39
5-E
p300
bin
ding
(fr
actio
n of
inpu
t)
D
E F
0.25
0
p300
Gained enhancers
Lost enhancers
–1.5kb 0 1.5kb
EV
VH
L
EV
VH
L
p300
β-actin
786-O 12364284
1 1.72 1 0.18
10
8
6
4
2
0
10
8
6
4
2
0
0 2 4 6 8 10 0 2 4 6 8 10
EV
VH
L
VH
L
rho = 0.57 rho = 0.74
non–VHL-responsive enhancers VHL-responsive enhancers
HIF1β
p300
Promoter
Enhancer
HVHL
HIF2α
ZNF395
Distance from H3K27ac summits
NTHIF2α siRNA
0.7
0.6
0.5
0.4
0.3
0.2
0.1
0
0.7
0.6
0.5
0.4
0.3
0.2
0.1
0
EVVHL
NC
-1
NC
-2
VE
GFA
-E
SLC
2A1-
E
ZN
F39
5-E
EV
p300
bin
ding
(fr
actio
n of
inpu
t)
p300HIF2α
G
I
–1.5 kb 0 1.5 kb –1.5 kb 0 1.5 kb
Cap
ture
-C s
igna
l
Rea
d co
unt p
er m
illio
nre
ads
of T
F C
hIP
-seq
Distance from HIF2α ChIP-seq summits
by tissue-specific transcription factors (72). However, chro-matin profiles of p300 have not been previously established in kidney cancer cell lines, so the contribution of p300 in shaping enhancers in ccRCC remains unclear. Therefore, we performed p300 ChIP-seq in 786-O cells and confirmed its enrichment at gained enhancers over lost enhancers (Fig. 7A). Comparing p300 ChIP-seq with HIF2α ChIP-seq yielded a surprisingly high degree of overlap between HIF2α and p300 (96%), even more than that of HIF2α and HIF1β (89%; Fig. 7B and C). In contrast, other transcription factors such as c-Jun, ETS1, and NF-κB did not exhibit such a high degree of overlap (≤60%; Fig. 7B).
We compared p300 binding at tumor enhancers with and without VHL. Despite increased p300 protein levels in 786-O cells after VHL restoration (Fig. 7D), binding of p300 decreased across all four enhancers examined (Fig. 7E). HIF2a depletion by siRNA knockdown also decreased p300 recruit-ment (Fig. 7F), suggesting that loss of HIF2α may interfere with p300 recruitment.
We investigated whether VHL restoration and the subse-quent loss of p300 binding disrupted promoter–enhancer interactions. We performed Capture-C of enhancer regions in paired 786-O cell lines with and without VHL restoration. Surprisingly, Capture-C interactions showed a relatively high
15-CD-17-0375_p1284-1305.indd 1298 10/23/17 2:18 PM
Research. on May 13, 2020. © 2017 American Association for Cancercancerdiscovery.aacrjournals.org Downloaded from
Published OnlineFirst September 11, 2017; DOI: 10.1158/2159-8290.CD-17-0375
VHL-Driven Enhancer Malfunction in ccRCC RESEARCH ARTICLE
November 2017 CANCER DISCOVERY | 1299
correlation between VHL-deficient and VHL-restored 786-O cells at VHL-responsive regions (r = 0.74, Pearson correlation), even higher than correlations observed at non–VHL-responsive regions (r = 0.57, Pearson correlation; Fig. 7G). As a visual exam-ple, interactions between the VEGFA promoter and enhancer were intact even after VHL restoration (Fig. 7H), indicating that loss of enhancer activity is likely insufficient to dissociate promoter–enhancer interactions. Furthermore, many of these promoter–enhancers were lineage specific; for example, the interaction between SLC2A1 enhancer with its promoter was not detected in KATOIII, a gastric cancer cell line (Supplemen-tary Fig. S9). Therefore, promoter–enhancer interactions often preexist in kidney cells, frequently in a tissue-specific manner.
DiscUssiONUnderstanding epigenomic alterations and their genetic
origin can identify new disease mechanisms (34), vulner-abilities (73, 74), and therapeutic strategies (75–77). Through comprehensive profiling of histone modifications in pri-mary normal–tumor pairs and cell lines, we generated a compendium of ccRCC-associated promoters and enhanc-ers. Our study demonstrates that the most frequent ccRCC mutational event—VHL inactivation—leads to genome-wide enhancer and superenhancer remodeling, which directly imparts ccRCC hallmarks including angiogenesis and metabolic reprogramming. ZNF395, epigenetically controlled by a VHL-responsive superenhancer, emerged as a crucial regulator of ccRCC tumorigenesis.
Our work has three main advances. First, to our knowl-edge, this is the most comprehensive atlas of histone profiles in ccRCC and will likely provide an invaluable resource to the ccRCC field. Using high-resolution multiplexed interactome data (Capture-C, ref. 56) and H3K27ac-expression correla-tion, we minimized ambiguity in enhancer assignment and further confirmed the dependency of enhancers on VHL/HIF status by reporter assays. Second, using isogenic cell lines, we show that VHL loss contributes significantly to enhancer remodeling. Even though another mutation in ccRCC, SETD2, can mediate widespread increases in chromatin acces-sibility (46) and DNA hypomethylation (78), its relatively low mutation frequency at ∼10% in all ccRCC tumors (78) can-not explain epigenetic abnormalities in the vast majority of SETD2–wild-type tumors. Lastly, an examination of somati-cally altered superenhancers enabled us to identify a master regulator crucial to the pathogenesis of ccRCC, ZNF395. Even though ZNF395 overexpression in ccRCC has been previously reported (79–81) and its proximity to a superenhancer was independently noted (42), our study is the first to pinpoint the specific VHL-dependent enhancer required for ZNF395 expression and to show ZNF395’s indispensable functional role for ccRCC tumorigenesis in vitro and in vivo.
Our data suggest that mechanistically, loss of VHL stabi-lizes HIF2α occupancy at tumor-specific gained enhancers, which in turn recruits histone acetyltransferase p300 (28, 82) to maintain H3K27 acetylation, upregulating expression of ccRCC-specific genes such as ZNF395 (Fig. 7I). Restoration of wild-type VHL resulted in codepletion of H3K27ac and H3K4me1 marks and thus abrogation of active enhancer identity at tumor-associated enhancers. Compared with the
promoter-centric occupancy of HIF1α, HIF2α is predomi-nantly found at enhancers, pointing toward a key difference between HIF1α and HIF2α. We also found that HIF2a siRNA knockdown specifically attenuates the activity of HIF2α-bound enhancers/superenhancers. Interestingly, the majority of promoter–enhancer interactions remained largely unal-tered by VHL status, suggesting that these promoter–enhancer couplings are largely stable and preformed. This is consistent with a recent report demonstrating that promoter–enhancer interactions remain largely unchanged between normoxia and hypoxia (29). Our study demonstrating VHL’s impact on chromatin remodeling also suggests that other cancer genes with high tumor-type–specific mutational penetrance, such as BRAF in melanoma (83) and APC in colon cancer (84), may also act to modify cellular epigenomes to effect broad yet disease-specific cellular changes, despite these genes not being classic chromatin modifiers.
Besides VHL, mutations in other genes such as PBRM1, SETD2, ARID1A, SMARCA4, JARID1C, and KDM6A/UTX have been reported in ccRCC (47, 85), and these are likely to aug-ment VHL’s core transcriptional effects (86), contributing to heterogeneity in disease phenotypes (87) and progression patterns (88). Using the example of 786-O cells, at least two other mutations in these cells may have a direct impact on chromatin—MLL3 (p.A3902G) and gain-of-function TP53 mutations (p.R248W). MLL3, a histone 3 lysine 4 methyltrans-ferase, is directly responsible for formation of the H3K4me1 enhancer mark (89, 90) and plays a critical role for enhancer regulation (91). Gain-of-function TP53 mutants also bind aberrantly to chromatin, especially near methyltransferases MLL1 and MLL2, potentially contributing to tumor growth via chromatin deregulation (92). Besides mutations, struc-tural variants are also known to alter enhancers via enhancer hijacking (93) or copy-number gains (94) in other cancers. Given the multitude of driver and bystander mutations in ccRCC, it is thus unlikely that VHL alone can account for all epigenomic changes observed in this tumor type. Neverthe-less, by integrating data across multiple ccRCC cell lines, our data suggest that VHL inactivation is likely to account for almost a third (32%) of all gained enhancer regions, support-ing its role as a dominant driver of epigenetic abnormalities in ccRCC despite the presence of other genetic changes.
Our epigenetic maps contain a wellspring of both well-validated and uncharacterized targets that may contribute to ccRCC tumorigenesis. We found extensive enhancer gains around well-characterized hypoxia-related targets (ref. 95; VEGFA, CXCR4, ref. 96; HK2), SLC-mediated membrane trans-porters (SLC2A1, SLC2A2, SLC38A1, ref. 97), SLC16A family (98), and adipogenesis (PLIN2, refs. 51, 99). New targets revealed in this study include SMPDL3A, which could be another important ccRCC-specific oncogene given its role in lipid and cholesterol metabolism (61, 100). Genes associated with lost superenhanc-ers, which could only be identified with normal–tumor pairs, implicated potential tumor suppressors (EHF, MAL, GCOM1, and HOXB9) that warrant further investigation.
One notable finding from this epigenomic study is the tumorigenic requirement of ZNF395 in ccRCC. ZNF395 is also known as HDBP2 (101) or papillomavirus binding fac-tor (PBF; ref. 102). ZNF395 is required for the differentiation of mesenchymal stem cells to adipocytes, by partnering with
15-CD-17-0375_p1284-1305.indd 1299 10/23/17 2:18 PM
Research. on May 13, 2020. © 2017 American Association for Cancercancerdiscovery.aacrjournals.org Downloaded from
Published OnlineFirst September 11, 2017; DOI: 10.1158/2159-8290.CD-17-0375
Yao et al.RESEARCH ARTICLE
1300 | CANCER DISCOVERY November 2017 www.aacrjournals.org
PPARγ2 to promote adipogenesis (103). ZNF395 has been shown to bind to the promoters of Huntington gene (101) and interferon-induced genes, and to cause upregulation of cancer-related genes (MACC1, PEG10, CALCOCO1, and MEF2C; ref. 104) and proangiogenic chemokines including IL6 and IL8 under hypoxia (105). It remains to be elucidated in future studies the precise mechanism contributing to ZNF395’s tumorigenic role.
The enhancer landscapes profiled in this study have impli-cations beyond ccRCC. The poorly perfused tumor core makes hypoxia a feature of virtually all solid tumors (106). MCF7 cells under hypoxia (but not normoxia) share simi-lar H3K27ac profiles as 786-O (29). Although ZNF395 is highly expressed in ccRCC, its low basal expression can be upregulated upon hypoxia in other cancer types, including glioblastoma and skin cancer (104, 105). Targeting ZNF395 or its downstream effectors in future studies may be thera-peutically relevant to both ccRCC and other hypoxic solid malignancies. Direct targeting of ZNF395 using a peptide-based cancer vaccine is undergoing phase I trials in patients with sarcoma (107–109), opening up the possibility of using immunotherapy to target the extracellular fragments of nuclear master regulators. Our study suggests that initiating a similar trial in ccRCC may be worthwhile. Moreover, given the recent progress in targeting transcription factors using various modalities, including small molecules and stapled peptides (110–112), inhibitors of ZNF395 may provide an important therapeutic inroad for ccRCC treatment.
MethODsPatient Information
Fresh–frozen normal–tumor tissues were obtained from nephrectomy cases under approvals from institutional research ethics review com-mittees and patient consent under institutional review board protocol 2010/735/B. Normal tissues were harvested from sites distant from the tumor. Refer to Supplementary Table S1 for detailed patient information.
Cell LinesCommercial cell lines (786-O, A-498, HK2, and PCS-400) were pur-
chased from ATCC. Cell lines were maintained in RPMI (Invitrogen) with 10% FBS with the exception of primary renal proximal tubule epithelial cells, PCS-400, which were maintained in Renal Epithelial Cell Basal Medium (ATCC). Cell line authentication was performed by short tandem repeat (STR) analysis (Cancer Science Institute of Singapore) in 2015 against publicly available STR profiles. Myco-plasma testing was performed using the MycoSensor PCR assay kit (Stratagene).
Establishment of Tumor-Derived Cell Lines from Primary Tumors
Tumor cells were disassociated from primary tumors by collagenase, seeded, and maintained in RPMI with 10% FBS. At 80% to 90% conflu-ency, the cells were passaged at a 1:3 ratio. Cultured cells were consid-ered to be successfully immortalized after 60 passages. Correct pairing of tumor tissues and cell lines was achieved by comparing the percent-age identity of single nucleotide polymorphisms (SNP) based on tar-geted sequencing. All tumor–cell line pairs showed identities of > 90% whereas shuffling of pairing showed identities < 80%. Tumors and cell lines from 12364284 and 40911432 showed the same VHL mutations, but 86049102 tissue (named 86049102T) is VHL-mutant, whereas the cognate 86049102 cell line (named 86049102L) is VHL–wild-type.
Stable VHL Restoration in ccRCC Lines786-O cells (WT2, VHL+) and 786-O cells (RC3, VHL−) were kindly
provided by Dr. Michael Ohh (University of Toronto). Stable trans-duction of VHL was performed in A-498, 12364284, and 40911432 cells as follows: HA-VHL wt-pBabe-puro plasmid (a gift from Dr. William Kaelin, Dana Farber Cancer Institute; Addgene plasmid # 19234) was transfected into PlatA cells (RV-102, Cell Biolabs) at 2 μg DNA/well of a 6-well plate using Lipofectamine 3000 (LifeTechnolo-gies). A medium change was performed 10 to 16 hours after transfec-tion. The supernatant from PlatA cells containing retroviruses was harvested 48 hours later and added to ccRCC cells, which were then selected with puromycin for 3 days after transduction.
Histone Nano-ChIP-seqNano-ChIP-seq was performed as previously described (113) with
slight modifications. Fresh–frozen cancer and normal tissues were dissected using a razor blade to obtain ∼5 mg of tissue. The tissues were fixed in 1% formaldehyde for 10 minutes at room temperature. Fixation was stopped by addition of glycine to a final concentration of 125 nmol/L. Tissue pieces were washed 3 times with TBSE buffer. Pulverized tissues were lysed in 100 μL lysis buffer and sonicated for 16 cycles (30s on, 30s off) using a Bioruptor (Diagenode). The fol-lowing antibodies were used: H3K27ac (ab4729, Abcam), H3K4me3 (07-473, Millipore), H3K4me1 (ab8895, Abcam), and H3K27me3 (07-449, Millipore). The total volume of immunoprecipitation was 1 mL and the amount of antibody used was 2 μg. The input DNA was precleared with protein G Dynabeads (Life Technologies) for 1 hour at 4°C and then incubated with antibodies conjugated protein G beads overnight at 4°C. The beads were washed 3 times with cold wash buffer. After recovery of ChIP and input DNA, whole-genome amplification was performed using the WGA4 kit (Sigma-Aldrich) and BpmI-WGA primers. Amplified DNA was digested with BpmI [New England Biolabs (NEB)]. After that, 30 ng of the amplified DNA was used with the NEBNext ChIP-seq library prep reagent set (NEB). ChIP-seq in cell lines was performed using the same Nano-ChIP-seq protocol described above but with 1 × 10⁶ cells. Each library was sequenced to an average depth of 20 to 30 million raw reads on HiSeq2500 using 101-bp single end reads.
Histone ChIP-seq AnalysisSequencing tags were mapped against the human reference genome
(hg19) using Burrows-Wheeler Aligner (BWA-mem; ref. 114; version 0.7.10). Reads were trimmed 10 bp from the front and the back to produce 81 bp. Only reads with mapQ >10 and with duplicates removed by rmdup were used for subsequent analysis. Significant peaks were called using CCAT (P < 0.05; ref. 115). The strength and quality of immunoprecipitation were assessed using CHANCE (116).
Transcription Factor ChIP-seqFor each transcription factor, 3 × 10⁷ cells were cross-linked with
1% formaldehyde for 10 minutes at room temperature and stopped by adding glycine to a final concentration of 125 nmol/L. Chroma-tin was extracted and sonicated to ∼500 bp (Vibra cell, SONICS). The following antibodies were used for chromatin immunopre-cipitation: c-Jun (sc-1694, Santa Cruz Biotechnology), NF-κB p65 (sc-372, Santa Cruz Biotechnology), ETS1 (sc-350, Santa Cruz Biotechnology), HIF1α (610959, BD Biosciences), HIF2α (NB100-122, Novus Bio), and p300 (sc-585, Santa Cruz Biotechnology). The total volume of immunoprecipitation was 1.5 mL and the amount of antibody used was 15 μg. Input DNAs were precleared with pro-tein G Dynabeads (LifeTechnologies) for 2 hours at 4°C and then incubated with antibody-conjugated protein G beads overnight at 4°C. The beads were washed 6 times with wash buffer at room temperature. At least 10 ng of the DNA was used with the NEBNext
15-CD-17-0375_p1284-1305.indd 1300 10/23/17 2:18 PM
Research. on May 13, 2020. © 2017 American Association for Cancercancerdiscovery.aacrjournals.org Downloaded from
Published OnlineFirst September 11, 2017; DOI: 10.1158/2159-8290.CD-17-0375
VHL-Driven Enhancer Malfunction in ccRCC RESEARCH ARTICLE
November 2017 CANCER DISCOVERY | 1301
ChIP-seq library prep reagent set (NEB). Each library was sequenced to an average depth of 30 to 50 million reads on a HiSeq2500 using 101-bp single-end reads.
Capture-CCapture-C was performed as previously described (56). Briefly, 1 × 10⁷
cells were cross-linked by 2% formaldehyde, followed by lysis, homog-enization, DpnII digestion, ligation, and de–cross-linking. DNA was sonicated using a Covaris to 150 to 200 bp to produce DNA suitable for oligo capture. A total of 3 μg of sheared DNA was used for sequencing library preparation (NEB). Enhancer sequences were double captured by hybridization to customized biotinylated oligos (IDT) and enriched with Dynabeads (Life Technologies). Captured DNA was sequenced to an average depth of 2 million reads per probe on the HiSeq Illumina platform using 150-bp paired-end reads.
Capture-C Analysis and Gene AssignmentPreprocessing of raw reads was performed to remove adaptor
sequences (trim_galore, http://www.bioinformatics.babraham.ac.uk/projects/trim_galore/), and overlapping reads were merged using FLASH (117). In order to achieve short read mapping to the hg19 reference genome, the resulting preprocessed reads were then in silico digested with DpnII and aligned using Bowtie (using p1, m2, best, and strata settings). Aligned reads were processed using Capture-C analyzer (118) to (i) remove PCR duplicates; (ii) classify subfragments as “capture” if they were contained within the capture fragment, “proximity exclusion” if they were within 1 Kb on either side of the capture fragment, or “reporter” if they were outside of the “capture” and “proximity exclusion” regions; and (iii) normalize read counts per 100,000 interactions in bigwig format. We additionally used the r3Cseq package (119) on the capture and reporter fragments to identify significant interactions of the viewpoint against a scaled back-ground (q-value < 0.05). Gene assignment is defined by the overlap of significant Capture-C peaks with genes with start and end defined by GENCODE v19. Interactions were plotted using Epigenome Gateway v40.0.
Identification of Differentially Enriched RegionsSignificant H3K27ac peaks called by CCAT were merged across all
normal–tumor samples. The same was performed with H3K4me1 and H3K4me3 ChIP-seq data. TSS were based on GENCODE v19. Promoters were defined as regions of overlap between H3K27ac and H3K4me3 and also overlapping with ±2.0 Kb around the TSS. Enhancers were defined as regions of overlap between H3K27ac and H3K4me1 but not overlapping with promoters. To minimize stromal contamination, we performed further filtering using cell line data, where enhancers and promoters not overlapping with H3K27ac peaks in any of the cell lines were discarded. Wiggle files of window size 50 bp were generated using MEDIPs (120) from bam files. The input-subtracted signal for each promoter or enhancer region was computed using bigWigAverageOverBed to yield reads per kilobase per million (RPKM). The RPKM of H3K27ac, H3K4me1, and H3K4me3 ChIP-seq from promoters and enhancers were corrected for batch effects using Combat. Tumor-specific regions were defined as regions that have a fold difference of ≥2 and a difference of 0.5 RPKM from patient-matched normal tissue. Normal regions were defined as regions that have a fold difference of ≤0.5, and a difference of −0.5 RPKM from the corresponding regions in patient-matched tumors. Recurrently gained regions were defined as gain in ≥5/10 patients and no loss in any patients. Recurrently lost regions were defined as loss in ≥5/10 patients and no gain in any patients. Statistical testing for each cis-regulatory region was performed using paired t tests with Benjamini–Hochberg correction. The differential regions were visualized using NGSplot (121).
Identification of Superenhancer RegionsSuperenhancer regions were identified using ROSE (ref. 35; with
promoter excluded), using H3K27ac peak regions merged from all patients (both normal and tumor tissue). Wiggle files of window size 50 bp were generated using MEDIPs (120) from bam files. The input-subtracted signal for each superenhancer was computed using bigWigAverageOverBed (sum of reads over covered bases). The superenhancer regions were ranked by the average difference of normal–tumor H3K27ac ChIP-seq signals. Gained superenhancers were defined as regions that have average differential H3K27ac ChIP-seq signals >0. Lost superenhancers were defined as regions that have average differential H3K27ac ChIP-seq signals <0.
Additional methods can be found in Supplementary Methods.
Data AccessionChIP-seq and RNA-seq data are available at Gene Expression
Omnibus (GSE86095). https://www.ncbi.nlm.nih.gov/geo/query/acc .cgi?acc=GSE86095
Disclosure of Potential Conflicts of InterestNo potential conflicts of interest were disclosed.
Authors’ ContributionsConception and design: X. Yao, J. Tan, B.C. Tan, B.T. Teh, P. TanDevelopment of methodology: X. Yao, J. Tan, K.J. Lim, Z. Li, M. Xing, G. Wijaya, J.O.J. Davies, G. Loh, B.C. Tan, S.G. Rozen, S. Li, D.L. Silver, J.R. Hughes, B.T. Teh, P. TanAcquisition of data (provided animals, acquired and managed patients, provided facilities, etc.): X. Yao, J. Tan, Z. Li, D. Huang, M. Xing, Y.S. Chan, J.Z. Qu, S.T. Tay, Y.N. Lam, J.H. Hong, A.P. Lee-Lim, C.Z. He, C. Xu, S.S. Myint, B.C. Tan, S.G. Rozen, C.W.S. Cheng, K.T.E. Chang, P.H. Tan, A. Lezhava, B.T. TehAnalysis and interpretation of data (e.g., statistical analysis, biostatistics, computational analysis): X. Yao, J. Tan, K.J. Lim, W.F. Ooi, P. Guan, C.Z. He, T. Nandi, A. Qamra, S.G. Rozen, B.T. Teh, P. TanWriting, review, and/or revision of the manuscript: X. Yao, J. Tan, K.J. Lim, T. Nandi, B.T. Teh, P. TanAdministrative, technical, or material support (i.e., reporting or organizing data, constructing databases): X. Yao, J. Tan, K.J. Lim, J. Koh, Z. Li, Y.S. Chan, S.T. Tay, M.S.W. Ng, J.S. Lin, T. Nandi, G. Loh, B.C. Tan, S.G. Rozen, Q. Yu, I.B.H. Tan, A. Lezhava, G. Steger, B.T. Teh, P. TanStudy supervision: X. Yao, S.G. Rozen, B.T. Teh, P. TanOther (provided important technical advice and reagents): J.Y. Goh
AcknowledgmentsWe thank Hui Hoon Chua, Angie Tan, and Liang Kai Koh for
their administrative support. We thank the Sequencing and Sci-entific Computing teams at the Genome Institute of Singapore for sequencing services and data management capabilities, and the Duke-NUS Genome Biology Facility for sequencing services. We thank the Advanced Molecular Pathology Laboratory of the Institute of Molecular and Cell Biology for pathology evaluation. Xiaosai Yao dedicates this paper to the memory of her mother, Tan Limin, for her unconditional love and support.
Grant SupportThis work was supported by Biomedical Research Council Young
Investigator Grant 1510851024, National Natural Science Founda-tion of China 61661146004, National Research Foundation grant
15-CD-17-0375_p1284-1305.indd 1301 10/23/17 2:18 PM
Research. on May 13, 2020. © 2017 American Association for Cancercancerdiscovery.aacrjournals.org Downloaded from
Published OnlineFirst September 11, 2017; DOI: 10.1158/2159-8290.CD-17-0375
Yao et al.RESEARCH ARTICLE
1302 | CANCER DISCOVERY November 2017 www.aacrjournals.org
NRF2016NRF-NSFC001-057, and National Medical Research Council grants NMRC/STaR/0026/2015, NMRC/STAR/0024/2014, NMRC/CIRG/1402/2014, and NMRC/CBRG/069/2014. Core fund-ing was provided by the Genome Institute of Singapore and Institute of Molecular and Cell Biology under the Agency for Science, Technology and Research, and Duke-NUS Medical School. Other sources of support include the Cancer Science Institute of Singapore, NUS, funded by the National Research Foundation Singapore and the Singapore Ministry of Education under its Research Centres of Excellence initiative, and Biomedical Research Council Strategic Positioning Fund 2012/001. J.R. Hughes was supported by a Wellcome Trust Strategic Award (reference 106130/Z/14/Z) and Medical Research Council (MRC) Core funding. J.O.J. Davies was funded by a Wellcome Trust Clinical Research Training Fellowship (ref 098931/Z/12/Z).
Received April 8, 2017; revised July 19, 2017; accepted August 25, 2017; published OnlineFirst September 11, 2017.
REFEREnCES 1. Ferlay J SI, Ervik M, Dikshit R, Eser S, Mathers C, Rebelo M, et al.
GLOBOCAN. Cancer Incidence and Mortality Worldwide: IARC CancerBase No. 11. 2014.
2. Society AC. Survival rates for kidney cancer by stage. Atlanta, GA: Society AC.
3. Rini BI, Flaherty K. Clinical effect and future considerations for molecularly-targeted therapy in renal cell carcinoma. Urol Oncol 2008;26:543–9.
4. Rini BI, Atkins MB. Resistance to targeted therapy in renal-cell car-cinoma. Lancet Oncol 2009;10:992–1000.
5. Gerlinger M, Horswell S, Larkin J, Rowan AJ, Salm MP, Varela I, et al. Genomic architecture and evolution of clear cell renal cell carcinomas defined by multiregion sequencing. Nat Genet 2014;46: 225–33.
6. Gerlinger M, Rowan AJ, Horswell S, Larkin J, Endesfelder D, Gronroos E, et al. Intratumor heterogeneity and branched evolu-tion revealed by multiregion sequencing. N Engl J Med 2012;366: 883–92.
7. Gu YF, Cohn S, Christie A, McKenzie T, Wolff NC, Do QN, et al. Modeling Renal cell carcinoma in mice: Bap1 and Pbrm1 inactiva-tion drive tumor grade. Cancer Discov 2017;7:900–17.
8. Nargund AM, Pham CG, Dong Y, Wang PI, Osmangeyoglu HU, Xie Y, et al. The SWI/SNF protein PBRM1 restrains VHL-loss-driven clear cell renal cell carcinoma. Cell Rep 2017;18:2893–906.
9. Harlander S, Schonenberger D, Toussaint NC, Prummer M, Cata-lano A, Brandt L, et al. Combined mutation in Vhl, Trp53 and Rb1 causes clear cell renal cell carcinoma in mice. Nat Med 2017;23: 869–77.
10. Wang SS, Gu YF, Wolff N, Stefanius K, Christie A, Dey A, et al. Bap1 is essential for kidney function and cooperates with Vhl in renal tumorigenesis. Proc Natl Acad Sci U S A 2014;111: 16538–43.
11. Bailey ST, Smith AM, Kardos J, Wobker SE, Wilson HL, Krishnan B, et al. MYC activation cooperates with Vhl and Ink4a/Arf loss to induce clear cell renal cell carcinoma. Nat Commun 2017;8: 15770.
12. Iwai K, Yamanaka K, Kamura T, Minato N, Conaway RC, Conaway JW, et al. Identification of the von Hippel–Lindau tumor-suppressor protein as part of an active E3 ubiquitin ligase complex. Proc Natl Acad Sci U S A 1999;96:12436–41.
13. Lisztwan J, Imbert G, Wirbelauer C, Gstaiger M, Krek W. The von Hippel–Lindau tumor suppressor protein is a component of an E3 ubiquitin-protein ligase activity. Genes Dev 1999;13:1822–33.
14. Maxwell PH, Wiesener MS, Chang GW, Clifford SC, Vaux EC, Cockman ME, et al. The tumour suppressor protein VHL targets hypoxia-inducible factors for oxygen-dependent proteolysis. Nature 1999;399:271–5.
15. Jaakkola P, Mole DR, Tian YM, Wilson MI, Gielbert J, Gaskell SJ, et al. Targeting of HIF-alpha to the von Hippel–Lindau ubiqui-tylation complex by O2-regulated prolyl hydroxylation. Science 2001;292:468–72.
16. Ebert BL, Bunn HF. Regulation of transcription by hypoxia requires a multiprotein complex that includes hypoxia-inducible factor 1, an adjacent transcription factor, and p300/CREB binding protein. Mol Cell Biol 1998;18:4089–96.
17. Ema M, Hirota K, Mimura J, Abe H, Yodoi J, Sogawa K, et al. Molecu-lar mechanisms of transcription activation by HLF and HIF1alpha in response to hypoxia: their stabilization and redox signal-induced interaction with CBP/p300. EMBO J 1999;18:1905–14.
18. Biswas S, Troy H, Leek R, Chung YL, Li JL, Raval RR, et al. Effects of HIF-1alpha and HIF2alpha on growth and metabolism of clear-cell renal cell carcinoma 786-0 xenografts. J Oncol 2010;2010:757908.
19. Metallo CM, Gameiro PA, Bell EL, Mattaini KR, Yang J, Hiller K, et al. Reductive glutamine metabolism by IDH1 mediates lipogenesis under hypoxia. Nature 2012;481:380–4.
20. Rankin EB, Rha J, Selak MA, Unger TL, Keith B, Liu Q, et al. Hypoxia-inducible factor 2 regulates hepatic lipid metabolism. Mol Cell Biol 2009;29:4527–38.
21. Schodel J, Bardella C, Sciesielski LK, Brown JM, Pugh CW, Buckle V, et al. Common genetic variants at the 11q13.3 renal cancer suscep-tibility locus influence binding of HIF to an enhancer of cyclin D1 expression. Nat Genet 2012;44:420–5, S1–2.
22. Roe JS, Kim H, Lee SM, Kim ST, Cho EJ, Youn HD. p53 stabiliza-tion and transactivation by a von Hippel–Lindau protein. Mol Cell 2006;22:395–405.
23. Tamiya H, Ikeda T, Jeong JH, Saito T, Yano F, Jung YK, et al. Analy-sis of the Runx2 promoter in osseous and non-osseous cells and identification of HIF2A as a potent transcription activator. Gene 2008;416:53–60.
24. Ko CY, Tsai MY, Tseng WF, Cheng CH, Huang CR, Wu JS, et al. Integration of CNS survival and differentiation by HIF2alpha. Cell Death Differ 2011;18:1757–70.
25. Imtiyaz HZ, Williams EP, Hickey MM, Patel SA, Durham AC, Yuan LJ, et al. Hypoxia-inducible factor 2alpha regulates macrophage function in mouse models of acute and tumor inflammation. J Clin Invest 2010;120:2699–714.
26. Xie L, Collins JF. Transcription factors Sp1 and Hif2alpha medi-ate induction of the copper-transporting ATPase (Atp7a) gene in intestinal epithelial cells during hypoxia. J Biol Chem 2013;288: 23943–52.
27. Ruas JL, Berchner-Pfannschmidt U, Malik S, Gradin K, Fandrey J, Roeder RG, et al. Complex regulation of the transactivation func-tion of hypoxia-inducible factor-1 alpha by direct interaction with two distinct domains of the CREB-binding protein/p300. J Biol Chem 2010;285:2601–9.
28. Freedman SJ, Sun ZY, Poy F, Kung AL, Livingston DM, Wag-ner G, et al. Structural basis for recruitment of CBP/p300 by hypoxia-inducible factor-1 alpha. Proc Natl Acad Sci U S A 2002;99: 5367–72.
29. Platt JL, Salama R, Smythies J, Choudhry H, Davies JO, Hughes JR, et al. Capture-C reveals preformed chromatin interactions between HIF-binding sites and distant promoters. EMBO Rep 2016;17: 1410–21.
30. Salama R, Masson N, Simpson P, Sciesielski LK, Sun M, Tian YM, et al. Heterogeneous effects of direct hypoxia pathway activation in kidney cancer. PLoS One 2015;10:e0134645.
31. Grampp S, Platt JL, Lauer V, Salama R, Kranz F, Neumann VK, et al. Genetic variation at the 8q24.21 renal cancer susceptibil-ity locus affects HIF binding to a MYC enhancer. Nat Commun 2016;7:13183.
32. Heinz S, Romanoski CE, Benner C, Glass CK. The selection and function of cell type-specific enhancers. Nat Rev Mol Cell Biol 2015;16:144–54.
33. Heintzman ND, Hon GC, Hawkins RD, Kheradpour P, Stark A, Harp LF, et al. Histone modifications at human enhancers reflect global cell-type-specific gene expression. Nature 2009;459:108–12.
15-CD-17-0375_p1284-1305.indd 1302 10/23/17 2:18 PM
Research. on May 13, 2020. © 2017 American Association for Cancercancerdiscovery.aacrjournals.org Downloaded from
Published OnlineFirst September 11, 2017; DOI: 10.1158/2159-8290.CD-17-0375
VHL-Driven Enhancer Malfunction in ccRCC RESEARCH ARTICLE
November 2017 CANCER DISCOVERY | 1303
34. Lin CY, Erkek S, Tong Y, Yin L, Federation AJ, Zapatka M, et al. Active medulloblastoma enhancers reveal subgroup-specific cellular origins. Nature 2016;530:57–62.
35. Whyte WA, Orlando DA, Hnisz D, Abraham BJ, Lin CY, Kagey MH, et al. Master transcription factors and mediator establish super-enhancers at key cell identity genes. Cell 2013;153:307–19.
36. Liu F, Hon GC, Villa GR, Turner KM, Ikegami S, Yang H, et al. EGFR mutation promotes glioblastoma through epigenome and transcription factor network remodeling. Mol Cell 2015;60:307–18.
37. Riggi N, Knoechel B, Gillespie SM, Rheinbay E, Boulay G, Suva ML, et al. EWS-FLI1 utilizes divergent chromatin remodeling mecha-nisms to directly activate or repress enhancer elements in Ewing sarcoma. Cancer Cell 2014;26:668–81.
38. Niu X, Zhang T, Liao L, Zhou L, Lindner DJ, Zhou M, et al. The von Hippel–Lindau tumor suppressor protein regulates gene expression and tumor growth through histone demethylase JARID1C. Onco-gene 2012;31:776–86.
39. Ramakrishnan S, Ku S, Ciamporcero E, Miles KM, Attwood K, Chin-tala S, et al. HDAC 1 and 6 modulate cell invasion and migration in clear cell renal cell carcinoma. BMC Cancer 2016;16:617.
40. Beyer S, Kristensen MM, Jensen KS, Johansen JV, Staller P. The histone demethylases JMJD1A and JMJD2B are transcriptional targets of hypoxia-inducible factor HIF. J Biol Chem 2008;283: 36542–52.
41. Luo W, Chang R, Zhong J, Pandey A, Semenza GL. Histone dem-ethylase JMJD2C is a coactivator for hypoxia-inducible factor 1 that is required for breast cancer progression. Proc Natl Acad Sci U S A 2012;109:E3367–76.
42. Rhie SK, Guo Y, Tak YG, Yao L, Shen H, Coetzee GA, et al. Identi-fication of activated enhancers and linked transcription factors in breast, prostate, and kidney tumors by tracing enhancer networks using epigenetic traits. Epigenetics Chromatin 2016;9:50.
43. Heintzman ND, Stuart RK, Hon G, Fu Y, Ching CW, Hawkins RD, et al. Distinct and predictive chromatin signatures of transcrip-tional promoters and enhancers in the human genome. Nat Genet 2007;39:311–8.
44. Creyghton MP, Cheng AW, Welstead GG, Kooistra T, Carey BW, Steine EJ, et al. Histone H3K27ac separates active from poised enhancers and predicts developmental state. Proc Natl Acad Sci U S A 2010;107:21931–6.
45. Akhtar-Zaidi B, Cowper-Sal-lari R, Corradin O, Saiakhova A, Bar-tels CF, Balasubramanian D, et al. Epigenomic enhancer profiling defines a signature of colon cancer. Science 2012;336:736–9.
46. Simon JM, Hacker KE, Singh D, Brannon AR, Parker JS, Weiser M, et al. Variation in chromatin accessibility in human kidney cancer links H3K36 methyltransferase loss with widespread RNA process-ing defects. Genome Res 2014;24:241–50.
47. Cancer Genome Atlas Research N. Comprehensive molecular char-acterization of clear cell renal cell carcinoma. Nature 2013;499:43–9.
48. Iyer MK, Niknafs YS, Malik R, Singhal U, Sahu A, Hosono Y, et al. The landscape of long noncoding RNAs in the human transcrip-tome. Nat Genet 2015;47:199–208.
49. Purdue MP, Johansson M, Zelenika D, Toro JR, Scelo G, Moore LE, et al. Genome-wide association study of renal cell carcinoma identifies two susceptibility loci on 2p21 and 11q13.3. Nat Genet 2011;43:60–5.
50. McLean CY, Bristor D, Hiller M, Clarke SL, Schaar BT, Lowe CB, et al. GREAT improves functional interpretation of cis-regulatory regions. Nat Biotechnol 2010;28:495–501.
51. Qiu B, Ackerman D, Sanchez DJ, Li B, Ochocki JD, Grazioli A, et al. HIF2alpha-dependent lipid storage promotes endoplasmic reticu-lum homeostasis in clear-cell renal cell carcinoma. Cancer Discov 2015;5:652–67.
52. Kim JW, Tchernyshyov I, Semenza GL, Dang CV. HIF-1-mediated expression of pyruvate dehydrogenase kinase: a metabolic switch required for cellular adaptation to hypoxia. Cell Metab 2006;3:177–85.
53. Papandreou I, Cairns RA, Fontana L, Lim AL, Denko NC. HIF-1 mediates adaptation to hypoxia by actively downregulating mito-chondrial oxygen consumption. Cell Metab 2006;3:187–97.
54. Wise DR, DeBerardinis RJ, Mancuso A, Sayed N, Zhang XY, Pfeiffer HK, et al. Myc regulates a transcriptional program that stimulates mitochondrial glutaminolysis and leads to glutamine addiction. Proc Natl Acad Sci U S A 2008;105:18782–7.
55. Gameiro PA, Yang J, Metelo AM, Perez-Carro R, Baker R, Wang Z, et al. In vivo HIF-mediated reductive carboxylation is regulated by citrate levels and sensitizes VHL-deficient cells to glutamine depri-vation. Cell Metab 2013;17:372–85.
56. Davies JO, Telenius JM, McGowan SJ, Roberts NA, Taylor S, Higgs DR, et al. Multiplexed analysis of chromosome conformation at vastly improved sensitivity. Nat Methods 2016;13:74–80.
57. Parker SC, Stitzel ML, Taylor DL, Orozco JM, Erdos MR, Akiyama JA, et al. Chromatin stretch enhancer states drive cell-specific gene regulation and harbor human disease risk variants. Proc Natl Acad Sci U S A 2013;110:17921–6.
58. Albino D, Longoni N, Curti L, Mello-Grand M, Pinton S, Civenni G, et al. ESE3/EHF controls epithelial cell differentiation and its loss leads to prostate tumors with mesenchymal and stem-like features. Cancer Res 2012;72:2889–900.
59. Cangemi R, Mensah A, Albertini V, Jain A, Mello-Grand M, Chiorino G, et al. Reduced expression and tumor suppressor function of the ETS transcription factor ESE-3 in prostate cancer. Oncogene 2008;27:2877–85.
60. Dalgin GS, Holloway DT, Liou LS, DeLisi C. Identification and char-acterization of renal cell carcinoma gene markers. Cancer Inform 2007;3:65–92.
61. Noto PB, Bukhtiyarov Y, Shi M, McKeever BM, McGeehan GM, Lala DS. Regulation of sphingomyelin phosphodiesterase acid-like 3A gene (SMPDL3A) by liver X receptors. Mol Pharmacol 2012;82:719–27.
62. Iliopoulos O, Kibel A, Gray S, Kaelin WG Jr. Tumour suppression by the human von Hippel–Lindau gene product. Nat Med 1995;1: 822–6.
63. Gnarra JR, Zhou S, Merrill MJ, Wagner JR, Krumm A, Papavassil-iou E, et al. Post-transcriptional regulation of vascular endothelial growth factor mRNA by the product of the VHL tumor suppressor gene. Proc Natl Acad Sci U S A 1996;93:10589–94.
64. Schoenfeld A, Davidowitz EJ, Burk RD. A second major native von Hippel–Lindau gene product, initiated from an internal translation start site, functions as a tumor suppressor. Proc Natl Acad Sci U S A 1998;95:8817–22.
65. Heinz S, Benner C, Spann N, Bertolino E, Lin YC, Laslo P, et al. Simple combinations of lineage-determining transcription factors prime cis-regulatory elements required for macrophage and B cell identities. Mol Cell 2010;38:576–89.
66. An J, Liu H, Magyar CE, Guo Y, Veena MS, Srivatsan ES, et al. Hyper-activated JNK is a therapeutic target in pVHL-deficient renal cell carcinoma. Cancer Res 2013;73:1374–85.
67. Elvert G, Kappel A, Heidenreich R, Englmeier U, Lanz S, Acker T, et al. Cooperative interaction of hypoxia-inducible factor-2alpha (HIF-2alpha) and Ets-1 in the transcriptional activation of vas-cular endothelial growth factor receptor-2 (Flk-1). J Biol Chem 2003;278:7520–30.
68. Steunou AL, Ducoux-Petit M, Lazar I, Monsarrat B, Erard M, Mul-ler C, et al. Identification of the hypoxia-inducible factor 2alpha nuclear interactome in melanoma cells reveals master proteins involved in melanoma development. Mol Cell Proteomics 2013;12: 736–48.
69. Kung AL, Zabludoff SD, France DS, Freedman SJ, Tanner EA, Vieira A, et al. Small molecule blockade of transcriptional coactivation of the hypoxia-inducible factor pathway. Cancer Cell 2004;6:33–43.
70. Tohkin M, Fukuhara M, Elizondo G, Tomita S, Gonzalez FJ. Aryl hydrocarbon receptor is required for p300-mediated induction of DNA synthesis by adenovirus E1A. Mol Pharmacol 2000;58:845–51.
71. Kung AL, Wang S, Klco JM, Kaelin WG, Livingston DM. Suppres-sion of tumor growth through disruption of hypoxia-inducible transcription. Nat Med 2000;6:1335–40.
72. Visel A, Blow MJ, Li Z, Zhang T, Akiyama JA, Holt A, et al. ChIP-seq accurately predicts tissue-specific activity of enhancers. Nature 2009;457:854–8.
15-CD-17-0375_p1284-1305.indd 1303 10/23/17 2:18 PM
Research. on May 13, 2020. © 2017 American Association for Cancercancerdiscovery.aacrjournals.org Downloaded from
Published OnlineFirst September 11, 2017; DOI: 10.1158/2159-8290.CD-17-0375
Yao et al.RESEARCH ARTICLE
1304 | CANCER DISCOVERY November 2017 www.aacrjournals.org
73. Bitler BG, Aird KM, Garipov A, Li H, Amatangelo M, Kossenkov AV, et al. Synthetic lethality by targeting EZH2 methyltransferase activ-ity in ARID1A-mutated cancers. Nat Med 2015;21:231–8.
74. Bernt KM, Zhu N, Sinha AU, Vempati S, Faber J, Krivtsov AV, et al. MLL-rearranged leukemia is dependent on aberrant H3K79 meth-ylation by DOT1L. Cancer Cell 2011;20:66–78.
75. Loven J, Hoke HA, Lin CY, Lau A, Orlando DA, Vakoc CR, et al. Selective inhibition of tumor oncogenes by disruption of super-enhancers. Cell 2013;153:320–34.
76. McCabe MT, Ott HM, Ganji G, Korenchuk S, Thompson C, Van Aller GS, et al. EZH2 inhibition as a therapeutic strategy for lymphoma with EZH2-activating mutations. Nature 2012;492: 108–12.
77. Daigle SR, Olhava EJ, Therkelsen CA, Majer CR, Sneeringer CJ, Song J, et al. Selective killing of mixed lineage leukemia cells by a potent small-molecule DOT1L inhibitor. Cancer Cell 2011;20:53–65.
78. Cancer Genome Atlas Research Network. Comprehensive molecular characterization of clear cell renal cell carcinoma. Nature 2013; 499:43–9.
79. Kim Y, Choi JW, Lee JH, Kim YS. Loss of CDC14B expression in clear cell renal cell carcinoma: meta-analysis of microarray data sets. Am J Clin Pathol 2014;141:551–8.
80. Skubitz KM, Zimmermann W, Kammerer R, Pambuccian S, Skubitz AP. Differential gene expression identifies subgroups of renal cell carcinoma. J Lab Clin Med 2006;147:250–67.
81. Wozniak MB, Le Calvez-Kelm F, Abedi-Ardekani B, Byrnes G, Durand G, Carreira C, et al. Integrative genome-wide gene expres-sion profiling of clear cell renal cell carcinoma in Czech Republic and in the United States. PLoS One 2013;8:e57886.
82. Gu J, Milligan J, Huang LE. Molecular mechanism of hypoxia-inducible factor 1alpha-p300 interaction. A leucine-rich interface regulated by a single cysteine. J Biol Chem 2001;276:3550–4.
83. Hodis E, Watson IR, Kryukov GV, Arold ST, Imielinski M, Theuril-lat JP, et al. A landscape of driver mutations in melanoma. Cell 2012;150:251–63.
84. Cancer Genome Atlas Network. Comprehensive molecular char-acterization of human colon and rectal cancer. Nature 2012;487: 330–7.
85. Varela I, Tarpey P, Raine K, Huang D, Ong CK, Stephens P, et al. Exome sequencing identifies frequent mutation of the SWI/SNF complex gene PBRM1 in renal carcinoma. Nature 2011;469: 539–42.
86. Gao W, Li W, Xiao T, Liu XS, Kaelin WG Jr. Inactivation of the PBRM1 tumor suppressor gene amplifies the HIF-response in VHL−/− clear cell renal carcinoma. Proc Natl Acad Sci U S A 2017;114: 1027–32.
87. Bi M, Zhao S, Said JW, Merino MJ, Adeniran AJ, Xie Z, et al. Genomic characterization of sarcomatoid transformation in clear cell renal cell carcinoma. Proc Natl Acad Sci U S A 2016;113: 2170–5.
88. Ho TH, Park IY, Zhao H, Tong P, Champion MD, Yan H, et al. High-resolution profiling of histone h3 lysine 36 trimethylation in metastatic renal cell carcinoma. Oncogene 2016;35:1565–74.
89. Herz HM, Mohan M, Garruss AS, Liang K, Takahashi YH, Mickey K, et al. Enhancer-associated H3K4 monomethylation by Trithorax-related, the Drosophila homolog of mammalian Mll3/Mll4. Genes Dev 2012;26:2604–20.
90. Hu D, Gao X, Morgan MA, Herz HM, Smith ER, Shilatifard A. The MLL3/MLL4 branches of the COMPASS family function as major histone H3K4 monomethylases at enhancers. Mol Cell Biol 2013;33:4745–54.
91. Dorighi KM, Swigut T, Henriques T, Bhanu NV, Scruggs BS, Nady N, et al. Mll3 and Mll4 facilitate enhancer RNA synthesis and tran-scription from promoters independently of H3K4 monomethyla-tion. Mol Cell 2017;66:568–76e4.
92. Zhu J, Sammons MA, Donahue G, Dou Z, Vedadi M, Getlik M, et al. Gain-of-function p53 mutants co-opt chromatin pathways to drive cancer growth. Nature 2015;525:206–11.
93. Northcott PA, Lee C, Zichner T, Stutz AM, Erkek S, Kawauchi D, et al. Enhancer hijacking activates GFI1 family oncogenes in medul-loblastoma. Nature 2014;511:428–34.
94. Zhang X, Choi PS, Francis JM, Imielinski M, Watanabe H, Cherniack AD, et al. Identification of focally amplified lineage-specific super-enhancers in human epithelial cancers. Nat Genet 2016;48:176–82.
95. Schodel J, Grampp S, Maher ER, Moch H, Ratcliffe PJ, Russo P, et al. Hypoxia, hypoxia-inducible transcription factors, and renal cancer. Eur Urol 2016;69:646–57.
96. Vanharanta S, Shu W, Brenet F, Hakimi AA, Heguy A, Viale A, et al. Epigenetic expansion of VHL-HIF signal output drives multiorgan metastasis in renal cancer. Nat Med 2013;19:50–6.
97. Broer A, Rahimi F, Broer S. Deletion of amino acid transporter ASCT2 (SLC1A5) reveals an essential role for transporters SNAT1 (SLC38A1) and SNAT2 (SLC38A2) to sustain glutaminolysis in cancer cells. J Biol Chem 2016;291:13194–205.
98. Adijanto J, Philp NJ. The SLC16A family of monocarboxylate trans-porters (MCTs)–physiology and function in cellular metabolism, pH homeostasis, and fluid transport. Curr Top Membr 2012;70: 275–311.
99. Morrissey JJ, Mellnick VM, Luo J, Siegel MJ, Figenshau RS, Bhayani S, et al. Evaluation of urine aquaporin-1 and perilipin-2 concentra-tions as biomarkers to screen for renal cell carcinoma: a prospective cohort study. JAMA Oncol 2015;1:204–12.
100. Traini M, Quinn CM, Sandoval C, Johansson E, Schroder K, Kockx M, et al. Sphingomyelin phosphodiesterase acid-like 3A (SMPDL3A) is a novel nucleotide phosphodiesterase regulated by cholesterol in human macrophages. J Biol Chem 2014;289:32895–913.
101. Tanaka K, Shouguchi-Miyata J, Miyamoto N, Ikeda JE. Novel nuclear shuttle proteins, HDBP1 and HDBP2, bind to neuronal cell-specific cis-regulatory element in the promoter for the human Huntington’s disease gene. J Biol Chem 2004;279:7275–86.
102. Sichtig N, Korfer N, Steger G. Papillomavirus binding factor binds to SAP30 and represses transcription via recruitment of the HDAC1 co-repressor complex. Arch Biochem Biophys 2007;467:67–75.
103. Hasegawa R, Tomaru Y, de Hoon M, Suzuki H, Hayashizaki Y, Shin JW. Identification of ZNF395 as a novel modulator of adipogenesis. Exp Cell Res 2013;319:68–76.
104. Jordanovski D, Herwartz C, Pawlowski A, Taute S, Frommolt P, Steger G. The hypoxia-inducible transcription factor ZNF395 is controlled by IkB kinase-signaling and activates genes involved in the innate immune response and cancer. PLoS One 2013;8:e74911.
105. Herwartz C, Castillo-Juarez P, Schroder L, Barron BL, Steger G. The transcription factor ZNF395 is required for the maximal hypoxic induction of proinflammatory cytokines in U87-MG cells. Media-tors Inflamm 2015;2015:804264.
106. Vaupel P, Thews O, Kelleher DK, Hoeckel M. Current status of knowledge and critical issues in tumor oxygenation. Results from 25 years research in tumor pathophysiology. Adv Exp Med Biol 1998;454:591–602.
107. Tsukahara T, Kawaguchi S, Torigoe T, Takahashi A, Murase M, Kano M, et al. HLA-A*0201-restricted CTL epitope of a novel osteosarcoma antigen, papillomavirus binding factor. J Transl Med 2009;7:44.
108. Tsukahara T, Nabeta Y, Kawaguchi S, Ikeda H, Sato Y, Shimozawa K, et al. Identification of human autologous cytotoxic T-lymphocyte-defined osteosarcoma gene that encodes a transcriptional regulator, papillomavirus binding factor. Cancer Res 2004;64:5442–8.
109. Tsukahara T, Emori M, Murata K, Hirano T, Muroi N, Kyono M, et al. Specific targeting of a naturally presented osteosarcoma antigen, papillomavirus binding factor peptide, using an artificial monoclonal antibody. J Biol Chem 2014;289:22035–47.
110. Chen W, Hill H, Christie A, Kim MS, Holloman E, Pavia-Jimenez A, et al. Targeting renal cell carcinoma with a HIF-2 antagonist. Nature 2016;539:112–7.
111. Cho H, Du X, Rizzi JP, Liberzon E, Chakraborty AA, Gao W, et al. On-target efficacy of a HIF-2alpha antagonist in preclinical kidney cancer models. Nature 2016;539:107–11.
15-CD-17-0375_p1284-1305.indd 1304 10/23/17 2:18 PM
Research. on May 13, 2020. © 2017 American Association for Cancercancerdiscovery.aacrjournals.org Downloaded from
Published OnlineFirst September 11, 2017; DOI: 10.1158/2159-8290.CD-17-0375
VHL-Driven Enhancer Malfunction in ccRCC RESEARCH ARTICLE
November 2017 CANCER DISCOVERY | 1305
112. Bernal F, Wade M, Godes M, Davis TN, Whitehead DG, Kung AL, et al. A stapled p53 helix overcomes HDMX-mediated suppression of p53. Cancer Cell 2010;18:411–22.
113. Ng JH, Kumar V, Muratani M, Kraus P, Yeo JC, Yaw LP, et al. In vivo epigenomic profiling of germ cells reveals germ cell molecular signatures. Dev Cell 2013;24:324–33.
114. Li H. Aligning sequence reads, clone sequences and assembly contigs with BWA-MEM. q-bioGN 2013.
115. Xu H, Handoko L, Wei X, Ye C, Sheng J, Wei CL, et al. A signal-noise model for significance analysis of ChIP-seq with negative control. Bioinformatics 2010;26:1199–204.
116. Diaz A, Nellore A, Song JS. CHANCE: comprehensive software for qual-ity control and validation of ChIP-seq data. Genome Biol 2012;13:R98.
117. Magoc T, Salzberg SL. FLASH: fast length adjustment of short reads to improve genome assemblies. Bioinformatics 2011;27:2957–63.
118. Hughes JR, Roberts N, McGowan S, Hay D, Giannoulatou E, Lynch M, et al. Analysis of hundreds of cis-regulatory landscapes at high resolution in a single, high-throughput experiment. Nat Genet 2014;46:205–12.
119. Thongjuea S, Stadhouders R, Grosveld FG, Soler E, Lenhard B. r3Cseq: an R/bioconductor package for the discovery of long-range genomic interactions from chromosome conformation capture and next-generation sequencing data. Nucleic Acids Res 2013;41:e132.
120. Lienhard M, Grimm C, Morkel M, Herwig R, Chavez L. MEDIPS: genome-wide differential coverage analysis of sequencing data derived from DNA enrichment experiments. Bioinformatics 2014; 30:284–6.
121. Shen L, Shao N, Liu X, Nestler E. ngs.plot: Quick mining and visual-ization of next-generation sequencing data by integrating genomic databases. BMC Genomics 2014;15:284.
15-CD-17-0375_p1284-1305.indd 1305 10/23/17 2:18 PM
Research. on May 13, 2020. © 2017 American Association for Cancercancerdiscovery.aacrjournals.org Downloaded from
Published OnlineFirst September 11, 2017; DOI: 10.1158/2159-8290.CD-17-0375
2017;7:1284-1305. Published OnlineFirst September 11, 2017.Cancer Discov Xiaosai Yao, Jing Tan, Kevin Junliang Lim, et al. Clear Cell Renal Cell Carcinoma
Deficiency Drives Enhancer Activation of Oncogenes inVHL
Updated version
10.1158/2159-8290.CD-17-0375doi:
Access the most recent version of this article at:
Material
Supplementary
http://cancerdiscovery.aacrjournals.org/content/suppl/2017/09/09/2159-8290.CD-17-0375.DC1
Access the most recent supplemental material at:
Cited articles
http://cancerdiscovery.aacrjournals.org/content/7/11/1284.full#ref-list-1
This article cites 118 articles, 38 of which you can access for free at:
Citing articles
http://cancerdiscovery.aacrjournals.org/content/7/11/1284.full#related-urls
This article has been cited by 9 HighWire-hosted articles. Access the articles at:
E-mail alerts related to this article or journal.Sign up to receive free email-alerts
SubscriptionsReprints and
To order reprints of this article or to subscribe to the journal, contact the AACR Publications
Permissions
Rightslink site. Click on "Request Permissions" which will take you to the Copyright Clearance Center's (CCC)
.http://cancerdiscovery.aacrjournals.org/content/7/11/1284To request permission to re-use all or part of this article, use this link
Research. on May 13, 2020. © 2017 American Association for Cancercancerdiscovery.aacrjournals.org Downloaded from
Published OnlineFirst September 11, 2017; DOI: 10.1158/2159-8290.CD-17-0375