Embed Size (px)
Citation preview
Veterans in Rural America: 2011–2015American Community Survey Reports
By Kelly Ann HolderJanuary 2017ACS-36
INTRODUCTION
Twenty million veterans live in the United States. They live in every state and in nearly every county across the nation. About 5 million veterans lived in areas desig-nated as rural by the U.S. Census Bureau during the 2011–2015 period. Understanding who rural veterans are and what sets them apart from other veterans, as well as from their rural neighbors, provides the neces-sary perspective for rural communities, government agencies, veterans’ advocates, and other policymakers interested in directing programs and services to this population.
In general, individuals living in rural areas differ from their urban counterparts in terms of demographic characteristics, social ties, culture, and access to infrastructure and institutional support. Much depends on the geography itself. In some parts of the country, rural residents may face substantial physical barriers to accessing services and amenities, including longer travel times, lack of transportation options, and limited availability of services.
Veterans, regardless of geography, differ from their nonveteran counterparts in a variety of aspects. Military history and enlistment policy changes have influenced the demographic composition of the veteran and nonveteran populations over time.
The U.S. Department of Veterans Affairs (VA) has identi-fied veterans living in rural areas as a population of interest. To help address concerns of veterans’ access to care, Congress established the Office of Rural Health
within the VA in 2007. One challenge in these efforts is that most of the data available to the VA come only from rural veterans enrolled in their healthcare system, and not all veterans are enrolled. However, to antici-pate demand for care, as well as to understand what types of services may be requested or utilized, requires data on all rural veterans.
This brief aims to answer the question “Who are rural veterans?” by considering the demographic, social, and economic characteristics of rural veterans compared with both urban veterans as well as with rural nonvet-erans. It also examines rural veterans by the level of rurality of their county of residence to understand some of the impact of geography on their characteristics. The data used in this report are primarily from 2011–2015 American Community Survey (ACS), 5-year estimates. This report presents statistics about veterans and, where applicable, nonveterans 18 years and older living in rural and urban areas of the United States.
RURAL VETERANS BY REGION AND STATE
In the 2011–2015 period, 24.1 percent of the veteran population 18 years and older lived in areas designated as rural. Just under half of all rural veterans lived in the South (45.9 percent) and another 13.7 percent lived in the Northeast (see Table 1). While the Midwest and West may appear to have a larger share of wide-open rural spaces from the view outside an airplane window, the majority of the nation’s rural population, in general, actually lives east of the Mississippi River.
2 U.S. Census Bureau
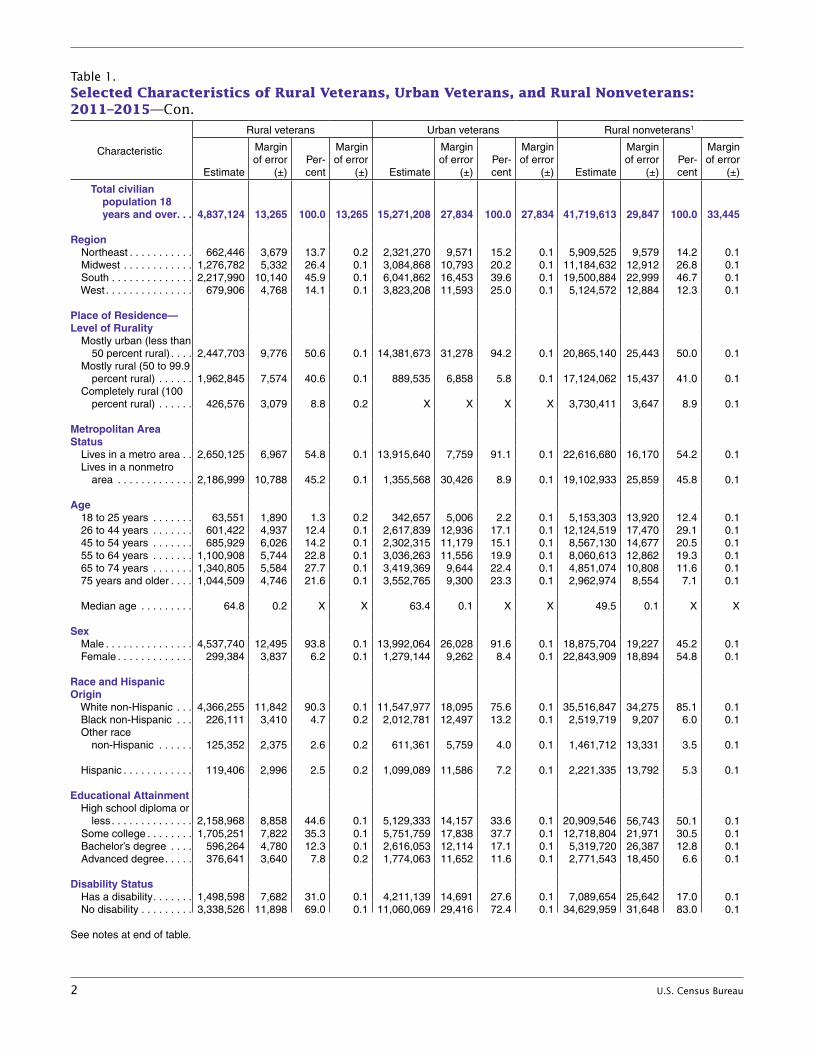
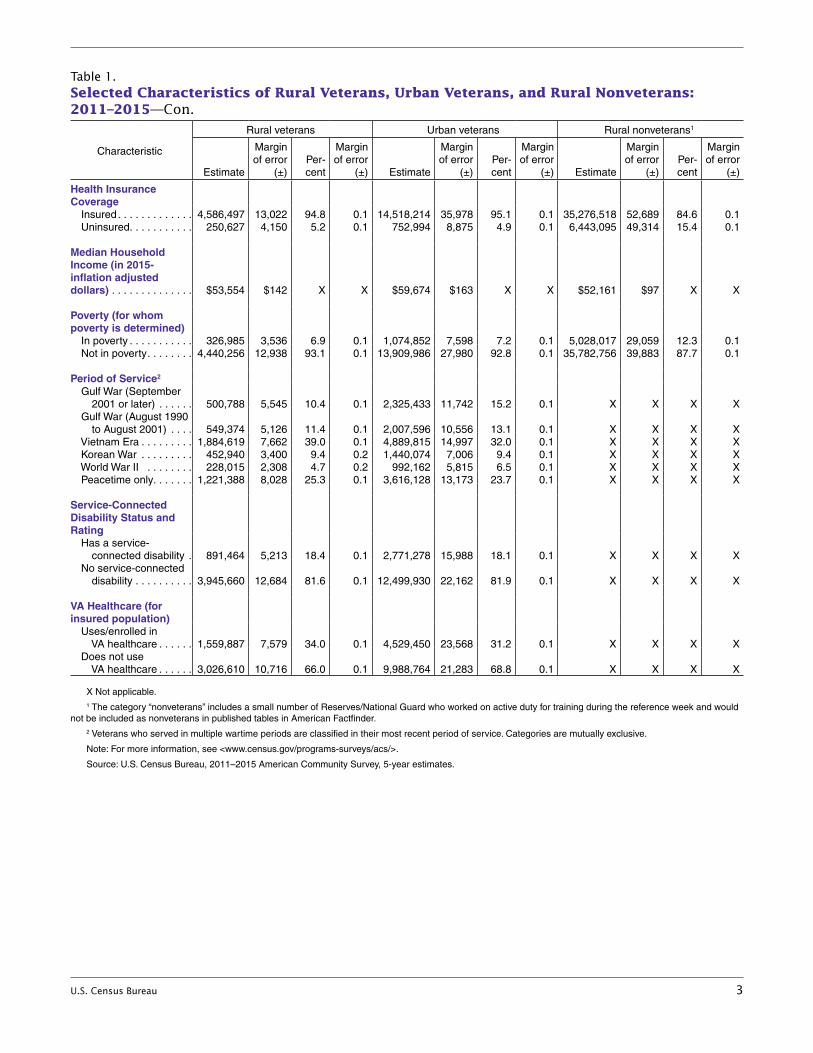
Table 1. Selected Characteristics of Rural Veterans, Urban Veterans, and Rural Nonveterans: 2011–2015—Con.
Characteristic
Rural veterans Urban veterans Rural nonveterans1
Estimate
Margin of error
(±)Per-cent
Margin of error
(±) Estimate
Margin of error
(±)Per-cent
Margin of error
(±) Estimate
Margin of error
(±)Per-cent
Margin of error
(±)
Total civilian population 18 years and over. . .
Region
4,837,124 13,265 100.0 13,265 15,271,208 27,834 100.0 27,834 41,719,613 29,847 100.0 33,445
Northeast . . . . . . . . . . . 662,446 3,679 13 .7 0 .2 2,321,270 9,571 15 .2 0 .1 5,909,525 9,579 14 .2 0 .1 Midwest . . . . . . . . . . . . 1,276,782 5,332 26 .4 0 .1 3,084,868 10,793 20 .2 0 .1 11,184,632 12,912 26 .8 0 .1 South . . . . . . . . . . . . . . 2,217,990 10,140 45 .9 0 .1 6,041,862 16,453 39 .6 0 .1 19,500,884 22,999 46 .7 0 .1 West . . . . . . . . . . . . . . .
Place of Residence—Level of Rurality Mostly urban (less than
679,906 4,768 14 .1 0 .1 3,823,208 11,593 25 .0 0 .1 5,124,572 12,884 12 .3 0 .1
50 percent rural) . . . . Mostly rural (50 to 99 .9
2,447,703 9,776 50 .6 0 .1 14,381,673 31,278 94 .2 0 .1 20,865,140 25,443 50 .0 0 .1
percent rural) . . . . . . Completely rural (100
1,962,845 7,574 40 .6 0 .1 889,535 6,858 5 .8 0 .1 17,124,062 15,437 41 .0 0 .1
percent rural) . . . . . .
Metropolitan Area Status
426,576 3,079 8 .8 0 .2 X X X X 3,730,411 3,647 8 .9 0 .1
Lives in a metro area . . Lives in a nonmetro
2,650,125 6,967 54 .8 0 .1 13,915,640 7,759 91 .1 0 .1 22,616,680 16,170 54 .2 0 .1
area . . . . . . . . . . . . .
Age
2,186,999 10,788 45 .2 0 .1 1,355,568 30,426 8 .9 0 .1 19,102,933 25,859 45 .8 0 .1
18 to 25 years . . . . . . . 63,551 1,890 1 .3 0 .2 342,657 5,006 2 .2 0 .1 5,153,303 13,920 12 .4 0 .1 26 to 44 years . . . . . . . 601,422 4,937 12 .4 0 .1 2,617,839 12,936 17 .1 0 .1 12,124,519 17,470 29 .1 0 .1 45 to 54 years . . . . . . . 685,929 6,026 14 .2 0 .1 2,302,315 11,179 15 .1 0 .1 8,567,130 14,677 20 .5 0 .1 55 to 64 years . . . . . . . 1,100,908 5,744 22 .8 0 .1 3,036,263 11,556 19 .9 0 .1 8,060,613 12,862 19 .3 0 .1 65 to 74 years . . . . . . . 1,340,805 5,584 27 .7 0 .1 3,419,369 9,644 22 .4 0 .1 4,851,074 10,808 11 .6 0 .1 75 years and older . . . . 1,044,509 4,746 21 .6 0 .1 3,552,765 9,300 23 .3 0 .1 2,962,974 8,554 7 .1 0 .1
Median age . . . . . . . . .
Sex
64 .8 0 .2 X X 63 .4 0 .1 X X 49 .5 0 .1 X X
Male . . . . . . . . . . . . . . . 4,537,740 12,495 93 .8 0 .1 13,992,064 26,028 91 .6 0 .1 18,875,704 19,227 45 .2 0 .1 Female . . . . . . . . . . . . .
Race and Hispanic Origin
299,384 3,837 6 .2 0 .1 1,279,144 9,262 8 .4 0 .1 22,843,909 18,894 54 .8 0 .1
White non-Hispanic . . . 4,366,255 11,842 90 .3 0 .1 11,547,977 18,095 75 .6 0 .1 35,516,847 34,275 85 .1 0 .1 Black non-Hispanic . . . Other race
226,111 3,410 4 .7 0 .2 2,012,781 12,497 13 .2 0 .1 2,519,719 9,207 6 .0 0 .1
non-Hispanic . . . . . . 125,352 2,375 2 .6 0 .2 611,361 5,759 4 .0 0 .1 1,461,712 13,331 3 .5 0 .1
Hispanic . . . . . . . . . . . .
Educational Attainment High school diploma or
119,406 2,996 2 .5 0 .2 1,099,089 11,586 7 .2 0 .1 2,221,335 13,792 5 .3 0 .1
less . . . . . . . . . . . . . . 2,158,968 8,858 44 .6 0 .1 5,129,333 14,157 33 .6 0 .1 20,909,546 56,743 50 .1 0 .1 Some college . . . . . . . . 1,705,251 7,822 35 .3 0 .1 5,751,759 17,838 37 .7 0 .1 12,718,804 21,971 30 .5 0 .1 Bachelor’s degree . . . . 596,264 4,780 12 .3 0 .1 2,616,053 12,114 17 .1 0 .1 5,319,720 26,387 12 .8 0 .1 Advanced degree . . . . .
Disability Status
376,641 3,640 7 .8 0 .2 1,774,063 11,652 11 .6 0 .1 2,771,543 18,450 6 .6 0 .1
Has a disability . . . . . . . 1,498,598 7,682 31 .0 0 .1 4,211,139 14,691 27 .6 0 .1 7,089,654 25,642 17 .0 0 .1 No disability . . . . . . . . .
See notes at end of table .
3,338,526 11,898 69 .0 0 .1 11,060,069 29,416 72 .4 0 .1 34,629,959 31,648 83 .0 0 .1
U.S. Census Bureau 3
Table 1. Selected Characteristics of Rural Veterans, Urban Veterans, and Rural Nonveterans: 2011–2015—Con.
Characteristic
Rural veterans Urban veterans Rural nonveterans1
Estimate
Margin of error
(±)Per-cent
Margin of error
(±) Estimate
Margin of error
(±)Per-cent
Margin of error
(±) Estimate
Margin of error
(±)Per-cent
Margin of error
(±)
Health Insurance Coverage Insured . . . . . . . . . . . . . Uninsured . . . . . . . . . . .
Median Household Income (in 2015- inflation adjusted dollars) . . . . . . . . . . . . . .
Poverty (for whom poverty is determined) In poverty . . . . . . . . . . . Not in poverty . . . . . . . .
Period of Service2
Gulf War (September 2001 or later) . . . . . . Gulf War (August 1990 to August 2001) . . . . Vietnam Era . . . . . . . . . Korean War . . . . . . . . . World War II . . . . . . . . Peacetime only . . . . . . .
Service-Connected Disability Status and Rating Has a service- connected disability . No service-connected disability . . . . . . . . . .
VA Healthcare (for insured population) Uses/enrolled in VA healthcare . . . . . . Does not use VA healthcare . . . . . .
4,586,497250,627
$53,554
326,9854,440,256
500,788
549,3741,884,619
452,940228,015
1,221,388
891,464
3,945,660
1,559,887
3,026,610
13,0224,150
$142
3,53612,938
5,545
5,1267,6623,4002,3088,028
5,213
12,684
7,579
10,716
94 .85 .2
X
6 .993 .1
10 .4
11 .439 .09 .44 .7
25 .3
18 .4
81 .6
34 .0
66 .0
0 .10 .1
X
0 .10 .1
0 .1
0 .10 .10 .20 .20 .1
0 .1
0 .1
0 .1
0 .1
14,518,214752,994
$59,674
1,074,85213,909,986
2,325,433
2,007,5964,889,8151,440,074
992,1623,616,128
2,771,278
12,499,930
4,529,450
9,988,764
35,9788,875
$163
7,59827,980
11,742
10,55614,9977,0065,815
13,173
15,988
22,162
23,568
21,283
95 .14 .9
X
7 .292 .8
15 .2
13 .132 .09 .46 .5
23 .7
18 .1
81 .9
31 .2
68 .8
0 .10 .1
X
0 .10 .1
0 .1
0 .10 .10 .10 .10 .1
0 .1
0 .1
0 .1
0 .1
35,276,5186,443,095
$52,161
5,028,01735,782,756
X
XXXXX
X
X
X
X
52,68949,314
$97
29,05939,883
X
XXXXX
X
X
X
X
84 .615 .4
X
12 .387 .7
X
XXXXX
X
X
X
X
0 .10 .1
X
0 .10 .1
X
XXXXX
X
X
X
X
X Not applicable .1 The category “nonveterans” includes a small number of Reserves/National Guard who worked on active duty for training during the reference week and would
not be included as nonveterans in published tables in American Factfinder .2 Veterans who served in multiple wartime periods are classified in their most recent period of service . Categories are mutually exclusive .
Note: For more information, see <www .census .gov/programs-surveys/acs/> .
Source: U .S . Census Bureau, 2011–2015 American Community Survey, 5-year estimates .
4 U.S. Census Bureau
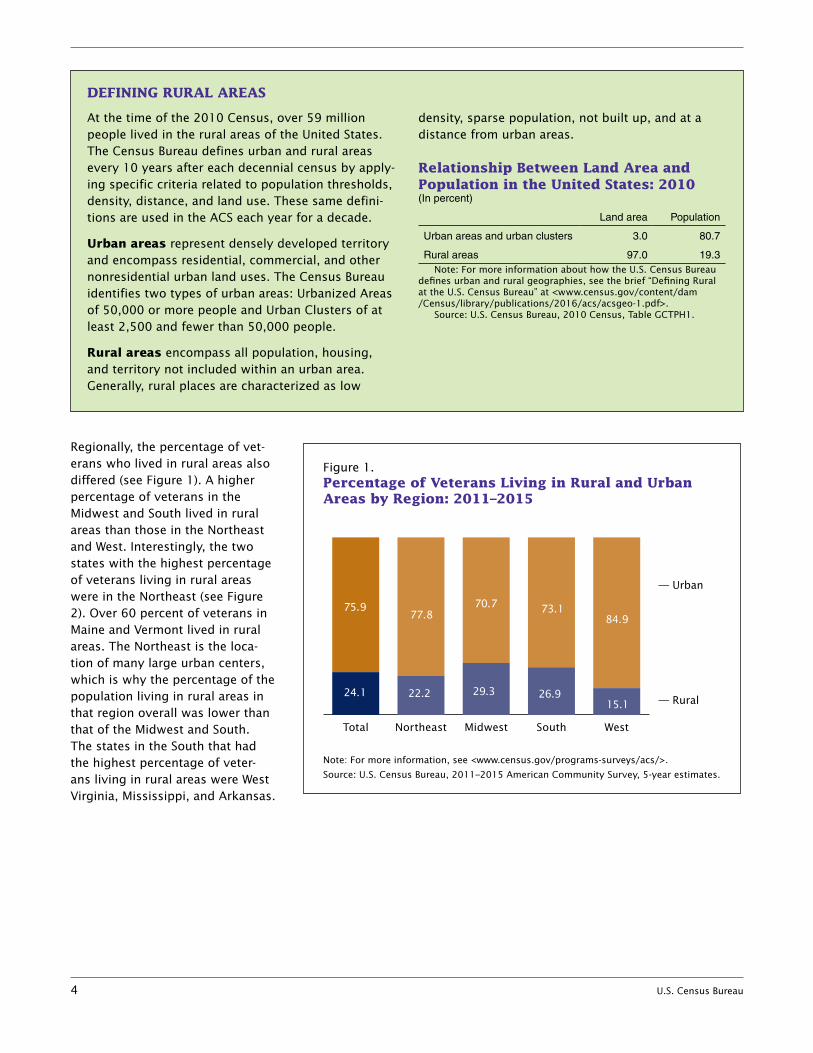
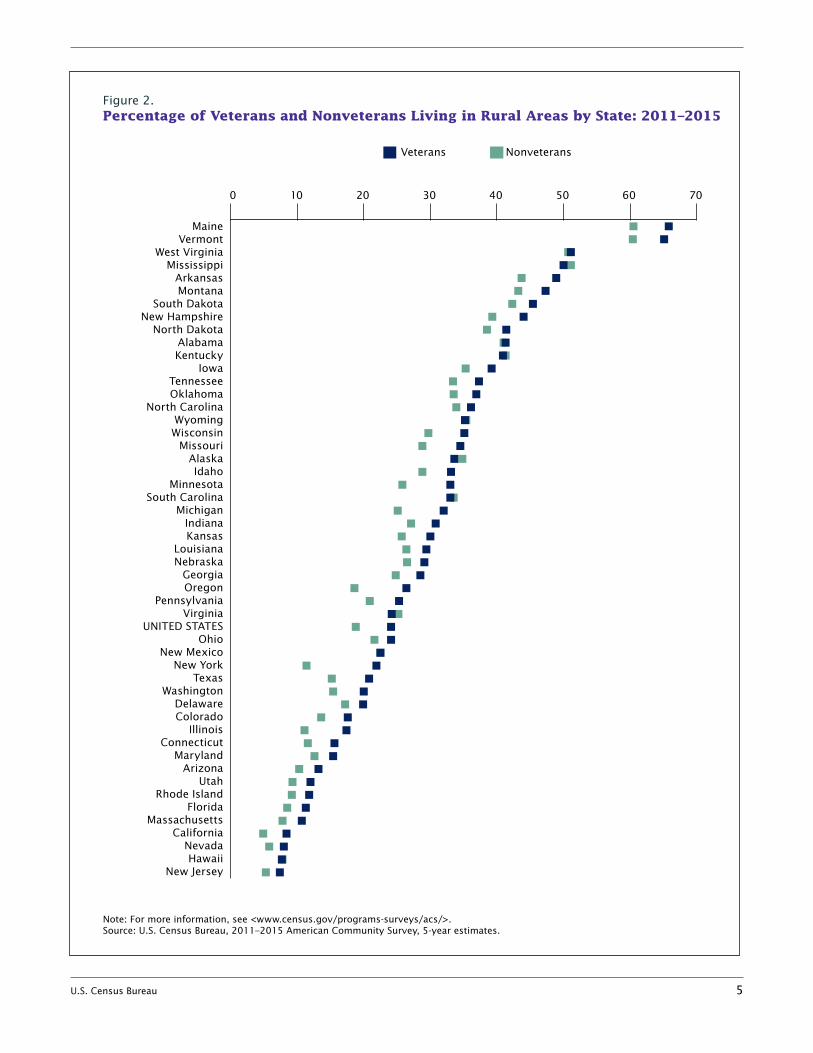
Regionally, the percentage of vet-erans who lived in rural areas also differed (see Figure 1). A higher percentage of veterans in the Midwest and South lived in rural areas than those in the Northeast and West. Interestingly, the two states with the highest percentage of veterans living in rural areas were in the Northeast (see Figure 2). Over 60 percent of veterans in Maine and Vermont lived in rural areas. The Northeast is the loca-tion of many large urban centers, which is why the percentage of the population living in rural areas in that region overall was lower than that of the Midwest and South. The states in the South that had the highest percentage of veter-ans living in rural areas were West Virginia, Mississippi, and Arkansas.
DEFINING RURAL AREAS
At the time of the 2010 Census, over 59 million density, sparse population, not built up, and at a people lived in the rural areas of the United States. distance from urban areas.The Census Bureau defines urban and rural areas every 10 years after each decennial census by apply- Relationship Between Land Area and ing specific criteria related to population thresholds, Population in the United States: 2010 density, distance, and land use. These same defini- (In percent)
tions are used in the ACS each year for a decade. Land area Population
Urban areas and urban clusters 3 .0 80 .7Urban areas represent densely developed territory
Rural areas 97 .0 19 .3and encompass residential, commercial, and other Note: For more information about how the U.S. Census Bureau
nonresidential urban land uses. The Census Bureau defines urban and rural geographies, see the brief “Defining Rural identifies two types of urban areas: Urbanized Areas at the U.S. Census Bureau” at <www.census.gov/content/dam
/Census/library/publications/2016/acs/acsgeo-1.pdf>.of 50,000 or more people and Urban Clusters of at Source: U.S. Census Bureau, 2010 Census, Table GCTPH1.least 2,500 and fewer than 50,000 people.
Rural areas encompass all population, housing, and territory not included within an urban area. Generally, rural places are characterized as low
Figure 1. Percentage of Veterans Living in Rural and Urban Areas by Region: 2011–2015
Note: For more information, see <www.census.gov/programs-surveys/acs/>.
Source: U.S. Census Bureau, 2011–2015 American Community Survey, 5-year estimates.
WestSouthMidwestNortheastTotal
75.977.8
70.7 73.184.9
24.1 22.2 29.3 26.915.1
— Urban
— Rural
U.S. Census Bureau 5
Figure 2. Percentage of Veterans and Nonveterans Living in Rural Areas by State: 2011–2015
0 10 20 30 40 50 60 70
MaineVermont
West VirginiaMississippi
ArkansasMontana
South DakotaNew Hampshire
North DakotaAlabamaKentucky
IowaTennesseeOklahoma
North CarolinaWyomingWisconsin
MissouriAlaskaIdaho
MinnesotaSouth Carolina
MichiganIndianaKansas
LouisianaNebraska
GeorgiaOregon
PennsylvaniaVirginia
UNITED STATESOhio
New MexicoNew York
TexasWashington
DelawareColorado
IllinoisConnecticut
MarylandArizona
UtahRhode Island
FloridaMassachusetts
CaliforniaNevadaHawaii
New Jersey
Note: For more information, see <www.census.gov/programs-surveys/acs/>.Source: U.S. Census Bureau, 2011–2015 American Community Survey, 5-year estimates.
Nonveterans Veterans
6 U.S. Census Bureau
RURAL AND URBAN VETERANS
Understanding who rural veterans are requires a point of reference. This section explores how rural veterans compare with other vet-erans, while the following section explores how they compare with other rural residents.
Age and sex
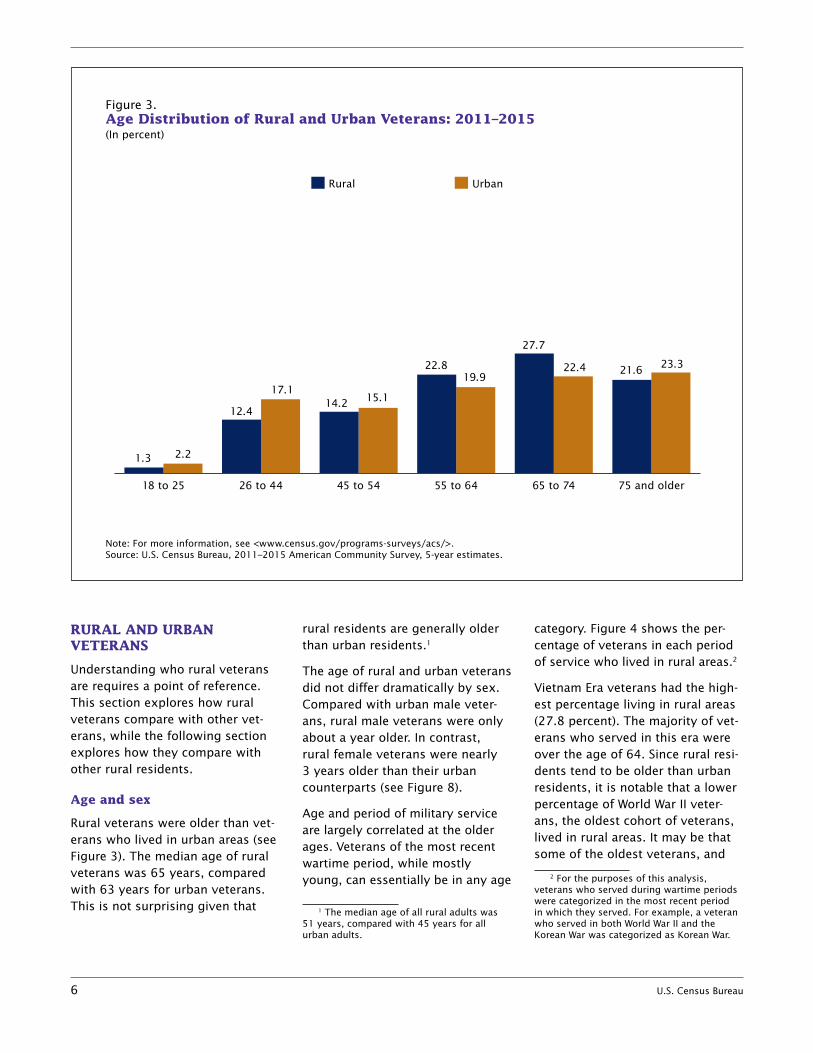
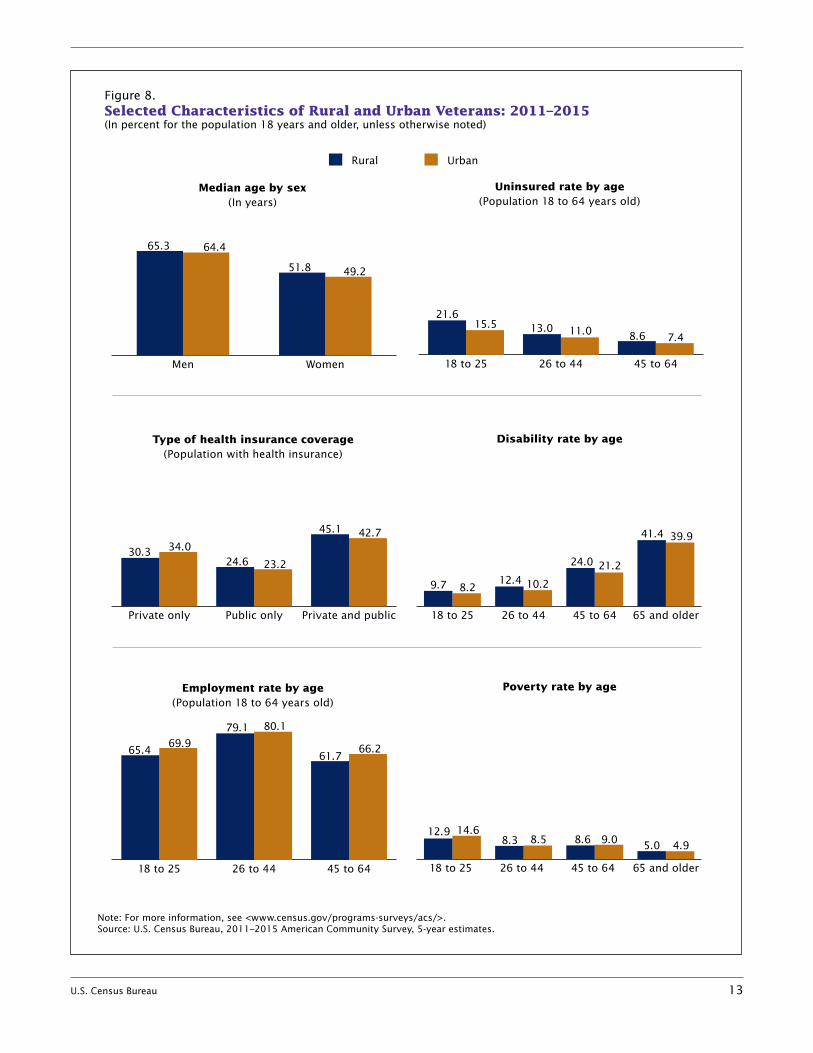
Rural veterans were older than vet-erans who lived in urban areas (see Figure 3). The median age of rural veterans was 65 years, compared with 63 years for urban veterans. This is not surprising given that
rural residents are generally older than urban residents.1
The age of rural and urban veterans did not differ dramatically by sex. Compared with urban male veter-ans, rural male veterans were only about a year older. In contrast, rural female veterans were nearly 3 years older than their urban counterparts (see Figure 8).
Age and period of military service are largely correlated at the older ages. Veterans of the most recent wartime period, while mostly young, can essentially be in any age
1 The median age of all rural adults was 51 years, compared with 45 years for all urban adults.
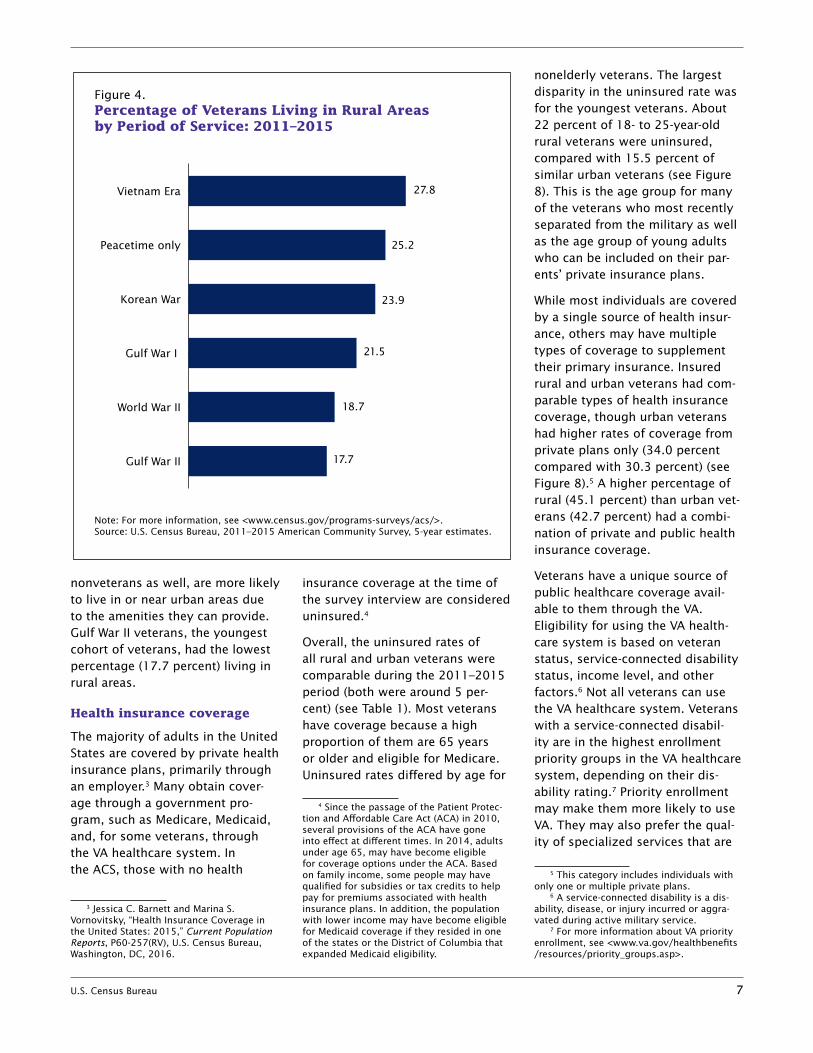
category. Figure 4 shows the per-centage of veterans in each period of service who lived in rural areas.2
Vietnam Era veterans had the high-est percentage living in rural areas (27.8 percent). The majority of vet-erans who served in this era were over the age of 64. Since rural resi-dents tend to be older than urban residents, it is notable that a lower percentage of World War II veter-ans, the oldest cohort of veterans, lived in rural areas. It may be that some of the oldest veterans, and
2 For the purposes of this analysis, veterans who served during wartime periods were categorized in the most recent period in which they served. For example, a veteran who served in both World War II and the Korean War was categorized as Korean War.
Figure 3. Age Distribution of Rural and Urban Veterans: 2011–2015 (In percent)
Rural Urban
75 and older65 to 7455 to 6445 to 5426 to 4418 to 25
Note: For more information, see <www.census.gov/programs-surveys/acs/>.Source: U.S. Census Bureau, 2011–2015 American Community Survey, 5-year estimates.
1.3 2.2
12.4
17.114.2 15.1
22.819.9
27.7
22.4 21.6 23.3
U.S. Census Bureau 7
nonveterans as well, are more likely to live in or near urban areas due to the amenities they can provide. Gulf War II veterans, the youngest cohort of veterans, had the lowest percentage (17.7 percent) living in rural areas.
Health insurance coverage
The majority of adults in the United States are covered by private health insurance plans, primarily through an employer.3 Many obtain cover-age through a government pro-gram, such as Medicare, Medicaid, and, for some veterans, through the VA healthcare system. In the ACS, those with no health
3 Jessica C. Barnett and Marina S. Vornovitsky, “Health Insurance Coverage in the United States: 2015,” Current Population Reports, P60-257(RV), U.S. Census Bureau, Washington, DC, 2016.
insurance coverage at the time of the survey interview are considered uninsured.4
Overall, the uninsured rates of all rural and urban veterans were comparable during the 2011–2015 period (both were around 5 per-cent) (see Table 1). Most veterans have coverage because a high proportion of them are 65 years or older and eligible for Medicare. Uninsured rates differed by age for
4 Since the passage of the Patient Protec-tion and Affordable Care Act (ACA) in 2010, several provisions of the ACA have gone into effect at different times. In 2014, adults under age 65, may have become eligible for coverage options under the ACA. Based on family income, some people may have qualified for subsidies or tax credits to help pay for premiums associated with health insurance plans. In addition, the population with lower income may have become eligible for Medicaid coverage if they resided in one of the states or the District of Columbia that expanded Medicaid eligibility.
nonelderly veterans. The largest disparity in the uninsured rate was for the youngest veterans. About 22 percent of 18- to 25-year-old rural veterans were uninsured, compared with 15.5 percent of similar urban veterans (see Figure 8). This is the age group for many of the veterans who most recently separated from the military as well as the age group of young adults who can be included on their par-ents’ private insurance plans.
While most individuals are covered by a single source of health insur-ance, others may have multiple types of coverage to supplement their primary insurance. Insured rural and urban veterans had com-parable types of health insurance coverage, though urban veterans had higher rates of coverage from private plans only (34.0 percent compared with 30.3 percent) (see Figure 8).5 A higher percentage of rural (45.1 percent) than urban vet-erans (42.7 percent) had a combi-nation of private and public health insurance coverage.
Veterans have a unique source of public healthcare coverage avail-able to them through the VA. Eligibility for using the VA health-care system is based on veteran status, service-connected disability status, income level, and other factors.6 Not all veterans can use the VA healthcare system. Veterans with a service-connected disabil-ity are in the highest enrollment priority groups in the VA healthcare system, depending on their dis-ability rating.7 Priority enrollment may make them more likely to use VA. They may also prefer the qual-ity of specialized services that are
5 This category includes individuals with only one or multiple private plans.
6 A service-connected disability is a dis-ability, disease, or injury incurred or aggra-vated during active military service.
7 For more information about VA priority enrollment, see <www.va.gov/healthbenefits /resources/priority_groups.asp>.
Figure 4. Percentage of Veterans Living in Rural Areas by Period of Service: 2011–2015
Note: For more information, see <www.census.gov/programs-surveys/acs/>.Source: U.S. Census Bureau, 2011–2015 American Community Survey, 5-year estimates.
Gulf War II
World War II
Gulf War I
Korean War
Peacetime only
Vietnam Era 27.8
25.2
23.9
21.5
18.7
17.7
8 U.S. Census Bureau
more difficult to obtain at non-VA facilities.
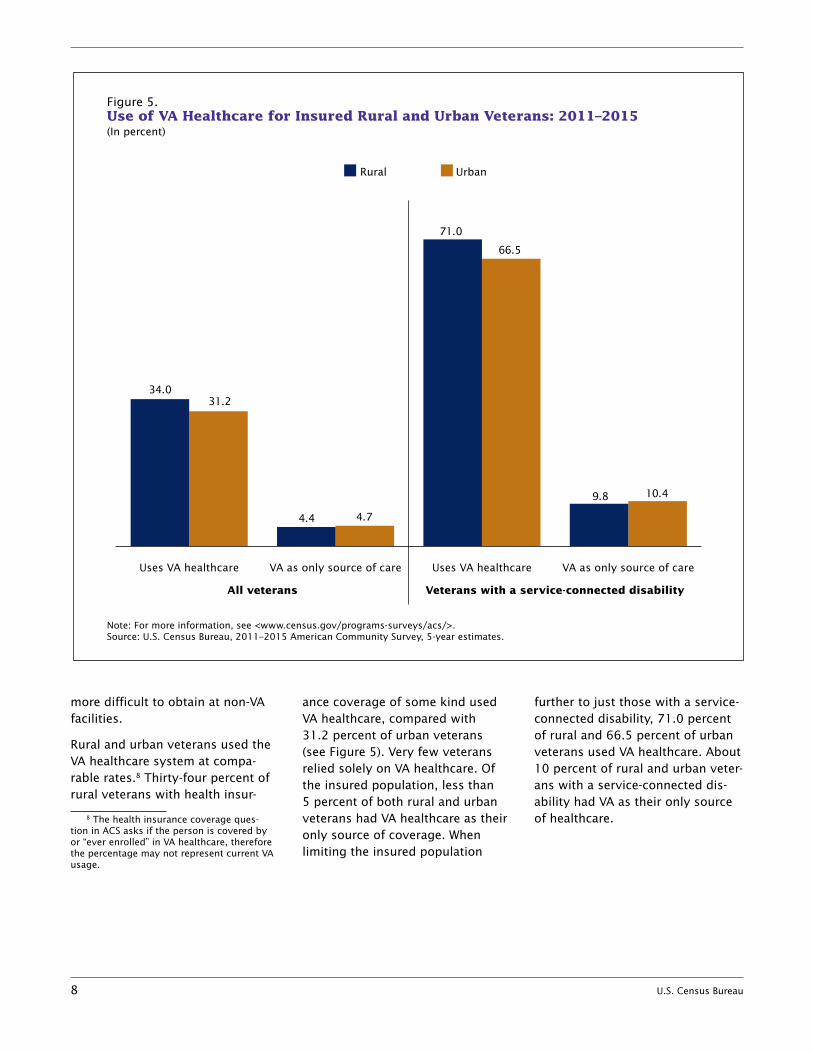
Rural and urban veterans used the VA healthcare system at compa-rable rates.8 Thirty-four percent of rural veterans with health insur-
8 The health insurance coverage ques-tion in ACS asks if the person is covered by or “ever enrolled” in VA healthcare, therefore the percentage may not represent current VA usage.
ance coverage of some kind used VA healthcare, compared with 31.2 percent of urban veterans (see Figure 5). Very few veterans relied solely on VA healthcare. Of the insured population, less than 5 percent of both rural and urban veterans had VA healthcare as their only source of coverage. When limiting the insured population
further to just those with a service-connected disability, 71.0 percent of rural and 66.5 percent of urban veterans used VA healthcare. About 10 percent of rural and urban veter-ans with a service-connected dis-ability had VA as their only source of healthcare.
Figure 5. Use of VA Healthcare for Insured Rural and Urban Veterans: 2011–2015 (In percent)
Rural Urban
VA as only source of careUses VA healthcareVA as only source of careUses VA healthcare
Note: For more information, see <www.census.gov/programs-surveys/acs/>.Source: U.S. Census Bureau, 2011–2015 American Community Survey, 5-year estimates.
All veterans Veterans with a service-connected disability
34.0
4.4
71.0
9.8
31.2
4.7
66.5
10.4
U.S. Census Bureau 9
Disability status
Disability status in ACS is deter-mined from a series of six ques-tions (see text box “Definitions and Concepts”). Individuals identified by the ACS as having a disability are those who report difficulty with one or more of these specific func-tions and may, in the absence of accommodation, have a disability. A higher percentage of rural (31.0 percent) than urban veterans (27.6 percent) reported some type of dis-ability (see Table 1). Disability rates for both groups increased with age, however, rural veterans of all ages had higher rates of disability than urban veterans (see Figure 8).
While age is an important factor in disability, period of service is an indicator unique to veterans that may also influence their health status and types of services they require. Wartime veterans, for instance, may have different health concerns and issues of access to care compared with other veterans. A higher percentage of rural than urban veterans served during the Vietnam Era (39.0 percent com-pared with 32.0 percent). We might expect veterans from Vietnam and earlier eras to have higher rates of disability due to their age. Living in rural or remote areas could impose additional barriers to care for these veterans.
DEFINITIONS AND CONCEPTS
Health insurance coverage in the ACS includes plans and pro-grams that provide comprehensive health coverage. Plans that provide insurance for specific conditions or situations, such as cancer and long-term care policies, are not considered coverage. Likewise, other types of insurance like dental, vision, life, and disability insur-ance are not considered health insurance coverage.
Disability is measured with a series of six questions. People identi-fied by the ACS as having a disability are those who report a hearing, vision, cognitive, ambulatory, self-care, or independent living diffi-culty and may, in the absence of accommodation, have a disability.
Employed individuals (1) did any work at all during the reference week as paid employees, worked in their own business or profession, worked on their own farm, or worked 15 hours or more as unpaid workers on a family farm or in a family business; or (2) did not work during the reference week but had jobs or businesses from which they were temporarily absent due to illness, bad weather, industrial dispute, vacation, or other personal reasons.
Income is the sum of the amounts reported separately for wage or salary income; net self-employment income; interest, dividends, or net rental or royalty income or income from estates and trusts; Social Security or Railroad Retirement income; Supplemental Security Income; public assistance or welfare payments; retirement, survivor, or disability pensions; and all other income.
Poverty status is determined by comparing total family income in the last 12 months with the poverty threshold appropriate for that family size and composition. If the total income of that family is less than the threshold appropriate for that family, every member of that family is considered “below the poverty level.” If a person is not living with anyone related by birth, marriage, or adoption, then the person’s own income is compared with the poverty threshold.
For more information about subjects in the ACS, see <www2.census .gov/programs-surveys/acs/tech_docs/subject_definitions/2015 _ACSSubjectDefinitions.pdf>.
10 U.S. Census Bureau
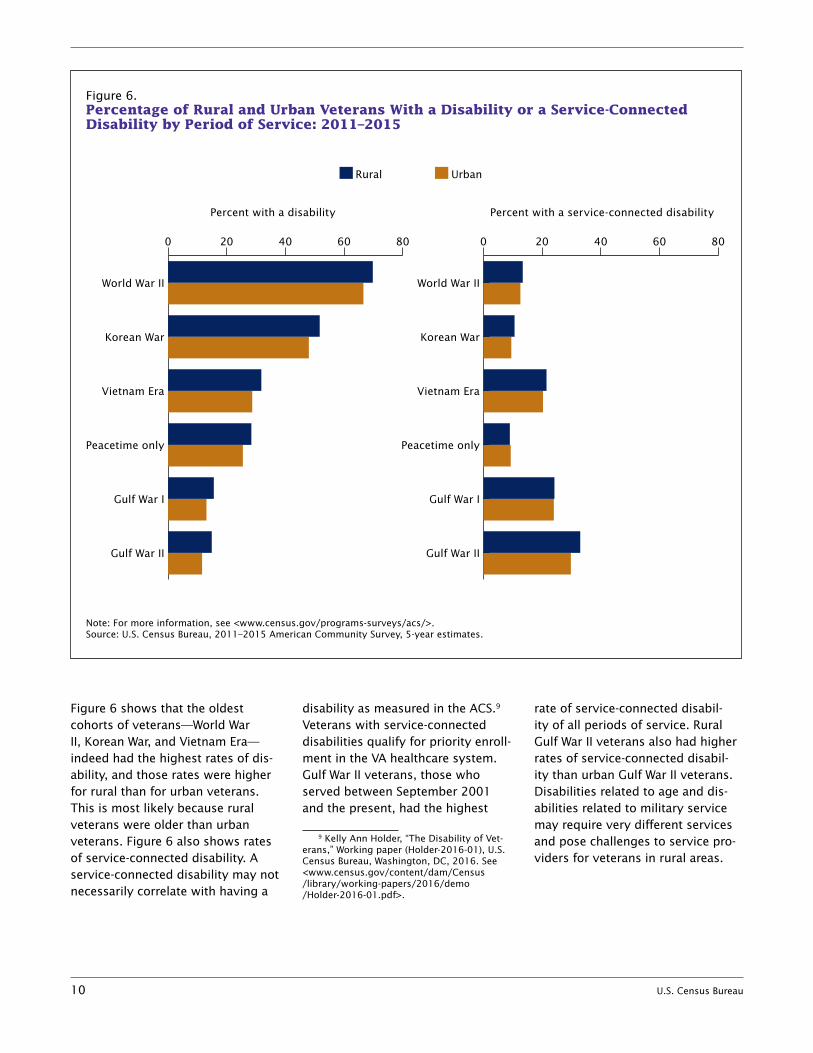
Figure 6 shows that the oldest cohorts of veterans—World War II, Korean War, and Vietnam Era—indeed had the highest rates of dis-ability, and those rates were higher for rural than for urban veterans. This is most likely because rural veterans were older than urban veterans. Figure 6 also shows rates of service-connected disability. A service-connected disability may not necessarily correlate with having a
disability as measured in the ACS.9 Veterans with service-connected disabilities qualify for priority enroll-ment in the VA healthcare system. Gulf War II veterans, those who served between September 2001 and the present, had the highest
9 Kelly Ann Holder, “The Disability of Vet-erans,” Working paper (Holder-2016-01), U.S. Census Bureau, Washington, DC, 2016. See <www.census.gov/content/dam/Census /library/working-papers/2016/demo /Holder-2016-01.pdf>.
rate of service-connected disabil-ity of all periods of service. Rural Gulf War II veterans also had higher rates of service-connected disabil-ity than urban Gulf War II veterans. Disabilities related to age and dis-abilities related to military service may require very different services and pose challenges to service pro-viders for veterans in rural areas.
Figure 6. Percentage of Rural and Urban Veterans With a Disability or a Service-ConnectedDisability by Period of Service: 2011–2015
Rural Urban
Note: For more information, see <www.census.gov/programs-surveys/acs/>.Source: U.S. Census Bureau, 2011–2015 American Community Survey, 5-year estimates.
0 20 40 60 80
Gulf War II
Gulf War I
Peacetime only
Vietnam Era
Korean War
World War II
0 20 40 60 80
Gulf War II
Gulf War I
Peacetime only
Vietnam Era
Korean War
World War II
Percent with a disability Percent with a service-connected disability
U.S. Census Bureau 11
Table 2. Employment Characteristics of Rural Veterans, Urban Veterans, and Rural Nonveterans 18 to 64 Years Old: 2011–2015
CharacteristicRural veterans Urban veterans Rural nonveterans1
PercentMargin of error (±) Percent
Margin of error (±) Percent
Margin of error (±)
Total civilian population 18 to 64 years old . . . . . . . . .
Employment Status
2,451,810 10,709 8,299,074 18,353 33,905,565 28,006
Employed . . . . . . . . . . . . . . . . . . . . . . . . . . . . . . . . . . . . . . . . . 66 .0 0 .2 70 .7 0 .1 67 .7 0 .1 Unemployed . . . . . . . . . . . . . . . . . . . . . . . . . . . . . . . . . . . . . . . 4 .9 0 .1 5 .6 0 .1 5 .4 0 .1 Not in labor force . . . . . . . . . . . . . . . . . . . . . . . . . . . . . . . . . . . 29 .1 0 .2 23 .6 0 .1 26 .9 0 .1
Total employed population 18 to 64 years old . . . . . . .
Work Status
1,619,014 9,312 5,869,034 19,125 22,940,695 39,200
Less than full time and year-round . . . . . . . . . . . . . . . . . . . . . . 18 .4 0 .2 18 .3 0 .1 28 .5 0 .1 Full time and . . . . . . . . . . . . . . . . . . . . . . . . . . . . . . . . . . . . . .
Class of Worker
81 .6 0 .2 81 .7 0 .1 71 .5 0 .1
Private worker . . . . . . . . . . . . . . . . . . . . . . . . . . . . . . . . . . . . . 69 .5 0 .3 68 .3 0 .1 79 .7 0 .1 Government worker . . . . . . . . . . . . . . . . . . . . . . . . . . . . . . . . . 23 .4 0 .2 27 .4 0 .1 15 .5 0 .1 Self-employed . . . . . . . . . . . . . . . . . . . . . . . . . . . . . . . . . . . . . 6 .9 0 .1 4 .3 0 .1 7 .6 0 .1 Unpaid family worker . . . . . . . . . . . . . . . . . . . . . . . . . . . . . . . .
Occupation
0 .2 0 .1 0 .1 0 .1 0 .2 0 .1
Management, professional, and related . . . . . . . . . . . . . . . . . . 30 .1 0 .2 38 .7 0 .2 32 .6 0 .1 Service . . . . . . . . . . . . . . . . . . . . . . . . . . . . . . . . . . . . . . . . . . . 13 .5 0 .2 15 .3 0 .1 16 .1 0 .1 Sales and office . . . . . . . . . . . . . . . . . . . . . . . . . . . . . . . . . . . . 14 .1 0 .2 17 .8 0 .2 22 .5 0 .1 Farming, fishing, and forestry . . . . . . . . . . . . . . . . . . . . . . . . . 1 .0 0 .1 0 .2 0 .1 1 .7 0 .1 Construction, extraction, maintenance, and repair . . . . . . . . . . 18 .8 0 .2 13 .4 0 .1 11 .6 0 .1 Production, transportation, and material moving . . . . . . . . . . .
Industry
22 .6 0 .2 16 .5 0 .1 15 .5 0 .1
Agriculture, forestry, fishing, hunting, mining . . . . . . . . . . . . . . 4 .3 0 .1 1 .2 0 .1 5 .2 0 .1 Construction . . . . . . . . . . . . . . . . . . . . . . . . . . . . . . . . . . . . . . . 10 .2 0 .2 6 .7 0 .1 8 .5 0 .1 Manufacturing . . . . . . . . . . . . . . . . . . . . . . . . . . . . . . . . . . . . . 18 .0 0 .2 13 .2 0 .1 13 .7 0 .1 Wholesale trade . . . . . . . . . . . . . . . . . . . . . . . . . . . . . . . . . . . . 2 .9 0 .1 2 .9 0 .1 2 .6 0 .1 Retail trade . . . . . . . . . . . . . . . . . . . . . . . . . . . . . . . . . . . . . . . . 7 .8 0 .1 8 .3 0 .1 11 .1 0 .1 Transportation, warehousing, utilities . . . . . . . . . . . . . . . . . . . . 11 .3 0 .2 10 .1 0 .1 5 .3 0 .1 Information . . . . . . . . . . . . . . . . . . . . . . . . . . . . . . . . . . . . . . . . 1 .6 0 .1 2 .4 0 .1 1 .4 0 .1 Finance and insurance, real estate, rental and leasing . . . . . . Professional, scientific, management, administrative, and
3 .1 0 .1 4 .7 0 .1 5 .0 0 .1
waste management services . . . . . . . . . . . . . . . . . . . . . . . . 8 .4 0 .1 11 .8 0 .1 7 .5 0 .1 Educational services, health care, social assistance . . . . . . . . Arts, entertainment, recreation, accommodation and
11 .9 0 .2 14 .2 0 .1 23 .3 0 .1
food services . . . . . . . . . . . . . . . . . . . . . . . . . . . . . . . . . . . . 3 .3 0 .1 4 .6 0 .1 6 .9 0 .1 Other services, except public administration . . . . . . . . . . . . . . 3 .8 0 .1 3 .3 0 .1 4 .7 0 .1 Public administration . . . . . . . . . . . . . . . . . . . . . . . . . . . . . . . . 13 .4 0 .2 16 .6 0 .1 4 .8 0 .1
1 The category “nonveterans” includes a small number of Reserves/National Guard who worked on active duty for training during the reference week and would not be included as nonveterans in published tables in American Factfinder .
Note: For more information, see <www .census .gov/programs-surveys/acs/> .
Source: U .S . Census Bureau, 2011–2015 American Community Survey, 5-year estimates .
12 U.S. Census Bureau
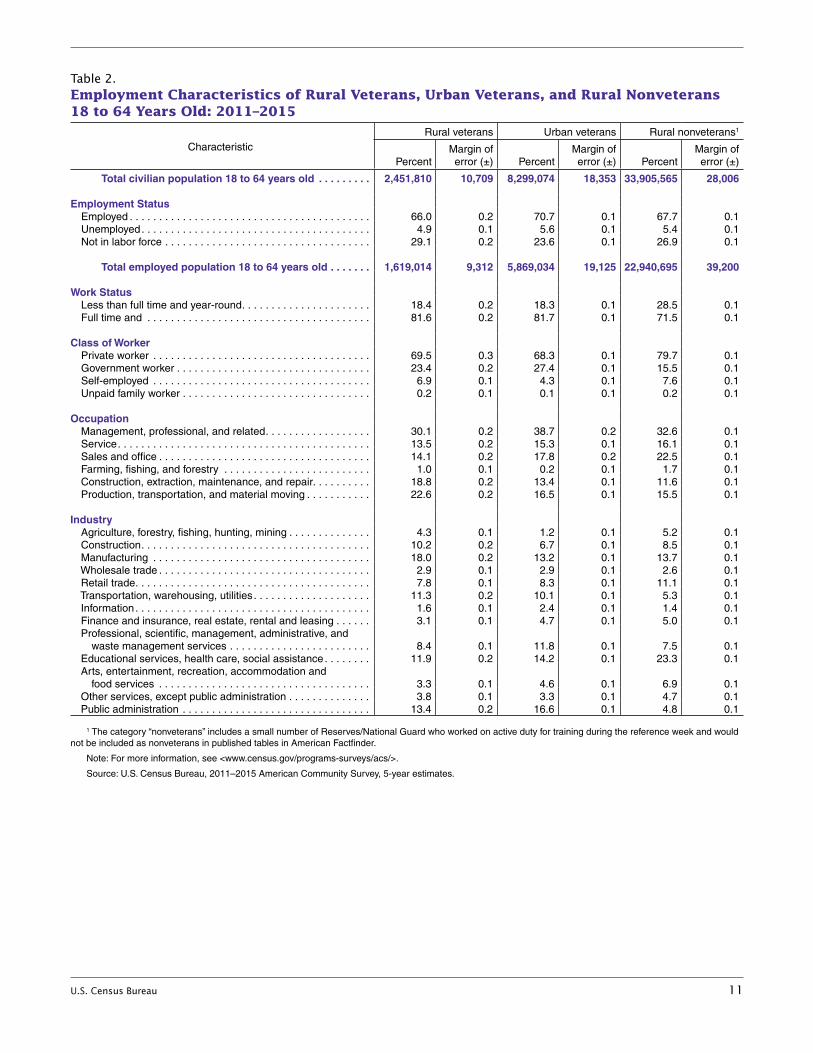
Employment and work status
Although the rural economy has diversified substantially over the past several decades, there are still differences in employment opportunities between rural and urban areas. Rural jobs are increas-ingly moving from agricultural and natural resource-oriented to more consumer services, such as retail trade, education, and healthcare. Urban jobs tend to specialize more in information and producer ser-vices, such as legal, financial, and other business services.10
A higher percentage of working-age urban veterans (70.7 percent) were employed during the 2011–2015 period, compared with rural veter-ans (66.0 percent) (see Table 2).11 A higher percentage of rural veterans were out of the labor force (29.1 percent) and a lower percentage were unemployed (4.9 percent), compared with urban veterans (23.6 percent and 5.6 percent, respectively). In terms of employ-ment rates, urban veterans saw an advantage at all ages (see Figure 8).
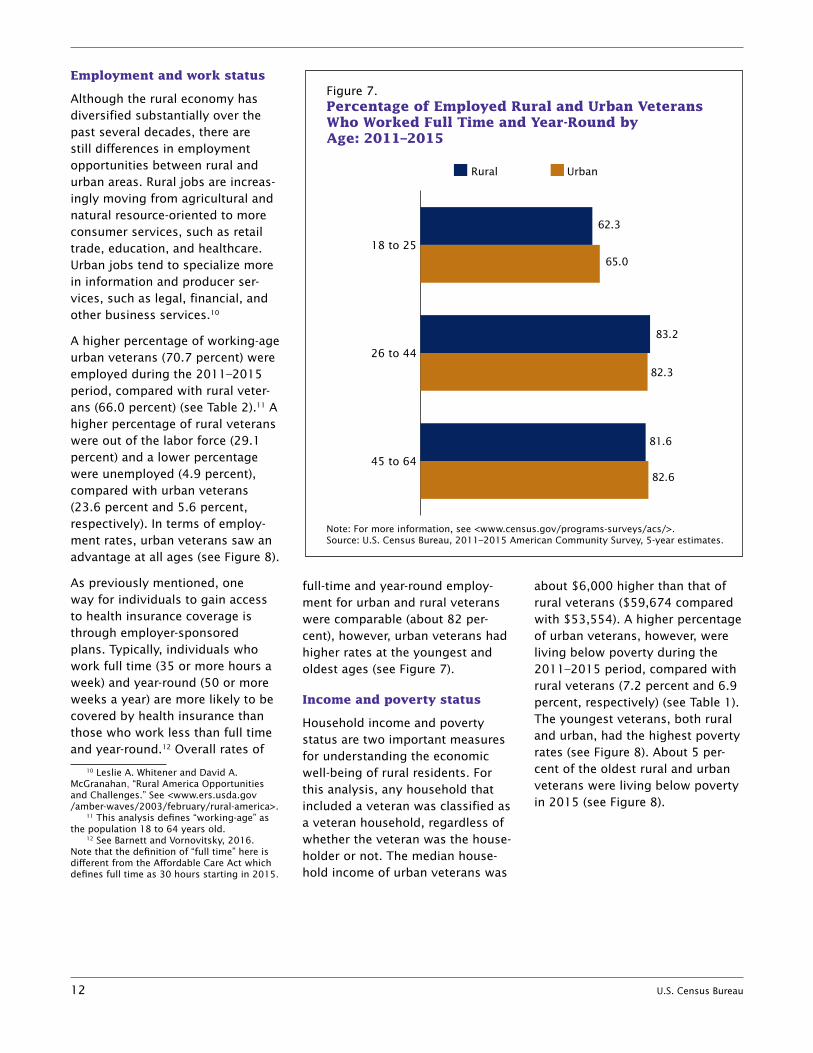
As previously mentioned, one way for individuals to gain access to health insurance coverage is through employer-sponsored plans. Typically, individuals who work full time (35 or more hours a week) and year-round (50 or more weeks a year) are more likely to be covered by health insurance than those who work less than full time and year-round.12 Overall rates of
10 Leslie A. Whitener and David A. McGranahan, “Rural America Opportunities and Challenges.” See <www.ers.usda.gov /amber-waves/2003/february/rural-america>.
11 This analysis defines “working-age” as the population 18 to 64 years old.
12 See Barnett and Vornovitsky, 2016. Note that the definition of “full time” here is different from the Affordable Care Act which defines full time as 30 hours starting in 2015.
full-time and year-round employ-ment for urban and rural veterans were comparable (about 82 per-cent), however, urban veterans had higher rates at the youngest and oldest ages (see Figure 7).
Income and poverty status
Household income and poverty status are two important measures for understanding the economic well-being of rural residents. For this analysis, any household that included a veteran was classified as a veteran household, regardless of whether the veteran was the house-holder or not. The median house-hold income of urban veterans was
about $6,000 higher than that of rural veterans ($59,674 compared with $53,554). A higher percentage of urban veterans, however, were living below poverty during the 2011–2015 period, compared with rural veterans (7.2 percent and 6.9 percent, respectively) (see Table 1). The youngest veterans, both rural and urban, had the highest poverty rates (see Figure 8). About 5 per-cent of the oldest rural and urban veterans were living below poverty in 2015 (see Figure 8).
Figure 7. Percentage of Employed Rural and Urban VeteransWho Worked Full Time and Year-Round by Age: 2011–2015
Note: For more information, see <www.census.gov/programs-surveys/acs/>.Source: U.S. Census Bureau, 2011–2015 American Community Survey, 5-year estimates.
45 to 64
26 to 44
18 to 25
62.3
65.0
83.2
82.3
81.6
82.6
Rural Urban
U.S. Census Bureau 13
Figure 8.Selected Characteristics of Rural and Urban Veterans: 2011–2015(In percent for the population 18 years and older, unless otherwise noted)
Note: For more information, see <www.census.gov/programs-surveys/acs/>.Source: U.S. Census Bureau, 2011–2015 American Community Survey, 5-year estimates.
WomenMen
Private and publicPublic onlyPrivate only
45 to 6426 to 4418 to 25
65.3
51.8
64.4
49.2
Median age by sex(In years)
Type of health insurance coverage(Population with health insurance)
Employment rate by age(Population 18 to 64 years old)
30.3 34.024.6 23.2
45.1 42.7
65.4
79.1
61.769.9
80.1
66.2
65 and older45 to 64 26 to 44 18 to 25
65 and older45 to 6426 to 4418 to 25
Poverty rate by age
Disability rate by age
Uninsured rate by age(Population 18 to 64 years old)
12.98.3 8.6 5.0
14.68.5 9.0 4.9
9.7 12.4
24.0
41.4
8.2 10.2
21.2
39.9
45 to 6426 to 4418 to 25
21.613.0
8.615.5
11.07.4
Rural Urban
14 U.S. Census Bureau
RURAL VETERANS AND RURAL NONVETERANS
Age and sex
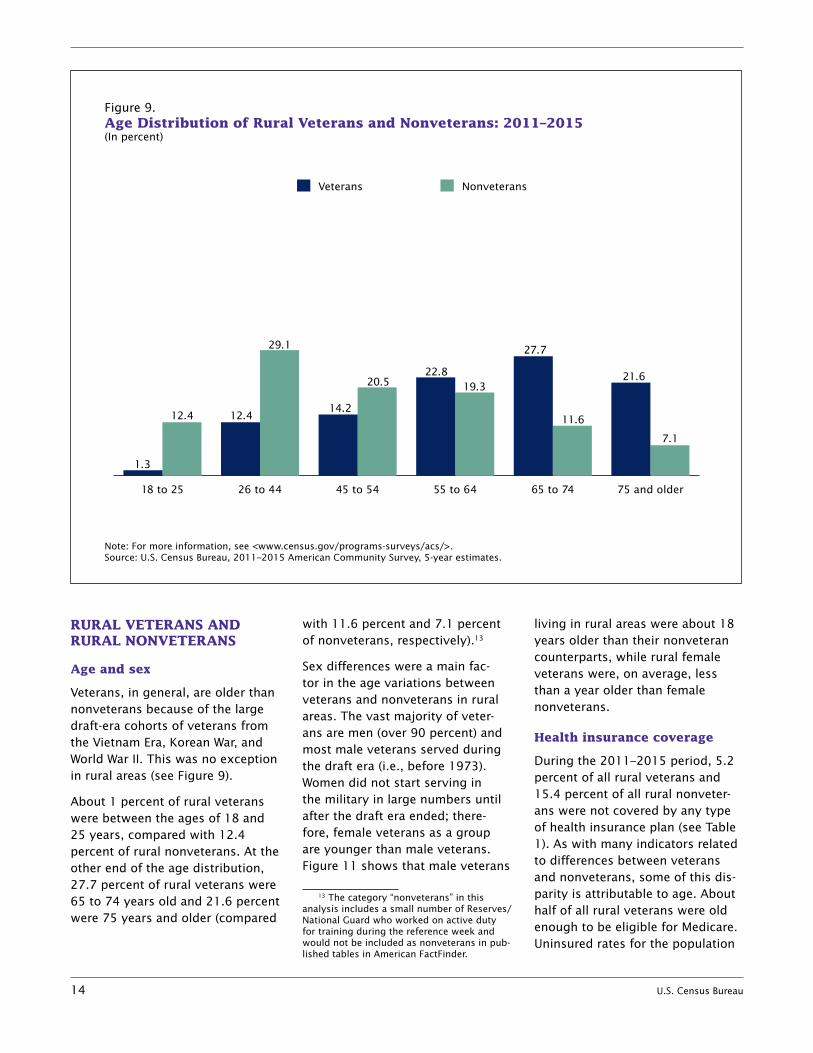
Veterans, in general, are older than nonveterans because of the large draft-era cohorts of veterans from the Vietnam Era, Korean War, and World War II. This was no exception in rural areas (see Figure 9).
About 1 percent of rural veterans were between the ages of 18 and 25 years, compared with 12.4 percent of rural nonveterans. At the other end of the age distribution, 27.7 percent of rural veterans were 65 to 74 years old and 21.6 percent were 75 years and older (compared
with 11.6 percent and 7.1 percent of nonveterans, respectively).13
Sex differences were a main fac-tor in the age variations between veterans and nonveterans in rural areas. The vast majority of veter-ans are men (over 90 percent) and most male veterans served during the draft era (i.e., before 1973). Women did not start serving in the military in large numbers until after the draft era ended; there-fore, female veterans as a group are younger than male veterans. Figure 11 shows that male veterans
13 The category “nonveterans” in this analysis includes a small number of Reserves/National Guard who worked on active duty for training during the reference week and would not be included as nonveterans in pub-lished tables in American FactFinder.
living in rural areas were about 18 years older than their nonveteran counterparts, while rural female veterans were, on average, less than a year older than female nonveterans.
Health insurance coverage
During the 2011–2015 period, 5.2 percent of all rural veterans and 15.4 percent of all rural nonveter-ans were not covered by any type of health insurance plan (see Table 1). As with many indicators related to differences between veterans and nonveterans, some of this dis-parity is attributable to age. About half of all rural veterans were old enough to be eligible for Medicare. Uninsured rates for the population
Figure 9. Age Distribution of Rural Veterans and Nonveterans: 2011–2015(In percent)
Veterans Nonveterans
75 and older65 to 7455 to 6445 to 5426 to 4418 to 25
Note: For more information, see <www.census.gov/programs-surveys/acs/>.Source: U.S. Census Bureau, 2011–2015 American Community Survey, 5-year estimates.
1.3
12.4 12.4
29.1
14.2
20.522.8
19.3
27.7
11.6
21.6
7.1
U.S. Census Bureau 15
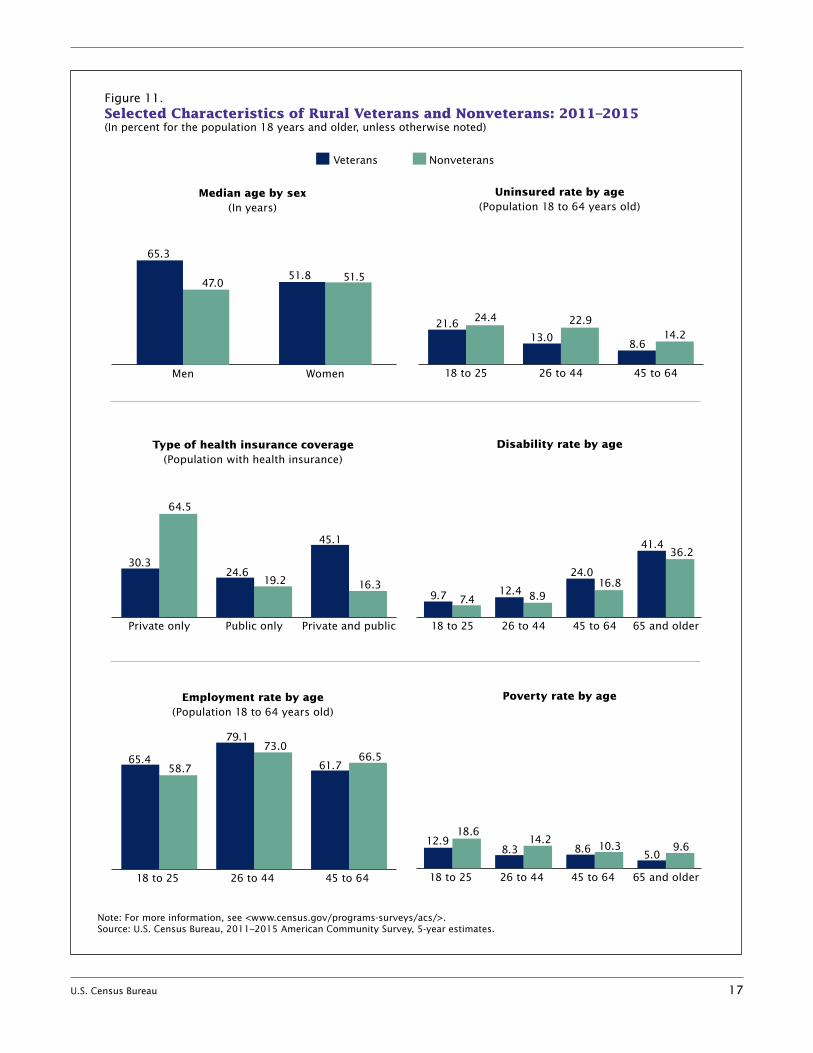
under age 65 are shown in Figure 11. At all ages, a lower percentage of rural veterans were uninsured, compared with rural nonveterans. The largest disparity in uninsured rates for the nonelderly rural population was for 26- to 44-year olds. The uninsured rate for rural veterans in this age group was 9.9 percentage points lower than for similar nonveterans.
Of the 94.8 percent of all rural veterans who had health insurance during this period, 30.3 percent had private insurance only, 24.6 percent had public insurance only, and the remainder (45.1 percent) had a combination of private and public insurance (see Figure 11). This distribution was markedly different from nonveterans, the majority of whom were covered by
private insurance (64.5 percent). Given that nonveterans are sub-stantially younger, and more likely to be in the working-age popula-tion, it is not unexpected that they have a higher percentage with insurance through an employer than the older veteran population.
Disability status
Nearly twice as many rural veter-ans had a disability compared with rural nonveterans (31.0 percent and 17.0 percent, respectively) (see Table 1). Again, the age and sex differences between these groups explained some of this differ-ence. Generally, the prevalence of disability increases with age and veterans are older than nonveter-ans. However, rural veterans of all ages had higher rates of disability
than rural nonveterans (see Figure 11). Ten percent of the youngest rural veterans, those 18 to 25 years old, had some type of disability, compared with 7.4 percent of rural nonveterans. Some of this differ-ence may also be due to veterans having higher rates of health insurance coverage. Individuals with health insurance may be more likely to receive a diagnosis of a medical condition or disability than those who are uninsured.14
Employment and work status
Although about two-thirds of both working-age rural veterans and nonveterans were employed during the 2011–2015 period, a higher percentage of rural veterans were out of the labor force (29.1 per-cent) and a lower percentage were unemployed (4.9 percent), com-pared with rural nonveterans (26.9 percent and 5.4 percent, respec-tively) (see Table 2). Employment rates differed by age for rural veterans and nonveterans (see Figure 11). A higher percentage of rural veterans ages 18 to 25 and 26 to 44 were employed, compared to similar nonveterans. In contrast, a lower percentage of rural veterans between 45 and 64 years old were employed (61.7 percent), compared with nonveterans (66.5 percent).
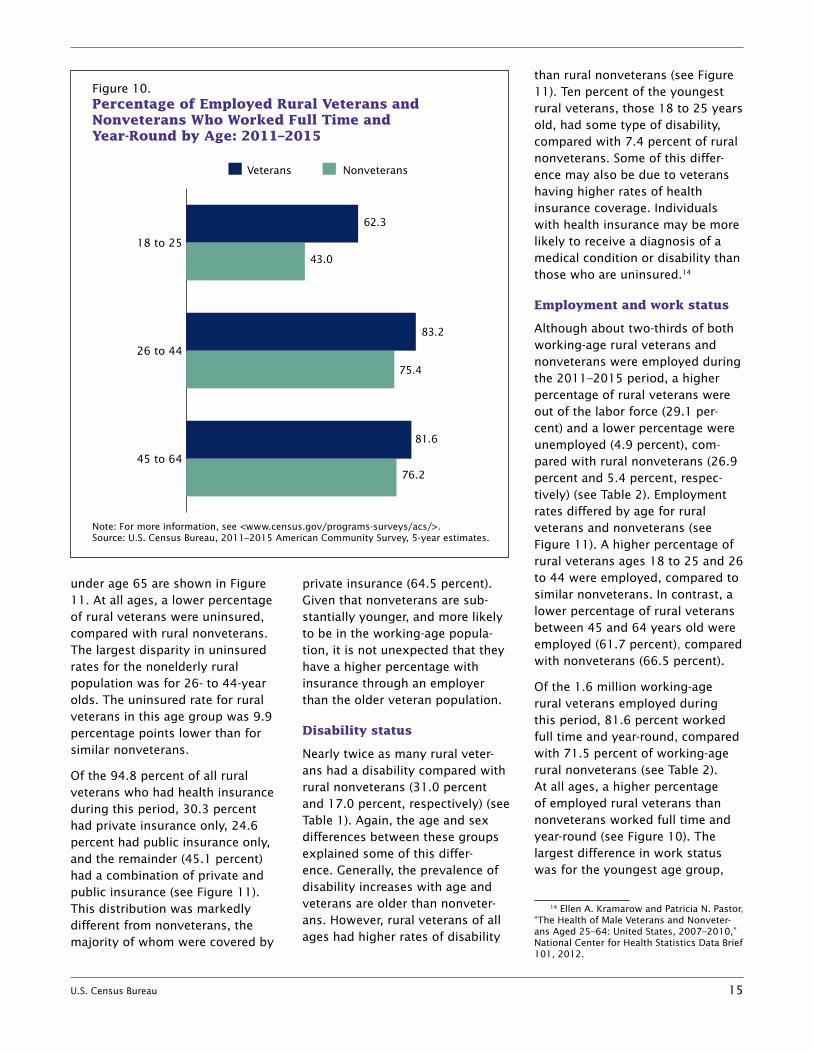
Of the 1.6 million working-age rural veterans employed during this period, 81.6 percent worked full time and year-round, compared with 71.5 percent of working-age rural nonveterans (see Table 2). At all ages, a higher percentage of employed rural veterans than nonveterans worked full time and year-round (see Figure 10). The largest difference in work status was for the youngest age group,
14 Ellen A. Kramarow and Patricia N. Pastor, “The Health of Male Veterans and Nonveter-ans Aged 25–64: United States, 2007–2010,” National Center for Health Statistics Data Brief 101, 2012.
Figure 10. Percentage of Employed Rural Veterans andNonveterans Who Worked Full Time and Year-Round by Age: 2011–2015
Note: For more information, see <www.census.gov/programs-surveys/acs/>.Source: U.S. Census Bureau, 2011–2015 American Community Survey, 5-year estimates.
45 to 64
26 to 44
18 to 25
62.3
43.0
83.2
75.4
81.6
76.2
Veterans Nonveterans
16 U.S. Census Bureau
where 62.3 percent of employed rural veterans aged 18 to 25 worked full time and year-round, compared with 43.0 percent of similar nonveterans. A major factor in these differences is the disparate proportions of men and women in the two populations.
Income and poverty status
For this analysis, any household that included a veteran was clas-sified as a veteran household, regardless of whether the veteran was the householder or not. All other households were classified as nonveteran households. The median household income of rural veterans was $53,554, compared with $52,161 for rural nonveterans.
Overall poverty rates in rural areas peaked during the 2007–2009 recession and recovery has been modest for most groups.15 In the 2011–2015 period, a lower per-centage of rural veterans (6.9 per-cent) than rural nonveterans (12.3 percent) were living below poverty (see Table 1). The youngest non-veterans living in rural areas had the highest rate of living in pov-erty (18.6 percent) and the oldest veterans had the lowest rate (5.0 percent) (see Figure 11).
RURAL VETERANS BY LEVEL OF RURALITY
This section explores the impact of geography on the characteris-tics of rural veterans. All counties were categorized into three levels
15 United States Department of Agricul-ture, Rural America at a Glance: 2015 Edition.
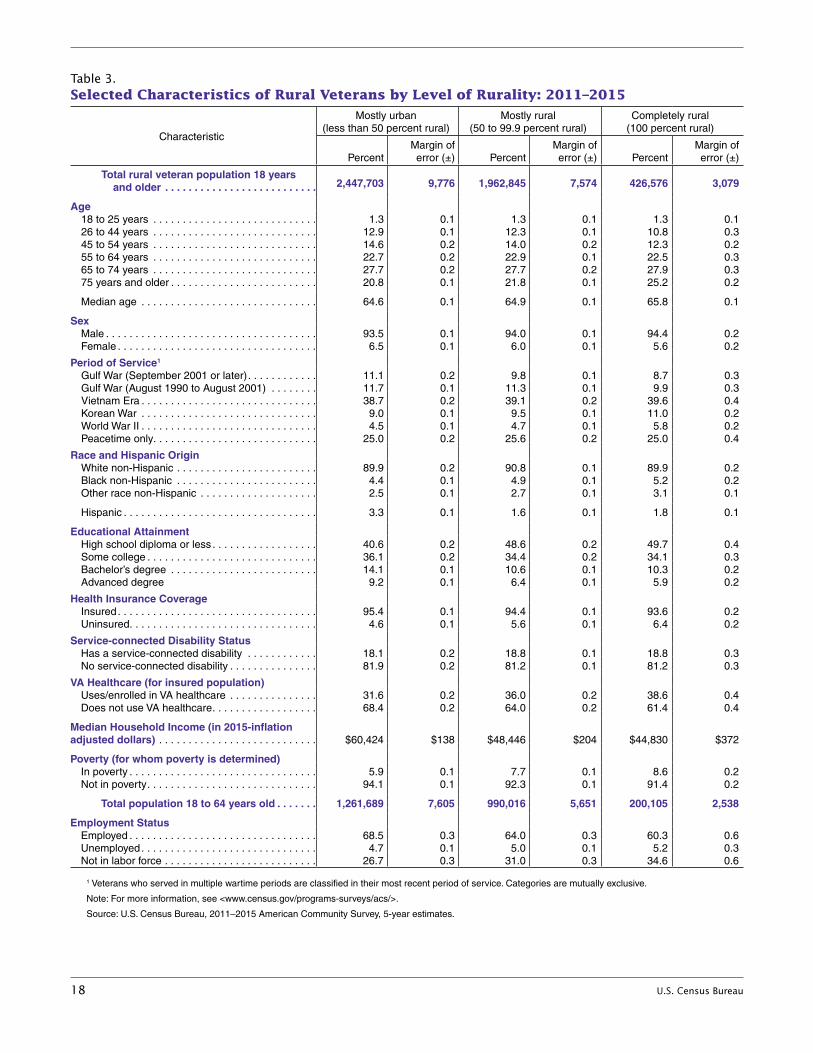
of rurality based on the percentage of the decennial census popula-tion living in the rural areas of the county as of 2010 when the defini-tion of rural was determined.16 The counties were delineated as mostly urban (less than 50 percent rural), mostly rural (50 to 99.9 percent rural), and completely rural (100 percent rural). For example, a county where 6.4 percent of the population lived in the rural areas of the county was classified as “mostly urban,” while one where 65.4 percent of the population lived in the rural areas of the county was classified as “mostly rural.” These delineations are one measure of rurality out of many possibilities and do not account for land area or population density. Using the ACS data with these county group-ings applied, the analysis examines whether rural veterans who lived in counties with some urban popula-tions were different from those in the most rural counties of the coun-try (see Table 3).
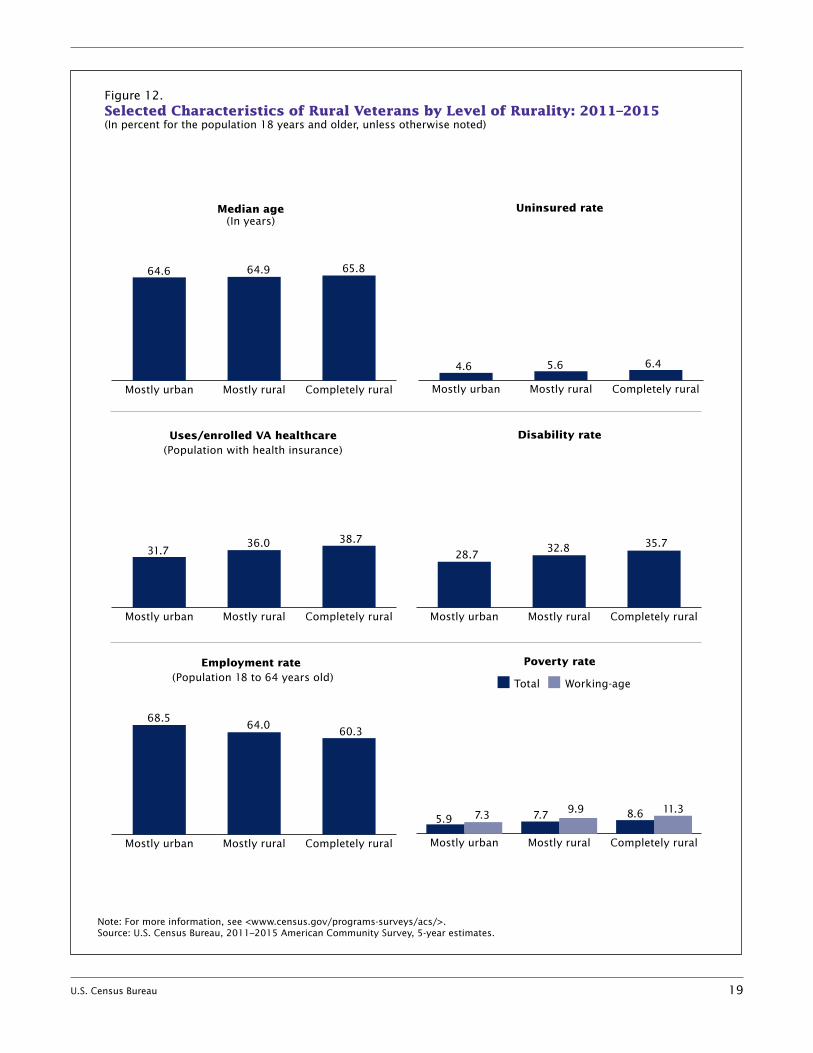
As the level of rurality increased, the age of rural veterans also increased. Rural veterans in coun-ties that were completely rural were the oldest group of rural veterans, with a median age of 66 years (see Figure 12). Since veterans in the completely rural counties were older, they were also less likely to be veterans of the most recent period of service. Just under 9 percent of rural veterans in completely rural counties served in Gulf War II (September 2001 or
16 U.S. Census Bureau, 2010 Census, Summary File 1, Table P2.
later), compared with 9.8 percent in mostly rural counties, and 11.1 percent of rural veterans in mostly urban counties.
The rates of uninsurance, disabil-ity, and poverty all increased as the level of rurality increased (see Figure 12). About 5 percent of rural veterans in mostly urban counties, 5.6 percent in mostly rural coun-ties, and 6.4 percent in completely rural counties were uninsured. Of those rural veterans with some type of health insurance coverage, those living in completely rural counties had the highest percent-age using VA healthcare (38.7 per-cent). Less than 30 percent of rural veterans in mostly urban counties reported any type of disability compared with about 36 percent of rural veterans in completely rural counties. Finally, rural veterans in completely rural counties had the highest percentage living in pov-erty (8.6 percent) compared with those in mostly rural counties (7.7 percent), and those in mostly urban counties (5.9 percent). Poverty rates by rurality were higher when rural veterans were limited to the working-age population (those 18 to 64 years old). This may be due to the employment rate for this population. The percentage of working-age rural veterans who were employed decreased as the level of rurality increased. About 69 percent of working-age rural veterans in mostly urban counties were employed, compared with 60.3 percent of those in completely rural counties.
U.S. Census Bureau 17
Figure 11.Selected Characteristics of Rural Veterans and Nonveterans: 2011–2015(In percent for the population 18 years and older, unless otherwise noted)
Note: For more information, see <www.census.gov/programs-surveys/acs/>.Source: U.S. Census Bureau, 2011–2015 American Community Survey, 5-year estimates.
WomenMen
Private and publicPublic onlyPrivate only
45 to 64 26 to 44 18 to 25
65.3
51.847.0 51.5
Median age by sex(In years)
Type of health insurance coverage(Population with health insurance)
Employment rate by age(Population 18 to 64 years old)
30.3
64.5
24.619.2
45.1
16.3
65.4
79.1
61.758.7
73.066.5
65 and older45 to 64 26 to 44 18 to 25
65 and older45 to 6426 to 4418 to 25
Poverty rate by age
Disability rate by age
Uninsured rate by age(Population 18 to 64 years old)
12.98.3 8.6 5.0
18.614.2
10.3 9.6
9.7 12.4
24.0
41.4
7.4 8.916.8
36.2
45 to 6426 to 4418 to 25
21.613.0
8.6
24.4 22.914.2
Veterans Nonveterans
18 U.S. Census Bureau
Table 3. Selected Characteristics of Rural Veterans by Level of Rurality: 2011–2015
Characteristic
Mostly urban (less than 50 percent rural)
Mostly rural (50 to 99 .9 percent rural)
Completely rural (100 percent rural)
PercentMargin of error (±) Percent
Margin of error (±) Percent
Margin of error (±)
Total rural veteran population 18 years and older . . . . . . . . . . . . . . . . . . . . . . . . . .
Age
2,447,703 9,776 1,962,845 7,574 426,576 3,079
18 to 25 years . . . . . . . . . . . . . . . . . . . . . . . . . . . . 1 .3 0 .1 1 .3 0 .1 1 .3 0 .1 26 to 44 years . . . . . . . . . . . . . . . . . . . . . . . . . . . . 12 .9 0 .1 12 .3 0 .1 10 .8 0 .3 45 to 54 years . . . . . . . . . . . . . . . . . . . . . . . . . . . . 14 .6 0 .2 14 .0 0 .2 12 .3 0 .2 55 to 64 years . . . . . . . . . . . . . . . . . . . . . . . . . . . . 22 .7 0 .2 22 .9 0 .1 22 .5 0 .3 65 to 74 years . . . . . . . . . . . . . . . . . . . . . . . . . . . . 27 .7 0 .2 27 .7 0 .2 27 .9 0 .3 75 years and older . . . . . . . . . . . . . . . . . . . . . . . . . 20 .8 0 .1 21 .8 0 .1 25 .2 0 .2
Median age . . . . . . . . . . . . . . . . . . . . . . . . . . . . . .
Sex
64 .6 0 .1 64 .9 0 .1 65 .8 0 .1
Male . . . . . . . . . . . . . . . . . . . . . . . . . . . . . . . . . . . . 93 .5 0 .1 94 .0 0 .1 94 .4 0 .2 Female . . . . . . . . . . . . . . . . . . . . . . . . . . . . . . . . . .
Period of Service1
6 .5 0 .1 6 .0 0 .1 5 .6 0 .2
Gulf War (September 2001 or later) . . . . . . . . . . . . 11 .1 0 .2 9 .8 0 .1 8 .7 0 .3 Gulf War (August 1990 to August 2001) . . . . . . . . 11 .7 0 .1 11 .3 0 .1 9 .9 0 .3 Vietnam Era . . . . . . . . . . . . . . . . . . . . . . . . . . . . . . 38 .7 0 .2 39 .1 0 .2 39 .6 0 .4 Korean War . . . . . . . . . . . . . . . . . . . . . . . . . . . . . . 9 .0 0 .1 9 .5 0 .1 11 .0 0 .2 World War II . . . . . . . . . . . . . . . . . . . . . . . . . . . . . . 4 .5 0 .1 4 .7 0 .1 5 .8 0 .2 Peacetime only . . . . . . . . . . . . . . . . . . . . . . . . . . . .
Race and Hispanic Origin
25 .0 0 .2 25 .6 0 .2 25 .0 0 .4
White non-Hispanic . . . . . . . . . . . . . . . . . . . . . . . . 89 .9 0 .2 90 .8 0 .1 89 .9 0 .2 Black non-Hispanic . . . . . . . . . . . . . . . . . . . . . . . . 4 .4 0 .1 4 .9 0 .1 5 .2 0 .2 Other race non-Hispanic . . . . . . . . . . . . . . . . . . . . 2 .5 0 .1 2 .7 0 .1 3 .1 0 .1
Hispanic . . . . . . . . . . . . . . . . . . . . . . . . . . . . . . . . .
Educational Attainment
3 .3 0 .1 1 .6 0 .1 1 .8 0 .1
High school diploma or less . . . . . . . . . . . . . . . . . . 40 .6 0 .2 48 .6 0 .2 49 .7 0 .4 Some college . . . . . . . . . . . . . . . . . . . . . . . . . . . . . 36 .1 0 .2 34 .4 0 .2 34 .1 0 .3 Bachelor’s degree . . . . . . . . . . . . . . . . . . . . . . . . . 14 .1 0 .1 10 .6 0 .1 10 .3 0 .2 Advanced degree
Health Insurance Coverage
9 .2 0 .1 6 .4 0 .1 5 .9 0 .2
Insured . . . . . . . . . . . . . . . . . . . . . . . . . . . . . . . . . . 95 .4 0 .1 94 .4 0 .1 93 .6 0 .2 Uninsured . . . . . . . . . . . . . . . . . . . . . . . . . . . . . . . .
Service-connected Disability Status
4 .6 0 .1 5 .6 0 .1 6 .4 0 .2
Has a service-connected disability . . . . . . . . . . . . 18 .1 0 .2 18 .8 0 .1 18 .8 0 .3 No service-connected disability . . . . . . . . . . . . . . .
VA Healthcare (for insured population)
81 .9 0 .2 81 .2 0 .1 81 .2 0 .3
Uses/enrolled in VA healthcare . . . . . . . . . . . . . . . 31 .6 0 .2 36 .0 0 .2 38 .6 0 .4 Does not use VA healthcare . . . . . . . . . . . . . . . . . .
Median Household Income (in 2015-inflation
68 .4 0 .2 64 .0 0 .2 61 .4 0 .4
adjusted dollars) . . . . . . . . . . . . . . . . . . . . . . . . . . .
Poverty (for whom poverty is determined)
$60,424 $138 $48,446 $204 $44,830 $372
In poverty . . . . . . . . . . . . . . . . . . . . . . . . . . . . . . . . 5 .9 0 .1 7 .7 0 .1 8 .6 0 .2 Not in poverty . . . . . . . . . . . . . . . . . . . . . . . . . . . . . 94 .1 0 .1 92 .3 0 .1 91 .4 0 .2
Total population 18 to 64 years old . . . . . . .
Employment Status
1,261,689 7,605 990,016 5,651 200,105 2,538
Employed . . . . . . . . . . . . . . . . . . . . . . . . . . . . . . . . 68 .5 0 .3 64 .0 0 .3 60 .3 0 .6 Unemployed . . . . . . . . . . . . . . . . . . . . . . . . . . . . . . 4 .7 0 .1 5 .0 0 .1 5 .2 0 .3 Not in labor force . . . . . . . . . . . . . . . . . . . . . . . . . . 26 .7 0 .3 31 .0 0 .3 34 .6 0 .6
1 Veterans who served in multiple wartime periods are classified in their most recent period of service . Categories are mutually exclusive .
Note: For more information, see <www .census .gov/programs-surveys/acs/> .
Source: U .S . Census Bureau, 2011–2015 American Community Survey, 5-year estimates .
U.S. Census Bureau 19
Figure 12.Selected Characteristics of Rural Veterans by Level of Rurality: 2011–2015(In percent for the population 18 years and older, unless otherwise noted)
Note: For more information, see <www.census.gov/programs-surveys/acs/>.Source: U.S. Census Bureau, 2011–2015 American Community Survey, 5-year estimates.
Completely ruralMostly ruralMostly urban
Completely ruralMostly ruralMostly urban
Completely ruralMostly ruralMostly urban
64.6 65.864.9
Median age (In years)
Uses/enrolled VA healthcare(Population with health insurance)
Employment rate (Population 18 to 64 years old)
31.736.0 38.7
68.560.3
64.0
Completely ruralMostly ruralMostly urban
Completely ruralMostly ruralMostly urban
Poverty rate
Disability rate
Uninsured rate
5.9 7.7 8.67.3 9.9 11.3
28.735.732.8
Completely ruralMostly ruralMostly urban
4.6 6.45.6
Total Working-age
20 U.S. Census Bureau
INTERNET ACCESS FOR RURAL VETERANS
A profile of rural America would not be complete Internet Access and Use of VA Healthcare
without some mention of Internet access for rural For all residents of rural areas, travel distance to communities. Low population density, greater dis- services can be a barrier to healthcare. Telemedicine tances, and natural geographic barriers may make and telehealth are widely recognized as vital to it more difficult to obtain Internet services in some healthcare provision in rural communities and VA rural areas. Information about Internet access, how- has become a leader in this new area of healthcare.1 ever, is not available in the 2011–2015 ACS 5-year Lack of adequate information technology infrastruc-estimates because the question was not added to ture can affect utilization of these service options. the survey until 2012. The statistics shown here About 44 percent of rural veteran households that about access to the Internet are from the 2015 ACS use VA healthcare services had no Internet access in 1-year estimates. 2015, compared with 34.2 percent of urban veteran
households that use VA healthcare services. Rural Internet Access by Region
1 For more information about VA telehealth services, A higher percentage of rural veteran households see <www.telehealth.va.gov/>.
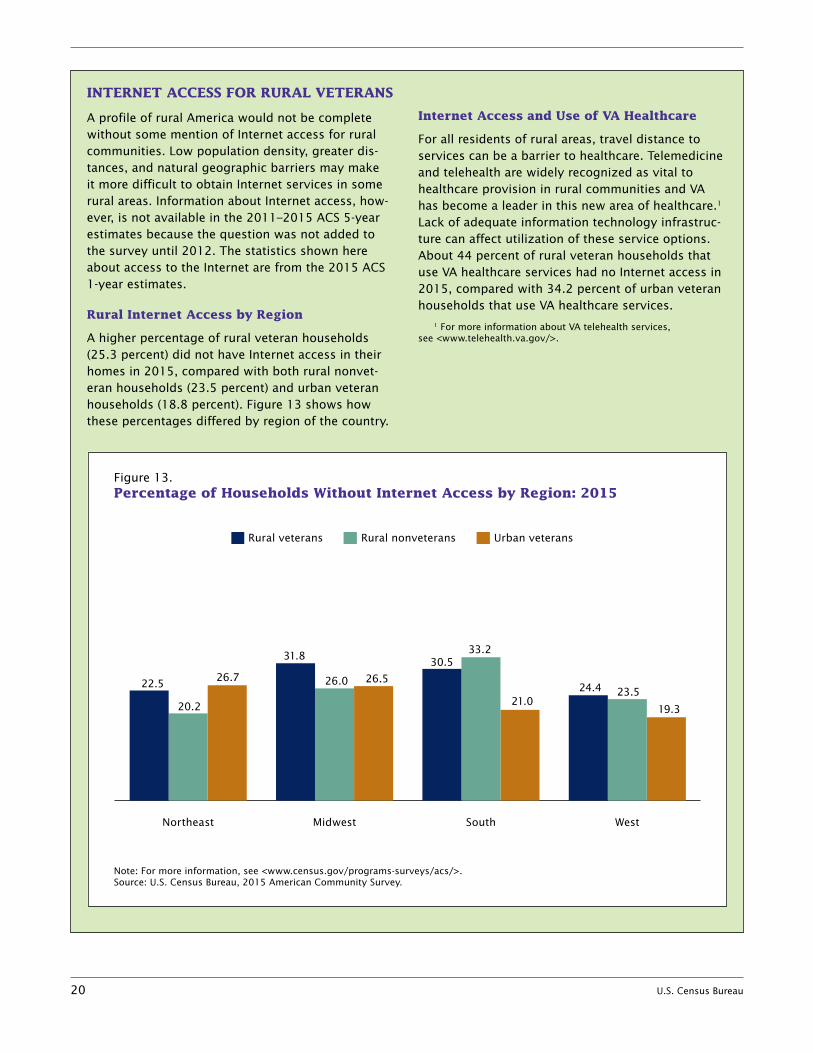
(25.3 percent) did not have Internet access in their homes in 2015, compared with both rural nonvet-eran households (23.5 percent) and urban veteran households (18.8 percent). Figure 13 shows how these percentages differed by region of the country.
Figure 13. Percentage of Households Without Internet Access by Region: 2015
WestSouthMidwestNortheast
Note: For more information, see <www.census.gov/programs-surveys/acs/>.Source: U.S. Census Bureau, 2015 American Community Survey.
22.5
20.2
26.7
31.8
26.0 26.5
30.533.2
21.024.4 23.5
19.3
Rural veterans Urban veteransRural nonveterans
U.S. Census Bureau 21
SUMMARY
Rural areas are home to many diverse populations and their opportunities and challenges vary as much as the people living within them do. This report describes who rural veterans are and how they dif-fered in key characteristics depend-ing on their reference group. Understanding the characteristics of these groups helps direct needed programs and services across the country. The overall well-being of rural residents may decrease as distance from urban centers and geographic isolation increases; however, “rural” did not translate into worse outcomes for all charac-teristics, particularly for veterans.
In general, rural veterans were different from rural nonveterans in the ways veterans are typically different from nonveterans, and rural veterans were different from urban veterans in the ways all rural residents are different from their urban counterparts. Ultimately, though, across the characteristics explored here, the veterans groups were more similar to each other than they were to nonveterans. The two exceptions were employment rates and income where rural veter-ans were more like their other rural neighbors.
Rural veterans were older than both comparison groups. Rural veterans were 15 years older than rural nonveterans and 2 years older than urban veterans and their age increased as the level of rurality increased. Rural veterans in coun-ties that were completely rural were the oldest, with a median age of 66 years.
Rural veterans had low rates of uninsurance in general. They were
less likely than rural nonveterans though more likely than urban vet-erans to be uninsured during this period. Although the uninsured rate for rural veterans was highest in the counties that were completely rural, it was still half that of all rural nonveterans. The uninsured rate for all groups differed by age.
Rural veterans used VA healthcare at comparable rates to urban vet-erans and few used it as their only source of health insurance. Usage of VA healthcare by rural veterans increased by level of rurality, with almost 40 percent of veterans in completely rural counties enrolled in or using the system.
Rural veterans had the highest rates of disability overall and at all ages. Rural veterans from every period of service also had higher rates of disability than similar urban veterans. Rural veterans who served during World War II (the old-est cohort) had the highest rate of disability and urban veterans who served in Gulf War II (the youngest cohort) had the lowest. Rural Gulf War II veterans, however, had the highest rate of service-connected disability. Healthcare services required for these two groups may differ dramatically and access to those services may be more dif-ficult in rural areas.
Rural veterans had an employment rate comparable to nonveterans, but lower than urban veterans. Overall, working-age rural veterans had a lower employment rate than rural nonveterans and urban veter-ans and that rate decreased as the level of rurality increased. These differences may reflect employment opportunities in rural and urban areas. Employed rural veterans,
however, were more likely to work full time and year-round than rural nonveterans, though that is likely related to the proportion of men in the veteran population.
Finally, rural veterans had median household incomes more similar to those of rural nonveterans than urban veterans. Poverty rates for rural veterans increased by level of rurality, however, at 8.6 percent, the poverty rate for rural veterans in completely rural counties was about four percentage points lower than for rural nonveterans overall.
MORE INFORMATION
For more information about veter-ans of the U.S. Armed Forces, go to the U.S. Census Bureau’s Web site on veterans statistics at <www.census.gov/topics /population/veterans.html>.
SOURCE AND ACCURACY
Data presented in this report are based on people and households that responded to the ACS in 2011 through 2015, and are subject to sampling and nonsampling error. All comparisons presented in this report have taken sampling error into account and are significant at the 90 percent confidence level, unless otherwise noted. Due to rounding, some details may not sum to totals. For information on sampling and estimation methods, confidentiality protection, and sampling and nonsampling errors, please see the “ACS Accuracy of the Data” document for 2011–2015 located at <www2.census.gov /programs-surveys/acs/tech_docs /accuracy/MultiyearACSAccuracyof Data2015.pdf>.
22 U.S. Census Bureau
CONTACT
For questions related to the contents of this report and the accompanying tables, contact the author:
Kelly Ann Holder <[email protected]> 301-763-3462 Social, Economic, and Housing Statistics Division U.S. Census Bureau
SUGGESTED CITATION
Holder, Kelly A., “Veterans in RuralAmerica: 2011–2015,” American Community Survey Reports, ACS-36, U.S. Census Bureau, Washington, DC, 2016.
WHAT IS THE AMERICAN COMMUNITY SURVEY?
The American Community Survey (ACS) is a nationwide survey designed to provide communities with reliable and timely demo-graphic, social, economic, and housing data for the nation, states, congressional districts, counties, places, and other localities every year. It has an annual sample size of about 3 million addresses across the United States and Puerto Rico and includes both housing units and group quarters (e.g., nursing facilities and prisons). The ACS is conducted in every county throughout the nation, and every muni-cipio in Puerto Rico, where it is called the Puerto Rico Community Survey. Beginning in 2006, ACS 1-year data for 2005 were released for geographic areas with populations of 65,000 and greater. Beginning in 2010, ACS 5-year data for 2005–2009 were released for all geographic areas. For information on the ACS sample design and other topics, visit <www.census.gov/programs-surveys/acs/>.