Embed Size (px)
Citation preview

Census 2000 counted208.1 million civilians18 and older in theUnited States.1 Withinthis population,approximately 26.4 million or 12.7 percent were vet-erans. Census datadefine a civilian veter-an as someone 18 andolder who is not cur-rently on active duty,but who once servedon active duty in theUnited States Army,Navy, Air Force,Marine Corps, orCoast Guard, or whoserved in theMerchant Marine dur-ing World War II.2 Thisdefinition includespeople who served foreven a short time.Census 2000 collecteddata about the peri-ods and length ofservice for veterans.Period of militaryservice data distin-guish veterans who
served during wartime from those whoserved during peacetime. Questionsabout period and length of military serv-ice provide information necessary to esti-mate the number of veterans who are
U S C E N S U S B U R E A UHelping You Make Informed Decisions
U.S.Department of CommerceEconomics and Statistics Administration
U.S. CENSUS BUREAU
Issued May 2003
C2KBR-22
Veterans: 2000Census 2000 Brief
By Christy Richardson and Judith Waldrop
1 The text of this reportdiscusses data for the UnitedStates, including the 50states and the District of Columbia. Data for theCommonwealth of Puerto Rico are shown in Table 2and Figure 4.
2 Active duty does not include active duty fortraining in the military Reserves or National Guard,such as the 4 to 6 months of initial training or year-ly summer camps.
a. Has this person ever served on active duty inthe U.S. Armed Forces, military Reserves, orNational Guard? Active duty does not include trainingfor the Reserves or National Guard, but DOES includeactivation, for example, for the Persian Gulf War.
Yes, now on active dutyYes, on active duty in past, but not nowNo, training for Reserves or National Guard only Skip to 21No, never served in the military Skip to 21
b. When did this person serve on active duty in the U.S. Armed Forces? Mark a box forEACH period in which this person served.
April 1995 or later
Some other timeWorld War II (September 1940—July 1947)Korean conflict (June 1950—January 1955)February 1955 to July 1964Vietnam era (August 1964—April 1975)
May 1975 to August 1980September 1980 to July 1990August 1990 to March 1995 (including Persian Gulf War)
c. In total, how many years of active-duty militaryservice has this person had?
Less than 2 years2 years or more
x
Figure 1.
Reproduction of the Questions on Veterans Status From Census 2000
Source: U.S. Census Bureau, Census 2000 questionnaire.
20
2 U.S. Census Bureau
eligible to receive specificbenefits.3
Decennial censuses have included aquestion on veterans since 1840.In the 1990 census, veterans datawere collected from the population15 and older, and data werereleased for those 16 and older.Veteran status information was alsocollected from people 15 and olderin Census 2000, but the Census2000 data are reported here onlyfor the population 18 and older.
The Census 2000 long form wasdistributed to 1 in 6 households inthe United States. Question 20,the veterans item on this form,asked respondents about anyactive-duty service in the U.S.Armed Forces, military Reserves, orNational Guard; about periods ofservice; and about the number ofyears of active-duty military serv-ice (see Figure 1).
The 1990 census and Census 2000questions asked about differentperiods of service. The mostrecent period on the Census 2000questionnaire was April 1995 orlater, while in 1990 it wasSeptember 1980 or later. The1990 census provided a separatecategory for World War I service;Census 2000 asked people withsuch service to mark the “Someother time” category. In both 1990and 2000, respondents could indi-cate that they served during morethan one period.
This report is part of a series thatpresents population and housingdata collected by Census 2000. Itcontains data on the veteran statusof the civilian population 18 and
older. It highlights the size of theveteran population, changesbetween 1990 and 2000, the dis-tribution of the population by peri-ods of service, and the distributionof the population in regions,states, counties, and places withpopulations of 100,000 or more.
The total number of civilianveterans in the United Stateshas been decreasing, but thenumber of female veteranshas been increasing.
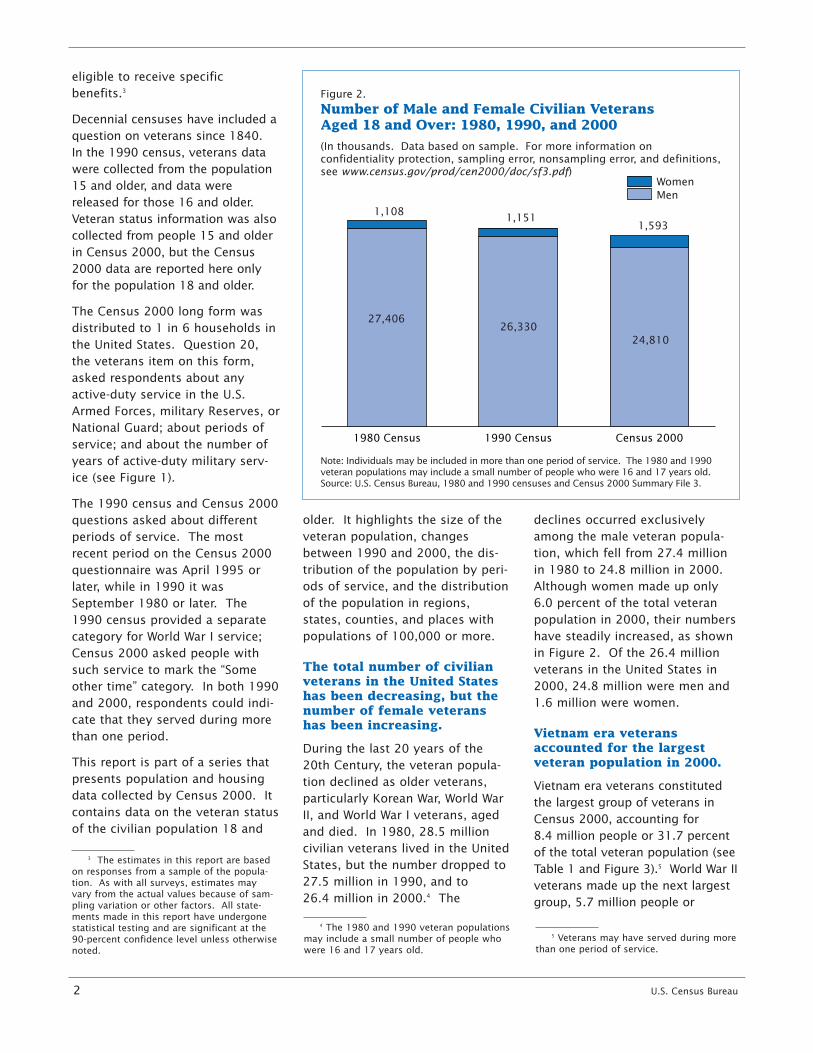
During the last 20 years of the20th Century, the veteran popula-tion declined as older veterans,particularly Korean War, World WarII, and World War I veterans, agedand died. In 1980, 28.5 millioncivilian veterans lived in the UnitedStates, but the number dropped to27.5 million in 1990, and to 26.4 million in 2000.4 The
declines occurred exclusivelyamong the male veteran popula-tion, which fell from 27.4 millionin 1980 to 24.8 million in 2000.Although women made up only 6.0 percent of the total veteranpopulation in 2000, their numbershave steadily increased, as shownin Figure 2. Of the 26.4 millionveterans in the United States in2000, 24.8 million were men and1.6 million were women.
Vietnam era veteransaccounted for the largestveteran population in 2000.
Vietnam era veterans constitutedthe largest group of veterans inCensus 2000, accounting for 8.4 million people or 31.7 percentof the total veteran population (seeTable 1 and Figure 3).5 World War IIveterans made up the next largestgroup, 5.7 million people or
3 The estimates in this report are basedon responses from a sample of the popula-tion. As with all surveys, estimates mayvary from the actual values because of sam-pling variation or other factors. All state-ments made in this report have undergonestatistical testing and are significant at the90-percent confidence level unless otherwisenoted.
Figure 2.
Number of Male and Female Civilian Veterans Aged 18 and Over: 1980, 1990, and 2000
Note: Individuals may be included in more than one period of service. The 1980 and 1990veteran populations may include a small number of people who were 16 and 17 years old.Source: U.S. Census Bureau, 1980 and 1990 censuses and Census 2000 Summary File 3.
(In thousands. Data based on sample. For more information on confidentiality protection, sampling error, nonsampling error, and definitions, see www.census.gov/prod/cen2000/doc/sf3.pdf)
Census 20001990 Census1980 Census
WomenMen
1,593
27,406
1,108
26,330
1,151
24,810
4 The 1980 and 1990 veteran populationsmay include a small number of people whowere 16 and 17 years old.
5 Veterans may have served during morethan one period of service.
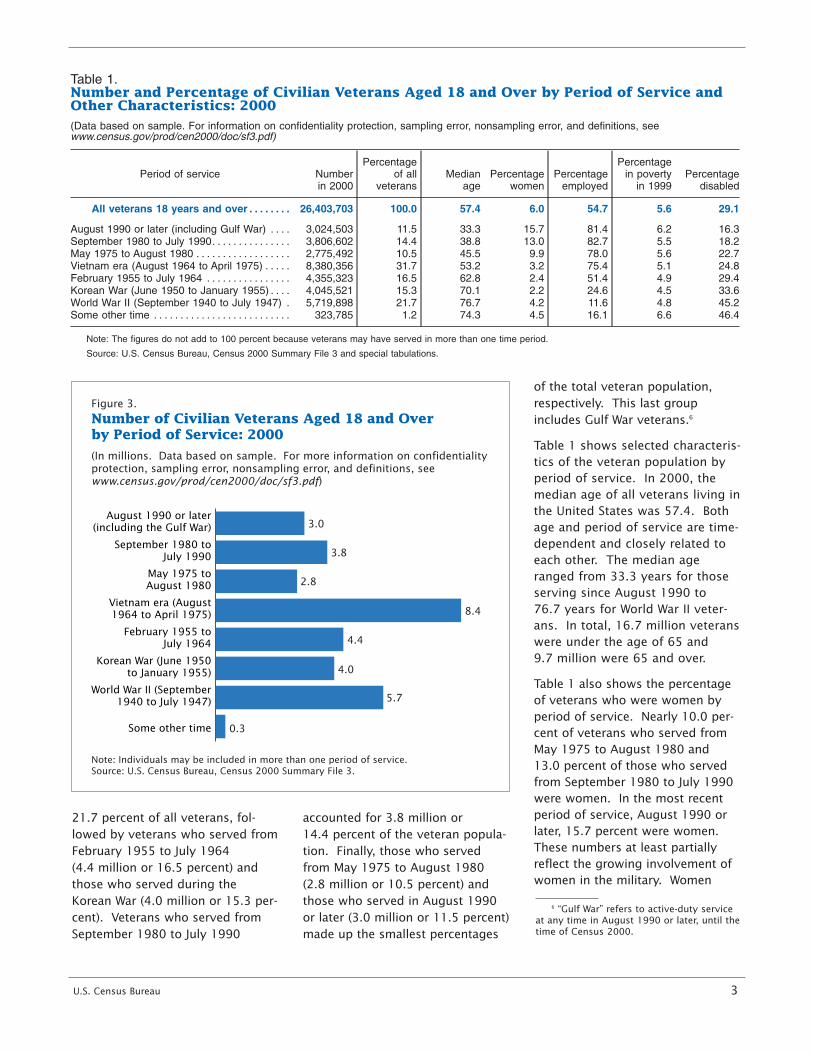
21.7 percent of all veterans, fol-lowed by veterans who served fromFebruary 1955 to July 1964 (4.4 million or 16.5 percent) andthose who served during theKorean War (4.0 million or 15.3 per-cent). Veterans who served fromSeptember 1980 to July 1990
accounted for 3.8 million or 14.4 percent of the veteran popula-tion. Finally, those who servedfrom May 1975 to August 1980 (2.8 million or 10.5 percent) andthose who served in August 1990or later (3.0 million or 11.5 percent)made up the smallest percentages
of the total veteran population,respectively. This last groupincludes Gulf War veterans.6
Table 1 shows selected characteris-tics of the veteran population byperiod of service. In 2000, themedian age of all veterans living inthe United States was 57.4. Bothage and period of service are time-dependent and closely related toeach other. The median ageranged from 33.3 years for thoseserving since August 1990 to 76.7 years for World War II veter-ans. In total, 16.7 million veteranswere under the age of 65 and 9.7 million were 65 and over.
Table 1 also shows the percentageof veterans who were women byperiod of service. Nearly 10.0 per-cent of veterans who served fromMay 1975 to August 1980 and 13.0 percent of those who servedfrom September 1980 to July 1990were women. In the most recentperiod of service, August 1990 orlater, 15.7 percent were women.These numbers at least partiallyreflect the growing involvement ofwomen in the military. Women
U.S. Census Bureau 3
Table 1.Number and Percentage of Civilian Veterans Aged 18 and Over by Period of Service andOther Characteristics: 2000(Data based on sample. For information on confidentiality protection, sampling error, nonsampling error, and definitions, seewww.census.gov/prod/cen2000/doc/sf3.pdf)
Period of service Numberin 2000
Percentageof all
veteransMedian
agePercentage
womenPercentage
employed
Percentagein poverty
in 1999Percentage
disabled
All veterans 18 years and over . . . . . . . . 26,403,703 100.0 57.4 6.0 54.7 5.6 29.1
August 1990 or later (including Gulf War) . . . . 3,024,503 11.5 33.3 15.7 81.4 6.2 16.3September 1980 to July 1990. . . . . . . . . . . . . . . 3,806,602 14.4 38.8 13.0 82.7 5.5 18.2May 1975 to August 1980 . . . . . . . . . . . . . . . . . . 2,775,492 10.5 45.5 9.9 78.0 5.6 22.7Vietnam era (August 1964 to April 1975) . . . . . 8,380,356 31.7 53.2 3.2 75.4 5.1 24.8February 1955 to July 1964 . . . . . . . . . . . . . . . . 4,355,323 16.5 62.8 2.4 51.4 4.9 29.4Korean War (June 1950 to January 1955) . . . . 4,045,521 15.3 70.1 2.2 24.6 4.5 33.6World War II (September 1940 to July 1947) . 5,719,898 21.7 76.7 4.2 11.6 4.8 45.2Some other time . . . . . . . . . . . . . . . . . . . . . . . . . . 323,785 1.2 74.3 4.5 16.1 6.6 46.4
Note: The figures do not add to 100 percent because veterans may have served in more than one time period.
Source: U.S. Census Bureau, Census 2000 Summary File 3 and special tabulations.
Figure 3.
Number of Civilian Veterans Aged 18 and Over by Period of Service: 2000
Note: Individuals may be included in more than one period of service.Source: U.S. Census Bureau, Census 2000 Summary File 3.
(In millions. Data based on sample. For more information on confidentiality protection, sampling error, nonsampling error, and definitions, see www.census.gov/prod/cen2000/doc/sf3.pdf)
Some other time
World War II (September1940 to July 1947)
Korean War (June 1950to January 1955)
February 1955 toJuly 1964
Vietnam era (August1964 to April 1975)
May 1975 toAugust 1980
September 1980 toJuly 1990
August 1990 or later(including the Gulf War)
0.3
3.0
3.8
2.8
8.4
4.4
4.0
5.7
6 “Gulf War” refers to active-duty serviceat any time in August 1990 or later, until thetime of Census 2000.

made up 4.2 percent of the WorldWar II veteran population and 2.2 percent of the Korean War veter-an population.
A large percentage of U.S.veterans were employed.
The majority of U.S. veterans (54.7 percent) were employed in2000, as shown in Table 1.7
Reflecting the ties between age andperiod of service, and age andemployment, veterans who servedmost recently were most likely tobe employed in 2000. Among veter-ans serving in August 1990 or later,81.4 percent were employed, while82.7 percent of those who servedfrom September 1980 to July 1990were employed. They were closelyfollowed by veterans who servedfrom May 1975 to August 1980(78.0 percent). More than threequarters (75.4 percent) of veteransof the Vietnam era were employedin 2000, and more than half (51.4 percent) of those who servedfrom February 1955 to July 1964were employed. The percentageemployed was low for Korean Warveterans (24.6 percent) and WorldWar II veterans (11.6 percent), manyof whom were likely to be retired.
Poverty rates were low amongveterans for every period ofservice.
Overall, 5.6 percent of veteranslived in poverty in 1999, as shownin Table 1, compared with 10.9 percent of the U.S. adult popu-lation in general. The youngest vet-erans, those who served in August1990 or later, were among the mostlikely to be poor, with a poverty rateof 6.2 percent. The poverty rate forVietnam era veterans was 5.1 per-cent. Korean War and World War IIveterans had among the lowest
poverty rates for veterans, 4.5 per-cent and 4.8 percent, respectively.
The oldest veterans had thehighest disability rates in 2000.
Almost 3 out of every 10 veterans(29.1 percent) were disabled (seeTable 1).8 However, 1 in 3 KoreanWar veterans (33.6 percent) andalmost 1 in 2 World War II veterans(45.2 percent) were disabled.Approximately 1 in 4 Vietnam vet-erans (24.8 percent) was disabled.The disability rates for those whoserved most recently, fromSeptember 1980 to July 1990 or inAugust 1990 or later, were the low-est, at 18.2 percent and 16.3 per-cent, respectively.
GEOGRAPHIC DISTRIBUTIONOF VETERANS
The following discussion of thegeographic distribution of veteransfocuses on the civilian population18 and older.
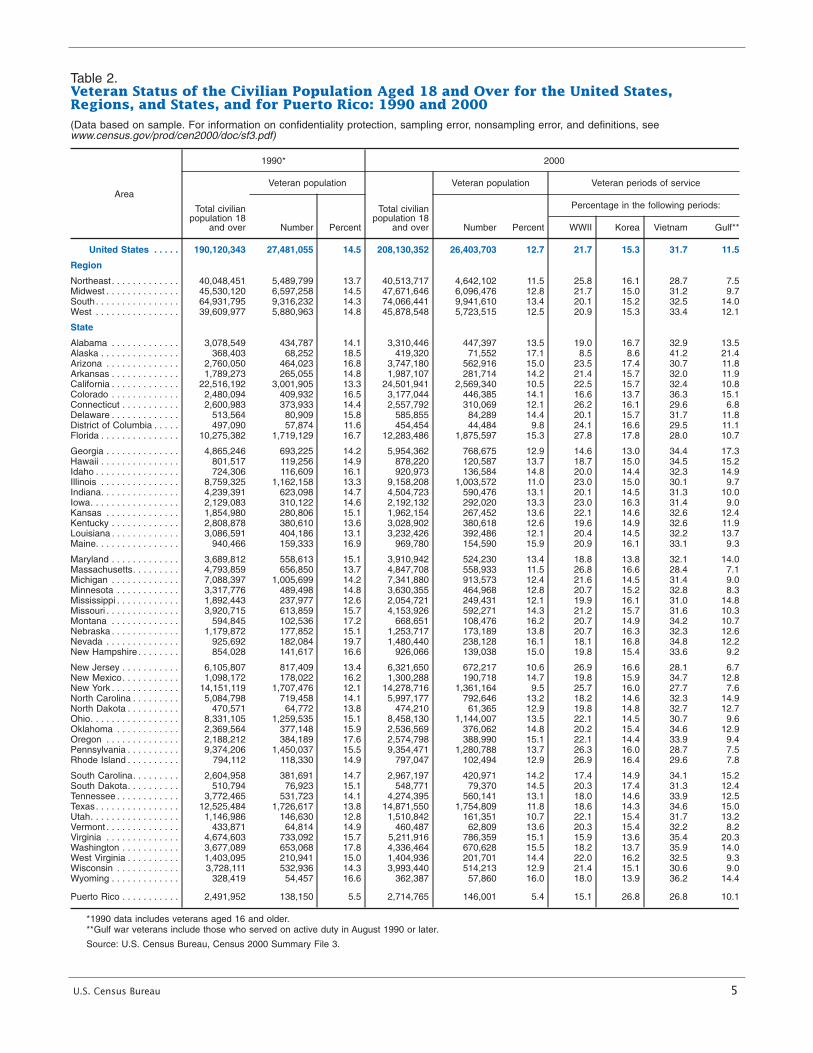
In 2000, the largest veteranpopulations lived in the Southand the Midwest.9
The veteran population was largestin the South (9.9 million) and theMidwest (6.1 million), the two most
populous regions of the country(see Table 2). The West andNortheast had veteran populationsof 5.7 million and 4.6 million,respectively. The percentage ofcivilians 18 and older who were vet-erans varied only slightly amongthe regions, ranging from 11.5 per-cent in the Northeast to 13.4 per-cent in the South.
Between 1990 and 2000, the num-ber of veterans decreased in everyregion except the South, where itincreased from 9.3 million to 9.9 million (a 6.7 percent increase).The greatest decline was in theNortheast, where the number ofveterans dropped from 5.5 millionto 4.6 million or 15.4 percent. Theveteran population fell 7.6 percentin the Midwest and 2.7 percent inthe West.
Between 1990 and 2000, veteransdeclined as a percentage of thecivilian population in all regions.The percentage of veterans in theWest fell 2.3 percentage points,while it dropped 2.2 percentagepoints in the Northeast. TheMidwest and the South experi-enced smaller declines, 1.7 per-centage points and 0.9 percentagepoints, respectively.
The most populous state,California, had the greatestnumber of veterans.
California was the only state thatwas home to more than 2.5 millionveterans in 2000. Additionally, sixother states had veteran popula-tions of one million or more:Florida, Texas, New York,Pennsylvania, Ohio, and Illinois.Together, these seven states, whichcontained 44.6 percent of the totalU.S. population 18 and older,accounted for 11.0 million veteransor 41.6 percent of the U.S. total.
Among the 50 states and theDistrict of Columbia, Alaska had
4 U.S. Census Bureau
7 Among the general population 20 andolder, 61.3 percent were employed accordingto Census 2000.
8 Veterans responding to Census 2000were considered to have a disability if theyanswered “yes” to having a sensory, physi-cal, mental, or self-care disability; or theyanswered “yes” to having a disability affect-ing their ability to go outside the home; orthey were under 65 years old and answered“yes” to having an employment disability.
9 The Northeast region includes thestates of Connecticut, Maine, Massachusetts,New Hampshire, New Jersey, New York,Pennsylvania, Rhode Island, and Vermont.The Midwest region includes the states ofIllinois, Indiana, Iowa, Kansas, Michigan,Minnesota, Missouri, Nebraska, NorthDakota, Ohio, South Dakota, and Wisconsin.The South region includes the states ofAlabama, Arkansas, Delaware, Florida,Georgia, Kentucky, Louisiana, Maryland,Mississippi, North Carolina, Oklahoma, SouthCarolina, Tennessee, Texas, Virginia, WestVirginia, and the District of Columbia, a stateequivalent. The West region includes thestates of Alaska, Arizona, California,Colorado, Hawaii, Idaho, Montana, Nevada,New Mexico, Oregon, Utah, Washington, andWyoming.
U.S. Census Bureau 5
Table 2.Veteran Status of the Civilian Population Aged 18 and Over for the United States,Regions, and States, and for Puerto Rico: 1990 and 2000(Data based on sample. For information on confidentiality protection, sampling error, nonsampling error, and definitions, seewww.census.gov/prod/cen2000/doc/sf3.pdf)
Area
1990* 2000
Total civilianpopulation 18
and over
Veteran population
Total civilianpopulation 18
and over
Veteran population Veteran periods of service
Number Percent Number Percent
Percentage in the following periods:
WWII Korea Vietnam Gulf**
United States . . . . . 190,120,343 27,481,055 14.5 208,130,352 26,403,703 12.7 21.7 15.3 31.7 11.5
Region
Northeast . . . . . . . . . . . . . 40,048,451 5,489,799 13.7 40,513,717 4,642,102 11.5 25.8 16.1 28.7 7.5Midwest . . . . . . . . . . . . . . 45,530,120 6,597,258 14.5 47,671,646 6,096,476 12.8 21.7 15.0 31.2 9.7South. . . . . . . . . . . . . . . . 64,931,795 9,316,232 14.3 74,066,441 9,941,610 13.4 20.1 15.2 32.5 14.0West . . . . . . . . . . . . . . . . 39,609,977 5,880,963 14.8 45,878,548 5,723,515 12.5 20.9 15.3 33.4 12.1
State
Alabama . . . . . . . . . . . . . 3,078,549 434,787 14.1 3,310,446 447,397 13.5 19.0 16.7 32.9 13.5Alaska . . . . . . . . . . . . . . . 368,403 68,252 18.5 419,320 71,552 17.1 8.5 8.6 41.2 21.4Arizona . . . . . . . . . . . . . . 2,760,050 464,023 16.8 3,747,180 562,916 15.0 23.5 17.4 30.7 11.8Arkansas . . . . . . . . . . . . . 1,789,273 265,055 14.8 1,987,107 281,714 14.2 21.4 15.7 32.0 11.9California . . . . . . . . . . . . . 22,516,192 3,001,905 13.3 24,501,941 2,569,340 10.5 22.5 15.7 32.4 10.8Colorado . . . . . . . . . . . . . 2,480,094 409,932 16.5 3,177,044 446,385 14.1 16.6 13.7 36.3 15.1Connecticut . . . . . . . . . . . 2,600,983 373,933 14.4 2,557,792 310,069 12.1 26.2 16.1 29.6 6.8Delaware . . . . . . . . . . . . . 513,564 80,909 15.8 585,855 84,289 14.4 20.1 15.7 31.7 11.8District of Columbia . . . . . 497,090 57,874 11.6 454,454 44,484 9.8 24.1 16.6 29.5 11.1Florida . . . . . . . . . . . . . . . 10,275,382 1,719,129 16.7 12,283,486 1,875,597 15.3 27.8 17.8 28.0 10.7
Georgia . . . . . . . . . . . . . . 4,865,246 693,225 14.2 5,954,362 768,675 12.9 14.6 13.0 34.4 17.3Hawaii . . . . . . . . . . . . . . . 801,517 119,256 14.9 878,220 120,587 13.7 18.7 15.0 34.5 15.2Idaho . . . . . . . . . . . . . . . . 724,306 116,609 16.1 920,973 136,584 14.8 20.0 14.4 32.3 14.9Illinois . . . . . . . . . . . . . . . 8,759,325 1,162,158 13.3 9,158,208 1,003,572 11.0 23.0 15.0 30.1 9.7Indiana. . . . . . . . . . . . . . . 4,239,391 623,098 14.7 4,504,723 590,476 13.1 20.1 14.5 31.3 10.0Iowa. . . . . . . . . . . . . . . . . 2,129,083 310,122 14.6 2,192,132 292,020 13.3 23.0 16.3 31.4 9.0Kansas . . . . . . . . . . . . . . 1,854,980 280,806 15.1 1,962,154 267,452 13.6 22.1 14.6 32.6 12.4Kentucky . . . . . . . . . . . . . 2,808,878 380,610 13.6 3,028,902 380,618 12.6 19.6 14.9 32.6 11.9Louisiana . . . . . . . . . . . . . 3,086,591 404,186 13.1 3,232,426 392,486 12.1 20.4 14.5 32.2 13.7Maine. . . . . . . . . . . . . . . . 940,466 159,333 16.9 969,780 154,590 15.9 20.9 16.1 33.1 9.3
Maryland . . . . . . . . . . . . . 3,689,812 558,613 15.1 3,910,942 524,230 13.4 18.8 13.8 32.1 14.0Massachusetts. . . . . . . . . 4,793,859 656,850 13.7 4,847,708 558,933 11.5 26.8 16.6 28.4 7.1Michigan . . . . . . . . . . . . . 7,088,397 1,005,699 14.2 7,341,880 913,573 12.4 21.6 14.5 31.4 9.0Minnesota . . . . . . . . . . . . 3,317,776 489,498 14.8 3,630,355 464,968 12.8 20.7 15.2 32.8 8.3Mississippi . . . . . . . . . . . . 1,892,443 237,977 12.6 2,054,721 249,431 12.1 19.9 16.1 31.0 14.8Missouri . . . . . . . . . . . . . . 3,920,715 613,859 15.7 4,153,926 592,271 14.3 21.2 15.7 31.6 10.3Montana . . . . . . . . . . . . . 594,845 102,536 17.2 668,651 108,476 16.2 20.7 14.9 34.2 10.7Nebraska . . . . . . . . . . . . . 1,179,872 177,852 15.1 1,253,717 173,189 13.8 20.7 16.3 32.3 12.6Nevada . . . . . . . . . . . . . . 925,692 182,084 19.7 1,480,440 238,128 16.1 18.1 16.8 34.8 12.2New Hampshire . . . . . . . . 854,028 141,617 16.6 926,066 139,038 15.0 19.8 15.4 33.6 9.2
New Jersey . . . . . . . . . . . 6,105,807 817,409 13.4 6,321,650 672,217 10.6 26.9 16.6 28.1 6.7New Mexico. . . . . . . . . . . 1,098,172 178,022 16.2 1,300,288 190,718 14.7 19.8 15.9 34.7 12.8New York . . . . . . . . . . . . . 14,151,119 1,707,476 12.1 14,278,716 1,361,164 9.5 25.7 16.0 27.7 7.6North Carolina . . . . . . . . . 5,084,798 719,458 14.1 5,997,177 792,646 13.2 18.2 14.6 32.3 14.9North Dakota . . . . . . . . . . 470,571 64,772 13.8 474,210 61,365 12.9 19.8 14.8 32.7 12.7Ohio. . . . . . . . . . . . . . . . . 8,331,105 1,259,535 15.1 8,458,130 1,144,007 13.5 22.1 14.5 30.7 9.6Oklahoma . . . . . . . . . . . . 2,369,564 377,148 15.9 2,536,569 376,062 14.8 20.2 15.4 34.6 12.9Oregon . . . . . . . . . . . . . . 2,188,212 384,189 17.6 2,574,798 388,990 15.1 22.1 14.4 33.9 9.4Pennsylvania . . . . . . . . . . 9,374,206 1,450,037 15.5 9,354,471 1,280,788 13.7 26.3 16.0 28.7 7.5Rhode Island . . . . . . . . . . 794,112 118,330 14.9 797,047 102,494 12.9 26.9 16.4 29.6 7.8
South Carolina. . . . . . . . . 2,604,958 381,691 14.7 2,967,197 420,971 14.2 17.4 14.9 34.1 15.2South Dakota. . . . . . . . . . 510,794 76,923 15.1 548,771 79,370 14.5 20.3 17.4 31.3 12.4Tennessee . . . . . . . . . . . . 3,772,465 531,723 14.1 4,274,395 560,141 13.1 18.0 14.6 33.9 12.5Texas. . . . . . . . . . . . . . . . 12,525,484 1,726,617 13.8 14,871,550 1,754,809 11.8 18.6 14.3 34.6 15.0Utah. . . . . . . . . . . . . . . . . 1,146,986 146,630 12.8 1,510,842 161,351 10.7 22.1 15.4 31.7 13.2Vermont . . . . . . . . . . . . . . 433,871 64,814 14.9 460,487 62,809 13.6 20.3 15.4 32.2 8.2Virginia . . . . . . . . . . . . . . 4,674,603 733,092 15.7 5,211,916 786,359 15.1 15.9 13.6 35.4 20.3Washington . . . . . . . . . . . 3,677,089 653,068 17.8 4,336,464 670,628 15.5 18.2 13.7 35.9 14.0West Virginia . . . . . . . . . . 1,403,095 210,941 15.0 1,404,936 201,701 14.4 22.0 16.2 32.5 9.3Wisconsin . . . . . . . . . . . . 3,728,111 532,936 14.3 3,993,440 514,213 12.9 21.4 15.1 30.6 9.0Wyoming . . . . . . . . . . . . . 328,419 54,457 16.6 362,387 57,860 16.0 18.0 13.9 36.2 14.4
Puerto Rico . . . . . . . . . . . 2,491,952 138,150 5.5 2,714,765 146,001 5.4 15.1 26.8 26.8 10.1
*1990 data includes veterans aged 16 and older.**Gulf war veterans include those who served on active duty in August 1990 or later.
Source: U.S. Census Bureau, Census 2000 Summary File 3.

6 U.S. Census Bureau
15
.5 t
o 1
7.1
14
.0 t
o 1
5.4
12
.7 t
o 1
3.9
5.4
to 1
2.6
Th
e Vet
eran
Pop
ula
tion
: 2
00
0
Sourc
e: U
.S. C
ensu
s Bu
reau
, C
ensu
s 2
00
0 S
um
mar
yFi
le 3
. A
mer
ican
Fac
tfin
der
at
fact
finder
.cen
sus.
gov
pro
vides
cen
sus
dat
a an
d m
appin
g t
ools
.
Perc
ent
of
peo
ple
,1
8 y
ears
an
dover
, w
ho a
revet
eran
s b
y s
tate
18
.0 t
o 3
9.1
15
.0 t
o 1
7.9
12
.7 t
o 1
4.9
8.5
to 1
2.6
Less
than
8.5
U.S
. per
cent
12
.7
U.S
. per
cent
12
.7
(Dat
a bas
ed o
n s
ample
. F
or
info
rmat
ion o
n c
onfi
den
tial
ity
pro
tect
ion,
sam
plin
g e
rror, n
onsa
mplin
g e
rror, a
nd d
efin
itio
ns,
see
ww
w.c
ensu
s.gov
/pro
d/c
en2
00
0/d
oc/s
f3.p
df.
)
Figure
4.
01
00
Mile
s0
10
0 M
iles
01
00
Mile
s
01
00
Mile
s
Perc
ent
of
peo
ple
,1
8 y
ears
an
dover
, w
ho a
revet
eran
s b
y c
ou
nty

the highest percentage of veterans,17.1 percent (see Table 2).Veterans accounted for about 16.2 percent of the adult popula-tion in Montana, followed byNevada, Wyoming, and Maine.10
New York state (9.5 percent) andthe District of Columbia (9.8 per-cent) had the lowest percentagesof veterans in their populations.11
Even though the number of veter-ans fell nationwide between 1990and 2000, some states sawincreases. The state with the mostrapidly growing veteran populationwas Nevada, the state with thefastest growing total population.In Nevada, veterans increased by30.8 percent, from 182,000 to238,000. Increases of 10 percentor more were recorded in veteranpopulations in Arizona, Idaho,Georgia, South Carolina, NorthCarolina, and Utah.
Twenty-five states and the Districtof Columbia recorded declines in
their veteran populations duringthe 1990s. Among the states, NewYork had the largest decline — 20.3 percent. The 23.1 percentdecline in the veteran populationin the District of Columbia was notstatistically different from declinesin New York, New Jersey, orConnecticut.
The percentage of the civilian pop-ulation 18 and over who were vet-erans fell in every state and theDistrict of Columbia. Nevada, thestate with the largest percentincrease in the number of veterans,was also the state with the largestdecline in veterans as a percent ofthe total population 18 and over.Because of rapid growth of nonvet-erans in Nevada, the veteran popu-lation dropped from 19.7 percentof all civilian Nevadans 18 andolder to 16.1 percent, a 3.6 per-centage-point decline.
The proportion of veterans fell by2 percentage points or more inalmost half of the states in theNortheast and the West. In theMidwest, most states fell by atleast 1 percentage point, but lessthan 2 percentage points. States in
the South experienced the leastdecline. The decline in Texas andthe District of Columbia was about2 percentage points, but it wasless than 1 percentage point inmany other Southern states.
Rural and nonmetropolitancounties had the highestconcentrations of veterans.
Figure 4 shows the percentage ofveterans in 2000 for each county inthe United States. The highest con-centrations of veterans were foundin many Florida counties, numerouscounties of the upper Great Lakesareas, various western counties withlow populations excluding Californiaand Utah, and in scattered countiesalong the East Coast, all containingor near military bases. In general,Census 2000 found the highest con-centrations of veterans in rural andnonmetropolitan counties. Floridawas an exception, probably becauseof retiree migration. The lowestconcentrations of veterans werefound in the counties of the lowerMississippi River valley, manyAppalachian counties, and severalcounties in the Rio Grande valley ofsouthern Texas.
Hampton, Virginia, had thegreatest concentration ofveterans of any place of100,000 or more in the UnitedStates.12
Among places of 100,000 or more,Hampton, Virginia, near thecountry’s largest naval station, hadthe greatest concentration of veter-ans in 2000, 27.1 percent (seeTable 3). It was followed byClarksville, Tennessee (24.4 per-cent), and Fayetteville, NorthCarolina (23.7 percent) — whose
U.S. Census Bureau 7
10 The percentage of veterans in the pop-ulation was not statistically different inMontana, Nevada, Wyoming, and Maine.
11 The percentage of veterans in the pop-ulation was not statistically different in NewYork and the District of Columbia.
12 Census 2000 shows 245 places in theUnited States with 100,000 or more popula-tion. They include 238 incorporated places(including four city-county consolidations)and seven census designated places that arenot legally incorporated. For a list of theseplaces by state, see www.census.gov/popula-tion/www/cen2000/phc-t6.html.
Table 3.Ten Places of 100,000 or More With the HighestPercentage of Veterans in the Civilian PopulationAged 18 and Over: 2000(Data based on sample. For information on confidentiality protection, sampling error,nonsampling error, and definitions, see www.census.gov/prod/cen2000/doc/sf3.pdf)
Place Number ofveterans
Percent ofveterans
90-percentconfidence
interval
Hampton, VA . . . . . . . . . . . . . . . . . . . . 28,312 27.1 26.5 - 27.8Clarksville, TN . . . . . . . . . . . . . . . . . . . 15,319 24.4 23.7 - 25.1Fayetteville, NC . . . . . . . . . . . . . . . . . . 19,060 23.7 23.0 - 24.4Virginia Beach, VA . . . . . . . . . . . . . . . 60,260 21.7 21.4 - 22.1Colorado Springs, CO . . . . . . . . . . . . 51,609 20.2 19.9 - 20.6Norfolk, VA . . . . . . . . . . . . . . . . . . . . . . 30,068 19.9 19.5 - 20.4Newport News, VA . . . . . . . . . . . . . . . 24,021 19.9 19.4 - 20.4Columbus, GA* . . . . . . . . . . . . . . . . . . 24,984 19.6 19.1 - 20.1Chesapeake, VA . . . . . . . . . . . . . . . . . 25,621 18.9 18.4 - 19.4Portsmouth, VA . . . . . . . . . . . . . . . . . . 12,955 18.4 17.8 - 19.1
*Columbus city is consolidated with Muscogee County.
Note: Because of sampling error, the estimates in this table may not be significantly different fromone another or from other places not listed in this table.
Source: U.S. Census Bureau, Census 2000 Summary File 3.
percentages were not statisticallydifferent. Six of the 10 places withthe highest concentrations of vet-erans were in Virginia. With theexception of Colorado Springs,Colorado, home of the Air ForceAcademy, all of the places with thehighest concentrations were locat-ed in the Southern region of theUnited States.
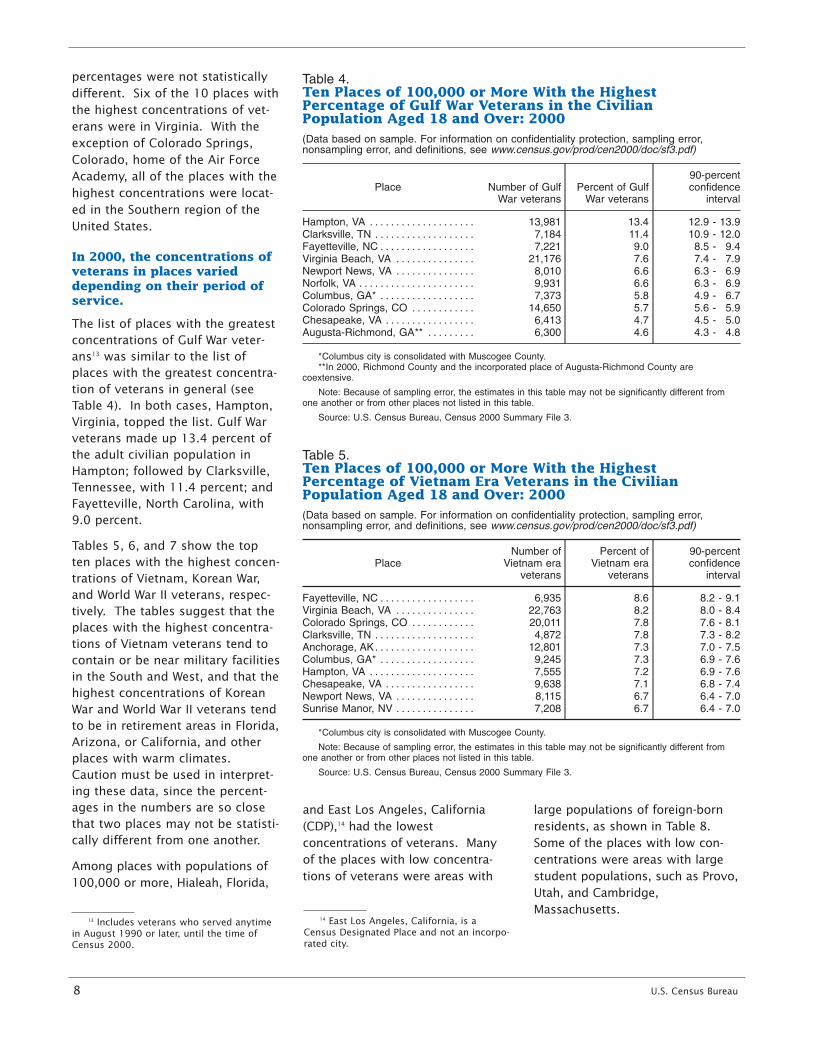
In 2000, the concentrations ofveterans in places varieddepending on their period ofservice.
The list of places with the greatestconcentrations of Gulf War veter-ans13 was similar to the list ofplaces with the greatest concentra-tion of veterans in general (seeTable 4). In both cases, Hampton,Virginia, topped the list. Gulf Warveterans made up 13.4 percent ofthe adult civilian population inHampton; followed by Clarksville,Tennessee, with 11.4 percent; andFayetteville, North Carolina, with9.0 percent.
Tables 5, 6, and 7 show the topten places with the highest concen-trations of Vietnam, Korean War,and World War II veterans, respec-tively. The tables suggest that theplaces with the highest concentra-tions of Vietnam veterans tend tocontain or be near military facilitiesin the South and West, and that thehighest concentrations of KoreanWar and World War II veterans tendto be in retirement areas in Florida,Arizona, or California, and otherplaces with warm climates.Caution must be used in interpret-ing these data, since the percent-ages in the numbers are so closethat two places may not be statisti-cally different from one another.
Among places with populations of100,000 or more, Hialeah, Florida,
and East Los Angeles, California(CDP),14 had the lowestconcentrations of veterans. Manyof the places with low concentra-tions of veterans were areas with
large populations of foreign-bornresidents, as shown in Table 8.Some of the places with low con-centrations were areas with largestudent populations, such as Provo,Utah, and Cambridge,Massachusetts.
8 U.S. Census Bureau
Table 4.Ten Places of 100,000 or More With the HighestPercentage of Gulf War Veterans in the CivilianPopulation Aged 18 and Over: 2000(Data based on sample. For information on confidentiality protection, sampling error,nonsampling error, and definitions, see www.census.gov/prod/cen2000/doc/sf3.pdf)
Place Number of GulfWar veterans
Percent of GulfWar veterans
90-percentconfidence
interval
Hampton, VA . . . . . . . . . . . . . . . . . . . . 13,981 13.4 12.9 - 13.9Clarksville, TN . . . . . . . . . . . . . . . . . . . 7,184 11.4 10.9 - 12.0Fayetteville, NC . . . . . . . . . . . . . . . . . . 7,221 9.0 8.5 - 9.4Virginia Beach, VA . . . . . . . . . . . . . . . 21,176 7.6 7.4 - 7.9Newport News, VA . . . . . . . . . . . . . . . 8,010 6.6 6.3 - 6.9Norfolk, VA . . . . . . . . . . . . . . . . . . . . . . 9,931 6.6 6.3 - 6.9Columbus, GA* . . . . . . . . . . . . . . . . . . 7,373 5.8 4.9 - 6.7Colorado Springs, CO . . . . . . . . . . . . 14,650 5.7 5.6 - 5.9Chesapeake, VA . . . . . . . . . . . . . . . . . 6,413 4.7 4.5 - 5.0Augusta-Richmond, GA** . . . . . . . . . 6,300 4.6 4.3 - 4.8
*Columbus city is consolidated with Muscogee County.**In 2000, Richmond County and the incorporated place of Augusta-Richmond County are
coextensive.
Note: Because of sampling error, the estimates in this table may not be significantly different fromone another or from other places not listed in this table.
Source: U.S. Census Bureau, Census 2000 Summary File 3.
Table 5.Ten Places of 100,000 or More With the HighestPercentage of Vietnam Era Veterans in the CivilianPopulation Aged 18 and Over: 2000(Data based on sample. For information on confidentiality protection, sampling error,nonsampling error, and definitions, see www.census.gov/prod/cen2000/doc/sf3.pdf)
PlaceNumber of
Vietnam eraveterans
Percent ofVietnam era
veterans
90-percentconfidence
interval
Fayetteville, NC . . . . . . . . . . . . . . . . . . 6,935 8.6 8.2 - 9.1Virginia Beach, VA . . . . . . . . . . . . . . . 22,763 8.2 8.0 - 8.4Colorado Springs, CO . . . . . . . . . . . . 20,011 7.8 7.6 - 8.1Clarksville, TN . . . . . . . . . . . . . . . . . . . 4,872 7.8 7.3 - 8.2Anchorage, AK. . . . . . . . . . . . . . . . . . . 12,801 7.3 7.0 - 7.5Columbus, GA* . . . . . . . . . . . . . . . . . . 9,245 7.3 6.9 - 7.6Hampton, VA . . . . . . . . . . . . . . . . . . . . 7,555 7.2 6.9 - 7.6Chesapeake, VA . . . . . . . . . . . . . . . . . 9,638 7.1 6.8 - 7.4Newport News, VA . . . . . . . . . . . . . . . 8,115 6.7 6.4 - 7.0Sunrise Manor, NV . . . . . . . . . . . . . . . 7,208 6.7 6.4 - 7.0
*Columbus city is consolidated with Muscogee County.
Note: Because of sampling error, the estimates in this table may not be significantly different fromone another or from other places not listed in this table.
Source: U.S. Census Bureau, Census 2000 Summary File 3.
13 Includes veterans who served anytimein August 1990 or later, until the time ofCensus 2000.
14 East Los Angeles, California, is aCensus Designated Place and not an incorpo-rated city.

ADDITIONAL FINDINGS
What was the racial and ethnicmakeup of veterans in 2000?
Census 2000 allowed respondentsto choose more than one race.With the exception of the Two ormore races group, all race groupsdiscussed in this report refer topeople who indicated only oneracial identity among the six major
categories: White, Black or AfricanAmerican, American Indian andAlaska Native, Asian, NativeHawaiian or Other Pacific Islander,and Some other race.15 The use of
the single-race population in thisreport does not imply that it is thepreferred method of presenting oranalyzing data. The CensusBureau uses a variety of approach-es.16
Table 9 shows that, in 2000, 82.9 percent of veterans and 72.3 percent of the total civilianpopulation 18 and older wereWhite (and no other race), not ofHispanic origin.17 The next largestpopulation of veterans was in thesingle-race group of Black orAfrican American, representing 9.7 percent of the veteran popula-tion. Slightly more than 11.0 per-cent of the general population wasBlack or African American.Hispanics accounted for 4.3 per-cent of the veteran population and11.0 percent of the general popula-tion, and the single-race Asianpopulation composed 1.1 percentof veterans and 3.7 percent of thegeneral population. The smallestpercentages of the veteranpopulation were the single-racegroups of American Indian andAlaska Natives, at 0.7 percent,
U.S. Census Bureau 9
Table 6.Ten Places of 100,000 or More With the HighestPercentage of Korean War Veterans in the CivilianPopulation Aged 18 and Over: 2000(Data based on sample. For information on confidentiality protection, sampling error,nonsampling error, and definitions, see www.census.gov/prod/cen2000/doc/sf3.pdf)
PlaceNumber of
Korean Warveterans
Percent ofKorean War
veterans
90-percentconfidence
interval
Cape Coral, FL . . . . . . . . . . . . . . . . . . 2,617 3.3 3.0 - 3.6Fayetteville, NC . . . . . . . . . . . . . . . . . . 2,499 3.1 2.8 - 3.4Columbus, GA* . . . . . . . . . . . . . . . . . . 3,773 3.0 2.8 - 3.2Huntsville, AL . . . . . . . . . . . . . . . . . . . . 3,595 3.0 2.8 - 3.2Scottsdale, AZ . . . . . . . . . . . . . . . . . . . 4,685 2.9 2.7 - 3.0Henderson, NV . . . . . . . . . . . . . . . . . . 3,760 2.9 2.7 - 3.1Clearwater, FL . . . . . . . . . . . . . . . . . . . 2,470 2.8 2.6 - 3.1Oceanside, CA. . . . . . . . . . . . . . . . . . . 3,145 2.8 2.6 - 3.0Pueblo, CO. . . . . . . . . . . . . . . . . . . . . . 2,133 2.8 2.6 - 3.0Las Vegas, NV. . . . . . . . . . . . . . . . . . . 9,480 2.7 2.6 - 2.8
*Columbus city is consolidated with Muscogee County.
Note: Because of sampling error, the estimates in this table may not be significantly different fromone another or from other places not listed in this table.
Source: U.S. Census Bureau, Census 2000 Summary File 3.
Table 7.Ten Places of 100,000 or More With the HighestPercentage of World War II Veterans in the CivilianPopulation Aged 18 and Over: 2000(Data based on sample. For information on confidentiality protection, sampling error,nonsampling error, and definitions, see www.census.gov/prod/cen2000/doc/sf3.pdf)
PlaceNumber of
World War IIveterans
Percent ofWorld War II
veterans
90-percentconfidence
interval
Clearwater, FL . . . . . . . . . . . . . . . . . . . 4,744 5.4 5.1 - 5.8Cape Coral, FL . . . . . . . . . . . . . . . . . . 4,013 5.1 4.7 - 5.4Oceanside, CA. . . . . . . . . . . . . . . . . . . 5,036 4.5 4.2 - 4.7Pueblo, CO. . . . . . . . . . . . . . . . . . . . . . 3,201 4.2 3.9 - 4.5Scottsdale, AZ . . . . . . . . . . . . . . . . . . . 6,604 4.0 3.8 - 4.2Metairie, LA . . . . . . . . . . . . . . . . . . . . . 4,620 4.0 3.8 - 4.2St. Petersburg, FL . . . . . . . . . . . . . . . . 7,710 4.0 3.8 - 4.2Santa Rosa, CA. . . . . . . . . . . . . . . . . . 4,282 3.8 3.6 - 4.1Mesa, AZ. . . . . . . . . . . . . . . . . . . . . . . . 10,983 3.8 3.7 - 4.0Independence, MO . . . . . . . . . . . . . . . 3,201 3.7 3.5 - 4.0
Note: Because of sampling error, the estimates in this table may not be significantly different fromone another or from other places not listed in this table.
Source: U.S. Census Bureau, Census 2000 Summary File 3.
15 For further information on each of thesix major race groups and the Two or moreraces population, see reports from the Census2000 Brief series (C2KBR/01), available on theCensus 2000 Web site at www/census.gov/population/www/cen2000/briefs.html.
16 This report draws heavily on SummaryFile 3, a Census 2000 product that can beaccessed through American FactFinder, avail-able from the Census Bureau’s Web site,www.census.gov. Information on peoplewho reported more than one race, such as“White and American Indian and AlaskaNative” or “Asian and Black or AfricanAmerican,” is forthcoming in Summary File4, which will also be available throughAmerican FactFinder in 2003. About 2.6percent of people reported more than onerace.
17 Hereafter this report uses the termBlack to refer to people who are Black orAfrican American, the term Pacific Islander torefer to people who are Native Hawaiian andOther Pacific Islander, and the term Hispanicto refer to people who are Hispanic orLatino.
Because Hispanics may be of any race,data in this report for Hispanics overlap withdata for racial groups. Based on Census2000 sample data, the proportion Hispanicwas 8.0 percent for Whites, 1.9 percent forBlacks, 14.6 percent for American Indiansand Alaska Natives, 1.0 percent for Asians,9.5 percent for Pacific Islanders, 97.1 per-cent for those reporting Some other race,and 31.1 percent for those reporting Two ormore races.

followed by Native Hawaiian andOther Pacific Islander, at 0.1 per-cent. These groups represented0.8 percent and 0.1 percent of thegeneral population, respectively.
The above proportions changesomewhat when the population isdivided into younger veterans andolder veterans, as shown in Table 9. The non-Hispanic Whitegroup makes up 78.9 percent ofyounger veterans, but 89.9 percentof veterans 65 and older. TheBlack and Hispanic groups aremore concentrated among veteransaged 18 to 64 (12.1 percent and5.4 percent, respectively) thanamong veterans 65 and older (5.7 percent and 2.4 percent,respectively).
ABOUT CENSUS 2000
Why Census 2000 AskedAbout Veteran Status
Veteran status, including period ofmilitary service, is used primarilyby the Department of VeteransAffairs to measure the needs ofveterans and to evaluate theimpact of veteran benefits pro-grams dealing with health care,education and employment, anddisability and retirement. Thesedata are needed to conduct policyanalysis, program planning, andbudgeting, for federal veterans’programs, and for reports toCongress on veterans’ facilities andservices. Based on data about vet-erans, local agencies develophealth care and other services forelderly veterans under the OlderAmericans Act.
Accuracy of the Estimates
The data contained in this reportare based on the sample of house-holds who responded to theCensus 2000 long form.Nationally, approximately 1 out ofevery 6 housing units was included
in this sample. As a result, thesample estimates may differ some-what from the100-percent figuresthat would have been obtained ifall housing units, people withinthose housing units, and peopleliving in group quarters had beenenumerated using the samequestionnaires, instructions,enumerators, and so forth. The
sample estimates also differ fromthe values that would have beenobtained from different samples ofhousing units, people within thosehousing units, and people living ingroup quarters. The deviation of asample estimate from the averageof all possible samples is called thesampling error.
10 U.S. Census Bureau
Table 8.Ten Places of 100,000 or More With the LowestPercentage of Veterans in the Civilian PopulationAged 18 and Over: 2000(Data based on sample. For information on confidentiality protection, sampling error,nonsampling error, and definitions, see www.census.gov/prod/cen2000/doc/sf3.pdf)
Place Number ofveterans
Percent ofveterans
90-percentinterval
Hialeah, FL . . . . . . . . . . . . . . . . . . . . . . 28,312 2.1 1.9 - 2.2East Los Angeles, CA, CDP* . . . . . . 15,319 3.3 3.0 - 3.6Miami, FL . . . . . . . . . . . . . . . . . . . . . . . 19,060 4.2 4.0 - 4.3Santa Ana, CA . . . . . . . . . . . . . . . . . . . 60,260 4.2 4.0 - 4.4Provo, UT . . . . . . . . . . . . . . . . . . . . . . . 51,609 4.4 4.1 - 4.7El Monte, CA . . . . . . . . . . . . . . . . . . . . 30,068 4.5 4.2 - 4.9Cambridge, MA . . . . . . . . . . . . . . . . . . 24,021 4.9 4.6 - 5.3Paterson, NJ. . . . . . . . . . . . . . . . . . . . . 24,984 5.0 4.7 - 5.2Elizabeth, NJ . . . . . . . . . . . . . . . . . . . . 25,621 5.1 4.8 - 5.4Laredo, TX . . . . . . . . . . . . . . . . . . . . . . 12,955 5.7 5.4 - 6.0
*East Los Angeles is a Census Designated Place (CDP) and not an incorporated city.
Note: Because of sampling error, the estimates in this table may not be significantly different fromone another or from other places not listed in this table.
Source: U.S. Census Bureau, Census 2000 Summary File 3.
Table 9.Percentage of Adults by Veterans Status, Race andHispanic Origin and Age: 2000(Data based on sample. For information on confidentiality protection, sampling error,nonsampling error, and definitions, see www.census.gov/prod/cen2000/doc/sf3.pdf)
Characteristics Totalpopulation
Veterans
Total18 to 64
years65 yearsand over
Total population 18 yearsand over. . . . . . . . . . . . . . . . . . . 208,130,352 26,403,703 16,740,194 9,663,506
White alone. . . . . . . . . . . . . . . . . . . . . . 77.7 85.5 81.9 91.7Black or African American alone. . . . 11.3 9.7 12.1 5.7American Indian and Alaska Nativealone . . . . . . . . . . . . . . . . . . . . . . . . . . 0.8 0.7 1.0 0.4
Asian alone. . . . . . . . . . . . . . . . . . . . . . 3.7 1.1 1.2 0.9Native Hawaiian and Other PacificIslander alone . . . . . . . . . . . . . . . . . . 0.1 0.1 0.1 0.0
Some other race alone. . . . . . . . . . . . 4.8 1.4 1.9 0.5Two or more races . . . . . . . . . . . . . . . 2.1 1.4 1.8 0.8
Hispanic or Latino (of any race) . . . . 11.0 4.3 5.4 2.4
White alone, not Hispanic or Latino. 72.3 82.9 78.9 89.9
Source: U.S. Census Bureau, Census 2000, Summary File 3.

In addition to the variability thatarises from the sampling proce-dures, both sample data and 100- percent data are subject tononsampling error. Nonsamplingerror may be introduced duringany of the various complex opera-tions used to collect and processdata. Such errors may include:not enumerating every householdor every person in the population,failing to obtain all required infor-mation from the respondents,obtaining incorrect or inconsistentinformation, and recording infor-mation incorrectly. In addition,errors can occur during the fieldreview of the enumerators’ work,during clerical handling of the cen-sus questionnaires, or during theelectronic processing of the ques-tionnaires.
Nonsampling error may affect thedata in two ways: (1) errors thatare introduced randomly willincrease the variability of the dataand, therefore, should be reflectedin the standard errors; and (2) errors that tend to be consis-tent in one direction will bias bothsample and 100-percent data inthat direction. For example, ifrespondents consistently tend tounderreport their incomes, thenthe resulting estimates of house-holds or families by incomecategory will tend to be understat-ed for the higher income
categories and overstated for thelower income categories. Suchbiases are not reflected in the stan-dard errors.
While it is impossible to completelyeliminate error from an operationas large and complex as the decen-nial census, the Census Bureauattempts to control the sources ofsuch error during the data collec-tion and processing operations.The primary sources of error andthe programs instituted to controlerror in Census 2000 are describedin detail in Summary File 3Technical Documentation underChapter 8, “Accuracy of the Data,”located at www.census.gov/prod/cen2000/doc/sf3.pdf.
All statements in this Census 2000Brief have undergone statisticaltesting and all comparisons are sig-nificant at the 90-percent confi-dence level, unless otherwise noted.The estimates in tables, maps, andother figures may vary from actualvalues due to sampling and non-sampling errors. As a result, esti-mates in one category may not besignificantly different from esti-mates assigned to a different cate-gory. Further information on theaccuracy of the data is located atwww.census.gov/prod/cen2000/doc/sf3.pdf. For further informa-tion on the computation and use ofstandard errors, contact the
Decennial Statistical StudiesDivision at 301-763-4242.
For More Information
The Census 2000 Summary File 3data are available from theAmerican Factfinder on the Internet(factfinder.census.gov). They werereleased on a state-by-state basisduring 2002. For information onconfidentiality protection, nonsam-pling error, sampling error, anddefinitions, also seewww.census.gov/prod/cen2000/doc/sf3.pdf or contact theCustomer Services Center at 301-763-INFO (4636).
Information on population andhousing topics is presented in theCensus 2000 Brief series, locatedon the Census Bureau’s Web site atwww.census.gov/population/www/cen2000/briefs.html. This seriespresents information on race,Hispanic origin, age, sex, house-hold type, housing tenure, andsocial, economic, and housingcharacteristics, such as ancestry,income, and housing costs.
To find information about the avail-ability of data products, includingreports, CD-ROMs, and DVDs, callthe Customer Services Center at301-763-INFO (4636), or [email protected].
U.S. Census Bureau 11

U.S. Department of CommerceEconomics and Statistics AdministrationU.S. CENSUS BUREAU
Washington, DC 20233
OFFICIAL BUSINESS
Penalty for Private Use $300
FIRST-CLASS MAILPOSTAGE & FEES PAIDU.S. Census Bureau
Permit No. G-58