Embed Size (px)
Citation preview
Veteran Poverty Trends
Prepared by the National Center for Veterans Analysis and Statistics
May 2015
NCVAS National Center for Veterans Analysis and Statistics
• Data for the demographic and socio-economic analyses came from the 2012 American Community Survey (ACS) Public Use Microdata Sample (PUMS). • The ACS is an ongoing survey that provides annual data on the social and economic characteristics of the U.S. population.
• The ACS uses a series of monthly samples to produce annually updated data for the same small areas (census tracts and block groups) formerly surveyed via the decennial census long-form sample.
• ACS data are used to develop statistically valid samples of veterans.
• The universe for this analysis is the civilian population 17 years and older living in the U.S. and Puerto Rico. • The Census Bureau uses dollar value thresholds varying by family size and composition to determine who is in
poverty. We use their definition in this report.
• Comparative statements have undergone statistical testing at the 90% confidence level. A “statistically significant difference” means there is statistical evidence that there is a difference in comparative figures; it does not mean the difference is necessarily large, important or significant in the usual sense of the word. The sample size of Veterans in poverty is small and could result in considerable standard errors, making determination of statistically significant differences between single year groups difficult. Use of 3-year data allows greater confidence in comparing rates among groups.
• Additional Census information is at
http://www.census.gov/acs/www/data_documentation/documentation_main/#doc2012
• ACS data are collected and prepared by the U.S. Bureau of the Census. For more information on ACS go to http://factfinder2.census.gov/
2
Data Sources and Methods
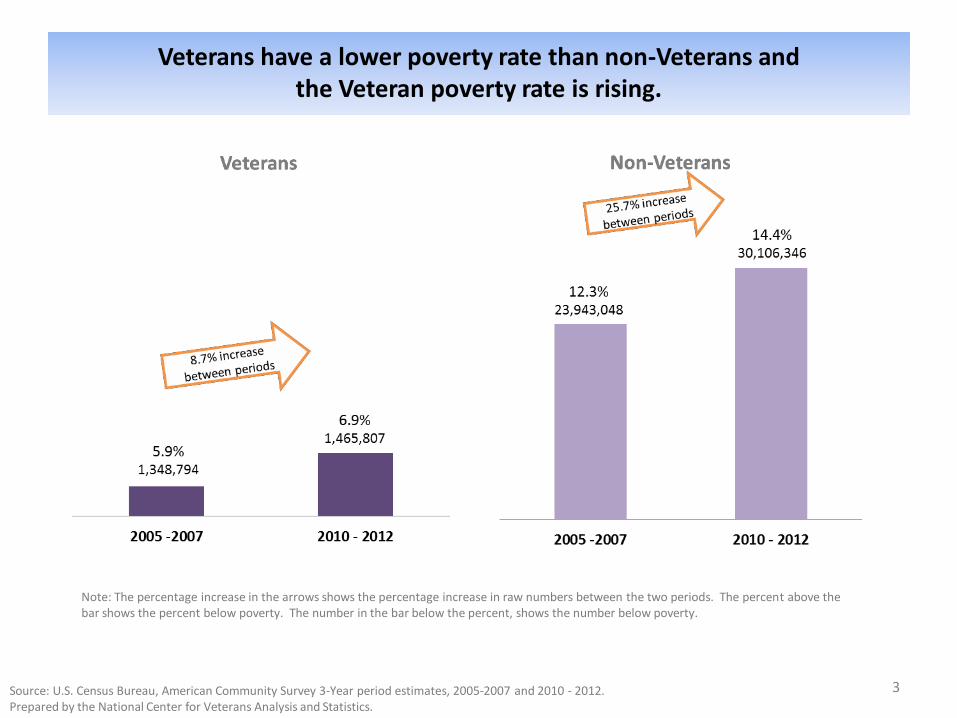
Veterans have a lower poverty rate than non-Veterans and the Veteran poverty rate is rising.
Note: The percentage increase in the arrows shows the percentage increase in raw numbers between the two periods. The percent above the bar shows the percent below poverty. The number in the bar below the percent, shows the number below poverty.
3 Source: U.S. Census Bureau, American Community Survey 3-Year period estimates, 2005-2007 and 2010 - 2012. Prepared by the National Center for Veterans Analysis and Statistics.
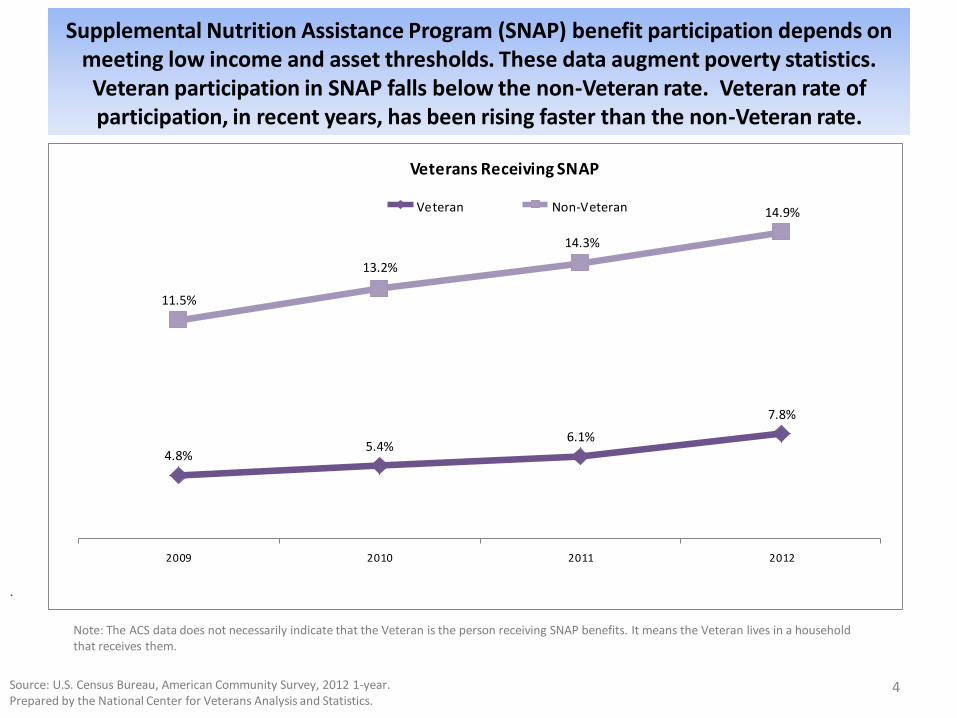
Supplemental Nutrition Assistance Program (SNAP) benefit participation depends on meeting low income and asset thresholds. These data augment poverty statistics. Veteran participation in SNAP falls below the non-Veteran rate. Veteran rate of participation, in recent years, has been rising faster than the non-Veteran rate.
.
Note: The ACS data does not necessarily indicate that the Veteran is the person receiving SNAP benefits. It means the Veteran lives in a household that receives them.
4.8% 5.4%
6.1%
7.8%
14.3%
13.2%
11.5%
14.9%
2009 2010 2011 2012
Veterans Receiving SNAP
Veteran Non-Veteran
Source: U.S. Census Bureau, American Community Survey, 2012 1-year. Prepared by the National Center for Veterans Analysis and Statistics.
4
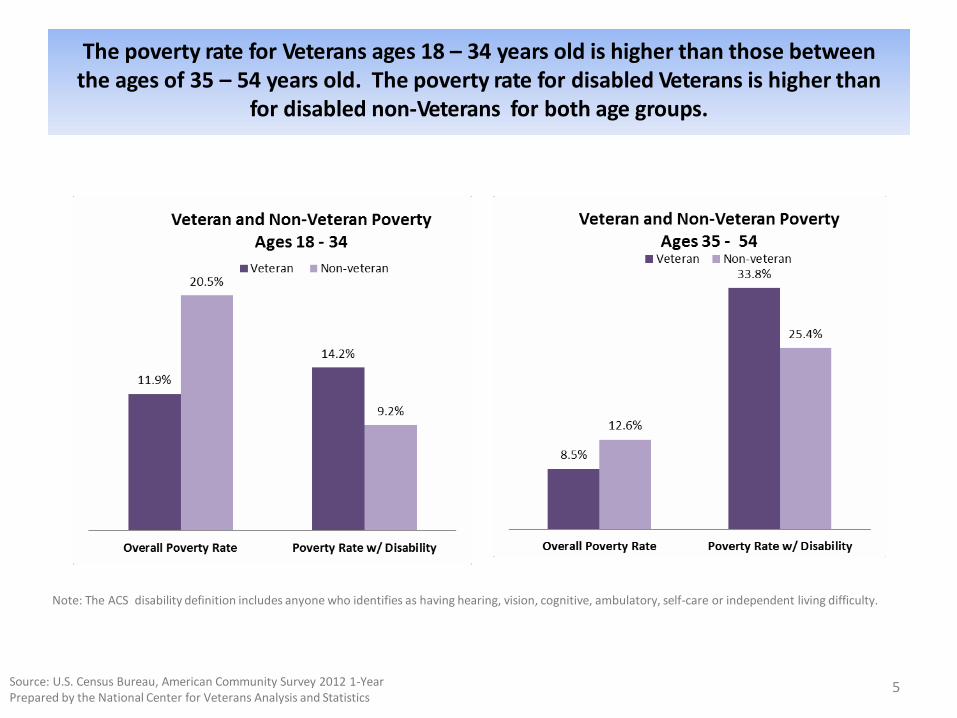
The poverty rate for Veterans ages 18 – 34 years old is higher than those between the ages of 35 – 54 years old. The poverty rate for disabled Veterans is higher than
for disabled non-Veterans for both age groups.
Note: The ACS disability definition includes anyone who identifies as having hearing, vision, cognitive, ambulatory, self-care or independent living difficulty.
Source: U.S. Census Bureau, American Community Survey 2012 1-Year Prepared by the National Center for Veterans Analysis and Statistics
5
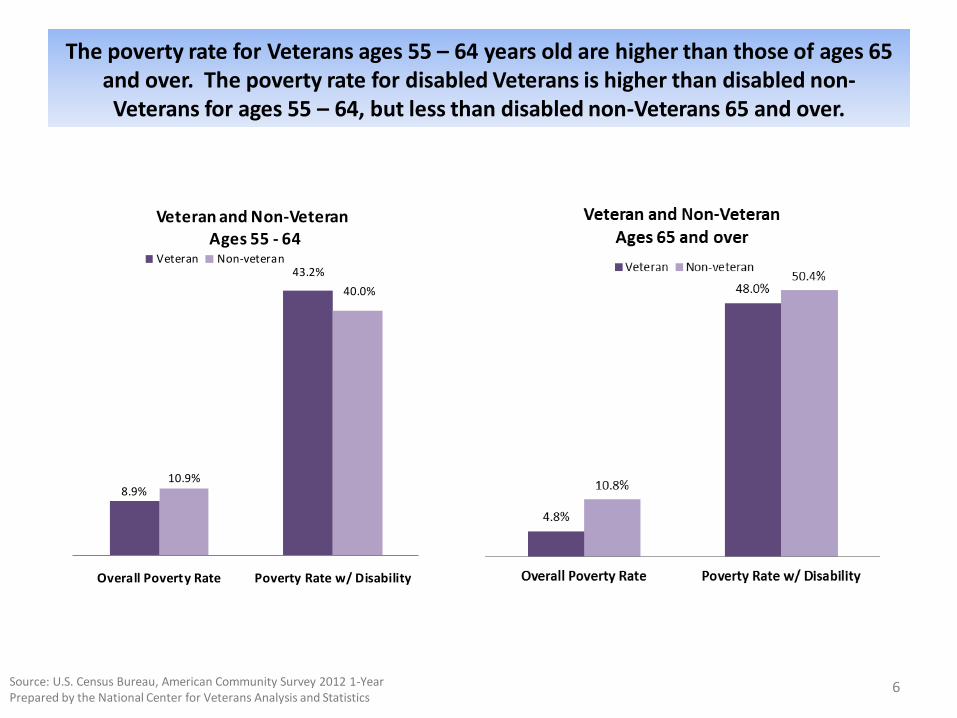
The poverty rate for Veterans ages 55 – 64 years old are higher than those of ages 65 and over. The poverty rate for disabled Veterans is higher than disabled non- Veterans for ages 55 – 64, but less than disabled non-Veterans 65 and over.
10.9% 8.9%
Veteran and Non-Veteran Ages 55 - 64
Veteran Non-veteran 43.2%
40.0%
Overall Poverty Rate Poverty Rate w/ Disability
Source: U.S. Census Bureau, American Community Survey 2012 1-Year Prepared by the National Center for Veterans Analysis and Statistics
6
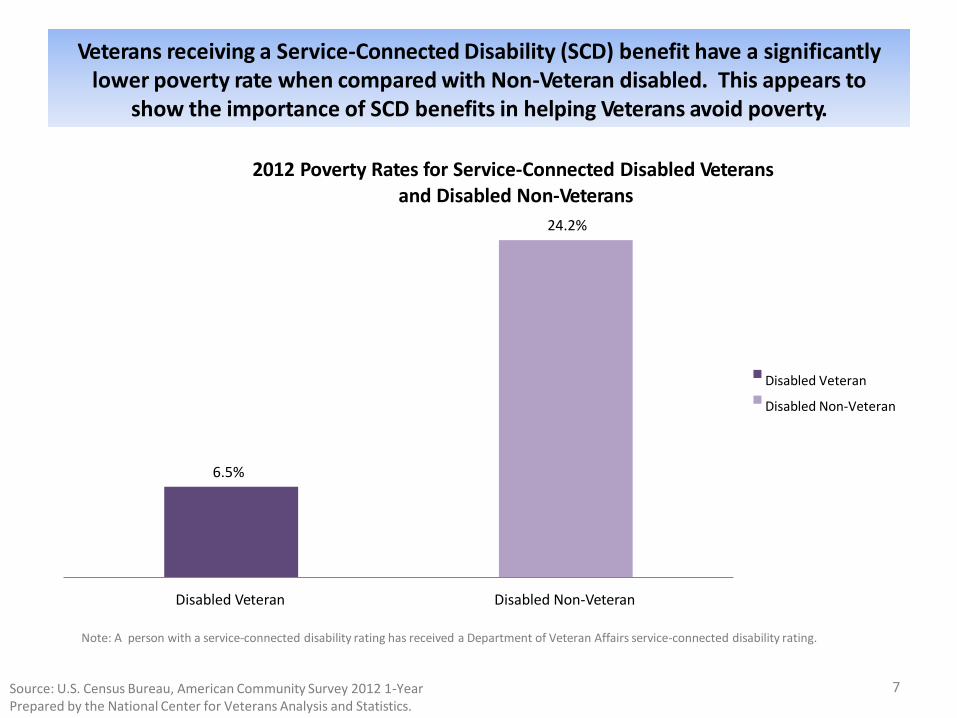
6.5%
2012 Poverty Rates for Service-Connected Disabled Veterans and Disabled Non-Veterans
24.2%
Disabled Veteran Disabled Non-Veteran
Note: A person with a service-connected disability rating has received a Department of Veteran Affairs service-connected disability rating.
7 Source: U.S. Census Bureau, American Community Survey 2012 1-Year Prepared by the National Center for Veterans Analysis and Statistics.
Disabled Veteran
Disabled Non-Veteran
Veterans receiving a Service-Connected Disability (SCD) benefit have a significantly lower poverty rate when compared with Non-Veteran disabled. This appears to
show the importance of SCD benefits in helping Veterans avoid poverty.
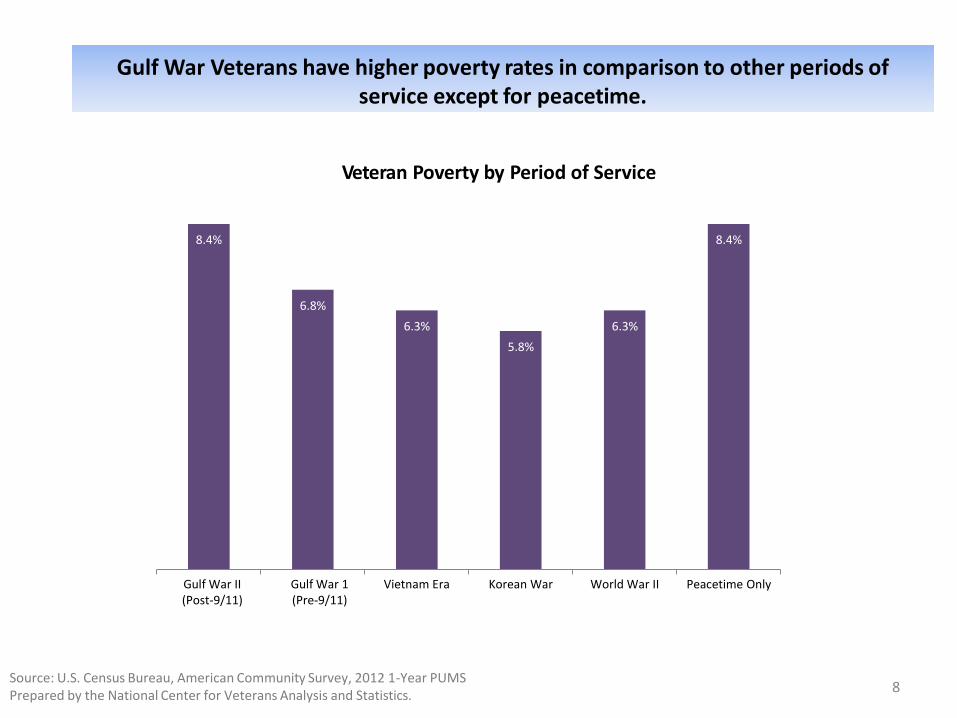
Gulf War Veterans have higher poverty rates in comparison to other periods of service except for peacetime.
8.4%
Source: U.S. Census Bureau, American Community Survey, 2012 1-Year PUMS Prepared by the National Center for Veterans Analysis and Statistics.
8
6.8%
6.3%
5.8%
6.3%
8.4%
Veteran Poverty by Period of Service
Gulf War II (Post-9/11)
Gulf War 1 (Pre-9/11)
Vietnam Era Korean War World War II Peacetime Only
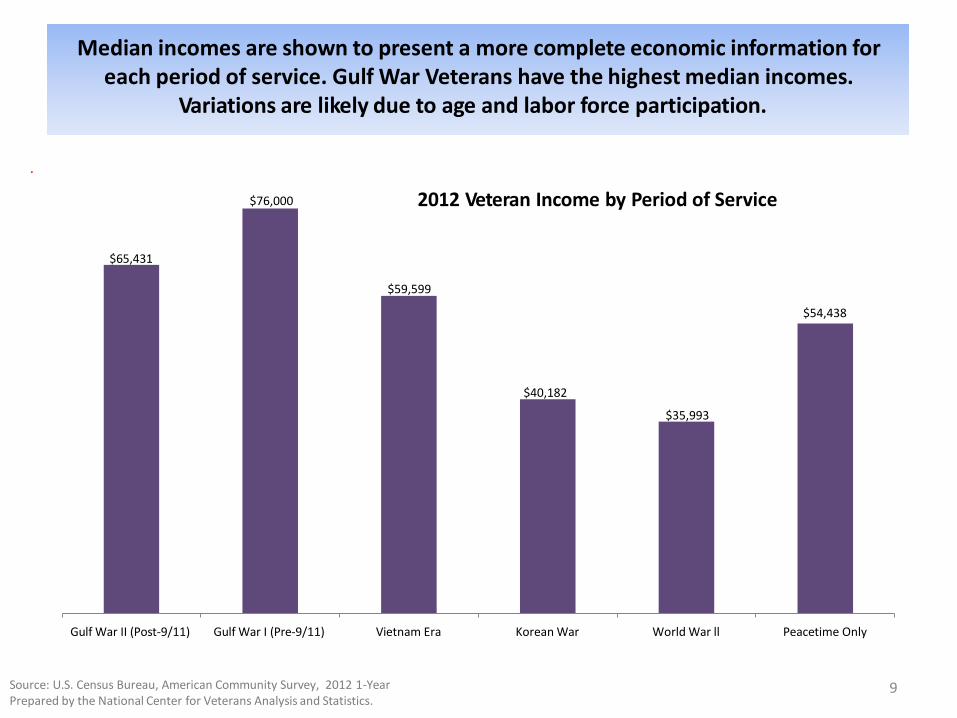
Median incomes are shown to present a more complete economic information for each period of service. Gulf War Veterans have the highest median incomes.
Variations are likely due to age and labor force participation.
$65,431
$59,599
$54,438
Source: U.S. Census Bureau, American Community Survey, 2012 1-Year Prepared by the National Center for Veterans Analysis and Statistics.
9
$76,000
$40,182
$35,993
Gulf War II (Post-9/11) Gulf War I (Pre-9/11) Vietnam Era Korean War World War ll Peacetime Only
2012 Veteran Income by Period of Service
.
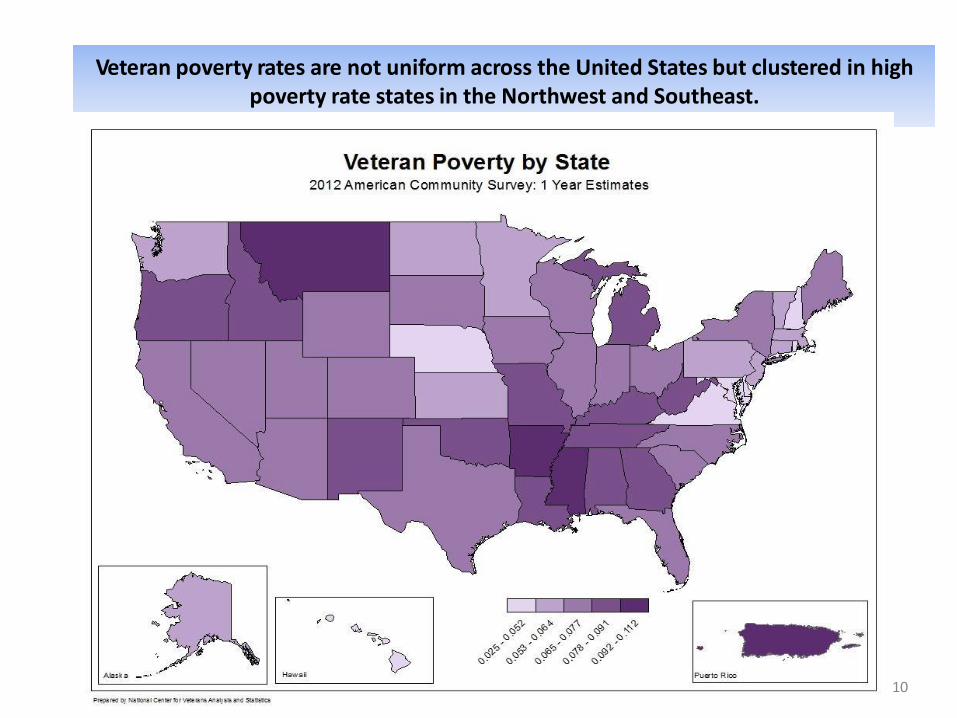
Veteran poverty rates are not uniform across the United States but clustered in high poverty rate states in the Northwest and Southeast.
Source: U.S. Census Bureau, American Community Survey, 2012 1-year Prepared by the National Center for Veterans Analysis and Statistics 1
10
Summary
• Veterans have lower overall rates of poverty than Non-Veterans.
• The Veteran poverty growth rate is less than that of Non-Veterans; however, Veteran poverty is
rising.
• The poverty rate for Veterans between the ages of 18 to 34 are higher than all other age groups.
• Disabled Veterans have higher poverty rates than disabled non-Veterans for all age groups except
over age 65. Veteran poverty trends need monitoring due to higher poverty rates in disabled Veterans.
• The rate of Veterans living in households in receipt of SNAP benefits is lower than that of Non-
Veterans, however, the growth rate of Veterans in SNAP households is increasing sharply.
• Higher rates of poverty in Gulf War Veterans are notable.
• Service-connected disabled Veterans have significantly lower rates of poverty than disabled non-
Veterans.
• Veteran poverty is not uniform across America and is clustered in states located in the Southeast
and Northwest United States.
NCVAS National Center for Veterans Analysis and Statistics 11

Contact Information
Department of Veterans Affairs
Office of Policy and Planning
National Center for Veterans Analysis and Statistics
For general inquiries, please email us at [email protected]
12