Embed Size (px)
Citation preview
Very Severe Cyclonic Storm (VSCS), Phailin
over the Bay of Bengal during 08-14 October
2013 : A Demonstration of Early Warning
Capability of India Meteorological Department
INDIA METEOROLOGICAL DEPARTMENT
MAUSAM BHAVAN, LODI ROAD , NEW DELHI-110003
M Mohapatra

Out of 80 forming over the
globe, five form over north
Indian Ocean
Out of five cyclones, 1-2
become very severe
cyclone(>63 kt)
Ratio of TCs between Bay of
Bengal and Arabian Sea –
4:1
Max human death due to
cyclones in the globe
Tropical Cyclones over over North Indian Ocean
Maximum storm surge due to unique bathymetry, topography, coastal
geometry, especially Bay of Bengal. Maximum recorded surge-13 metre
• RSMC, New Delhi provides Daily tropical weather Outlook and 3 hourly
Tropical cyclone advisories, including storm surge guidance to
WMO/ESCAP Panel countries (Bangladesh, Maldives, Myanmar, Oman,
Pakistan, Sri Lanka and Thailand)

VSCS-Phailin (8-14 Oct 2013)
• MSW:115kt
• Larger storm
• Eye wall Replacement Cycle
• Rapid intensification
(70 kt in 24 hrs)
• Large scale damage
• Minimal Human death (21 only)
• Possible due to effective warning
and response mechanism
• 1 Million people evacuated.

Very Severe Cyclonic Storm (VSCS) PHAILIN over
the Bay of Bengal (08-14 October 2013) • Most intense cyclone after 1999 Super
Cyclone.
• Super Cyclone-1999
• MSW:140kt
• Smaller Storm
• No Eye wall Replacement
Cycle
• VSCS-Phailin-2013
• MSW:115kt
• Larger storm
• Eye wall Replacement Cycle
• Rapid intensification
(70 kt in 24 hrs)
• Super Cyclone-1999
• No objective forecast
• Lead period was less (24 hrs)
• Accuracy was moderate
• Poor Warning
communication and
triggering mechanism
• Poor response and
evacuation (44, 000 people)
• VSCS-Phailin (2013)
• Objective track, intensity and
landfall forecast-5 day lead
• Accurate impact based
warning (Rain, storm surge)
• Effective communication and
triggering mechanism
• Effective response and
evacuation (1 Million people)

Loss of Human Lives and cost of evacuation
over the years have reduced SN PARAMETERS SUPER
CYCLONE, 1999
VSCS PHAILIN,
2013
1. Loss of human life 9887 21
2. Ex-gratia paid by Govt. @
Rs 600,000
Rs 5930 Million Rs 12.6 Million
3. Area of evacuation
according to warning
500 km (approx) 180 km
4. Cost of evacuation
(100 thousand Rupees per
km assumed)
500 Million
Rupees
180 Million Rupees
Calculation is based on assumption that similar amounts would have
been spent for evacuation and payment of ex-gratia in 1999 as in 2013
• Though there are many attributes, improvement in early warning
system is a dominant factor for reduction in loss of Human Lives
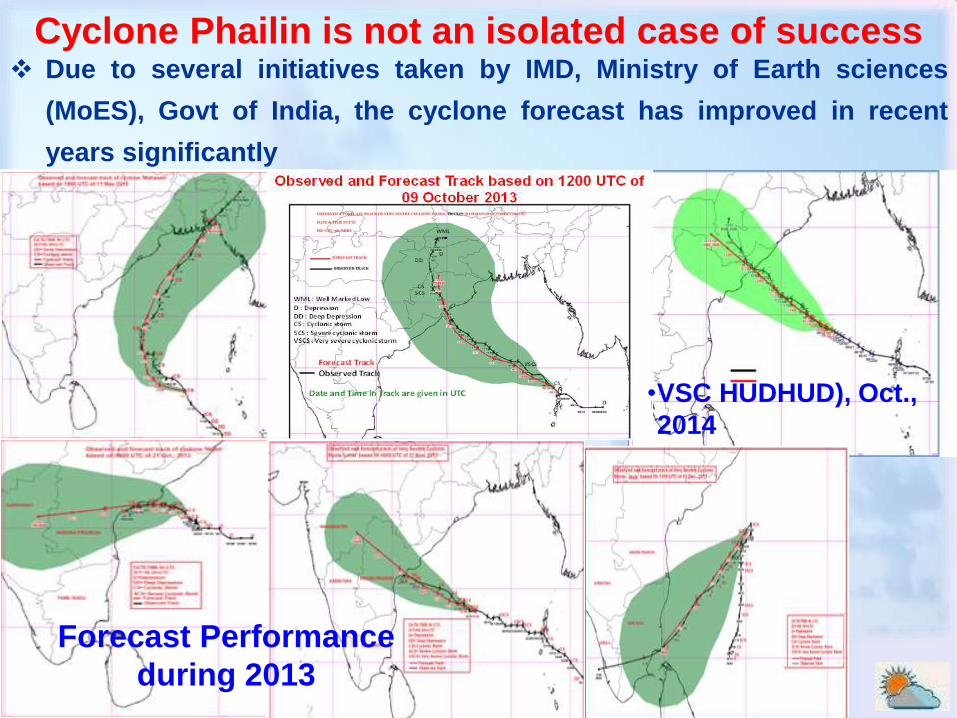
Cyclone Phailin is not an isolated case of success Due to several initiatives taken by IMD, Ministry of Earth sciences
(MoES), Govt of India, the cyclone forecast has improved in recent
years significantly
Forecast Performance
during 2013
•VSC HUDHUD), Oct.,
2014

ADVANCES IN CYCLONE FORECASTING IS MAINLY DUE TO
: • Improvement in observational network (Ocean, land and atmosphere)
and quality of data (DWR, Buoys, AWS, High wind speed recorders,
GPS-Sondes, Satellite images and derived products
Vision document
Benchmarking
Standard Operation Procedure for
• Daily Watch and Methodology
• Check list,
• impact based forecast product generation
• Dissemination mechanism and triggering
R&D-FDP on landfalling cyclone
• High power computing system and
Improved Numerical modelling capabilities
( GFS, WRF, HWRF)
• Improved tools and techniques of
forecasting

ADVANCES IN CYCLONE FORECASTING IS MAINLY DUE TO
: • Fast communication for data Exchange and warning
dissemination
• Capacity building through Training, and National and
international collaboration
• Close liaison and Triggering mechanism for disaster managers
• Timely and frequent update of warning product (text and
graphics) through improved PWS
FRONT LINE MAGAZINE (NOV 1999): SCIENTIFIC FAILURES.
The scientific systems whose responsibility it was to predict the contours
of the cyclone did a far from perfect job. to be able to do a better job next
time around, an integrated approach to cyclone studies is needed.
FRONT LINE MAGAZINE (NOV 2013): ACING THE STORM.
The India Meteorological Department, with improved models and
observation systems and greater forecast skills, predicts accurately not
only the intensity of cyclone Phailin but also its landfall.

Monitoring and Forecast Process of Tropical Cyclone- Phailin
Action
Runs of different Models,
Consecutive runs from the same model,
Ensemble runs ("choosing the best member")
Numerical forecasts
Model Decision maker
Numerical forecasts
End forecast
Initial conditions (Observations)
Forecaster Model
Model runs
Numerical forecasts
Broad Classification of
Observations
Surface
Upper Air
Space Based
• Pilot Balloon
• RSRW
• Profiler
• Ground Based RADAR
• Aircraft
• Geoststionary Satellites
• Polar Orbiting Satellites
• AWS
• ARG
• SYNOP
• BUOYS
• AVIATION
• SHIPS
Monitoring and
Forecast Process

Genesis Monitoring and forecasting for Phailin
Monitored by satellite imageries along with the scat-winds, buoys, ships
and coastal and island observations
Genesis forecast
On 3 Oct. 2013: Indicated to disaster managers that a low would form
over Andaman Sea on 7 October with potential for further intensification
7 October : Low formed over Andaman Sea, Forecast for intensification
8 October : Depression formed and regular special bulletin commenced.
Forecast for intensification into a very severe cyclone by 10th October.
9th October (morning): Formation of Cyclonic Storm
Genesis Monitoring Genesis forecasting (1609 UTC, 08.10.2013)
ISRO Model

TC-Phailin track forecasting methods
i) Statistical Techniques
Analogue, CLIPER,
i) Synoptic Techniques
iii) NWP Models
• Individual models
(Global and regional)
• IMDGFS (574), NCMRWF
(GFS, UM), ARP (MeteoFrance,
ECMWF, JMA, UKMO, NCEP,
WRF (IMD, IIT, IAF), HWRF
(IMD-NOAA),
• MME (IMD)
• EPS from NCMRWF and
TIGGE-JMA
vi)Operational (Consensus)
forecast
•Single model EPS yet to be fully
utilised
•MME is better than individual models

Track forecast error (km)-Phailin
050
100150200250300350400450500550
2003 2004 2005 2006 2007 2008 2009 2010 2011 2012 2013
12 hr forecast error(km)24 hr forecast error (km)36 hr forecast error (km)48 hr forecast error (km)60 hr forecast error (km)72 hr forecast error (km)
Track forecast error (km)-NIO during 2003-13
63 98 91 91 90 77
95
135 112
78
0
50
100
150
12 24 36 48 60 72 84 96 108 120
Track Forecast Error (km)-Phailin 24 hr track forecast errors
have reduce at the rate of
7 km per year. And skill
improved by 5% per year.

Phailin : Forecast Accuracy (Landfall) Lead
Time
(Hrs)
Landfall
Point Error
(km)
Landfall
Time Error
(hrs)
12 3 3 hr delay
24 13 3 hr delay
36 5 3 hr delay
48 11 3 hr delay
60 2 3 hr delay
72 6 01 hr early
84 41 01 hr early
-100
0
100
200
300
400
500
600
2003 2004 2005 2006 2007 2008 2009 2010 2011 2012 2013
12 hr 24 hr 36 hr
48 hr 60 hr 72 hr
Annual Landfall Forecast errors (km) over NIO
24 hr landfall error: 75km
48 hr landfall error : 100 km
72 hr landfall error : 125 km during 2009-13

Intensity monitoring and prediction Monitoring by Satellite, DWR, ship, buoy, Dvorak technique over deep
sea
Prediction by Empirical techniques and NWP Models
• IMDGFS (574), NCMRWF (574), ARP (MeteoFrance, ECMWF, JMA,
UKMO, NCEP-GFS, WRF (IMD, IIT, IAF), HWRF (IMD-NOAA)
Dynamical Statistical Model (SCIP)
Dynamical Statistical Model for RI and decay after landfall
Intensity Forecast by SCIP model
0
20
40
60
80
100
120
140
0 12 24 36 48 60 72 84 96 108 120
Forecast Lead Time (hour)
Inte
ns
ity
(k
t)
Observed
FC1(08/00z)
FC2(09/00z)
FC3(09/12z)
FC4(10/00z)
FC5(10/12z)
FC6(11/00z)
FC7(11/12z)
FC8(12/00z)
VSCS(65 KT)
Intensity Forecast by HWRF model
0
20
40
60
80
100
120
140
0 12 24 36 48 60 72 84 96
Forecast Lead Time (hour)
Inte
nsit
y (
kt)
Observed
FC1(09/00z)
FC2(09/12z)
FC3(10/00z)
FC4(10/12z)
FC5(11/00z)
FC6(11/12z)
FC7(12/00z)
VSCS(65KT)

Rapid Intensification(RI) MSW increased by 70 kt in 24 hrs from 10 Oct morning.
0.0 0.0 2.65.2
9.4
22.0
32.0
72.7
100.0
0.0
10.0
20.0
30.0
40.0
50.0
60.0
70.0
80.0
90.0
100.0
0(17) 1(58) 2(117) 3(115) 4(96) 5(41) 6(25) 7(11) 8(3)
Total number of RI thresholds satisfied
Pro
bab
ilit
y o
f R
I (%
) Dependent
Sample mean
Climatological Probability of RI=9.5%
Forecast based on
Probability of
RI predicted
Chances of
occurrence
Occurrence
00 UTC/10.10.2013
72.7 %
HIGH
YES
12 UTC/10.10.2013
72.7 %
HIGH
YES
RI-Index could predict occurrence of Rapid Intensification phase of
cyclone PHAILIN, but with limited lead period.
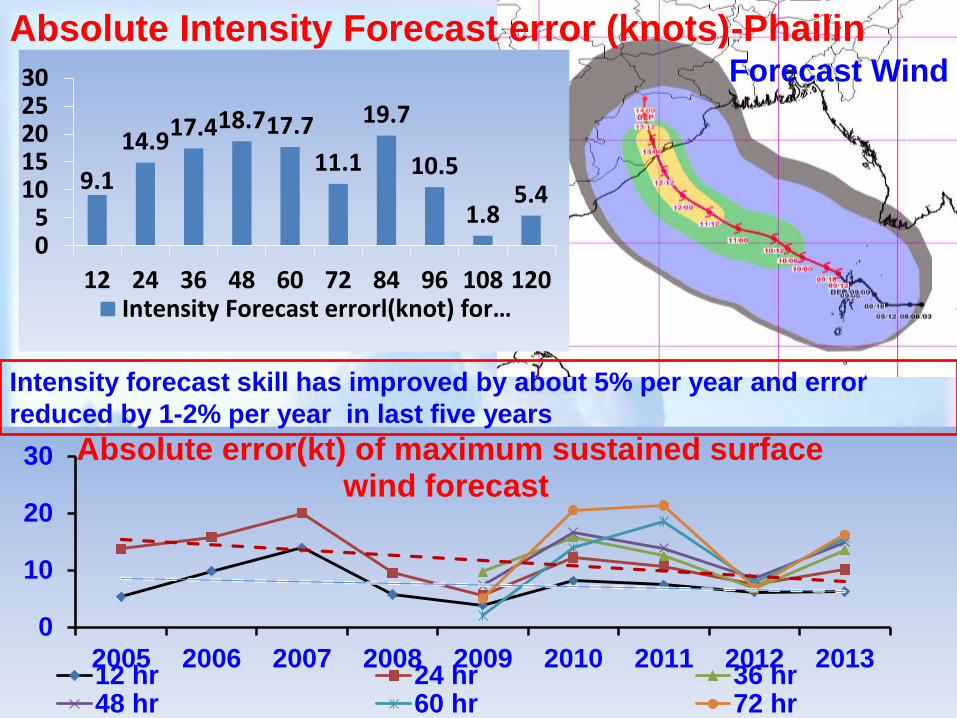
Absolute Intensity Forecast error (knots)-Phailin
9.1
14.9 17.4 18.7 17.7
11.1
19.7
10.5
1.8 5.4
05
1015202530
12 24 36 48 60 72 84 96 108 120Intensity Forecast errorl(knot) for…
Forecast Wind
0
10
20
30
2005 2006 2007 2008 2009 2010 2011 2012 2013
Absolute error(kt) of maximum sustained surface wind forecast
12 hr 24 hr 36 hr48 hr 60 hr 72 hr
Intensity forecast skill has improved by about 5% per year and error
reduced by 1-2% per year in last five years

Heavy rainfall and structure of TC (Phailin)
• Size-largest in recent years
• Affected eastern coast of India
with gale winds over 500 km
• Heavy rainfall extended upto
Nepal, Bhutan, Bangladesh

Raingauge and satellite based
merged rainfall analysis Accumulated rainfall (8-14 Oct, 2013
with track of Phailin showing rainfall
belt shift during landfall

Date/
Time
Forecast Rainfall (Example) Observed Rainfall at 0300 UTC of
date
10
Oct.
/03
UTC
Odisha : heavy (7-12 cm) to very
heavy (13-24 cm) falls at a few
places with isolated extremely
heavy falls (25 cm or more) :
coastal Odishadistricts from 12th
October morning. Would continue
and extend to interior Odisha
QPF in ranges are issued for river
catchments
Odisha
12 & 14 October: Isolated heavy
over coastal Odisha
13 October: Heavy to very heavy
rainfall with isolated extremely
heavy rainfall.
QPF was under-estimated/over-
estimated in some catchments.
Heavy
rainfall
Prediction
Prediction by NWP
models+ synoptic
and climatological
guidance

Date/Time Forecast Gale Wind (Example) Actual Wind
10Oct13/
03UTC
Squally winds speed reaching 45-55 kmph
gusting to 65 kmph would commence along and
off Odisha and north Andhra Pradesh coast from
11th morning. It would increase with gale wind
speed reaching 175-185 kmph at time of landfall.
Later revised to 210-220 kmph on same day
115 Knots
Gale wind Monitoring by Satellite, DWR, ship, buoy,
Prediction by Empirical techniques
NWP Models
• Deterministic
• Ensemble
Dynamical Statistical Model (SCIP)
Dynamical Statistical Model for RI
Statistical Model for decay after landfall

Date/
Time
Forecast Surge Actual
Surge
10.
Oct.13/
03
UTC
Storm surge of
1.5-2.0 m.
Revised to 2.5-3
m on 11th.
2-2.5 m
PEAK SURGE ELEVATIONS AT THE BOUNDARY (IC:2013100912)
0
0.5
1
1.5
2
2.5
3
3.5
Vis
ha
kh
ap
atn
am
Srik
ak
ulu
m
La
nd
fall
Go
pa
lpu
r
Pu
ri
Pa
rad
ip
Dh
am
ara
Ch
an
dip
ur
§
2.0
2.73.0
2.3
-2
-1
0
1
2
3
60 70 80 90
Time (hrs)
Se
a s
urf
ac
e e
lev
ati
on
(m
)
Left_LF
Landfall
Gopalpur
Puri
Storm Surge
prediction method -
Parametric-IIT-Delhi and
Direct-IIT-Bhubaneswar
Coastal inundation-
INCIOS ADCIRC Model
Probabilistic model:R&D
Storm Surge prediction

BULLETINS AND WARNINGS ISSUED for specific users in
collaboration with various agencies in four stages
Four stage cyclone
warning
Sea area bulletin
Coastal weather bulletin
Bulletins for Indian navy
Fisheries warnings
Port warnings
Aviation warning
Bulletins-AIR/TV/ press
Hourly Satellite based
CWDS bulletins (English,
Hindi, Regional language
Warnings for registered
users.
Pre-cyclone watch – At least 72 hr
in advance indicating formation of a
Depression with potential to
intensify into a Cyclone and
coastal belt likely to be affected.
Cyclone Alert- Issued 48 hrs in
advance
Cyclone warning – Issued at least
24 hrs in advance
Post-Landfall Outlook- Issued about
12 hrs before landfall for interior
districts besides the coastal areas.
De-Warning- issued when cyclone
weakens or moves away

Telephone, Tele-fax
VHF/HFRT/Police Wireless
Satellite based cyclone warning dissemination System
Mobile Phones (SMS) through IMD severe weather network,
Agromet Network, Tsunami Warning network
Internet (e-mail), ftp
Websites, Dedicated website for cyclone
(rsmcnewdelhi.imd.gov.in)
Radio/TV, News Paper network (AM, FM, Comminity Radio,
Private TV) : Govt and private broadcasters
Daily Press conference.
3 hourly updates from 8 Oct and Non-stop media coverage (
Electronic, print) with Hourly update on 12th October
Bulletins and Warnings Dissemination by IMD in
collaboration with various agencies

Bulletins issued during VSCS PHAILIN by IMD
Bulletin No. of Bulletins
Press Release daily
No. of Press Conferences
Round the clock response to press and public
5
Personal Briefings to senior national and state
Govt. Officials
At least once a Day.
On 12th frequently
Participation in National and state level Crisis
Managemeng Committee Meeting
Daily 9-12 Oct. 2013
National Bulletin 45
RSMC Bulletin 27
TCAC Bulletin (Text & Graphics) 19
Bulletin to Hong Kong website for Aviation DRR 18
TC vitals to NWP modelers 10
Quadrant Wind radii 7
SMS Once a Day

Area where improvement is needed
Gap in scientific understanding required for better forecasting
that includes:
Detailed structure and dynamics of cyclones over the NIO
unlike Atlantic and Pacific Oceans.
Interaction between cyclone, Ocean, the surrounding
environment
Gap in observational and modeling systems for forecasting with
high spatial resolution
Heavy rainfall forecasting and QPF for smaller river catchments
are more challenging and need improvement
Storm Surge and Coastal inundation observation, modeling and
forecasting

The Atmospheric Technology Vision is
for
an end-to-end, integrated and inter-
operable
network of Indian atmospheric
observations,
data communications, management
and delivery
systems, supported by a
comprehensive user
oriented software utilities to enable
Nowcasting
to climate modeling.
To achieve maximal indigenous
capacity in
building sensors and observational
networks
on different platforms Like ground,
upper
atmosphere, aircraft and spacecraft.
CONCLUSIONS AND RECOMMENDATIONS
• IMD and MoES are continuously strengthening and upgrading their
Early Waring System aiming at DRR based on state of art technology
• However, international collaboration is needed for development of
tools and Technology in various aspects, especially for
• Observational systems (aircraft reconnaissance)
• Satellite based tools, especially modification of Dvorak technique for
monsoonal systems, sheared systems, rapidly weakening system etc
• Nowcasting (rapid intensification &weakening) and climate modeling
of cyclones (extended and seasonal prediction)
• Improvement in decision support system (DSS)and NWP modeling for
location specific heavy rain, QPF, gale wind, storm surge, high waves
and coastal inundation.
• Capacity building through training, and collaborative R&D

Thank you