Embed Size (px)
Citation preview
- 40 -
VERY HEAVY FUEL OILS: RISK ANALYSIS OF THEIR TRANSPORT IN UK WATERS
Kevin Colcomb1, Matthew Rymell2 and Alun Lewis3
1 Maritime and Coastguard Agency, Spring Place, 105 Commercial Road Southampton, SO15 1EG, England, United Kingdom E-mail: [email protected]
2 BMT Cordah Limited, Grove House, 7 Ocean Way, Ocean Village Southampton, SO14 3TJ, England, United Kingdom
3 Oil Spill Consultant, 121 Laleham Road, Staines, Middlesex, TW18 2EG, England, United Kingdom
Abstract
The UK Maritime and Coastguard Agency has conducted an assessment of the risk to UK Waters from a spill of Very Heavy Fuel Oil (VHFO), which is defined here as fuel oil with a viscosity greater than 380cSt at 50°C. A data gathering exercise has been conducted to determine the annual tonnages of VHFO passing along routes through UK waters, both as cargoes and bunkers, and to determine how these have changed over recent years. In 2003, it is estimated that approximately 30 million tonnes of VHFO passed through the Dover Strait, with a significant proportion originating in Russia and former Soviet Union countries. VHFO cargoes transported within UK waters as a whole increased from approximately 26 million tonnes in 1998 to approximately 50 million tonnes in 2003. Using preliminary data, VHFO bunker movements through UK waters are estimated to be 30 million tonnes in 2005, an increase from 23 million tonnes in 1998. Risk maps of the impact of a VHFO spill to UK waters and coastlines have been conducted using oil spill trajectory probability modelling and environmental sensitivity data and are presented here.
Background
The transport (as cargo) and use (as bunker fuel oil) of Heavy Fuel Oil (HFO) by ships poses the risk that these oils might be spilled at sea and these spills could occur in or near UK waters. The recent oil spills from the Erika and the Prestige (both of which passed down the English Channel prior to the spills) have highlighted the risks of transporting HFO as cargo. These incidents have caused the countries involved to take certain actions aimed at reducing the threat to their coastlines; single-hulled tankers carrying HFO as cargo are now banned from the EEZs of France and Spain, even though this breaches UN law. The EU and the IMO are now considering further measures to tackle the risks posed by the transport of HFO as cargo. The threat posed by spills of bunker fuel oil is not as severe as those from large cargoes of HFO. The maximum quantity of bunker fuel that could be spilled is much lower but given the persistence of HFO, the consequences of a spill of 'only' a few thousand tonnes of bunker fuel oil would not be negligible. Some of these bunker fuel oils have almost identical properties to that spilled by the Erika and Prestige. Spills of bunker fuel oil from damaged or sunken ships does not occur that often; the sunken Tricolor withstood collisions from two ships after she sank without any significant loss of the IFO-380 fuel oil that was on board. However, there is a 'track record' of oil spills from non-tanker ships. Not all spills of HFO will be the same. The physical and chemical properties of different grades of HFOs cover a wide range, depending on the crude oils from which they are made and the
- 41 -
refinery process route. The behaviour of the spilled oil and the feasibility of spill response options will be influenced by the precise properties of the HFO that has been spilled. The ecological effects of the spill will also be affected by the chemical and physical properties of the spilled oil, in addition to the resources that might be affected.
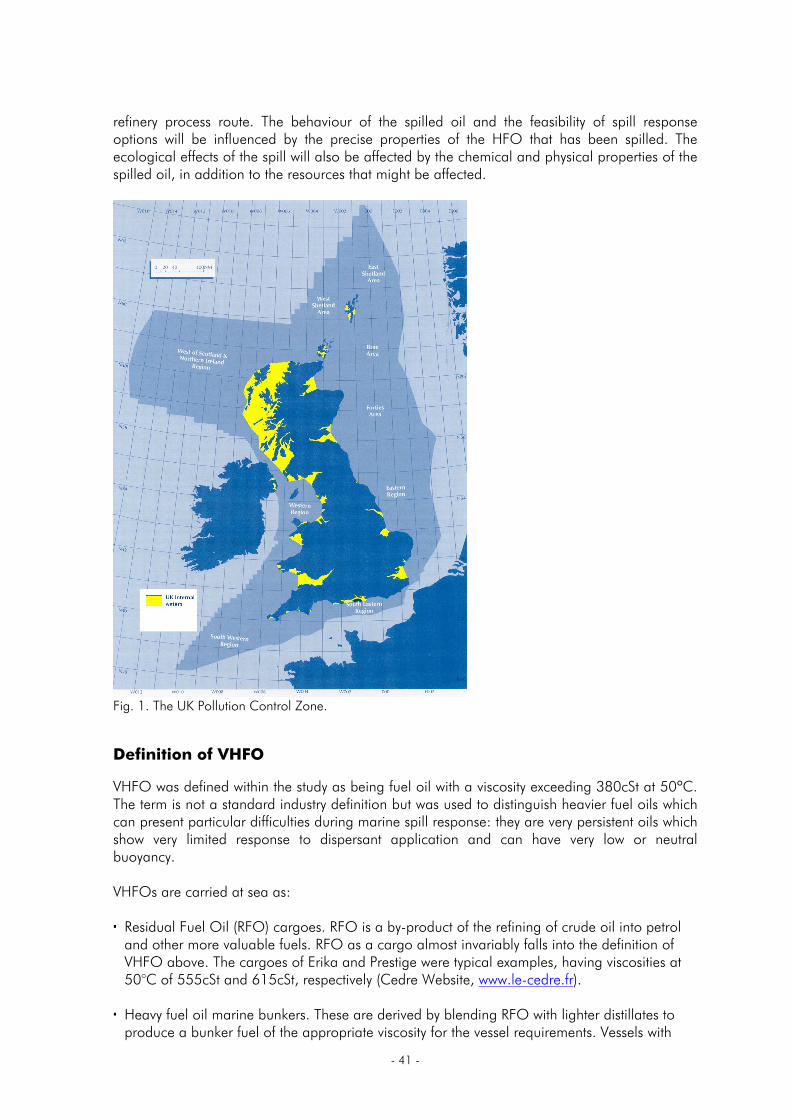
Fig. 1. The UK Pollution Control Zone.
Definition of VHFO
VHFO was defined within the study as being fuel oil with a viscosity exceeding 380cSt at 50°C. The term is not a standard industry definition but was used to distinguish heavier fuel oils which can present particular difficulties during marine spill response: they are very persistent oils which show very limited response to dispersant application and can have very low or neutral buoyancy. VHFOs are carried at sea as: Residual Fuel Oil (RFO) cargoes. RFO is a by-product of the refining of crude oil into petrol and other more valuable fuels. RFO as a cargo almost invariably falls into the definition of VHFO above. The cargoes of Erika and Prestige were typical examples, having viscosities at 50°C of 555cSt and 615cSt, respectively (Cedre Website, www.le-cedre.fr).
Heavy fuel oil marine bunkers. These are derived by blending RFO with lighter distillates to produce a bunker fuel of the appropriate viscosity for the vessel requirements. Vessels with
- 42 -
slower speed engines are able to use bunker fuels that have viscosities falling within the definition of VHFO. Under the ISO 8217:1996 bunker fuel standard, these fuels are categorised as ‘RMH45’ and ‘RMH55’ but are often referred to by the industry definition of ‘IFO500’ and ‘IFO700’.
VHFO tonnages in UK waters
A prime objective of the study was to determine the quantities of VHFO bunkers and cargo passing along routes within and through the UK Pollution Control Zone (UKPCZ), to assess whether these had increased in recent years and whether such trends might continue. Initial activities focused on the gathering of RFO and bunker volume and transport data directly from industry sources such as oil refineries, oil traders, bunkering agents and port authorities. However, it soon became apparent that such data were not readily available because of the commercially sensitive nature of the fuel oil trading markets. A different approach was adopted, using statistical trading and shipping information available through sources such as the European Union’s EUROSTAT database (www.epp.eurostat.cec.eu.int), UK Trade Info (www.uktradeinfo.com), and UK Maritime Statistics (www.maritimestatistics.org), operated by UK Government departments, and data from the International Energy Agency (www.iea.org). 2002 and 2003 have generally been used as the base years for annual volume and routeing statistics, as these were the latest full data sets available at the time of the study. There were some discrepancies between data and some of the details reported here varied between the sources, but there was broad agreement on the overall pattern of volumes. VHFO cargoes
UK RFO imports, exports and domestic traffic
The UK has nine major crude oil refineries, located on the Thames (1), Forth (1), Humber (2), Tees (1) and Mersey (1) Estuaries, Southampton Water (1) and Milford Haven (2). In 2003, these distilled crude oil into 84.5 million tonnes of refined oil products, including 11.5 million tonnes of RFO (DTI, 2005). 6.4 million tonnes of RFO were exported but the UK also imported 0.4 million tonnes. Table I shows how the RFO was consumed in the UK (differences between RFO availability and consumption result from stock changes and statistical error factors). 0.9 million tonnes was supplied as bunkers to international shipping and 3.6 million tonnes was consumed within the UK: approximately 2 million tonnes by the refineries themselves and approximately 1.5 million tonnes for other purposes. As RFO is too viscous to travel over large distances by pipe, and it is impractical to move large quantities by road or rail, it is probable that a large proportion of the 1.5 million tonnes not consumed at refineries was supplied to local oil terminals via sea routes around the UK coast. Annual production of RFO in the UK remained fairly static between 1998 and 2004, varying between 10 and 13 million tonnes (DTI, 2005). However, there has been a slight increase in the amount of RFO imported into the UK and a larger increase in the amount of RFO exported from the UK during the same period. The main trading partners are other European countries: France, Ireland, Netherlands, Italy and Germany.

- 43 -
Table I. UK RFO supply and consumption tonnages (DTI, 2005) Fuel oils
(thousands of tonnes) Production 11,517 Imports 394 Exports 6,385 International marine bunkers 867 Total UK consumption 3,562 Internal refinery use 2,022 Industry and energy 1,346 Inland waterways transport 50 Other 144
EU Traffic
Six countries within the EU produced over 10 million tonnes of RFO in 2003. In descending order these were Italy, the Netherlands, Germany, Spain, France, and the UK. Aside from Italy, each of these countries produced more than they consumed and were net exporters. In addition, some countries, notably the Netherlands and Belgium, act as trading hubs for RFO and both import and export large quantities of RFO. Based on EUROSTAT figures for 2003, the Netherlands was Europe’s largest importer (15.5 millions tonnes) and exporter (12 million tonnes) of RFOs, was Europe’s second largest producer of RFOs (13 million tonnes), but was one of the smallest consumers of RFO (<0.3 million tonnes). Fig. 2 shows the RFO production, import, export and supply figures for NW European countries in 2002.
-15000
-10000
-5000
0
5000
10000
15000
20000
25000
Belg
ium
Denm
ark
Fran
ce
Germ
any
Irela
nd
Neth
erla
nds
Norw
ayUn
ited
King
dom
Thou
sand
tonn
es
Production ImportsExports International Marine BunkersDomestic Supply
Fig. 2. 2002 RFO production, import, export and domestic supply in Northern European countries
(International Energy Agency, 2003).
- 44 -
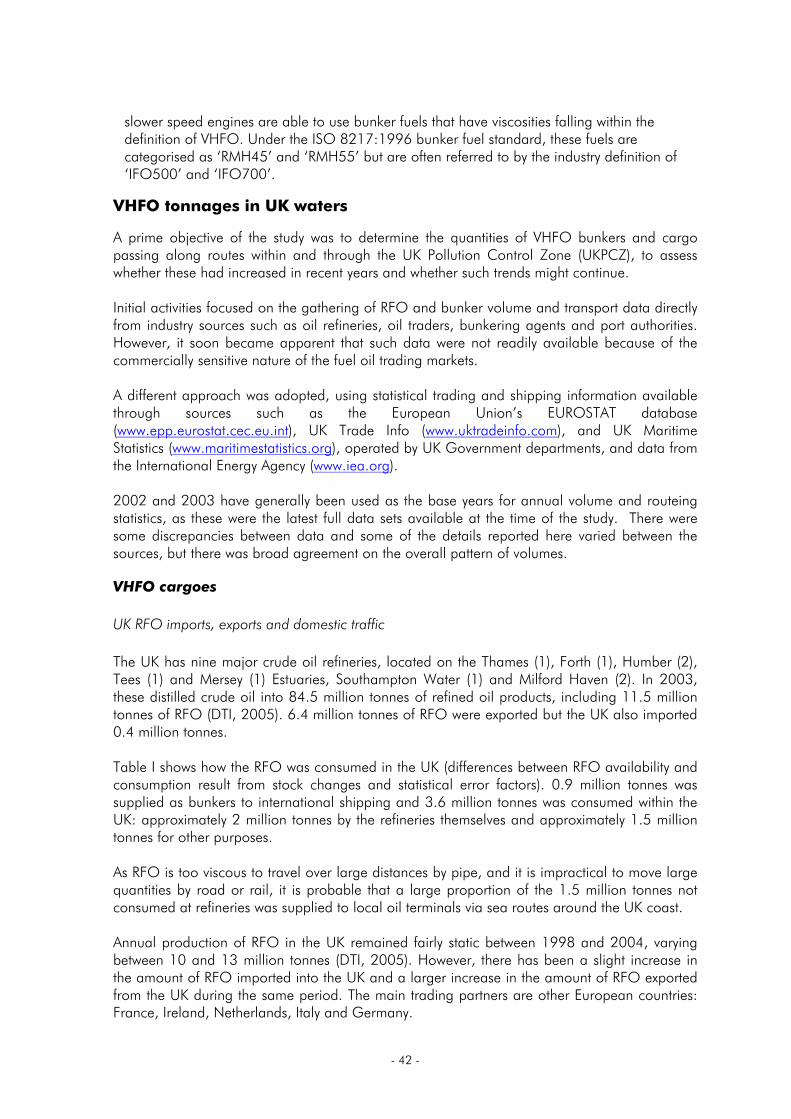
From EUROSTAT, it was possible to determine the tonnages of RFO traded between pairs of countries, which were used in the routeing calculations presented later. A discrepancy was noted between the UK RFO import and export figures given by EUROSTAT and the UK data discussed in the previous section. EUROSTAT reports higher figures for UK RFO imports in 2003 (3.8 million tonnes) but lower exports (4.3 million tonnes). No reason for this discrepancy could be determined, but there is not a significantly large difference between the combined import-export tonnage in each case when comparing it to other traffic in the UKPCZ (the difference is 1.3 million tonnes). Over the period from 1993 to 2003, the total production of RFO in the main EU refining countries fell slightly but imports in some NW Europe countries, and the Netherlands in particular, showed a significant increase. (These were matched by a correspondingly significant fall in RFO imports to Italy but these did not involve any significant traffic passing through the UKPCZ.) Fig. 3 shows import data for the top 4 European RFO importers from 1993 to 2003. Recently available data show that RFO imports to the Netherlands increased in 2005 to 17 million tonnes (Fig. 4).
0
2,000
4,000
6,000
8,000
10,000
12,000
14,000
16,000
18,000
20,000
1993 1994 1995 1996 1997 1998 1999 2000 2001 2002 2003
Year
Thou
sand
tonn
es
NetherlandsItalyBelgiumSpain
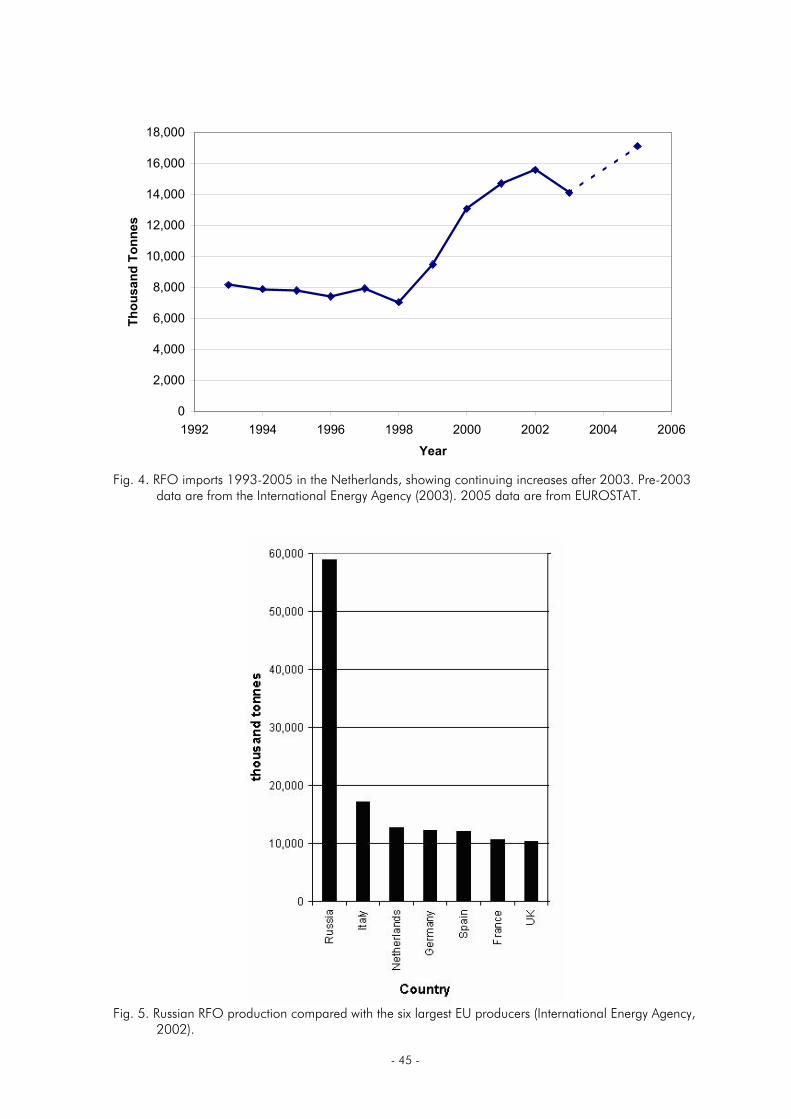
Fig. 3. RFO imports 1993-2003 for the four largest EU importers (International Energy Agency, 2003). The main source of the RFO imports to the Netherlands was Russia, which has shown a large increase in its exports of both crude oil and oil products in recent years. Russia has 42 oil refineries, mainly in the west of the country, compared with 97 in the EU and Norway. In 2002, Russia produced almost 60 million tonnes of RFO, significantly more than any single EU country (Fig. 5) (International Energy Agency, 2002). RFO use is decreasing in Russia (US EIA, 2002) and in 2002 Russia exported over 35 million tonnes of RFO (International Energy Agency, 2002); 29 million tonnes of this was exported through the Baltic Sea (Axelrod, 2005).
- 45 -
0
2,000
4,000
6,000
8,000
10,000
12,000
14,000
16,000
18,000
1992 1994 1996 1998 2000 2002 2004 2006
Year
Thou
sand
Ton
nes
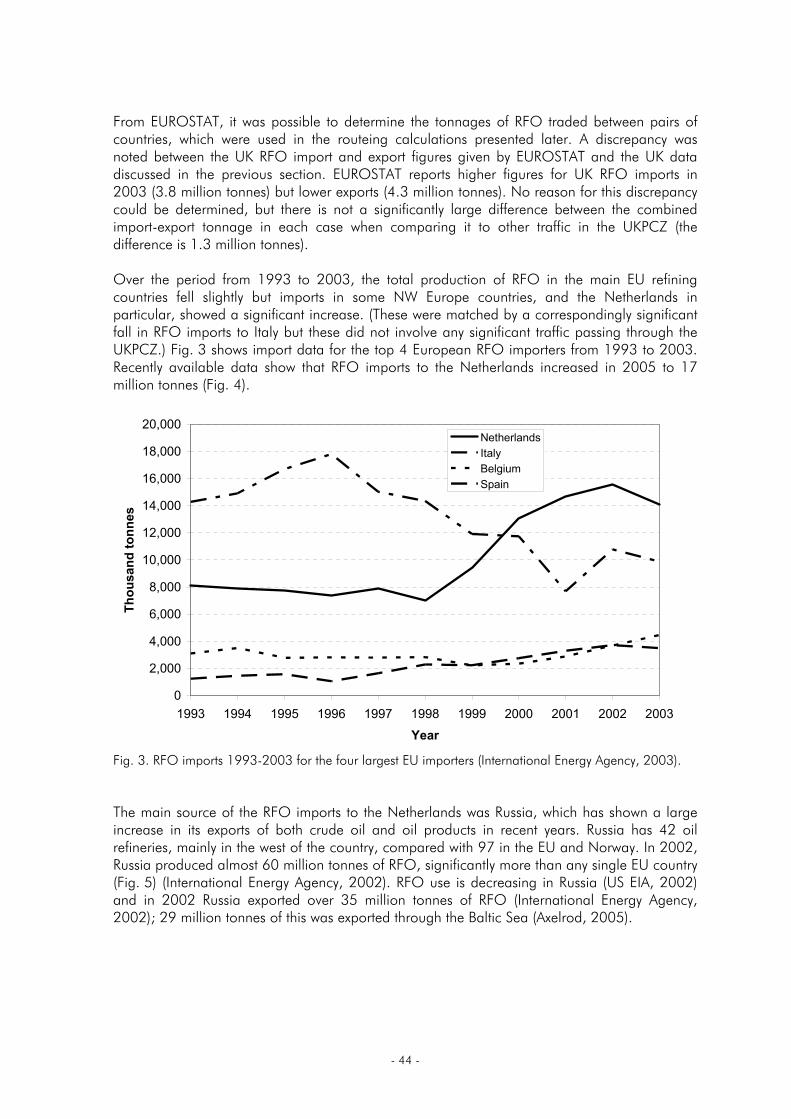
Fig. 4. RFO imports 1993-2005 in the Netherlands, showing continuing increases after 2003. Pre-2003
data are from the International Energy Agency (2003). 2005 data are from EUROSTAT.
Fig. 5. Russian RFO production compared with the six largest EU producers (International Energy Agency,
2002).
- 46 -
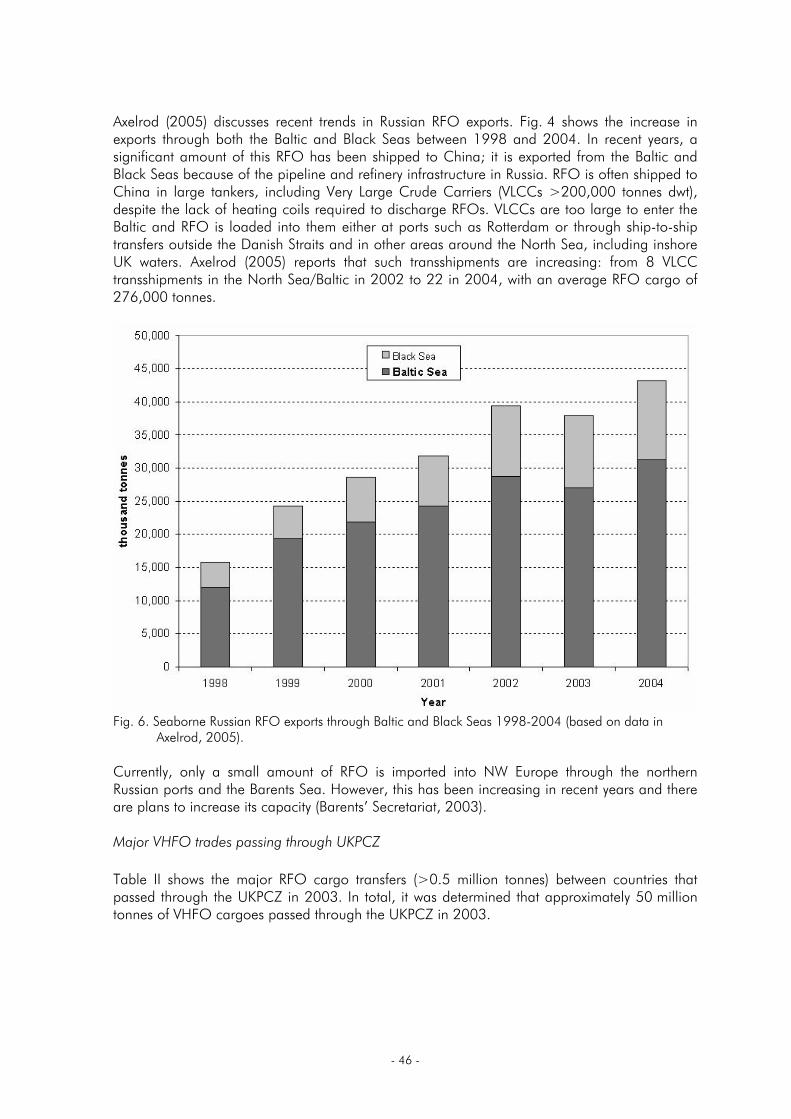
Axelrod (2005) discusses recent trends in Russian RFO exports. Fig. 4 shows the increase in exports through both the Baltic and Black Seas between 1998 and 2004. In recent years, a significant amount of this RFO has been shipped to China; it is exported from the Baltic and Black Seas because of the pipeline and refinery infrastructure in Russia. RFO is often shipped to China in large tankers, including Very Large Crude Carriers (VLCCs >200,000 tonnes dwt), despite the lack of heating coils required to discharge RFOs. VLCCs are too large to enter the Baltic and RFO is loaded into them either at ports such as Rotterdam or through ship-to-ship transfers outside the Danish Straits and in other areas around the North Sea, including inshore UK waters. Axelrod (2005) reports that such transshipments are increasing: from 8 VLCC transshipments in the North Sea/Baltic in 2002 to 22 in 2004, with an average RFO cargo of 276,000 tonnes.
Fig. 6. Seaborne Russian RFO exports through Baltic and Black Seas 1998-2004 (based on data in
Axelrod, 2005). Currently, only a small amount of RFO is imported into NW Europe through the northern Russian ports and the Barents Sea. However, this has been increasing in recent years and there are plans to increase its capacity (Barents’ Secretariat, 2003). Major VHFO trades passing through UKPCZ
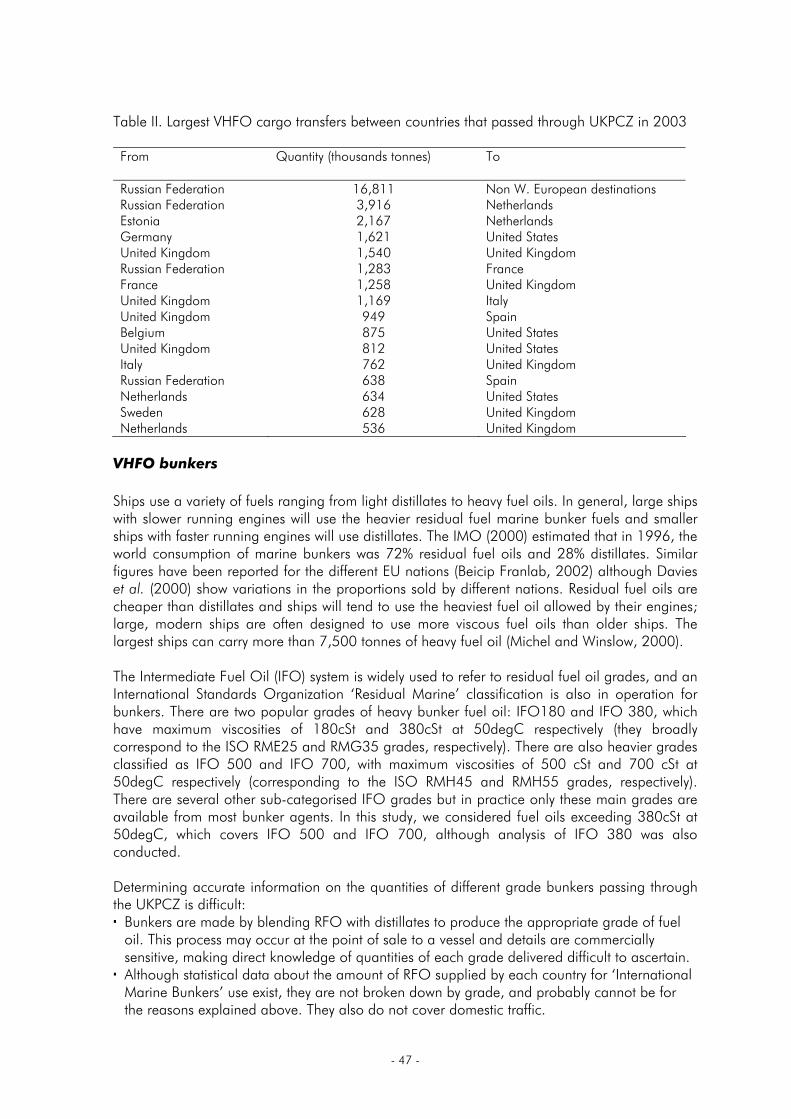
Table II shows the major RFO cargo transfers (>0.5 million tonnes) between countries that passed through the UKPCZ in 2003. In total, it was determined that approximately 50 million tonnes of VHFO cargoes passed through the UKPCZ in 2003.
- 47 -
Table II. Largest VHFO cargo transfers between countries that passed through UKPCZ in 2003 From
Quantity (thousands tonnes) To
Russian Federation 16,811 Non W. European destinations Russian Federation 3,916 Netherlands Estonia 2,167 Netherlands Germany 1,621 United States United Kingdom 1,540 United Kingdom Russian Federation 1,283 France France 1,258 United Kingdom United Kingdom 1,169 Italy United Kingdom 949 Spain Belgium 875 United States United Kingdom 812 United States Italy 762 United Kingdom Russian Federation 638 Spain Netherlands 634 United States Sweden 628 United Kingdom Netherlands 536 United Kingdom
VHFO bunkers
Ships use a variety of fuels ranging from light distillates to heavy fuel oils. In general, large ships with slower running engines will use the heavier residual fuel marine bunker fuels and smaller ships with faster running engines will use distillates. The IMO (2000) estimated that in 1996, the world consumption of marine bunkers was 72% residual fuel oils and 28% distillates. Similar figures have been reported for the different EU nations (Beicip Franlab, 2002) although Davies et al. (2000) show variations in the proportions sold by different nations. Residual fuel oils are cheaper than distillates and ships will tend to use the heaviest fuel oil allowed by their engines; large, modern ships are often designed to use more viscous fuel oils than older ships. The largest ships can carry more than 7,500 tonnes of heavy fuel oil (Michel and Winslow, 2000). The Intermediate Fuel Oil (IFO) system is widely used to refer to residual fuel oil grades, and an International Standards Organization ‘Residual Marine’ classification is also in operation for bunkers. There are two popular grades of heavy bunker fuel oil: IFO180 and IFO 380, which have maximum viscosities of 180cSt and 380cSt at 50degC respectively (they broadly correspond to the ISO RME25 and RMG35 grades, respectively). There are also heavier grades classified as IFO 500 and IFO 700, with maximum viscosities of 500 cSt and 700 cSt at 50degC respectively (corresponding to the ISO RMH45 and RMH55 grades, respectively). There are several other sub-categorised IFO grades but in practice only these main grades are available from most bunker agents. In this study, we considered fuel oils exceeding 380cSt at 50degC, which covers IFO 500 and IFO 700, although analysis of IFO 380 was also conducted. Determining accurate information on the quantities of different grade bunkers passing through the UKPCZ is difficult: Bunkers are made by blending RFO with distillates to produce the appropriate grade of fuel oil. This process may occur at the point of sale to a vessel and details are commercially sensitive, making direct knowledge of quantities of each grade delivered difficult to ascertain.
Although statistical data about the amount of RFO supplied by each country for ‘International Marine Bunkers’ use exist, they are not broken down by grade, and probably cannot be for the reasons explained above. They also do not cover domestic traffic.
- 48 -
It is not possible to accurately break down different vessel classes and sizes by the fuel type they use, although ‘rules of thumb’ exist, and this relationship can’t accurately be applied to statistical shipping data.
Even where ‘rules of thumb’ are applied regarding fuel grade and bunker tank volume for different vessel sizes and classes, it is not possible to determine how full each vessel’s tanks will be as it passes through the UKPCZ.
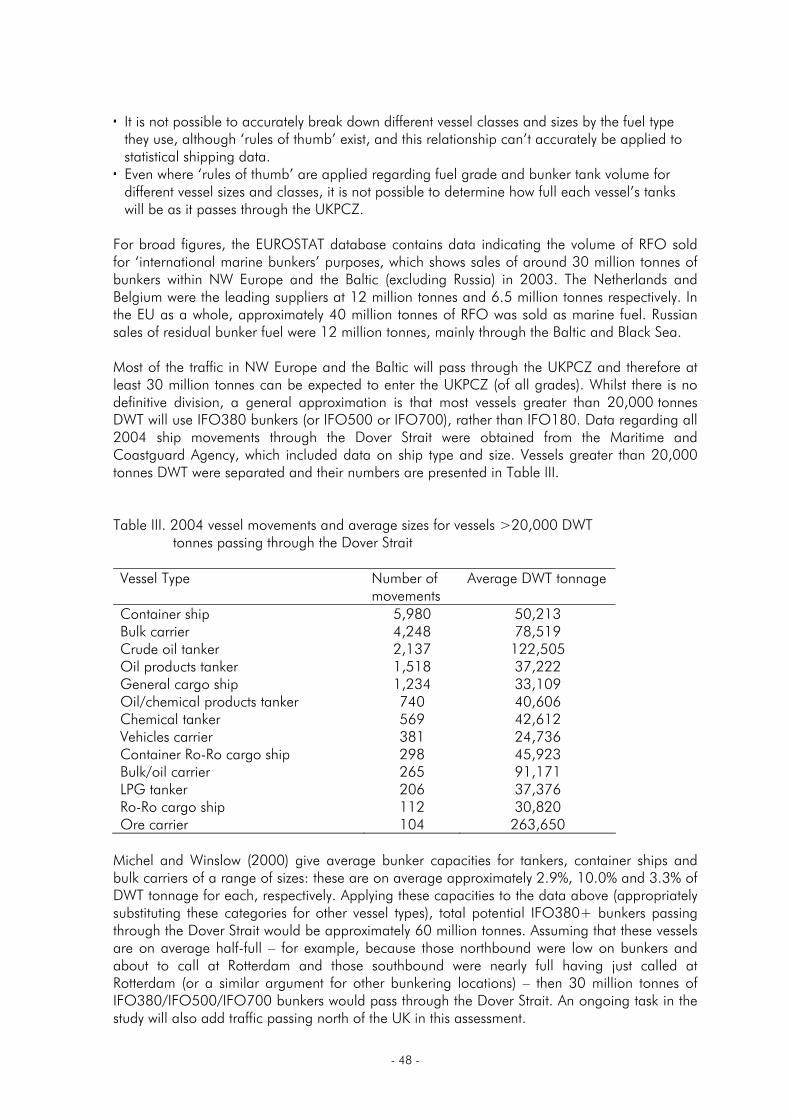
For broad figures, the EUROSTAT database contains data indicating the volume of RFO sold for ‘international marine bunkers’ purposes, which shows sales of around 30 million tonnes of bunkers within NW Europe and the Baltic (excluding Russia) in 2003. The Netherlands and Belgium were the leading suppliers at 12 million tonnes and 6.5 million tonnes respectively. In the EU as a whole, approximately 40 million tonnes of RFO was sold as marine fuel. Russian sales of residual bunker fuel were 12 million tonnes, mainly through the Baltic and Black Sea. Most of the traffic in NW Europe and the Baltic will pass through the UKPCZ and therefore at least 30 million tonnes can be expected to enter the UKPCZ (of all grades). Whilst there is no definitive division, a general approximation is that most vessels greater than 20,000 tonnes DWT will use IFO380 bunkers (or IFO500 or IFO700), rather than IFO180. Data regarding all 2004 ship movements through the Dover Strait were obtained from the Maritime and Coastguard Agency, which included data on ship type and size. Vessels greater than 20,000 tonnes DWT were separated and their numbers are presented in Table III. Table III. 2004 vessel movements and average sizes for vessels >20,000 DWT
tonnes passing through the Dover Strait Vessel Type Number of
movements Average DWT tonnage
Container ship 5,980 50,213 Bulk carrier 4,248 78,519 Crude oil tanker 2,137 122,505 Oil products tanker 1,518 37,222 General cargo ship 1,234 33,109 Oil/chemical products tanker 740 40,606 Chemical tanker 569 42,612 Vehicles carrier 381 24,736 Container Ro-Ro cargo ship 298 45,923 Bulk/oil carrier 265 91,171 LPG tanker 206 37,376 Ro-Ro cargo ship 112 30,820 Ore carrier 104 263,650
Michel and Winslow (2000) give average bunker capacities for tankers, container ships and bulk carriers of a range of sizes: these are on average approximately 2.9%, 10.0% and 3.3% of DWT tonnage for each, respectively. Applying these capacities to the data above (appropriately substituting these categories for other vessel types), total potential IFO380+ bunkers passing through the Dover Strait would be approximately 60 million tonnes. Assuming that these vessels are on average half-full – for example, because those northbound were low on bunkers and about to call at Rotterdam and those southbound were nearly full having just called at Rotterdam (or a similar argument for other bunkering locations) – then 30 million tonnes of IFO380/IFO500/IFO700 bunkers would pass through the Dover Strait. An ongoing task in the study will also add traffic passing north of the UK in this assessment.
- 49 -
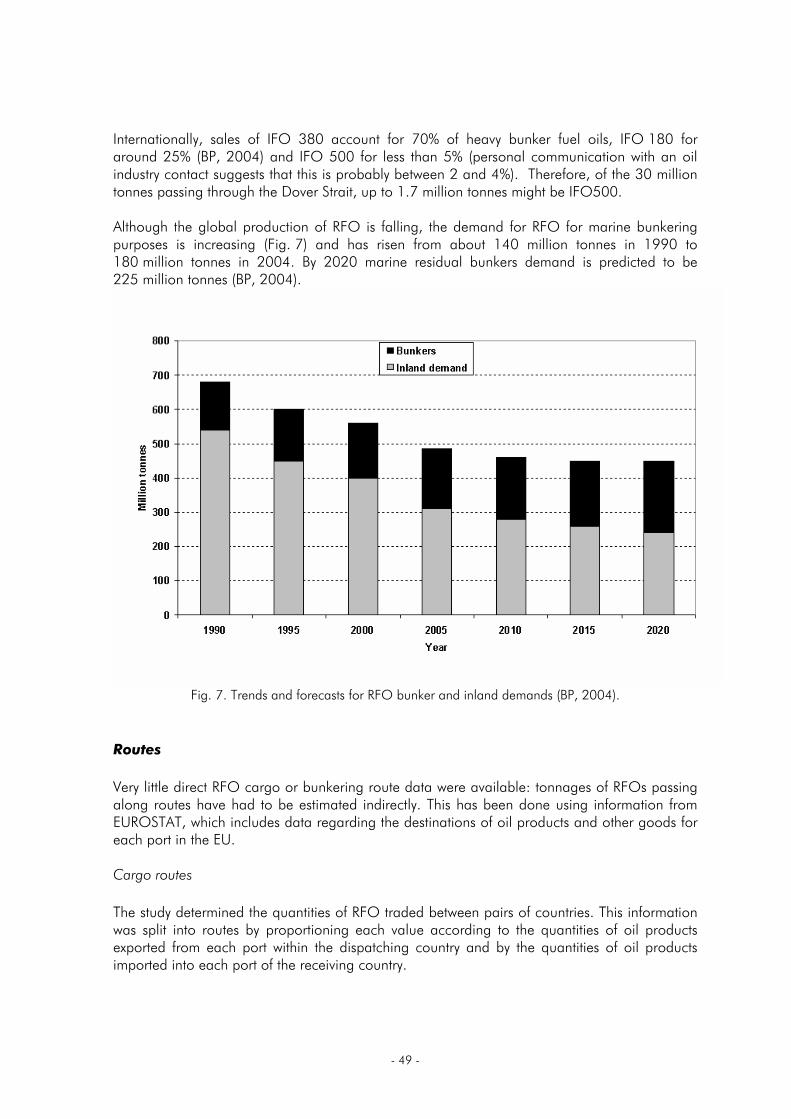
Internationally, sales of IFO 380 account for 70% of heavy bunker fuel oils, IFO 180 for around 25% (BP, 2004) and IFO 500 for less than 5% (personal communication with an oil industry contact suggests that this is probably between 2 and 4%). Therefore, of the 30 million tonnes passing through the Dover Strait, up to 1.7 million tonnes might be IFO500. Although the global production of RFO is falling, the demand for RFO for marine bunkering purposes is increasing (Fig. 7) and has risen from about 140 million tonnes in 1990 to 180 million tonnes in 2004. By 2020 marine residual bunkers demand is predicted to be 225 million tonnes (BP, 2004).
Fig. 7. Trends and forecasts for RFO bunker and inland demands (BP, 2004).
Routes
Very little direct RFO cargo or bunkering route data were available: tonnages of RFOs passing along routes have had to be estimated indirectly. This has been done using information from EUROSTAT, which includes data regarding the destinations of oil products and other goods for each port in the EU. Cargo routes
The study determined the quantities of RFO traded between pairs of countries. This information was split into routes by proportioning each value according to the quantities of oil products exported from each port within the dispatching country and by the quantities of oil products imported into each port of the receiving country.
- 50 -
Bunker routes
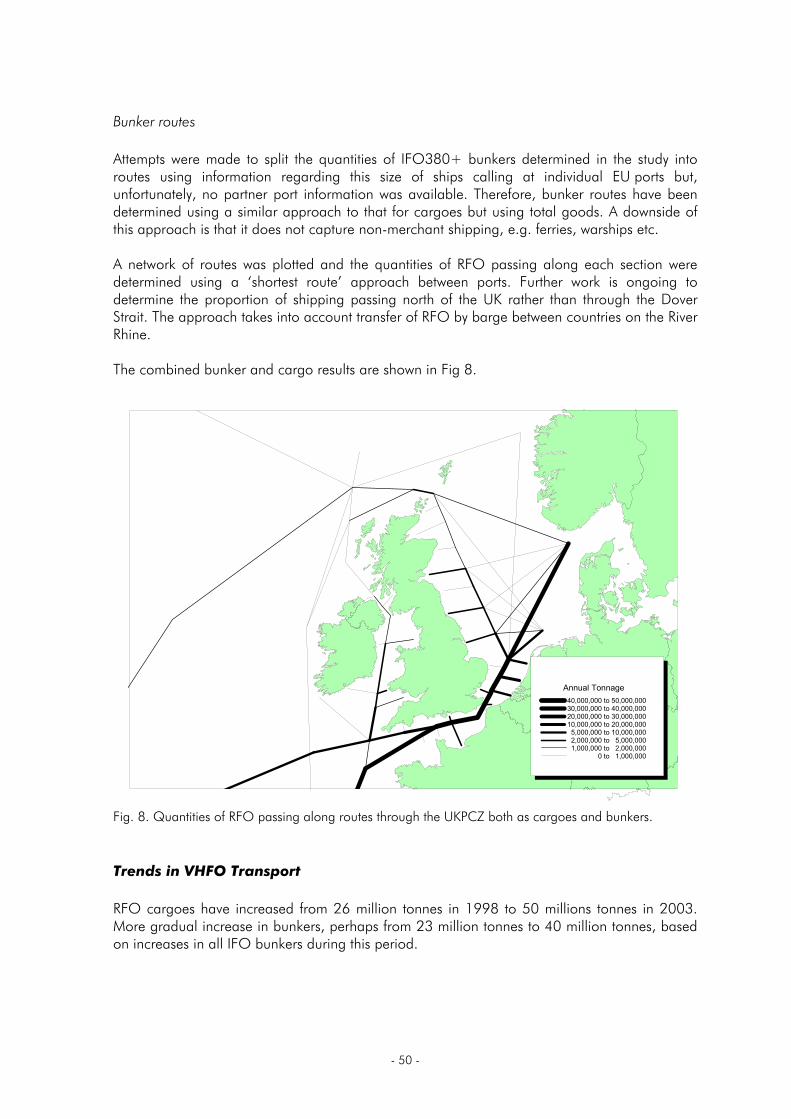
Attempts were made to split the quantities of IFO380+ bunkers determined in the study into routes using information regarding this size of ships calling at individual EU ports but, unfortunately, no partner port information was available. Therefore, bunker routes have been determined using a similar approach to that for cargoes but using total goods. A downside of this approach is that it does not capture non-merchant shipping, e.g. ferries, warships etc. A network of routes was plotted and the quantities of RFO passing along each section were determined using a ‘shortest route’ approach between ports. Further work is ongoing to determine the proportion of shipping passing north of the UK rather than through the Dover Strait. The approach takes into account transfer of RFO by barge between countries on the River Rhine. The combined bunker and cargo results are shown in Fig 8.
Annual Tonnage40,000,000 to 50,000,00030,000,000 to 40,000,00020,000,000 to 30,000,00010,000,000 to 20,000,0005,000,000 to 10,000,0002,000,000 to 5,000,0001,000,000 to 2,000,000
0 to 1,000,000
Fig. 8. Quantities of RFO passing along routes through the UKPCZ both as cargoes and bunkers.
Trends in VHFO Transport
RFO cargoes have increased from 26 million tonnes in 1998 to 50 millions tonnes in 2003. More gradual increase in bunkers, perhaps from 23 million tonnes to 40 million tonnes, based on increases in all IFO bunkers during this period.
- 51 -
References
Axelrod. 2005. Transporting Fuel Oil from Europe to the Far East: The Role of Aframaxes, Suezmaxes, and VLCCs Fuel Oil and Heating Oil – Processing, Trading, Transportation. IPE/Confidence Conference Antwerp, Belgium, April 21-23, 2005. Available at www.poten.com.
Barents Secretariat. 2003. Oil Transport from the Russian part of the Barents Region. Report prepared by Bjørn Frantzen and Alexei Bambulyak of the Svanhovd Environmental Centre.
Beicip-Franlab. 2002. Advice on the costs to fuel producers and price premia likely to result from a reduction in the level of sulphur in marine fuels marketed in the EU. Study C.1/01/2002, commissioned by EU Directorate General Environment under contract ENV.C1/SER/2001/0063.
BP. 2004. Statistical review of world energy 2004. BP plc, 1 St. James Square, London, UK.
Davies M. E., G. Plant, C. Cosslett, O. Harrop, and J.W. Petts. 2000. Study on the economic, legal, environmental and practical implications of a European Union system to reduce ship emissions of SO2 and NOx. European Commission contract B4-3040/98/000839/MAR/B1, BMT Murray Fenton Edon Liddiard Vince Ltd., England.
Dovre Safetec. 1999. Identification of Marine Environmental High Risk Areas (MEHRAs) in the UK. Report Number ST-87639-MI–1-Rev 01, commissioned by UK Department of the Environment, Transport and the Regions. Available from http://www.defra.gov.uk/environment/consult/mehra/.
DTI. 2006. Petroleum Product: Commodity Balances 2003. Department of Trade and Industry, Victoria Street, London (or via http://www.dti.gov.uk/energy/ statistics/source/oil/page18470.html).
International Energy Agency. 2002. Russia Energy Survey 2002. International Energy Agency, 9, rue de la Fédération, 75739 Paris, Cedex 15, France.
International Energy Agency. 2003. Energy Statistics: Oil database available at http://www.iea.org/Textbase/stats/oilresult.asp
Michel K. and T.S. Winslow. 2000. Cargo Ship Bunker Tanks: Designing to Mitigate Oil Spillage. Marine Technology 37(4).
US Energy Information Administration. 2006. Country Analysis Brief: Russia available at www.eia.doe.gov/emeu/cabs/russia.html/


![Screening Assessment Petroleum Sector Stream …Screening Assessment Petroleum Sector Stream Approach Heavy Fuel Oils [Site-Restricted] Chemical Abstracts Service Registry Numbers](https://img.pdfslide.us/doc/110x75/5f06128e7e708231d41626d7/screening-assessment-petroleum-sector-stream-screening-assessment-petroleum-sector.jpg)