Embed Size (px)
Citation preview
ChE 4162 VTHX Operating Manual Fall 2014
Edited by: Harold J. Toups and Daniel B. Mowrey
1/17 8/21/2014
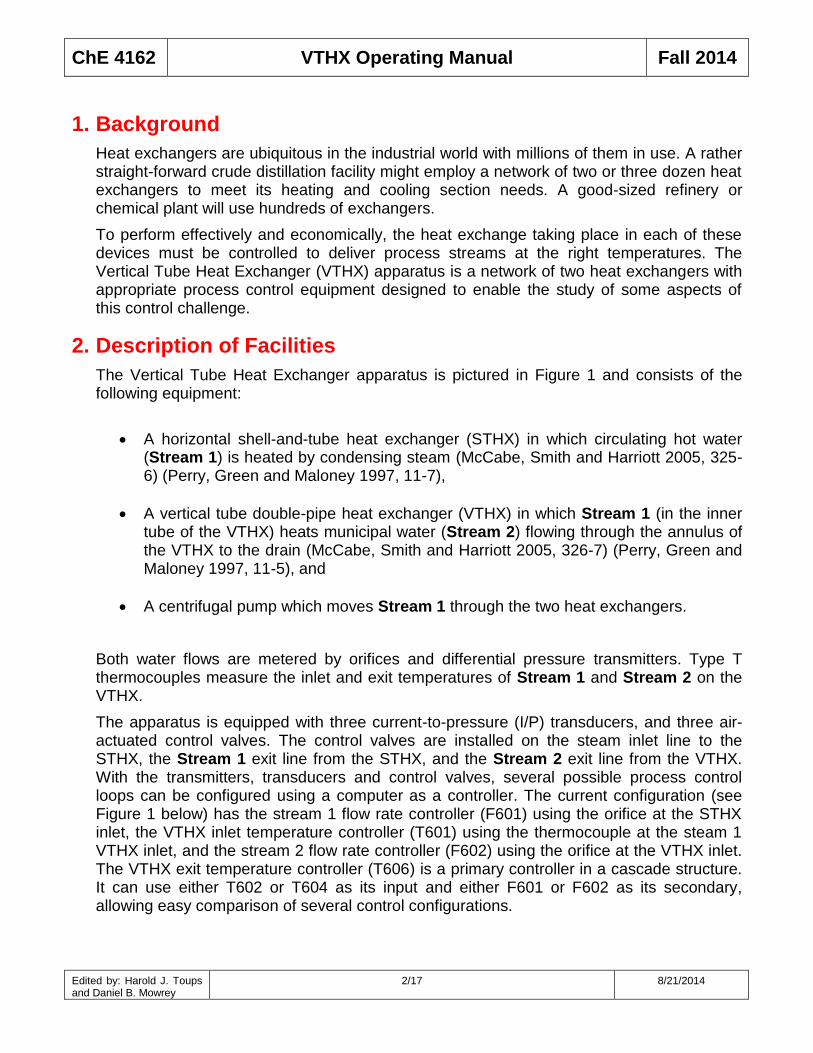
Vertical Tube Heat Exchanger (VTHX) or
The Heat Exchanger Network (HEN) Control Process
Operating Manual
ChE 4162 VTHX Operating Manual Fall 2014
Edited by: Harold J. Toups and Daniel B. Mowrey
2/17 8/21/2014
1. Background
Heat exchangers are ubiquitous in the industrial world with millions of them in use. A rather straight-forward crude distillation facility might employ a network of two or three dozen heat exchangers to meet its heating and cooling section needs. A good-sized refinery or chemical plant will use hundreds of exchangers.
To perform effectively and economically, the heat exchange taking place in each of these devices must be controlled to deliver process streams at the right temperatures. The Vertical Tube Heat Exchanger (VTHX) apparatus is a network of two heat exchangers with appropriate process control equipment designed to enable the study of some aspects of this control challenge.
2. Description of Facilities
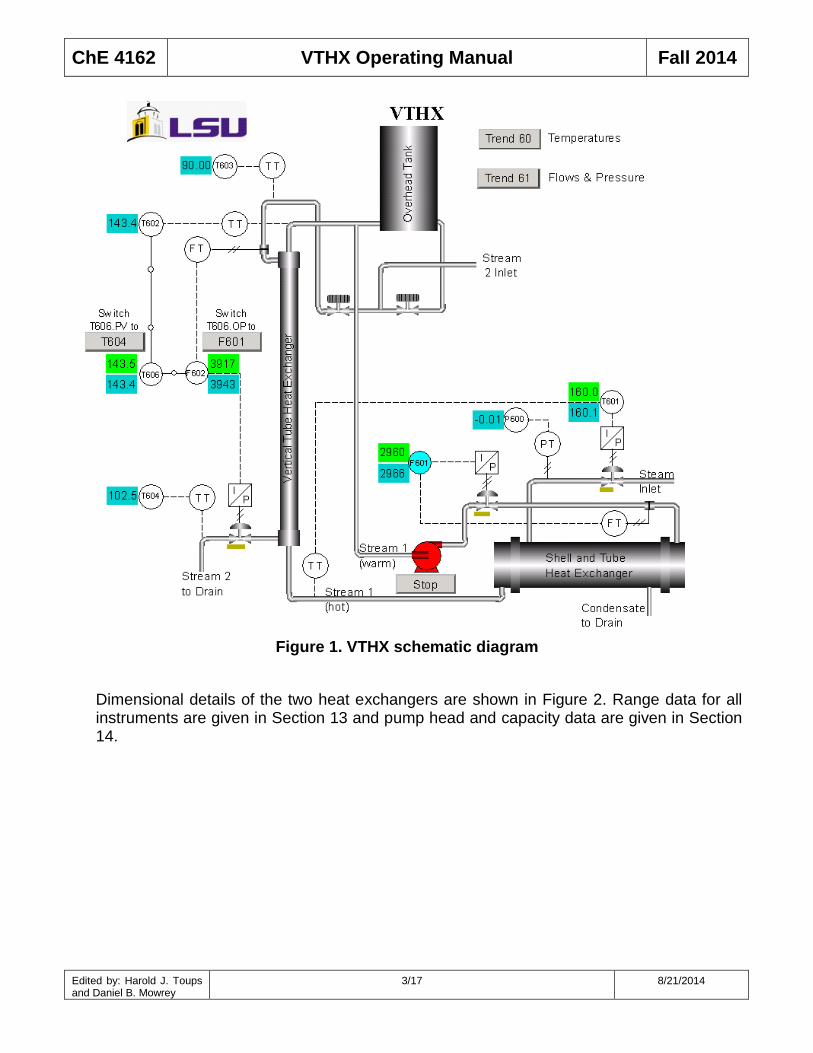
The Vertical Tube Heat Exchanger apparatus is pictured in Figure 1 and consists of the following equipment:
A horizontal shell-and-tube heat exchanger (STHX) in which circulating hot water (Stream 1) is heated by condensing steam (McCabe, Smith and Harriott 2005, 325-6) (Perry, Green and Maloney 1997, 11-7),
A vertical tube double-pipe heat exchanger (VTHX) in which Stream 1 (in the inner tube of the VTHX) heats municipal water (Stream 2) flowing through the annulus of the VTHX to the drain (McCabe, Smith and Harriott 2005, 326-7) (Perry, Green and Maloney 1997, 11-5), and
A centrifugal pump which moves Stream 1 through the two heat exchangers.
Both water flows are metered by orifices and differential pressure transmitters. Type T thermocouples measure the inlet and exit temperatures of Stream 1 and Stream 2 on the VTHX.
The apparatus is equipped with three current-to-pressure (I/P) transducers, and three air-actuated control valves. The control valves are installed on the steam inlet line to the STHX, the Stream 1 exit line from the STHX, and the Stream 2 exit line from the VTHX. With the transmitters, transducers and control valves, several possible process control loops can be configured using a computer as a controller. The current configuration (see Figure 1 below) has the stream 1 flow rate controller (F601) using the orifice at the STHX inlet, the VTHX inlet temperature controller (T601) using the thermocouple at the steam 1 VTHX inlet, and the stream 2 flow rate controller (F602) using the orifice at the VTHX inlet. The VTHX exit temperature controller (T606) is a primary controller in a cascade structure. It can use either T602 or T604 as its input and either F601 or F602 as its secondary, allowing easy comparison of several control configurations.
ChE 4162 VTHX Operating Manual Fall 2014
Edited by: Harold J. Toups and Daniel B. Mowrey
3/17 8/21/2014
Figure 1. VTHX schematic diagram
Dimensional details of the two heat exchangers are shown in Figure 2. Range data for all instruments are given in Section 13 and pump head and capacity data are given in Section 14.

ChE 4162 VTHX Operating Manual Fall 2014
Edited by: Harold J. Toups and Daniel B. Mowrey
4/17 8/21/2014
Figure 2. Dimensional details of the VTHX heat exchangers.
3. Using the Honeywell Experion PKS Control System
Honeywell’s Experion is a distributed control system (DCS) widely used in industry and on many lab experiments here at LSU. In Experion, each process variable is represented by an entity called a Control Module (CM). Each CM is a collection of Function Blocks (FB). And each FB consists of many values called parameters. Within a CM (and sometimes between CM’s), the FB’s are “wired” together in various ways to monitor and control the process. Desired values of many parameters may be entered via the computer keyboard. The purpose of the next few sections is to explain how to use Experion to run this equipment.
4. Logging in to Honeywell
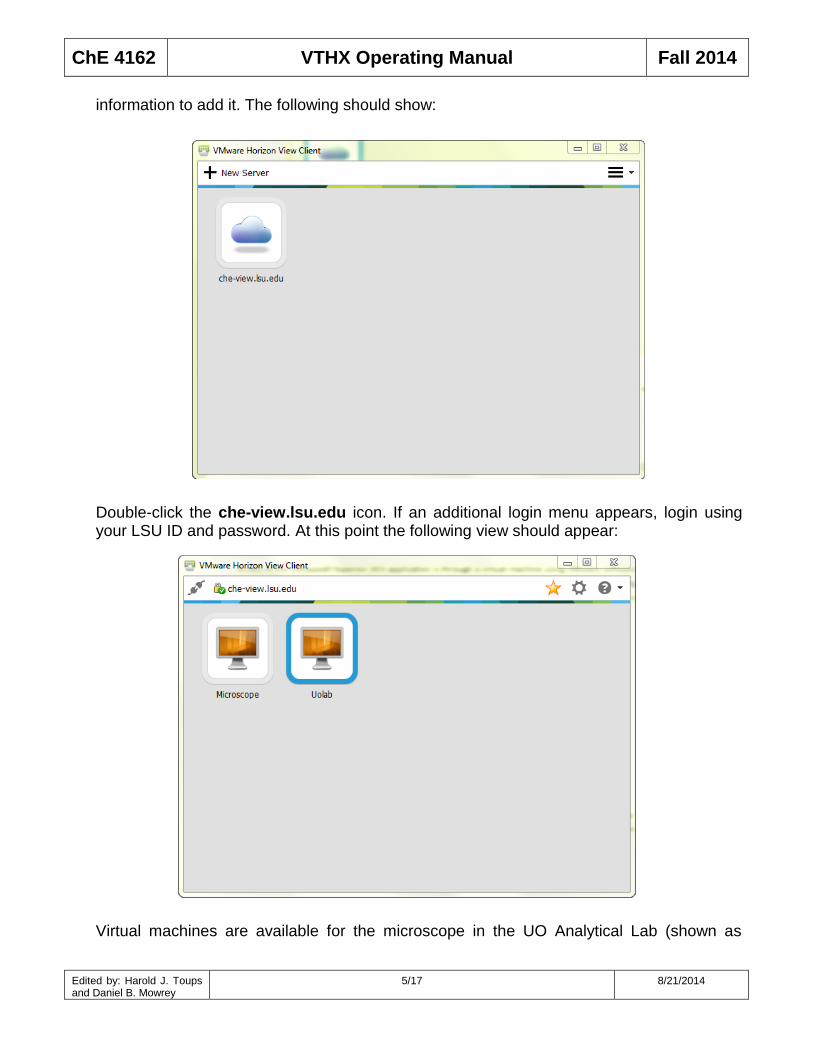
Access to the Honeywell Experion DCS application is through a virtual machine using VMware Horizon View software. After logging into one of the computers in the UO Control Room, among the icons on the desktop shown is the VMware Horizon View Client icon. Double-clicking this icon should bring up the following popup with the che-view.lsu.edu icon showing. If that icon does not appear, then click New Server; complete the requested
ChE 4162 VTHX Operating Manual Fall 2014
Edited by: Harold J. Toups and Daniel B. Mowrey
5/17 8/21/2014
information to add it. The following should show:
Double-click the che-view.lsu.edu icon. If an additional login menu appears, login using your LSU ID and password. At this point the following view should appear:
Virtual machines are available for the microscope in the UO Analytical Lab (shown as
ChE 4162 VTHX Operating Manual Fall 2014
Edited by: Harold J. Toups and Daniel B. Mowrey
6/17 8/21/2014
Microscope) and for access to the Honeywell DCS (shown as Uolab). Double-click the
Uolab icon. A splash screen for the virtual machine should appear with an OK button. Click
OK. The VMware software should start up a virtual machine and show you the desktop of
that machine.
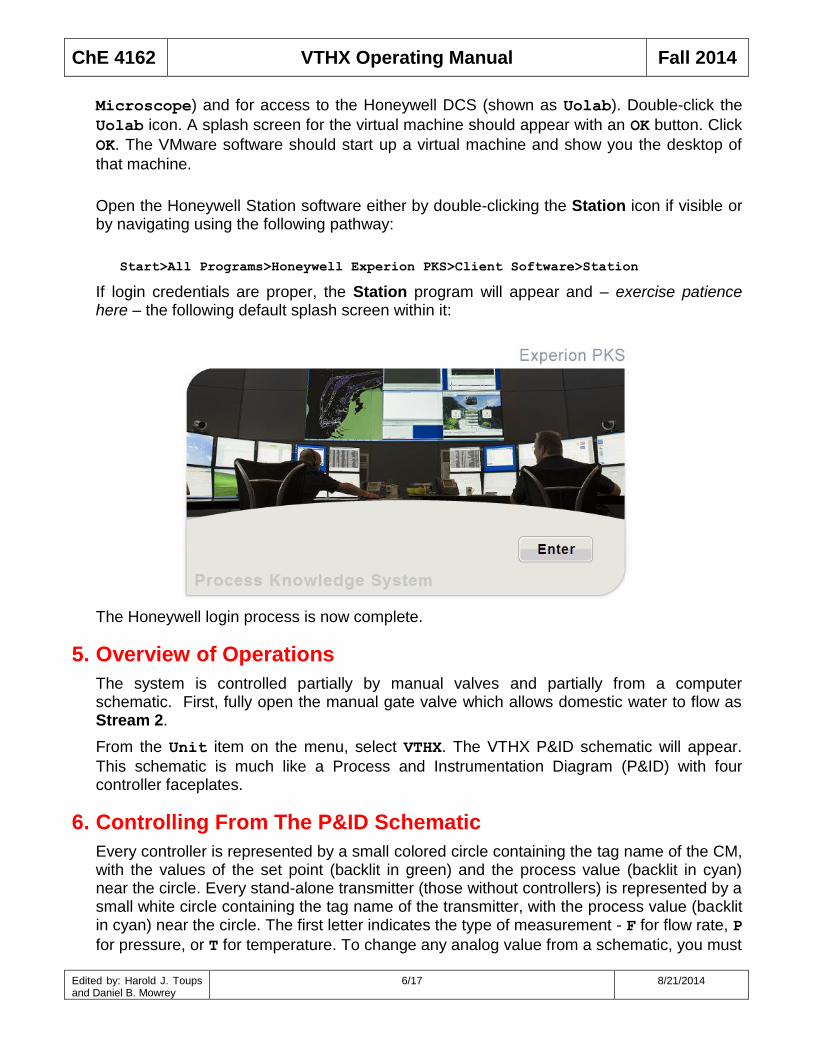
Open the Honeywell Station software either by double-clicking the Station icon if visible or by navigating using the following pathway:
Start>All Programs>Honeywell Experion PKS>Client Software>Station
If login credentials are proper, the Station program will appear and – exercise patience here – the following default splash screen within it:
The Honeywell login process is now complete.
5. Overview of Operations
The system is controlled partially by manual valves and partially from a computer schematic. First, fully open the manual gate valve which allows domestic water to flow as Stream 2.
From the Unit item on the menu, select VTHX. The VTHX P&ID schematic will appear.
This schematic is much like a Process and Instrumentation Diagram (P&ID) with four controller faceplates.
6. Controlling From The P&ID Schematic
Every controller is represented by a small colored circle containing the tag name of the CM, with the values of the set point (backlit in green) and the process value (backlit in cyan) near the circle. Every stand-alone transmitter (those without controllers) is represented by a small white circle containing the tag name of the transmitter, with the process value (backlit in cyan) near the circle. The first letter indicates the type of measurement - F for flow rate, P
for pressure, or T for temperature. To change any analog value from a schematic, you must
ChE 4162 VTHX Operating Manual Fall 2014
Edited by: Harold J. Toups and Daniel B. Mowrey
7/17 8/21/2014
click on it (if it can be changed, its backlighting will change), and then enter the new value. The changeable objects in this display are the SP values near each controller, and there are additional objects on the faceplates, all of which are explained below.
The main value associated with a controller or transmitter is the measured input, or process value (PV). In addition to the PV, controllers have several additional values, the most
important of which is the set point, or SP. A common example of a SP is the speed setting
on a cruise control - the controller will manipulate its output (the throttle position in this case) to move the PV to the SP and hold it there. The SP (in green) and the PV (in cyan) are
shown immediately to the side of the circle representing the controller. Just below these
values are the tuning constants (in tan): Kc (proportional gain), i (integral time constant, or
reset), and d (derivative time constant, or rate). The four small windows to the side of the P&ID are the faceplates for the four continuous controllers.
From a controller faceplate, you can see the tag name, description, engineering units, and several of the most important parameters on the controller. You can also change many of these parameters. Near the bottom of the faceplate is a combo box labeled MD, which can
be used to select the mode of the controller. Immediately above the mode are the OP
(changeable), the PV (not changeable) and the SP (changeable). To change the OP or SP,
single click the value, type in the new value and press ENTER. The SPs and tuning
constants on the schematic can be changed the same way.
7. Controller Modes
As mentioned above, a controller has an SP and an OP. The OP is always given in percent
(0-100%) and the SP has the same engineering units as the PV (in this experiment, the flow
rates are in lb/hr, the temperatures are in F, and the pressure is in psig).
When the controller mode is MANual, the OP is held until the operator changes it. When you
want to change it, simply click the OP in the faceplate, type in the new value, and press
ENTER. The new OP will be held until you change it again. Note that you may enter an OP
only while a controller is in MAN. When the mode is not MAN, the controller uses the PV,
SP and tuning constants to calculate the OP. When the mode is AUTOmatic, you may enter
a new SP to be used for control. Note that changing an SP affects the OP only while a
controller is in AUTO.
For practice, open the manual valve which allows domestic water to flow through Stream 2
and change the output of the Stream 2 flow rate controller (F602) to 50% (wait a few
seconds for the flow rate to reach steady state), and then set the output of the flow rate controller to 0% (wait a few more seconds). Now set the OP of the flow rate controller to
106.9% (for an air-to-close valve, this is known as “tight shutoff” in the Experion system). Notice the small bar under the control valve on the schematic – its length is proportional to the output.
Sometimes controllers are stand-alone (i.e. there are no connections to any other controller), and sometimes they are in a cascade structure (like the temperature-to-flow
rate (T602-to-F602) controllers in this equipment - cascade connections and
ChE 4162 VTHX Operating Manual Fall 2014
Edited by: Harold J. Toups and Daniel B. Mowrey
8/17 8/21/2014
instrumentation cables are indicated by dashed lines on the schematic). The upper controller in a cascade (the one sending its OP to another controller’s SP) is called the
primary and the lower controller (the one sending its OP to a valve) is called the
secondary. Secondary controllers require an additional mode so the computer system will know when to “close the cascade” (i.e. put the cascade structure fully on control). In the Experion system, this new mode is called CAScade. When the mode of the primary is AUTO
and the mode of the secondary is CAS, the cascade is said to be “closed” and the primary is
sending its OP to the SP of the secondary. When the mode of the secondary is AUTO, the
operator is responsible for changing the SP of the secondary to control the process.
The circle representing a controller is filled with a color which indicates the current mode of the controller. For all controllers, yellow means the mode is MAN. For primary controllers,
cyan means the mode of the primary is AUTO, but the mode of the secondary is not CAS
(i.e. the primary is ready to start sending new SPs as soon as the secondary goes to CAS).
For secondary controllers, cyan means the mode is AUTO (i.e. any new SP must come from
you, not from the primary). And finally, for all controllers, white means the mode is in its normal state - fully on control, which is AUTO for primary controllers and CAS for secondary
controllers. For practice, set both the VTHX temperature and Stream 2 flow rate controllers to AUTO. Notice that the background of both controllers changed from yellow to cyan. Now
set the Stream 2 flow rate controller to CAS (i.e. close the cascade). Notice the change in
background colors of both the primary and secondary controllers. Now put both controllers back in MAN and set the flow rate OP back to 106.9% to stop the flow.
8. Sampled Data Control
Unlike dedicated analog instrumentation for process control, the Honeywell Experion uses microprocessor-based digital computers to perform regulatory control tasks. It uses workstation and server PC’s to configure the system, build control strategies and schematics, gather and display data, etc. The calculations in such systems are typically performed at regular intervals of time. The time between two consecutive data readings is referred to as the sampling time and such systems are referred to as sampled data systems. The sampling time used in this Experion system is one (1) second. All data are collected each second, control algorithms processed, and all outputs resent each second.
9. Display Navigation
When you logged into Flex Station, you used an item from the menu bar to call up the main VTHX schematic. There are several additional ways to go from one display to another. For example, you can enter the tag name of a controller in the Command field at the top of the screen and press F12 to call up the detail display. Try it with your flow rate controller
(F601). For a controller, the detail display has 7 tabs. The one labeled LOOP TUNE may be
useful for tuning your flow rate controller.
Most of the toolbar buttons are used for navigation – some require a name or number to be entered, and some go directly to the display. Most of the same functions are on the function keys. For example, to return to the previous display, click , or press F8. To return to the
display before that, do it again.
ChE 4162 VTHX Operating Manual Fall 2014
Edited by: Harold J. Toups and Daniel B. Mowrey
9/17 8/21/2014
From most displays (both system displays and custom schematics such as VTHX), double
clicking any value associated with a CM will take you to its detail display. From a detail display, click or press F2 to return to the main VTHX schematic. On most custom
schematics there may also be buttons to quickly get you from one display to another.
10. Using Trends
There are two buttons labeled “Trend 60” and “Trend 61” on the main VTHX schematic to call up trends. These trend buttons display the PV’s, SP’s and OP’s of the controllers and
the PV’s of the transmitters. Trend 60 shows the interactions between the two temperature
controllers. With both temperature controllers on control, a well-tuned system will bring the
system back to steady state (i.e. both temperatures within 0.5F of SP) within 8 minutes of
any reasonable disturbance or set point change. Click the Trend 60 button.
At the bottom of the trend is the legend with all the tag.block.parameters associated
with the traces. The checkboxes in the Pen column indicate which traces are currently on
the trend. Click on the chart area of the trend and a white hairline cursor appears on the chart and the values at the hairline cursor appear in the Reference Value column of the
legend. Along the bottom of the chart area is a horizontal scroll bar which allows you to scroll the chart area back and forth in time. Along the left axis are the low and high ranges of the selected trace. These allow you to change the range of the trace for the selected parameter. Practice by changing the range of the Stream 1 temperature PV to 120-180.
Immediately above the left side of the chart area is a combo box which allows you to select one of the traces (you may also click anywhere on the line for this trace in the legend area). When you select an active trace, it is highlighted (thicker) in the chart area. Above the right side of the chart area is the Period combo box which allows you to select how much data
(time wise) is displayed in the chart area. To the right of that is the Interval combo box
which allows you to select the interval between points in the chart area. Practice changing to a different period and interval. Leave the period set to 1 day and the interval at 1 minute for now.
For practice, scroll back until some variation in some of the traces appears. Notice that the timestamps below the chart area change as you scroll. Find some local max or min in one of the traces and click or drag the hairline to it. Now change the period back to one hour and notice that the cursor is centered on (or at least near) the local max or min. If necessary, move the hairline so it is exactly on the peak or valley and notice that the values, as well as the date and time, are shown in the Reference Value column in the
legend. Now return the trend to the current time by clicking .
All changes you make to the trend can be saved by clicking the familiar Windows Save icon just above the right end of the chart area next to the word (Modifed).
11. Saving data into Excel
Tuning the controllers will require analysis of a great deal of data in the time domain (Romagnoli and Palazoglu 2006, 83 ff.). To collect this data, an Excel workbook containing a Visual Basic Add-In is provided. On the Desktop, look for a folder named
ChE 4162 VTHX Operating Manual Fall 2014
Edited by: Harold J. Toups and Daniel B. Mowrey
10/17 8/21/2014
Excel SpreadSheets
Within that folder, open the folder named
snr
and double click on VTHXRecorder.xls. The workbook will open with a Start button, the
experiment name, a collection frequency Combo Box, and a Stop button on the top line.
Click on the Start button, and the workbook will start collecting the relevant data at the
specified collection frequency. These data will be extremely useful in analyzing your results. While the workbook is collecting data, it may be scrolled, but you should not attempt to do anything else in this instance of Excel until after you click on the Stop button.
If you do, the collector may stop and you may lose valuable data.
When you finish a run, click on the Stop button and cut or copy whatever data you need
into your daily workbook in a separate instance of Excel. Let the workbook collect data while you complete the following step for practice.
12. Default Startup Procedure
The following procedure can be used to startup the VTHX unit prior to tuning controllers:
If data collection will be needed, follow the Saving data into Excel instructions described in the previous section.
Fully open the gate valve which allows domestic water into Stream 2, and close the gate valve which allows filling the overhead tank after ensuring that the level in the overhead tank indicates one-quarter to two-thirds full. [Use the gate valve to fill; use the appropriate drain valve (and hose, if necessary) to empty.]
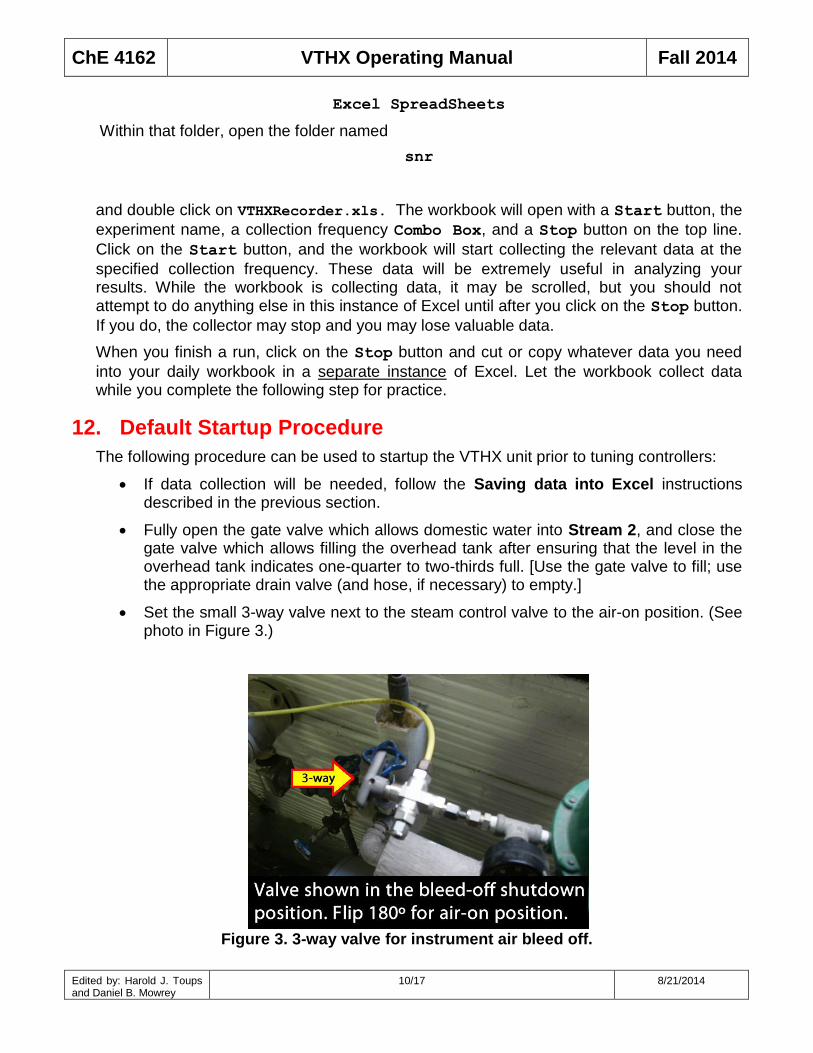
Set the small 3-way valve next to the steam control valve to the air-on position. (See photo in Figure 3.)
Figure 3. 3-way valve for instrument air bleed off.
ChE 4162 VTHX Operating Manual Fall 2014
Edited by: Harold J. Toups and Daniel B. Mowrey
11/17 8/21/2014
Set the OP’s of F601 and F602 to 50%.
Turn on the pump.
Leave all controllers in MAN, adjust the F601 and F602 OP’s so that both stream
flow rates are about 4000 lb/hr.
Set the OP of T601 to 50%.
Temperatures will eventually come to steady state and the unit is ready for further testing or tuning of controllers.
13. Manual Control Training Exercise
Now practice controlling the experiment manually from the Experion Flex Station:
If the Excel spreadsheet is not already collecting data, click the Start button.
Follow the Default Startup Procedure described in the previous section.
When the temperatures come to steady state, adjust the steam OP to raise the
Stream 1 output from the STHX by 10F.
Click on the Stop button in the Excel spreadsheet.
Practice saving the data to another spreadsheet in a separate instance of Excel (do not copy or cut the buttons or the combo box), then save that workbook to your desktop on this workstation, and finally save that copy to your groups’ directory using COPY/PASTE (not
SAVE AS…).
14. Adjusting Upstream Supply Steam Pressure
With instructor permission, the pressure of the upstream supply steam to the STHX can be adjusted to meet operational or program objective needs. As this same steam supply also services other equipment in Rm. 164, additional coordination may be required.
The following procedure can be followed to make adjustments to the upstream steam supply:
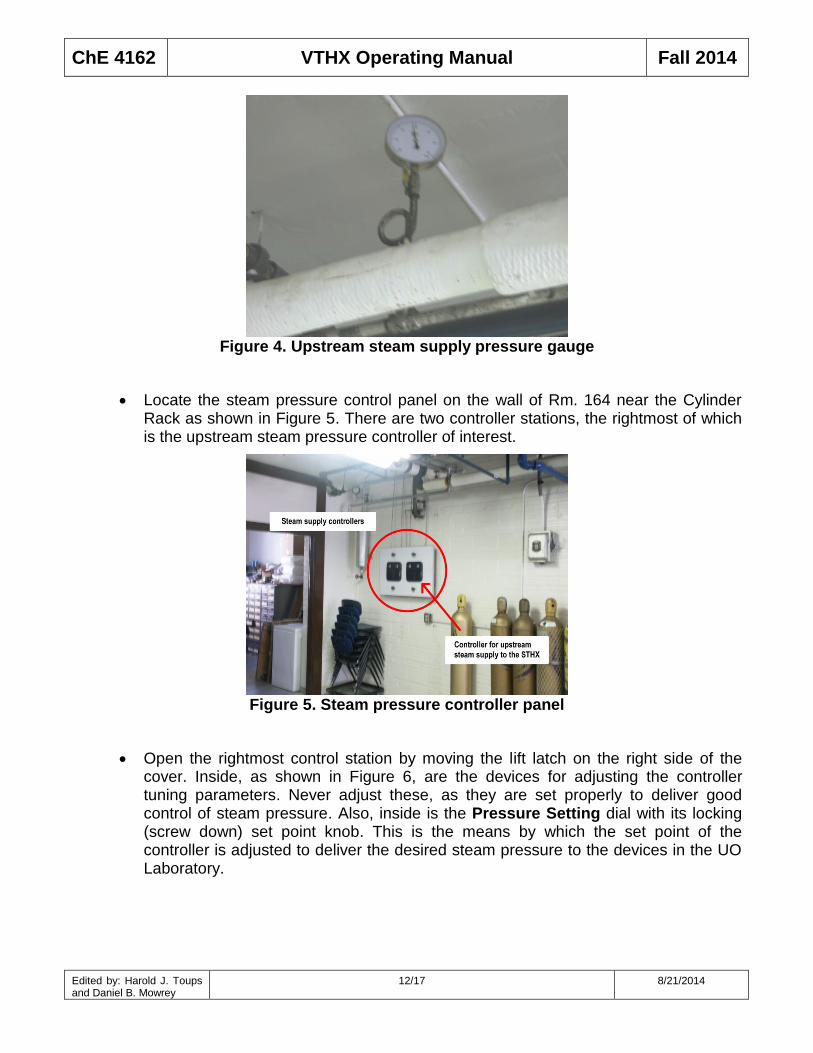
Check the current upstream supply pressure by observing the pressure gauge in the piping above the Rm. 164 Cylinder Rack. If steam is currently in use, this gauge should normally read roughly 20 psig. If steam is blocked out to the STHX, then the pressure reading will be slightly elevated. A photo of this gauge is shown in Figure 4.
ChE 4162 VTHX Operating Manual Fall 2014
Edited by: Harold J. Toups and Daniel B. Mowrey
12/17 8/21/2014
Figure 4. Upstream steam supply pressure gauge
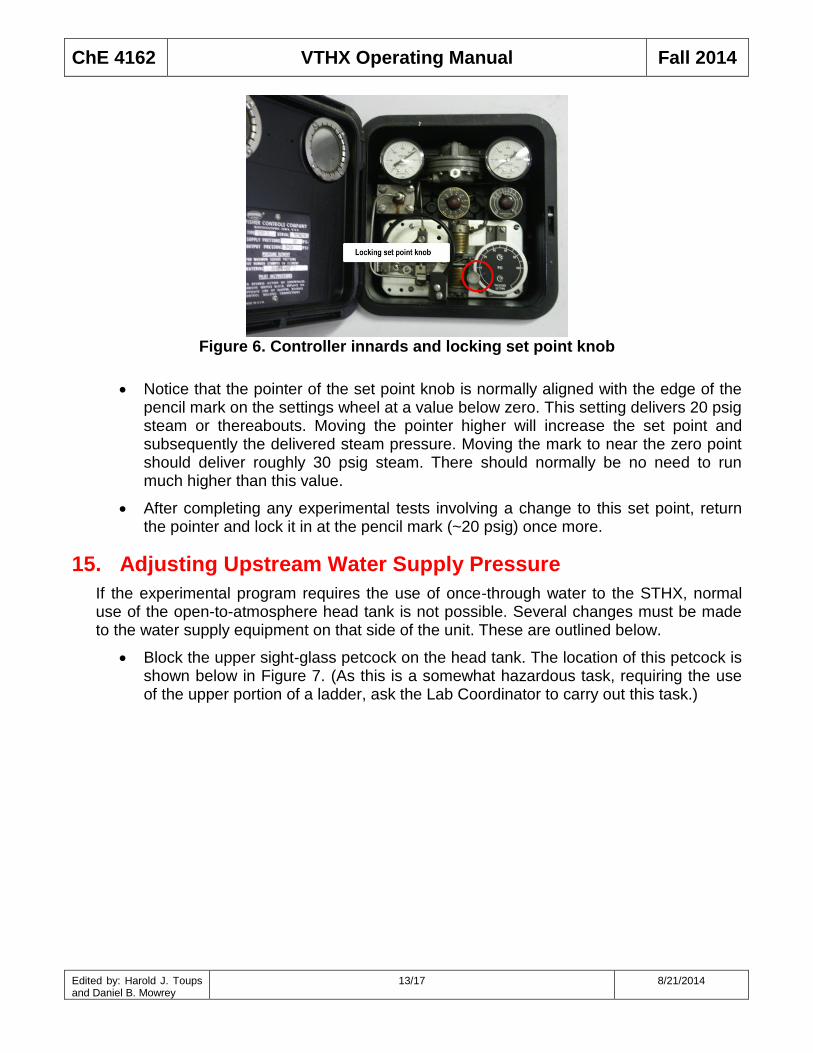
Locate the steam pressure control panel on the wall of Rm. 164 near the Cylinder Rack as shown in Figure 5. There are two controller stations, the rightmost of which is the upstream steam pressure controller of interest.
Figure 5. Steam pressure controller panel
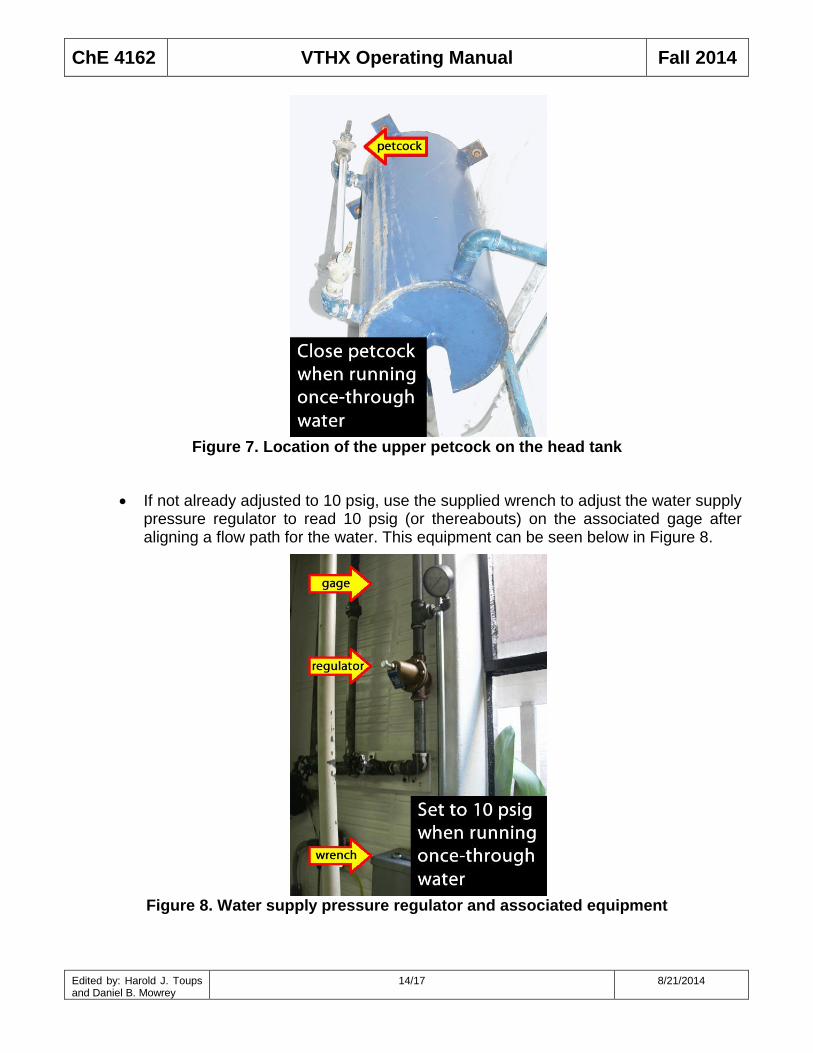
Open the rightmost control station by moving the lift latch on the right side of the cover. Inside, as shown in Figure 6, are the devices for adjusting the controller tuning parameters. Never adjust these, as they are set properly to deliver good control of steam pressure. Also, inside is the Pressure Setting dial with its locking (screw down) set point knob. This is the means by which the set point of the controller is adjusted to deliver the desired steam pressure to the devices in the UO Laboratory.
ChE 4162 VTHX Operating Manual Fall 2014
Edited by: Harold J. Toups and Daniel B. Mowrey
13/17 8/21/2014
Figure 6. Controller innards and locking set point knob
Notice that the pointer of the set point knob is normally aligned with the edge of the pencil mark on the settings wheel at a value below zero. This setting delivers 20 psig steam or thereabouts. Moving the pointer higher will increase the set point and subsequently the delivered steam pressure. Moving the mark to near the zero point should deliver roughly 30 psig steam. There should normally be no need to run much higher than this value.
After completing any experimental tests involving a change to this set point, return the pointer and lock it in at the pencil mark (~20 psig) once more.
15. Adjusting Upstream Water Supply Pressure
If the experimental program requires the use of once-through water to the STHX, normal use of the open-to-atmosphere head tank is not possible. Several changes must be made to the water supply equipment on that side of the unit. These are outlined below.
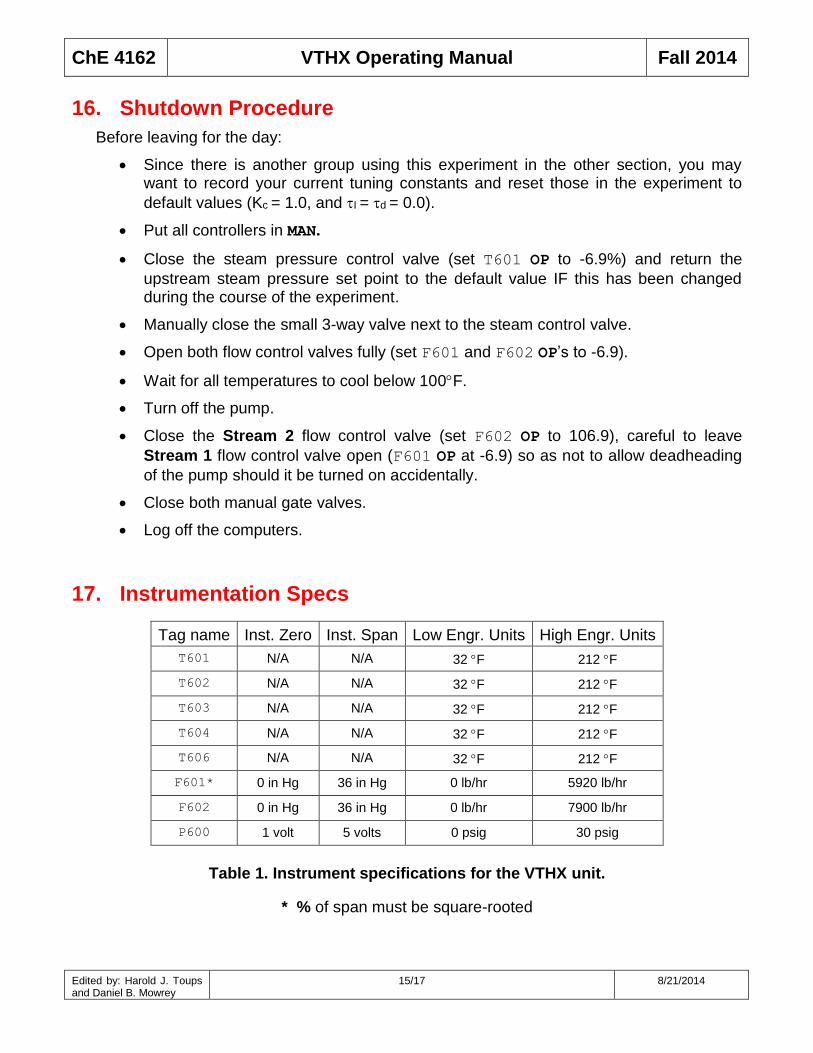
Block the upper sight-glass petcock on the head tank. The location of this petcock is shown below in Figure 7. (As this is a somewhat hazardous task, requiring the use of the upper portion of a ladder, ask the Lab Coordinator to carry out this task.)
ChE 4162 VTHX Operating Manual Fall 2014
Edited by: Harold J. Toups and Daniel B. Mowrey
14/17 8/21/2014
Figure 7. Location of the upper petcock on the head tank
If not already adjusted to 10 psig, use the supplied wrench to adjust the water supply pressure regulator to read 10 psig (or thereabouts) on the associated gage after aligning a flow path for the water. This equipment can be seen below in Figure 8.
Figure 8. Water supply pressure regulator and associated equipment
ChE 4162 VTHX Operating Manual Fall 2014
Edited by: Harold J. Toups and Daniel B. Mowrey
15/17 8/21/2014
16. Shutdown Procedure
Before leaving for the day:
Since there is another group using this experiment in the other section, you may want to record your current tuning constants and reset those in the experiment to
default values (Kc = 1.0, and I = d = 0.0).
Put all controllers in MAN.
Close the steam pressure control valve (set T601 OP to -6.9%) and return the
upstream steam pressure set point to the default value IF this has been changed during the course of the experiment.
Manually close the small 3-way valve next to the steam control valve.
Open both flow control valves fully (set F601 and F602 OP’s to -6.9).
Wait for all temperatures to cool below 100F.
Turn off the pump.
Close the Stream 2 flow control valve (set F602 OP to 106.9), careful to leave
Stream 1 flow control valve open (F601 OP at -6.9) so as not to allow deadheading
of the pump should it be turned on accidentally.
Close both manual gate valves.
Log off the computers.
17. Instrumentation Specs
Tag name Inst. Zero Inst. Span Low Engr. Units High Engr. Units
T601 N/A N/A 32 F 212 F
T602 N/A N/A 32 F 212 F
T603 N/A N/A 32 F 212 F
T604 N/A N/A 32 F 212 F
T606 N/A N/A 32 F 212 F
F601* 0 in Hg 36 in Hg 0 lb/hr 5920 lb/hr
F602 0 in Hg 36 in Hg 0 lb/hr 7900 lb/hr
P600 1 volt 5 volts 0 psig 30 psig
Table 1. Instrument specifications for the VTHX unit.
* % of span must be square-rooted
ChE 4162 VTHX Operating Manual Fall 2014
Edited by: Harold J. Toups and Daniel B. Mowrey
16/17 8/21/2014
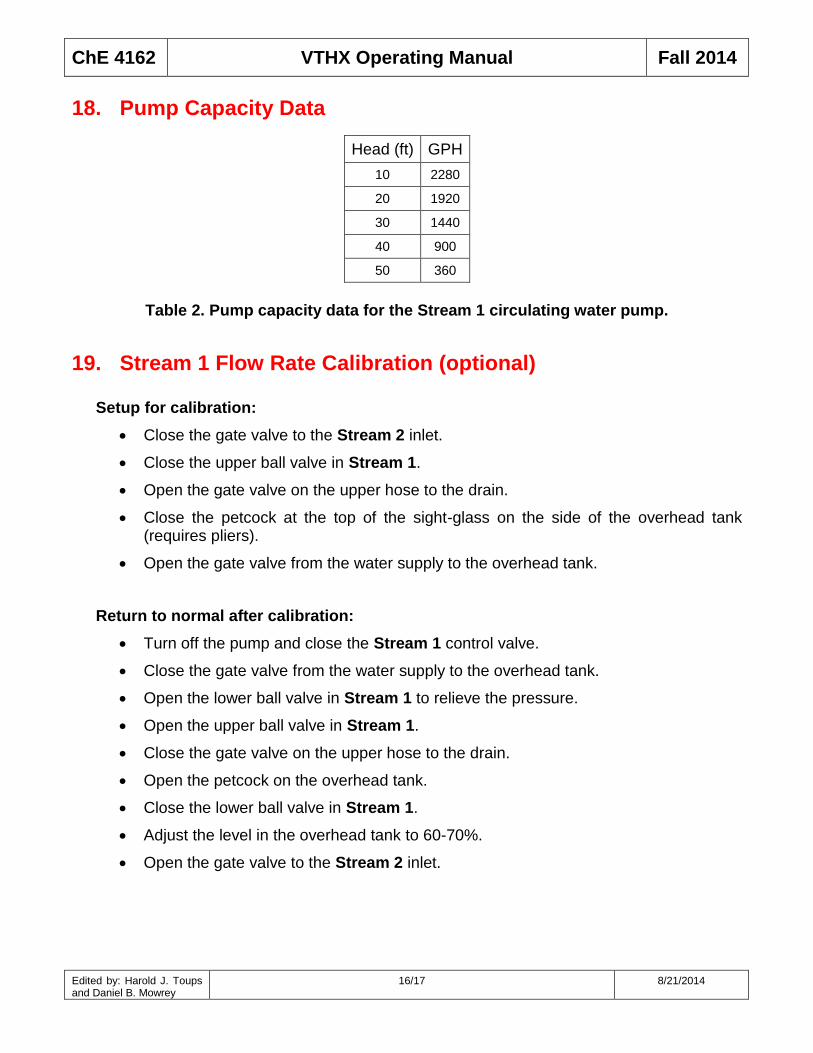
18. Pump Capacity Data
Head (ft) GPH
10 2280
20 1920
30 1440
40 900
50 360
Table 2. Pump capacity data for the Stream 1 circulating water pump.
19. Stream 1 Flow Rate Calibration (optional)
Setup for calibration:
Close the gate valve to the Stream 2 inlet.
Close the upper ball valve in Stream 1.
Open the gate valve on the upper hose to the drain.
Close the petcock at the top of the sight-glass on the side of the overhead tank (requires pliers).
Open the gate valve from the water supply to the overhead tank.
Return to normal after calibration:
Turn off the pump and close the Stream 1 control valve.
Close the gate valve from the water supply to the overhead tank.
Open the lower ball valve in Stream 1 to relieve the pressure.
Open the upper ball valve in Stream 1.
Close the gate valve on the upper hose to the drain.
Open the petcock on the overhead tank.
Close the lower ball valve in Stream 1.
Adjust the level in the overhead tank to 60-70%.
Open the gate valve to the Stream 2 inlet.
ChE 4162 VTHX Operating Manual Fall 2014
Edited by: Harold J. Toups and Daniel B. Mowrey
17/17 8/21/2014
20. Safety Considerations
Hot Water Hazard
If the temperature of Stream 1 rises above 185 F, some water may be forced out of the overhead tank and through the copper pipe that exits in the floor trough drain. This water may be hot enough to cause serious burns if it splashes onto skin. If this occurs, immediately flush any affected area with plenty of cold water for several minutes.
To minimize the possibility of the temperature getting this high, a safety interlock has been implemented which puts the steam pressure controller into MAN and closes the steam valve.
Slipping Hazard
Water spillage onto the laboratory floor represents a slipping hazard. Any spills must be mopped up to remove this hazard.
21. References
McCabe, Warren L, Julian C Smith, and Peter Harriott. Unit Operations of Chemical Engineering. 7th Edition. New York: McGraw-Hill, 2005.
Perry, Robert H, Don W Green, and James O Maloney, . Perry's Chemical Engineers' Handbook. New York: McGraw-Hill, 1997.
Romagnoli, Jose A, and Ahmet Palazoglu. Introduction to Process Control. Boca Raton: Taylor & Francis, 2006.