Embed Size (px)
Citation preview
Introduction
Improved knowledge on the atmosphere as part of
the climate system, on regional weather as well as on
effects of land use change and management requires
better understanding of land-surface atmosphere
interactions at different scales. The research project
VERTIKO aimed at measuring and modelling vertical
transports (momentum, energy, trace gases) in the
atmospheric boundary layer as a spatial mean above
inhomogeneous terrain. It questioned the appropri-
ate spatial and temporal resolution to describe land-
surface atmosphere interactions adequately. This
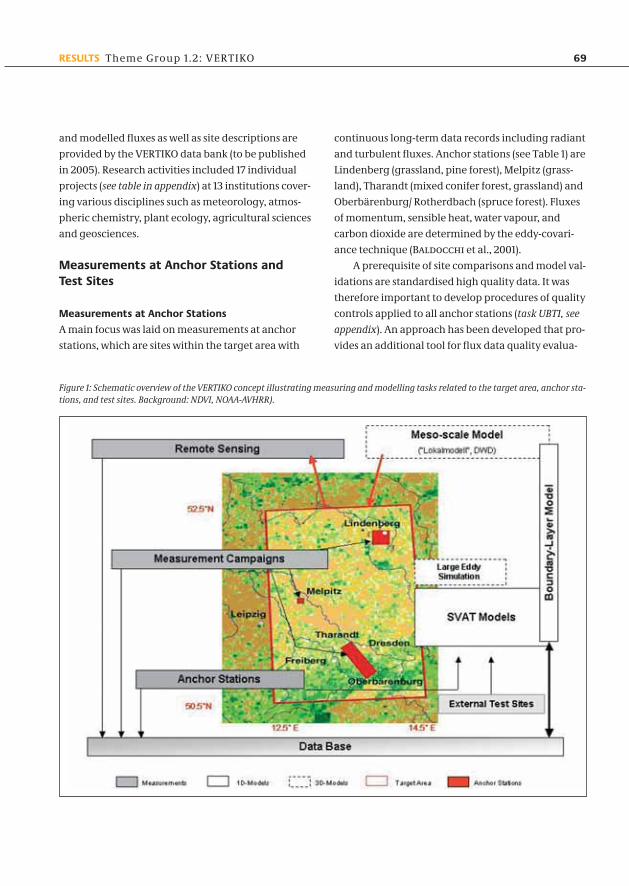
was investigated for a specific target area in eastern
Germany comprising 30,000 km2 from the Erzge-
birge (Ore Mountains) to the Oder-Spree lake district
(Figure 1). Continuous measurements and measure-
ment campaigns were conducted at anchor stations
of different land use types in the target area supple-
mented by data sets from external sites (test sites).
Spatial integration is achieved by remote sensing
(AVHRR, Landsat TM, Meteosat 6/7/8) in connection
with a model hierarchy of SVAT/BGC models, a
boundary-layer model and the mesoscale model
(Lokalmodell) of the German Meteorological Service,
DWD. Data on meteorological variables, measured
68 Theme Group 1.2: VERTIKO RESULTS
Vertical transports of energy and trace gases atanchor stations and their spatial and temporalextrapolation under complex natural conditions
Ch. Bernhofer 1, B. Köstner1, K. Arnold15, S. Atashfaraz6, J. Bange9, A. B. Baums1, F. H. Berger1, F. Beyrich3,
K. Butterbach-Bah18, E. Brüggemann7, N. Brüggemann8, U. Dämmgen 4, E. Falge13, Ch. Feigenwinter11,
B. Fischer1, Th. Foken12, M. Göckede12, V. Goldberg1, G. Gravenhorst6, A. Grüner7, L. Grünhage5, T. Grünwald1,
M. Haggagy2, H. Herrmann7, M. Herold14, F. Imbery2, A.Ibrom6, M. Kesik8, M. O. Letzel14, Ch. Li8, C. Liebethal12,
A. Lohse1, J. Matschullat10, A. Matzarakis2, M. Mauder12, H. Mayer2, P. Miehle8, A. Oltchev6, K. Pleßow10,
R. Queck1, A. Raabe15, S. Raasch14, S. Reth13, J. Rost2, S. Schaaf4, M. Schröter14, A. Schwiebus1, T. Spieß9),
G. Spindler7, B. Stiller3, J. D. Tenhunen13, R. Vogt11, M. Wagner1, H.-J. Weigel4, A. Ziemann15, F. Zimmermann10,
P. Zittel9,
1 TU Dresden, Institut für Hydrologie und Meteorologie, Professur Meteorologie, 2 Albert-Ludwigs-Universität
Freiburg, Meteorologisches Institut, 3 Deutscher Wetterdienst, Meteorologisches Observatorium Lindenberg,4 Bundesforschungsanstalt für Landwirtschaft Braunschweig, Institut für Agrarökologie, 5 Justus-Liebig-Universität
Giessen, Institut für Pflanzenökologie, 6 Georg-August Universität Göttingen, Institut für Bioklimatologie, 7 Leibniz-Institut für Troposphärenforschung e.V., Leipzig, 8 Forschungszentrum Karlsruhe GmbH, Institut für Meteo-
rologie und Klimaforschung - Atmosphärische Umweltforschung, Garmisch Partenkirchen, 9 Technische Universität Braunschweig, Institut für Luft- und Raumfahrtsysteme, 10 TU Bergakademie Freiberg, Inter-
disziplinäres Ökologisches Zentrum, 11 Universität Basel, Institut für Meteorologie, Klimatologie und Fernerkundung,12 Universität Bayreuth, Mikrometeorologie, 13 Universität Bayreuth, Pflanzenökologie,14 Universität Hannover, Institut für Meteorologie und Klimatologie, 15 Universität Leipzig, Institut für
Meteorologie
AFO_002 21.07.2005 13:06 Uhr Seite 68
69RESULTS Theme Group 1.2: VERTIKO
and modelled fluxes as well as site descriptions are
provided by the VERTIKO data bank (to be published
in 2005). Research activities included 17 individual
projects (see table in appendix) at 13 institutions cover-
ing various disciplines such as meteorology, atmos-
pheric chemistry, plant ecology, agricultural sciences
and geosciences.
Measurements at Anchor Stations and Test Sites
Measurements at Anchor Stations
A main focus was laid on measurements at anchor
stations, which are sites within the target area with
continuous long-term data records including radiant
and turbulent fluxes. Anchor stations (see Table 1) are
Lindenberg (grassland, pine forest), Melpitz (grass-
land), Tharandt (mixed conifer forest, grassland) and
Oberbärenburg/ Rotherdbach (spruce forest). Fluxes
of momentum, sensible heat, water vapour, and
carbon dioxide are determined by the eddy-covari-
ance technique (Baldocchi et al., 2001).
A prerequisite of site comparisons and model val-
idations are standardised high quality data. It was
therefore important to develop procedures of quality
controls applied to all anchor stations (task UBT1, see
appendix). An approach has been developed that pro-
vides an additional tool for flux data quality evalua-
Figure 1: Schematic overview of the VERTIKO concept illustrating measuring and modelling tasks related to the target area, anchor sta-tions, and test sites. Background: NDVI, NOAA-AVHRR).
AFO_002 21.07.2005 13:06 Uhr Seite 69
tion at meteorological measurement sites in complex
terrain (Gödecke et al., 2004a, 2004b). It combines
the quality assessment tools for eddy covariance
measurements of Foken and Wichura (1996) with
the forward Lagrangian stochastic footprint model of
Rannik et al. (2003). In a pre-processing step, the
microscale aggregation model of Hasager and
Jensen (1999) is implemented to provide effective
roughness lengths as input for the footprint analyses.
This combination yields the dominating quality flag
for the different observed fluxes and the relative flux
contribution of each cell to the total measured flux.
The analysis can provide results for different strat-
ification regimes, and may also be applied to produce
maps of footprint averaged meteorological parame-
ters such as the vertical wind component w. Another
important output option is the determination of the
contribution of each land use type to the measured
flux. The procedure presented is especially useful for
the interpretation of results from monitoring stations
situated in heterogeneous terrain. The contribution
of the target land use type to the total flux can be
assessed for any user-defined period, indicating how
representative the measurements are for that specific
kind of surface cover. The approach can be employed
to evaluate the performance of a coordinate rotation
method such as the Planar Fit approach, and in addi-
tion proves to be a powerful tool for the identification
and visualisation of factors distorting the measure-
ments. Within the VERTIKO project, this site evalua-
tion tool has been applied to the test site Waldstein
Weidenbrunnen, and to the Anchor Stations Tha-
randt, Lindenberg (pine forest) and Oberbärenburg.
The grassland Anchor Station Melpitz was evaluated
with a limited version of the approach. In close coop-
eration with the DEKLIM project EVA-GRIPS and part-
ners within the European project CARBOEUROPE-IP, a
state-of-the-art software tool was developed to calcu-
late turbulent fluxes from eddy covariance raw data.
Besides the usual set of correction methods, this
system includes the Planar-Fit coordinate rotation
method, footprint applications, and a number of
additional tools to evaluate the flux data quality. The
developed quality control and site evaluation tools
have been chosen as reference procedures to evaluate
and compare more than 100 flux monitoring sites
within the CARBOEUROPE-IP.
70 Theme Group 1.2: VERTIKO RESULTS
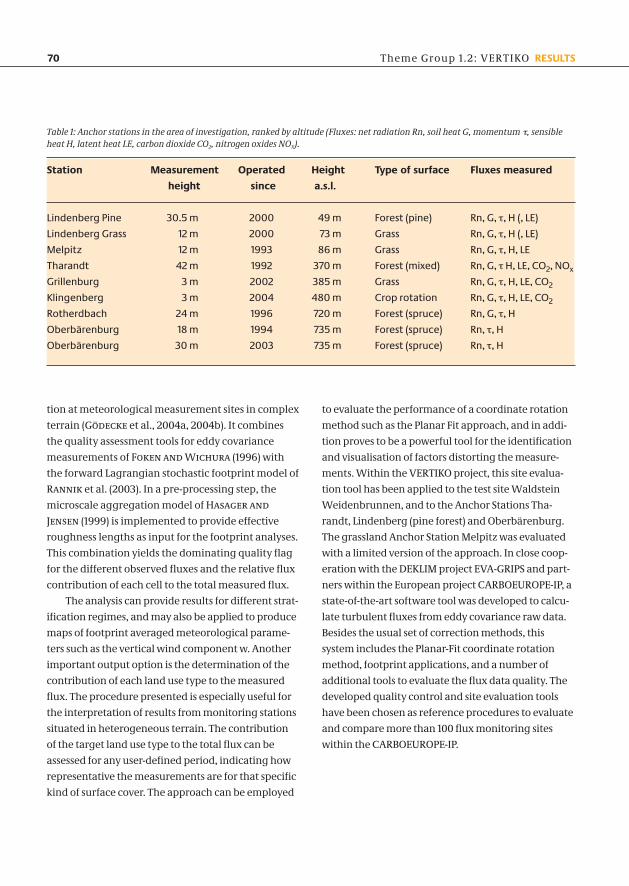
Table 1: Anchor stations in the area of investigation, ranked by altitude (Fluxes: net radiation Rn, soil heat G, momentum τ, sensibleheat H, latent heat LE, carbon dioxide CO2, nitrogen oxides NOX).
Station Measurement Operated Height Type of surface Fluxes measured
height since a.s.l.
Lindenberg Pine 30.5 m 2000 49 m Forest (pine) Rn, G, τ, H (, LE)
Lindenberg Grass 12 m 2000 73 m Grass Rn, G, τ, H (, LE)
Melpitz 12 m 1993 86 m Grass Rn, G, τ, H, LE
Tharandt 42 m 1992 370 m Forest (mixed) Rn, G, τ H, LE, CO2, NOx
Grillenburg 3 m 2002 385 m Grass Rn, G, τ, H, LE, CO2
Klingenberg 3 m 2004 480 m Crop rotation Rn, G, τ, H, LE, CO2
Rotherdbach 24 m 1996 720 m Forest (spruce) Rn, G, τ, H
Oberbärenburg 18 m 1994 735 m Forest (spruce) Rn, τ, H
Oberbärenburg 30 m 2003 735 m Forest (spruce) Rn, τ, H
AFO_002 21.07.2005 13:06 Uhr Seite 70
71RESULTS Theme Group 1.2: VERTIKO
Footprint approaches were also realised to compare
different measurement systems, and to assess the
data quality within measurement campaigns. For
example, the scatter between CO2-fluxes derived by a
closed soil chamber system on the one hand, and
eddy covariance measurements on the other, could
be significantly reduced by use of a footprint filter
(Reth et al., 2004). Further studies concerned the
development of an approach to estimate the source
areas for line source measurements, such as scintil-
lometers. For all measurement complexes involved
in the STINHO experiments (see below), footprint
studies were conducted in order to assess their
spatial representativeness, and thus to improve the
input data set for the subsequent large eddy simula-
tion study.
The Anchor Station Lindenberg, operated by the
Meteorological Observatory of the German Meteoro-
logical Service (DWD) contributed continuous long-
term measurements of energy fluxes (short wave and
long wave radiation, turbulent heat fluxes, soil heat
flux) over different land use types (grassland and
forest) in flat terrain (task DWD1). Further, basic
micrometeorological parameters (wind, tempera-
ture, humidity, precipitation, soil parameters) over
grass and at a forest site (pine) have been performed
continuously over the project period. In addition,
seasonal measurements (between April and Novem-
ber) were carried out over water regularly every year.
After intensive quality controls the data were used to
force and to validate different types of numerical
models within VERTIKO (SVAT models, LES, LM, cf.
chap. “4. Model Integration”).
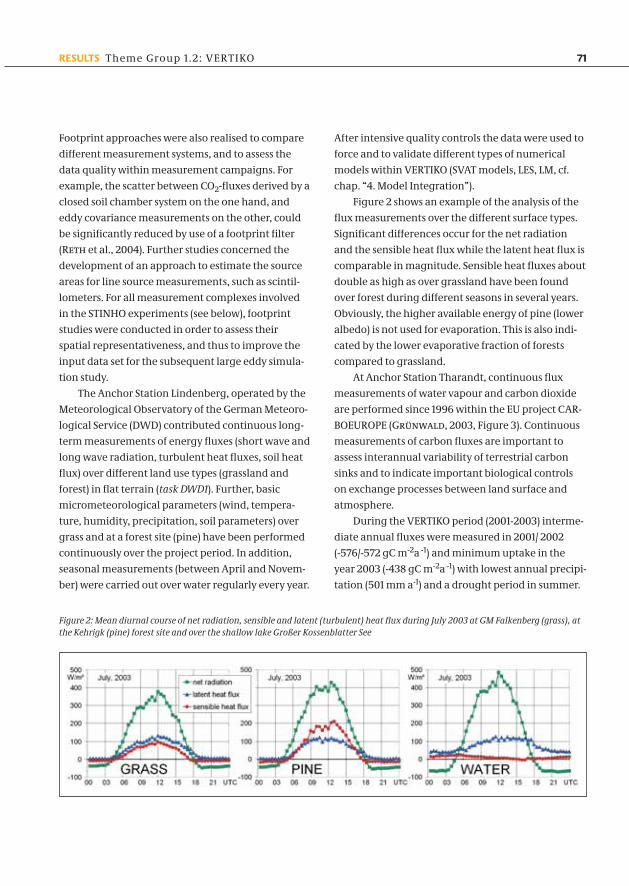
Figure 2 shows an example of the analysis of the
flux measurements over the different surface types.
Significant differences occur for the net radiation
and the sensible heat flux while the latent heat flux is
comparable in magnitude. Sensible heat fluxes about
double as high as over grassland have been found
over forest during different seasons in several years.
Obviously, the higher available energy of pine (lower
albedo) is not used for evaporation. This is also indi-
cated by the lower evaporative fraction of forests
compared to grassland.
At Anchor Station Tharandt, continuous flux
measurements of water vapour and carbon dioxide
are performed since 1996 within the EU project CAR-
BOEUROPE (Grünwald, 2003, Figure 3). Continuous
measurements of carbon fluxes are important to
assess interannual variability of terrestrial carbon
sinks and to indicate important biological controls
on exchange processes between land surface and
atmosphere.
During the VERTIKO period (2001-2003) interme-
diate annual fluxes were measured in 2001/ 2002
(-576/-572 gC m-2a -1) and minimum uptake in the
year 2003 (-438 gC m-2a -1) with lowest annual precipi-
tation (501 mm a-1) and a drought period in summer.
Figure 2: Mean diurnal course of net radiation, sensible and latent (turbulent) heat flux during July 2003 at GM Falkenberg (grass), atthe Kehrigk (pine) forest site and over the shallow lake Großer Kossenblatter See
AFO_002 21.07.2005 13:06 Uhr Seite 71
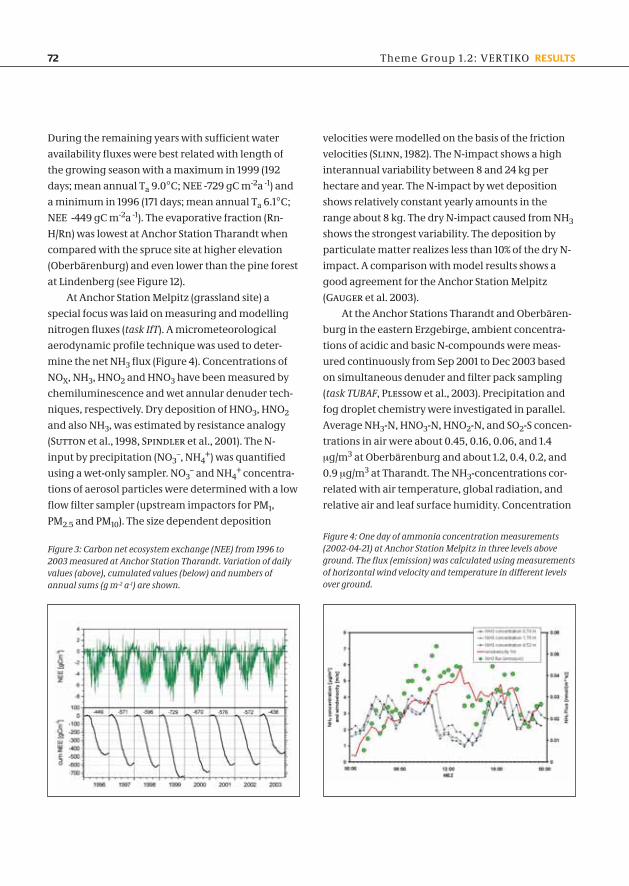
During the remaining years with sufficient water
availability fluxes were best related with length of
the growing season with a maximum in 1999 (192
days; mean annual Ta 9.0°C; NEE -729 gC m-2a -1) and
a minimum in 1996 (171 days; mean annual Ta 6.1°C;
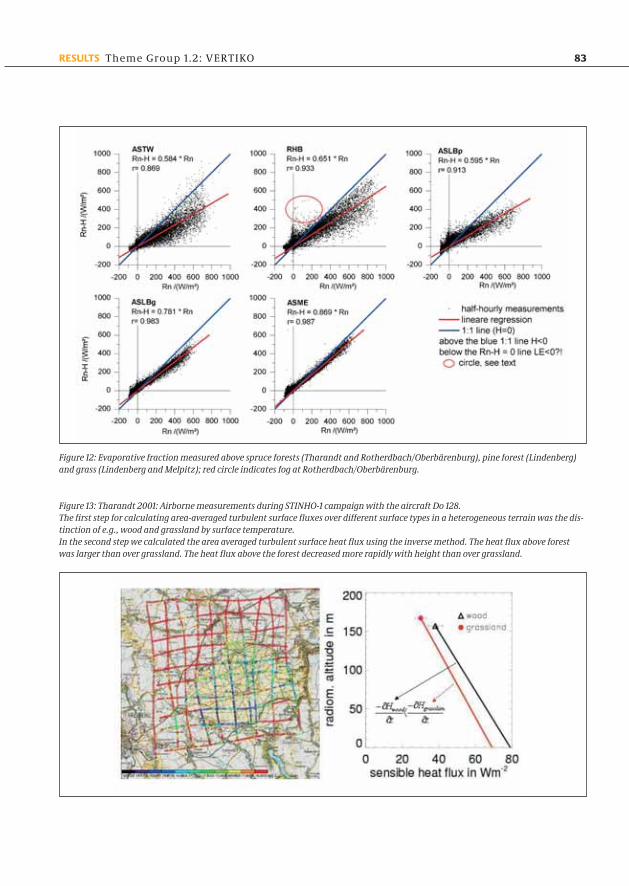
NEE -449 gC m-2a -1). The evaporative fraction (Rn-
H/Rn) was lowest at Anchor Station Tharandt when
compared with the spruce site at higher elevation
(Oberbärenburg) and even lower than the pine forest
at Lindenberg (see Figure 12).
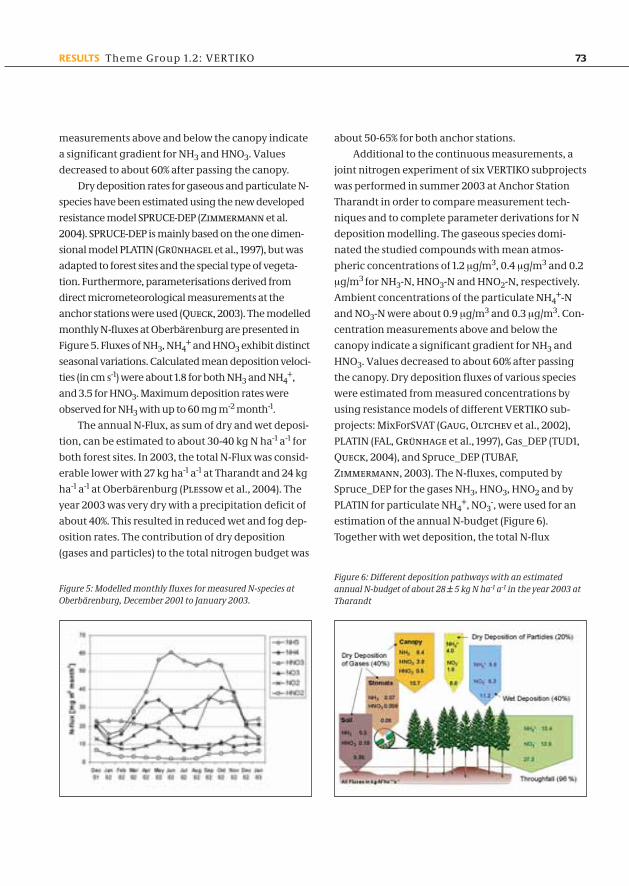
At Anchor Station Melpitz (grassland site) a
special focus was laid on measuring and modelling
nitrogen fluxes (task IfT). A micrometeorological
aerodynamic profile technique was used to deter-
mine the net NH3 flux (Figure 4). Concentrations of
NOX, NH3, HNO2 and HNO3 have been measured by
chemiluminescence and wet annular denuder tech-
niques, respectively. Dry deposition of HNO3, HNO2
and also NH3, was estimated by resistance analogy
(Sutton et al., 1998, Spindler et al., 2001). The N-
input by precipitation (NO3–, NH4
+) was quantified
using a wet-only sampler. NO3– and NH4
+ concentra-
tions of aerosol particles were determined with a low
flow filter sampler (upstream impactors for PM1,
PM2.5 and PM10). The size dependent deposition
velocities were modelled on the basis of the friction
velocities (Slinn, 1982). The N-impact shows a high
interannual variability between 8 and 24 kg per
hectare and year. The N-impact by wet deposition
shows relatively constant yearly amounts in the
range about 8 kg. The dry N-impact caused from NH3
shows the strongest variability. The deposition by
particulate matter realizes less than 10% of the dry N-
impact. A comparison with model results shows a
good agreement for the Anchor Station Melpitz
(Gauger et al. 2003).
At the Anchor Stations Tharandt and Oberbären-
burg in the eastern Erzgebirge, ambient concentra-
tions of acidic and basic N-compounds were meas-
ured continuously from Sep 2001 to Dec 2003 based
on simultaneous denuder and filter pack sampling
(task TUBAF, Pleßow et al., 2003). Precipitation and
fog droplet chemistry were investigated in parallel.
Average NH3-N, HNO3-N, HNO2-N, and SO2-S concen-
trations in air were about 0.45, 0.16, 0.06, and 1.4
µg/m3 at Oberbärenburg and about 1.2, 0.4, 0.2, and
0.9 µg/m3 at Tharandt. The NH3-concentrations cor-
related with air temperature, global radiation, and
relative air and leaf surface humidity. Concentration
72 Theme Group 1.2: VERTIKO RESULTS
Figure 3: Carbon net ecosystem exchange (NEE) from 1996 to2003 measured at Anchor Station Tharandt. Variation of dailyvalues (above), cumulated values (below) and numbers ofannual sums (g m-2 a-1) are shown.
Figure 4: One day of ammonia concentration measurements(2002-04-21) at Anchor Station Melpitz in three levels aboveground. The flux (emission) was calculated using measurementsof horizontal wind velocity and temperature in different levelsover ground.
AFO_002 21.07.2005 13:07 Uhr Seite 72
73RESULTS Theme Group 1.2: VERTIKO
measurements above and below the canopy indicate
a significant gradient for NH3 and HNO3. Values
decreased to about 60% after passing the canopy.
Dry deposition rates for gaseous and particulate N-
species have been estimated using the new developed
resistance model SPRUCE-DEP (Zimmermann et al.
2004). SPRUCE-DEP is mainly based on the one dimen-
sional model PLATIN (Grünhagel et al., 1997), but was
adapted to forest sites and the special type of vegeta-
tion. Furthermore, parameterisations derived from
direct micrometeorological measurements at the
anchor stations were used (Queck, 2003). The modelled
monthly N-fluxes at Oberbärenburg are presented in
Figure 5. Fluxes of NH3, NH4+ and HNO3 exhibit distinct
seasonal variations. Calculated mean deposition veloci-
ties (in cm s-1) were about 1.8 for both NH3 and NH4+,
and 3.5 for HNO3. Maximum deposition rates were
observed for NH3 with up to 60 mg m-2 month-1.
The annual N-Flux, as sum of dry and wet deposi-
tion, can be estimated to about 30-40 kg N ha-1 a-1 for
both forest sites. In 2003, the total N-Flux was consid-
erable lower with 27 kg ha-1 a-1 at Tharandt and 24 kg
ha-1 a-1 at Oberbärenburg (Pleßow et al., 2004). The
year 2003 was very dry with a precipitation deficit of
about 40%. This resulted in reduced wet and fog dep-
osition rates. The contribution of dry deposition
(gases and particles) to the total nitrogen budget was
about 50-65% for both anchor stations.
Additional to the continuous measurements, a
joint nitrogen experiment of six VERTIKO subprojects
was performed in summer 2003 at Anchor Station
Tharandt in order to compare measurement tech-
niques and to complete parameter derivations for N
deposition modelling. The gaseous species domi-
nated the studied compounds with mean atmos-
pheric concentrations of 1.2 µg/m3, 0.4 µg/m3 and 0.2
µg/m3 for NH3-N, HNO3-N and HNO2-N, respectively.
Ambient concentrations of the particulate NH4+-N
and NO3-N were about 0.9 µg/m3 and 0.3 µg/m3. Con-
centration measurements above and below the
canopy indicate a significant gradient for NH3 and
HNO3. Values decreased to about 60% after passing
the canopy. Dry deposition fluxes of various species
were estimated from measured concentrations by
using resistance models of different VERTIKO sub-
projects: MixForSVAT (Gaug, Oltchev et al., 2002),
PLATIN (FAL, Grünhage et al., 1997), Gas_DEP (TUD1,
Queck, 2004), and Spruce_DEP (TUBAF,
Zimmermann, 2003). The N-fluxes, computed by
Spruce_DEP for the gases NH3, HNO3, HNO2 and by
PLATIN for particulate NH4+, NO3
-, were used for an
estimation of the annual N-budget (Figure 6).
Together with wet deposition, the total N-flux
Figure 5: Modelled monthly fluxes for measured N-species atOberbärenburg, December 2001 to January 2003.
Figure 6: Different deposition pathways with an estimatedannual N-budget of about 28 ± 5 kg N ha-1 a-1 in the year 2003 atTharandt
AFO_002 21.07.2005 13:07 Uhr Seite 73
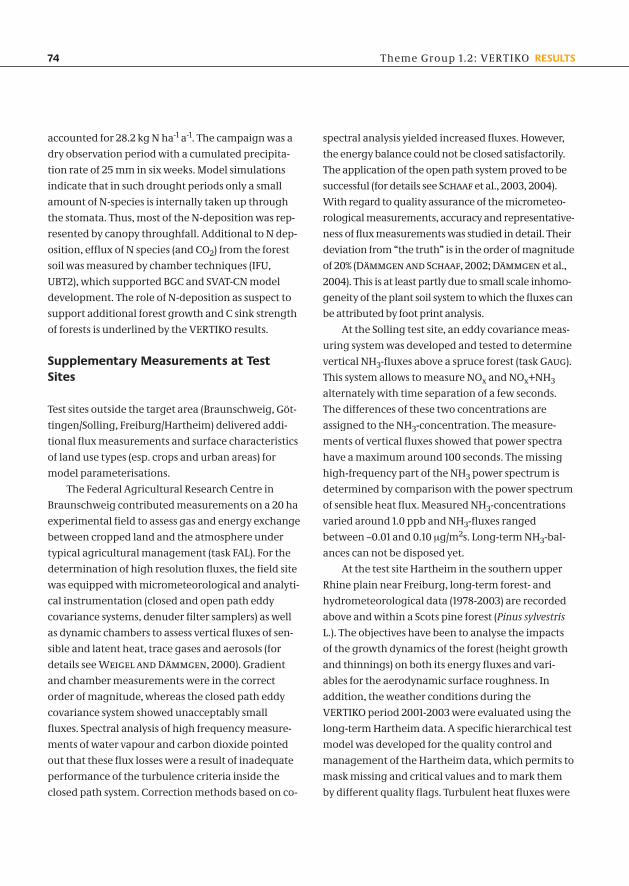
accounted for 28.2 kg N ha-1 a-1. The campaign was a
dry observation period with a cumulated precipita-
tion rate of 25 mm in six weeks. Model simulations
indicate that in such drought periods only a small
amount of N-species is internally taken up through
the stomata. Thus, most of the N-deposition was rep-
resented by canopy throughfall. Additional to N dep-
osition, efflux of N species (and CO2) from the forest
soil was measured by chamber techniques (IFU,
UBT2), which supported BGC and SVAT-CN model
development. The role of N-deposition as suspect to
support additional forest growth and C sink strength
of forests is underlined by the VERTIKO results.
Supplementary Measurements at TestSites
Test sites outside the target area (Braunschweig, Göt-
tingen/Solling, Freiburg/Hartheim) delivered addi-
tional flux measurements and surface characteristics
of land use types (esp. crops and urban areas) for
model parameterisations.
The Federal Agricultural Research Centre in
Braunschweig contributed measurements on a 20 ha
experimental field to assess gas and energy exchange
between cropped land and the atmosphere under
typical agricultural management (task FAL). For the
determination of high resolution fluxes, the field site
was equipped with micrometeorological and analyti-
cal instrumentation (closed and open path eddy
covariance systems, denuder filter samplers) as well
as dynamic chambers to assess vertical fluxes of sen-
sible and latent heat, trace gases and aerosols (for
details see Weigel and Dämmgen, 2000). Gradient
and chamber measurements were in the correct
order of magnitude, whereas the closed path eddy
covariance system showed unacceptably small
fluxes. Spectral analysis of high frequency measure-
ments of water vapour and carbon dioxide pointed
out that these flux losses were a result of inadequate
performance of the turbulence criteria inside the
closed path system. Correction methods based on co-
spectral analysis yielded increased fluxes. However,
the energy balance could not be closed satisfactorily.
The application of the open path system proved to be
successful (for details see Schaaf et al., 2003, 2004).
With regard to quality assurance of the micrometeo-
rological measurements, accuracy and representative-
ness of flux measurements was studied in detail. Their
deviation from “the truth” is in the order of magnitude
of 20% (Dämmgen and Schaaf, 2002; Dämmgen et al.,
2004). This is at least partly due to small scale inhomo-
geneity of the plant soil system to which the fluxes can
be attributed by foot print analysis.
At the Solling test site, an eddy covariance meas-
uring system was developed and tested to determine
vertical NH3-fluxes above a spruce forest (task Gaug).
This system allows to measure NOx and NOx+NH3
alternately with time separation of a few seconds.
The differences of these two concentrations are
assigned to the NH3-concentration. The measure-
ments of vertical fluxes showed that power spectra
have a maximum around 100 seconds. The missing
high-frequency part of the NH3 power spectrum is
determined by comparison with the power spectrum
of sensible heat flux. Measured NH3-concentrations
varied around 1.0 ppb and NH3-fluxes ranged
between –0.01 and 0.10 µg/m2s. Long-term NH3-bal-
ances can not be disposed yet.
At the test site Hartheim in the southern upper
Rhine plain near Freiburg, long-term forest- and
hydrometeorological data (1978-2003) are recorded
above and within a Scots pine forest (Pinus sylvestris
L.). The objectives have been to analyse the impacts
of the growth dynamics of the forest (height growth
and thinnings) on both its energy fluxes and vari-
ables for the aerodynamic surface roughness. In
addition, the weather conditions during the
VERTIKO period 2001-2003 were evaluated using the
long-term Hartheim data. A specific hierarchical test
model was developed for the quality control and
management of the Hartheim data, which permits to
mask missing and critical values and to mark them
by different quality flags. Turbulent heat fluxes were
74 Theme Group 1.2: VERTIKO RESULTS
AFO_002 21.07.2005 13:07 Uhr Seite 74
75RESULTS Theme Group 1.2: VERTIKO
calculated by both the Bowen ratio energy balance
method and the aerodynamic profile method. The
aerodynamic surface variables roughness length z0,
zero-point displacement d and friction velocity u*
were calculated by an iterative linear-logarithmic
approach.
Average annual air temperature above the
Hartheim Scots pine forest increased in the period
1978-2002 (0.069 K�a-1). Though the average annual
net radiation Q* decreased (Kessler and Jaeger,
2003), the annual average of the turbulent latent heat
flux λE did not reveal a significant trend, which could
be explained by the slight increase of the annual gross
precipitation and the reduction of the leaf area index
of the Scots pine forest by thinnings. As a result the
annual average of the turbulent sensible heat flux H
decreased, which led to a decrease of annual averages
of the Bowen ratio β from 0.76 (1978) to 0.55 (2002).
Temporarily occurring summer drought of variable
intensity was characteristic of the Hartheim Scots
pine forest during the investigation period.
Long-term growth dynamics caused a significant
increase of d with small fluctuations of z0 and u�,
whereas for periods after thinnings a short-term
reduction of d with a simultaneous increase of u�and z0 could be detected. Altogether linear relation-
ships with the mean stand height h were found in the
investigation period: d = 0.72h (R2 = 0.77) and z0 =
0.09h (R2 = 0.13).
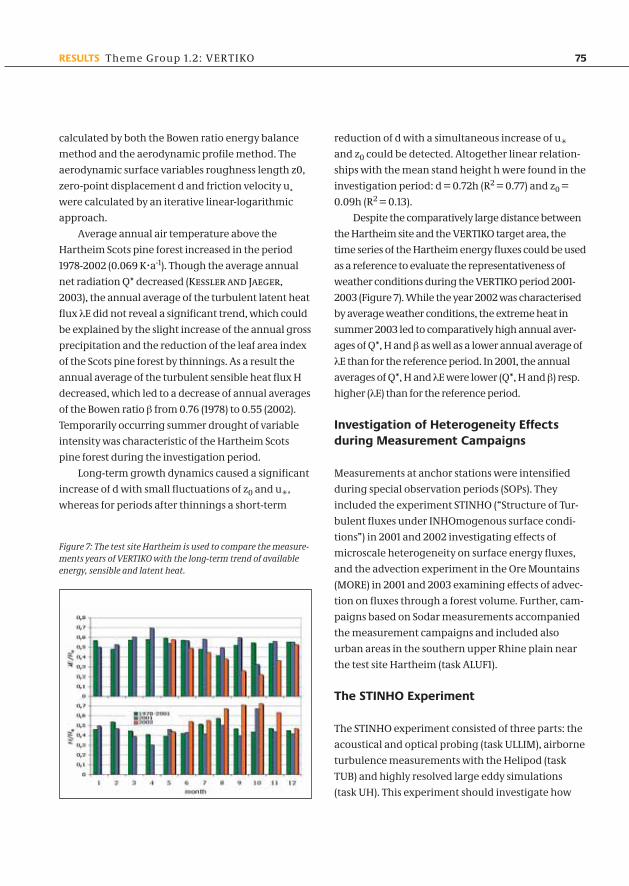
Despite the comparatively large distance between
the Hartheim site and the VERTIKO target area, the
time series of the Hartheim energy fluxes could be used
as a reference to evaluate the representativeness of
weather conditions during the VERTIKO period 2001-
2003 (Figure 7). While the year 2002 was characterised
by average weather conditions, the extreme heat in
summer 2003 led to comparatively high annual aver-
ages of Q*, H and β as well as a lower annual average of
λE than for the reference period. In 2001, the annual
averages of Q*, H and λE were lower (Q*, H and β) resp.
higher (λE) than for the reference period.
Investigation of Heterogeneity Effectsduring Measurement Campaigns
Measurements at anchor stations were intensified
during special observation periods (SOPs). They
included the experiment STINHO (“Structure of Tur-
bulent fluxes under INHOmogenous surface condi-
tions”) in 2001 and 2002 investigating effects of
microscale heterogeneity on surface energy fluxes,
and the advection experiment in the Ore Mountains
(MORE) in 2001 and 2003 examining effects of advec-
tion on fluxes through a forest volume. Further, cam-
paigns based on Sodar measurements accompanied
the measurement campaigns and included also
urban areas in the southern upper Rhine plain near
the test site Hartheim (task ALUF1).
The STINHO Experiment
The STINHO experiment consisted of three parts: the
acoustical and optical probing (task ULLIM), airborne
turbulence measurements with the Helipod (task
TUB) and highly resolved large eddy simulations
(task UH). This experiment should investigate how
Figure 7: The test site Hartheim is used to compare the measure-ments years of VERTIKO with the long-term trend of availableenergy, sensible and latent heat.
AFO_002 21.07.2005 13:07 Uhr Seite 75
the heterogeneity of the surface modifies the vertical
turbulent exchange and specifies the amount of the
horizontal heat fluxes. Combined observations and
simulations are used to quantify the horizontal diver-
gence of sensible heat fluxes under heterogeneous
surface conditions.
Two measurement campaigns were realised
inside the VERTIKO target area, STINHO-1 at Anchor
Station Melpitz and STINHO-2 at the observatory of
the German Meteorological Service in Lindenberg.
During STINHO-2 intensive observations concen-
trated on the morning boundary layer development
above a heterogeneous surface. Helipod flights on
four different days were carried out in the early
morning shallow boundary layer. The structure of
the ground-based inversion and the development of
flat convection during the morning transition were
observed on grid-flights at low altitude. Highly non-
stationary low-level jets were observed in connection
with intermittent turbulence and steep ramps with
76 Theme Group 1.2: VERTIKO RESULTS
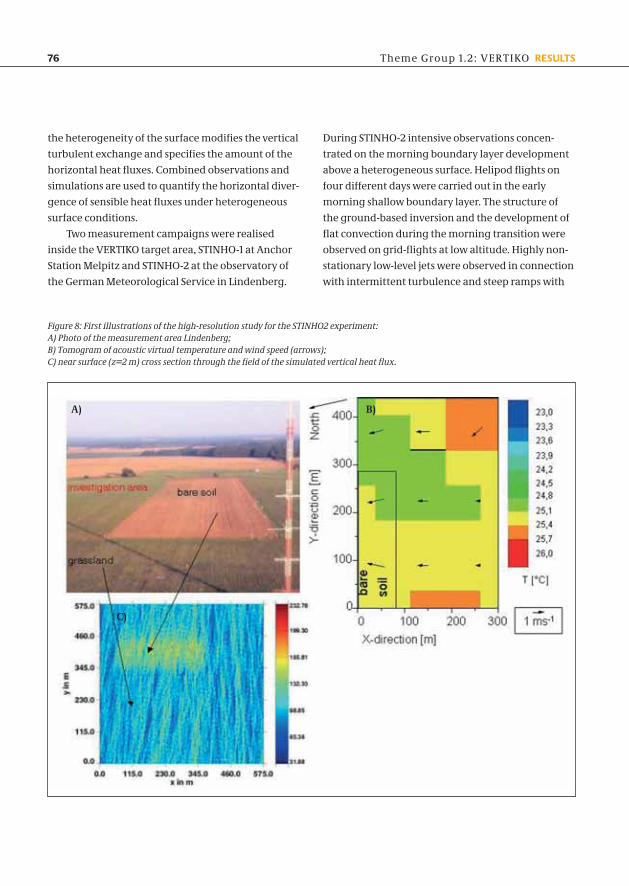
Figure 8: First illustrations of the high-resolution study for the STINHO2 experiment: A) Photo of the measurement area Lindenberg; B) Tomogram of acoustic virtual temperature and wind speed (arrows); C) near surface (z=2 m) cross section through the field of the simulated vertical heat flux.
A) B)
C)
AFO_002 21.07.2005 13:07 Uhr Seite 76
77RESULTS Theme Group 1.2: VERTIKO
extremely large vertical gradients of potential tem-
perature and humidity.
The database contains all ground based and air-
borne measurements as well the radiation and
energy balance, and the height of the convective
boundary layer. These parameters were summed-up
in particular for the LES initialisation and validation.
The realised set-up of the measurement techniques
provided an image of surface/atmosphere interac-
tion parameters and processes which corresponded
with the (horizontal) grid structure of the LES model.
Combining the experimental with the highly
resolved numerical data, the energy transfer under
inhomogeneous surface conditions was analysed
(Figure 8). These investigations at the micro-α scale
demonstrate how heterogeneous surface conditions
modify the vertical turbulent heat fluxes.
The combination of the STINHO database and the
simulation results enables the verification of the rep-
resentativeness of long-term flux measurements at
the anchor stations inside a heterogeneous land-
scape (Arnold et al., 2004), and to generalise the
experimental data (see also “4 Model Integration”).
The Advection Experiment
The standard methodology used by the global commu-
nity (FLUXNET) measuring net ecosystem exchange
(NEE) of CO2 is relying on the eddy covariance (EC) tech-
nique and usually ignores the advection terms in the
conservation equation. Recent studies however show
that the neglected terms play an important role in the
carbon budget especially in forest canopies and that
they may be responsible for the underestimation of
nighttime fluxes of CO2 in forests rather than measure-
ment errors. Within the frame of VERTIKO two exten-
sive measurement campaigns have been performed in
September/October 2001 and from May to October
2003 to investigate the influence of non-turbulent hori-
zontal and vertical advection processes on the NEE of
CO2. During the campaigns the permanent measure-
ment facilities at the Anchor Station Tharandt have
been substantially enhanced by additional towers to
accurately acquire the horizontal and vertical CO2 con-
centration gradients in a control volume.
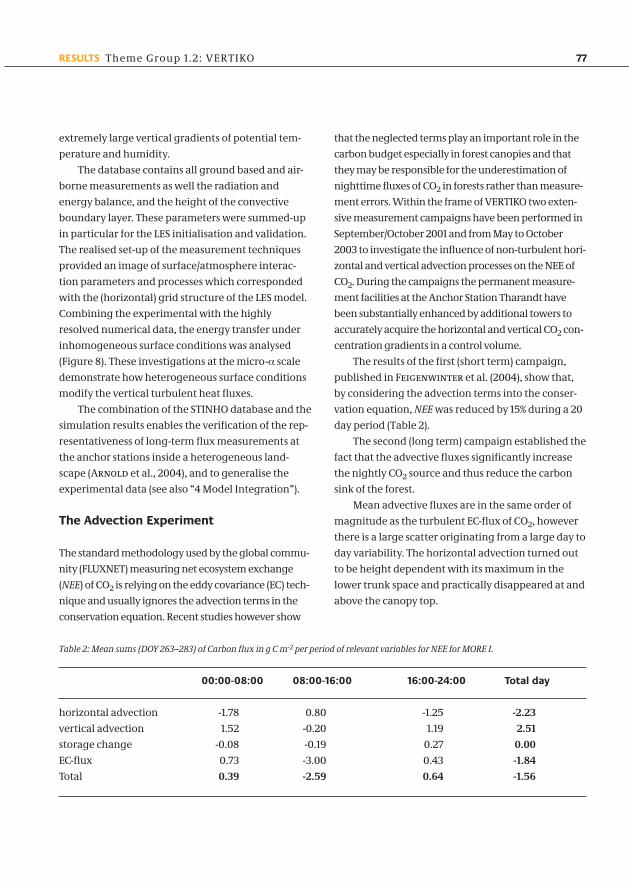
The results of the first (short term) campaign,
published in Feigenwinter et al. (2004), show that,
by considering the advection terms into the conser-
vation equation, NEE was reduced by 15% during a 20
day period (Table 2).
The second (long term) campaign established the
fact that the advective fluxes significantly increase
the nightly CO2 source and thus reduce the carbon
sink of the forest.
Mean advective fluxes are in the same order of
magnitude as the turbulent EC-flux of CO2, however
there is a large scatter originating from a large day to
day variability. The horizontal advection turned out
to be height dependent with its maximum in the
lower trunk space and practically disappeared at and
above the canopy top.
00:00-08:00 08:00-16:00 16:00-24:00 Total day
horizontal advection -1.78 0.80 -1.25 -2.23
vertical advection 1.52 -0.20 1.19 2.51
storage change -0.08 -0.19 0.27 0.00
EC-flux 0.73 -3.00 0.43 -1.84
Total 0.39 -2.59 0.64 -1.56
Table 2: Mean sums (DOY 263–283) of Carbon flux in g C m-2 per period of relevant variables for NEE for MORE I.
AFO_002 21.07.2005 13:07 Uhr Seite 77
There are still many methodological problems in this
subject and only a few studies for comparison. The
results may therefore only be characteristic for the
specific site. However, the current trend in experi-
mental micrometeorology to design measurement
set-ups to probe an entire soil-vegetation-atmos-
phere volume with more than one single tower con-
firms that including advection processes into budget
considerations is one of the most important issues of
recent micrometeorological research activities.
Model Integration
Model integration in VERTIKO aims at both integrat-
ing physical and chemical processes as well as inte-
grating fluxes from heterogeneous surfaces
(microscale to mesoscale). The atmosphere inte-
grates processes at all scales but feeds back to the full
heterogeneity of real landscapes. In order to under-
stand and predict processes at the mesoscale, models
should therefore account for all potentially relevant
controlling factors resolved for heterogeneous sur-
faces at smaller scales. The model hierarchy being
developed in VERTIKO will serve as a tool to test
appropriate spatial resolutions and sufficiently
detailed parameterisation of patchy landscapes.
SVAT and BGC Models
In a first step, SVAT (“soil vegetation atmosphere
transfer”) and BGC (biogeochemical) models speci-
fied for different land use types and predicting
various physical and chemical factors were described
and compared (Falge et al., 2004). Results of the
investigated energy fluxes were within an acceptable
range for all models. However, the comparisons also
revealed that model validations by measurements
(taken from field campaigns) require assumptions on
energy balance closure. The energy balance is a
priori closed in the models but this was not the case
for measurements.Within integrating physical and
chemical fluxes in models, the goal of one sub-
project was providing simple, biologically-based
models of soil CO2 and N2O emissions as lower input
in atmospheric transport models for the VERTIKO
target area (task UBT2). For model development and
validation CO2 and N2O emissions of meadow soil,
bare soil, and forest soil were measured with a photo-
acoustic infrared monitor in closed chambers. Both,
the level of CO2 emissions and N2O emissions varied
between the different land use types. In general the
meadow and bare soils showed higher CO2 and N2O
fluxes than forest soils.
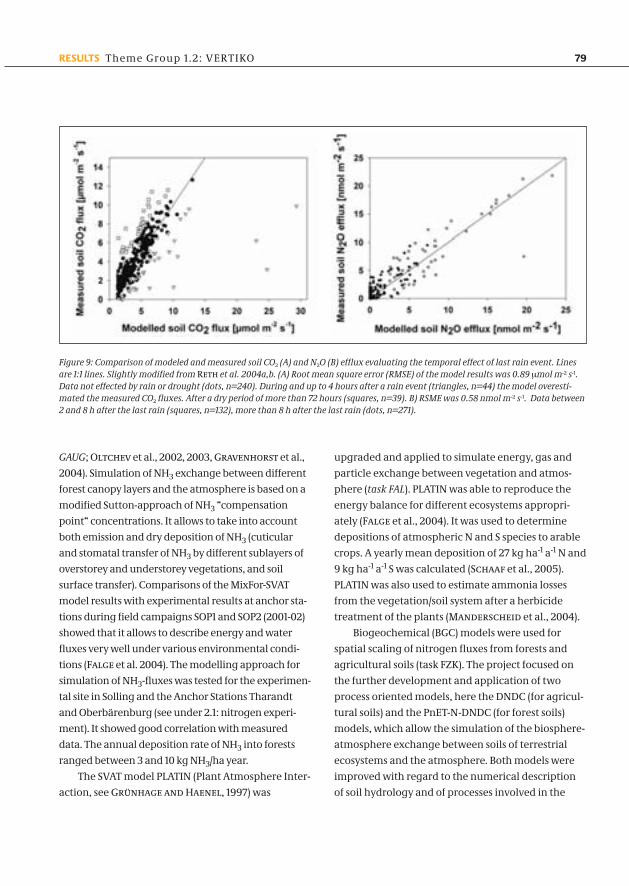
A non-linear regression model for the calcula-
tion of CO2 emission was adopted for the use on dif-
ferent land use types, and for regional application.
In addition to soil temperature and soil moisture,
the parameters pH and root mass were included in
the model. As an unexpected parameter the time
after a rain event was identified to affect the soil CO2
emission. The model overestimated the observed
fluxes during and within four hours of the last rain
event. Conversely, after more than 72 hours without
rain, the model underestimated the fluxes. Between
four and 72 hours after rainfall, the regression
model of soil CO2 emission explained up to 91% of the
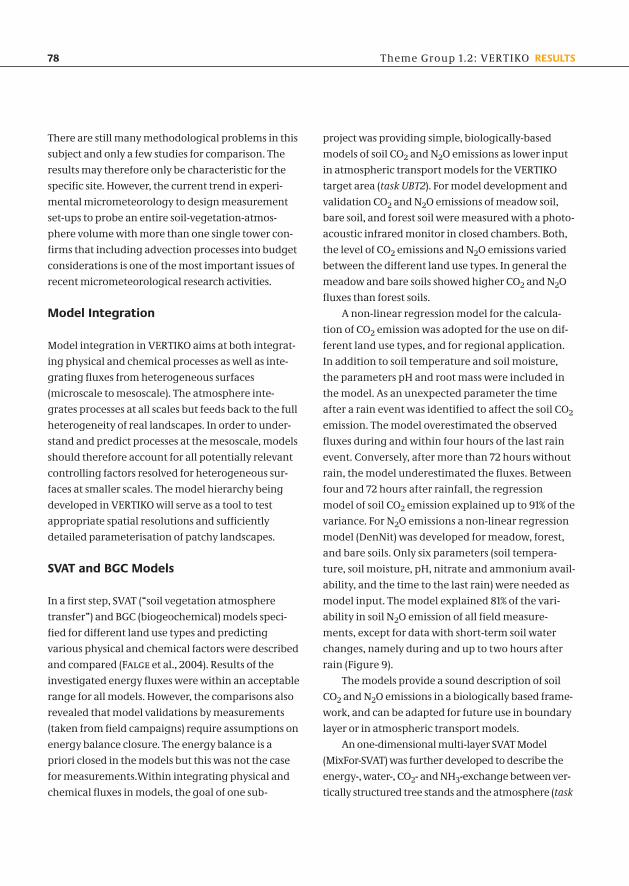
variance. For N2O emissions a non-linear regression
model (DenNit) was developed for meadow, forest,
and bare soils. Only six parameters (soil tempera-
ture, soil moisture, pH, nitrate and ammonium avail-
ability, and the time to the last rain) were needed as
model input. The model explained 81% of the vari-
ability in soil N2O emission of all field measure-
ments, except for data with short-term soil water
changes, namely during and up to two hours after
rain (Figure 9).
The models provide a sound description of soil
CO2 and N2O emissions in a biologically based frame-
work, and can be adapted for future use in boundary
layer or in atmospheric transport models.
An one-dimensional multi-layer SVAT Model
(MixFor-SVAT) was further developed to describe the
energy-, water-, CO2- and NH3-exchange between ver-
tically structured tree stands and the atmosphere (task
78 Theme Group 1.2: VERTIKO RESULTS
AFO_002 21.07.2005 13:07 Uhr Seite 78
79RESULTS Theme Group 1.2: VERTIKO
GAUG; Oltchev et al., 2002, 2003, Gravenhorst et al.,
2004). Simulation of NH3 exchange between different
forest canopy layers and the atmosphere is based on a
modified Sutton-approach of NH3 “compensation
point“ concentrations. It allows to take into account
both emission and dry deposition of NH3 (cuticular
and stomatal transfer of NH3 by different sublayers of
overstorey and understorey vegetations, and soil
surface transfer). Comparisons of the MixFor-SVAT
model results with experimental results at anchor sta-
tions during field campaigns SOP1 and SOP2 (2001-02)
showed that it allows to describe energy and water
fluxes very well under various environmental condi-
tions (Falge et al. 2004). The modelling approach for
simulation of NH3-fluxes was tested for the experimen-
tal site in Solling and the Anchor Stations Tharandt
and Oberbärenburg (see under 2.1: nitrogen experi-
ment). It showed good correlation with measured
data. The annual deposition rate of NH3 into forests
ranged between 3 and 10 kg NH3/ha year.
The SVAT model PLATIN (Plant Atmosphere Inter-
action, see Grünhage and Haenel, 1997) was
upgraded and applied to simulate energy, gas and
particle exchange between vegetation and atmos-
phere (task FAL). PLATIN was able to reproduce the
energy balance for different ecosystems appropri-
ately (Falge et al., 2004). It was used to determine
depositions of atmospheric N and S species to arable
crops. A yearly mean deposition of 27 kg ha-1 a-1 N and
9 kg ha-1 a-1 S was calculated (Schaaf et al., 2005).
PLATIN was also used to estimate ammonia losses
from the vegetation/soil system after a herbicide
treatment of the plants (Manderscheid et al., 2004).
Biogeochemical (BGC) models were used for
spatial scaling of nitrogen fluxes from forests and
agricultural soils (task FZK). The project focused on
the further development and application of two
process oriented models, here the DNDC (for agricul-
tural soils) and the PnET-N-DNDC (for forest soils)
models, which allow the simulation of the biosphere-
atmosphere exchange between soils of terrestrial
ecosystems and the atmosphere. Both models were
improved with regard to the numerical description
of soil hydrology and of processes involved in the
Figure 9: Comparison of modeled and measured soil CO2 (A) and N2O (B) efflux evaluating the temporal effect of last rain event. Linesare 1:1 lines. Slightly modified from Reth et al. 2004a,b. (A) Root mean square error (RMSE) of the model results was 0.89 µmol m-2 s-1.Data not effected by rain or drought (dots, n=240). During and up to 4 hours after a rain event (triangles, n=44) the model overesti-mated the measured CO2 fluxes. After a dry period of more than 72 hours (squares, n=39). B) RSME was 0.58 nmol m-2 s-1. Data between2 and 8 h after the last rain (squares, n=132), more than 8 h after the last rain (dots, n=271).
AFO_002 21.07.2005 13:07 Uhr Seite 79
production and consumption of N trace gases in soils.
After successful validation of the models (Butter-
bach-Bahl et al., 2004; Kiese et al., 2004), for which
partly datasets obtained in the VERTIKO project were
used, the models were coupled to Geographic Infor-
mation System (GIS) for calculating a regional inven-
tory of N trace gas emissions from soils in Saxony
(Kesik, 2002; Miehle, 2002; Butterbach-Bahl et al.,
2002, 2004).
The GIS provided all relevant datasets necessary
for model initialisation (e.g., soil properties and field
management) and driving (e.g., daily climate data,
atmospheric N deposition) in detailed spatial and
temporal resolution (Butterbach-Bahl et al., 2004).
Total annual N2O-emissions from agricultural soils in
Saxony ranged from 0.5–26.0 kg N2O-N ha-1 yr-1 and
were calculated to amount to about 5475 t N2O-N yr-1
in the year 1995, which compares quite well with pre-
vious estimates based on the IPCC approach (4892t
N2O-N yr-1). Compared to the agricultural soils, N2O-
emissions from forest soils in Saxony (range: 0.04–19.7
kg N2O-N ha-1 yr-1) were much lower and amounted to
1011 t N2O-N yr -1. In comparison with other sources of
N2O in Saxony our estimates show, that - even in such
a highly industrialised region like Saxony – soils con-
tribute more than 50% to the total regional N2O
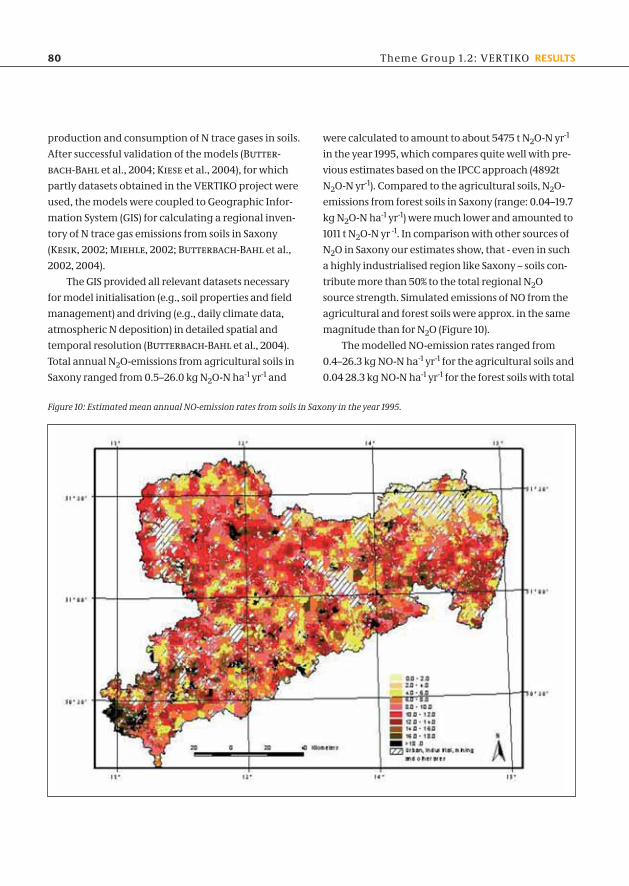
source strength. Simulated emissions of NO from the
agricultural and forest soils were approx. in the same
magnitude than for N2O (Figure 10).
The modelled NO-emission rates ranged from
0.4–26.3 kg NO-N ha-1 yr-1 for the agricultural soils and
0.04 28.3 kg NO-N ha-1 yr-1 for the forest soils with total
80 Theme Group 1.2: VERTIKO RESULTS
Figure 10: Estimated mean annual NO-emission rates from soils in Saxony in the year 1995.
AFO_002 21.07.2005 13:07 Uhr Seite 80
81RESULTS Theme Group 1.2: VERTIKO
emissions of 8868 t NO-N yr-1 (agricultural soils) and
4155 t NO-N yr-1 (forest soils). Our results indicate that
the agricultural and forest soils were a significant
source, which contributed 17.9% of the total NOx emis-
sions from various sources in Saxony. Furthermore, a
series of sensitivity tests were carried out, which
demonstrated that variations in soil organic carbon
content (SOC) and soil texture significantly effect the
modelled N-trace gas emissions from agricultural
soils at the regional scale, whereas, in addition, for
forest soils also the soil pH is a sensitive factor. Finally,
multi-year simulations were conducted for the region
with observed meteorological data from 1994-1996.
The results demonstrated that the modelled interan-
nual variations, which were obviously induced by
only the climate conditions, in the N-gas emissions
were as high as 36%. The high interannual variations
imply that multi-year (e.g. 5-10 years), instead of
single baseline year, simulations would produce more
reliable estimates of mean soil N2O emissions at
regional scale. With respect to the Kyoto protocol this
means that the mean N2O-emissions from soils in the
period 1988-1992 should be evaluated instead of
focusing on a single year, 1990.
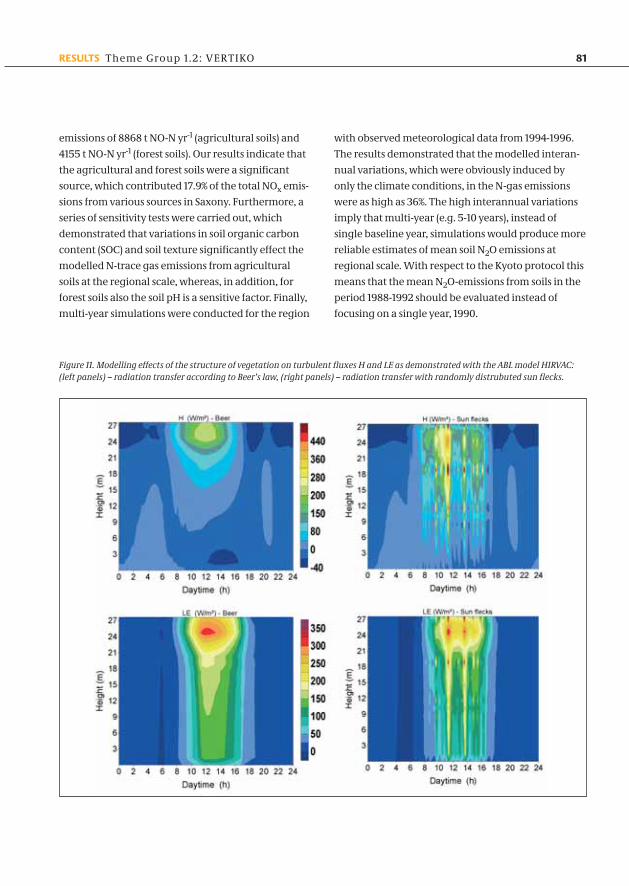
Figure 11. Modelling effects of the structure of vegetation on turbulent fluxes H and LE as demonstrated with the ABL model HIRVAC:(left panels) – radiation transfer according to Beer’s law, (right panels) – radiation transfer with randomly distrubuted sun flecks.
AFO_002 21.07.2005 13:07 Uhr Seite 81
Boundary-Layer Model
The PBL-model HIRVAC (HIgh Resolution Vegetation
Atmosphere Coupler; Goldberg an Bernhofer, 2001)
is used as a test platform for SVATs as applied in
mesoscale modelling. It consists of up to 120 horizon-
tal layers from soil to the lower troposphere includ-
ing layers of different leaf area densities coupled to
the leaf gas exchange model PSN6 (from partner
project UBT2, see Harley and Tenhunen, 1991).
Within VERTIKO, an interception module and a
multi-layer ground water module (Federer, 1995) has
been included. HIRVAC was then applied to investi-
gate the variability of energy and trace gas fluxes
(mainly H2O and CO2) for dominant land uses. Mea-
surement sites that provide data for parameterisa-
tion and validation were the Anchor Stations Tha-
randt in the lower mountain range (spruce), the
grassland site Melpitz and two sites at Lindenberg
(grass and pine), situated in the lowlands of northern
Saxony and eastern Brandenburg, respectively. To
consider effects of sunflecks in canopies a vertical
and temporal variable random function was applied
(Figure 11). Based on co-operation with UBT2 and the
DEKLIM project EVA_GRIPS new parameter sets of
the PSN6 model for beech and different crops were
applied. The turbulent fluxes of latent heat L.E, sensi-
ble heat H and carbon dioxide FCO2 were simulated
for the SOP2 period and compared with measure-
ments of the anchor stations. The results are in a
good agreement for H and L.E, derived from energy
balance residuum (L.E - measured) and flux-gradient-
relationship (model), as well as for FCO2. Comparison
between directly measured L.E and simulated latent
heat from gas exchange module PSN6 showed an
adequate agreement with more scattered data due to
cumulative variance of single atmospheric input
parameters. Besides, the comparison between meas-
urements and simulation showed that the inclusion
of a sunfleck parameterisation in the light transfer
scheme seems to be a plausible way to simulate more
realistic sensible and latent heat fluxes.
The comparison with measurements also showed that
it is reasonable to distinguish two methods in HIRVAC
for calculation of the latent heat flux – the “SVAT
mode” and the “ABL mode”. The first mode is based on
the scaling up of single-leaf transpiration to canopy
scale calculated with the gas exchange model which
is comparable with outcomes from SVAT-BIGLEAF
approaches and therefore suitable for integration in
SVAT comparisons. The second one uses the flux gra-
dient relationship to get the latent heat flux towards
to the gradient of humidity, which is comparable with
outcomes from other ABL models. In further studies
results from SVAT models should be compared with
HIRVAC output to assess the effect of high resolved
canopies on area-averaged fluxes in contrast to the
output of a common one-layer SVAT / BIGLEAF
approach. In addition, results from canopy and SVAT
models must be compared with HIRVAC output to
quantify effects of interaction between the vegetated
surface and the ABL environment on the control
parameters of canopy transpiration.
Spatial Integration and Mesoscale Modelling
A prerequisite of spatial integration was the exami-
nation and comparison of parameters and fluxes
related to different land use types. This was per-
formed using the continuous measurements at
anchor stations. For the surface parameters of differ-
ent vegetation types clear dependencies of d and zo
on wind speed and surface characteristics in the
vicinity of the towers could be described. Further,
consistent differences in the evaporative fraction
between forest and grassland could be demonstrated
(Figure 12): Smaller albedo of forests leads to larger
net radiation, larger sensible heat flux and larger
Bowen ratios – despite very similar evapotranspira-
tion. Thus, latent heat flux differs only slightly
between land use types. Whether this holds also for
periods of water shortage has to be clarified.
82 Theme Group 1.2: VERTIKO RESULTS
AFO_002 21.07.2005 13:07 Uhr Seite 82
83RESULTS Theme Group 1.2: VERTIKO
Figure 12: Evaporative fraction measured above spruce forests (Tharandt and Rotherdbach/Oberbärenburg), pine forest (Lindenberg)and grass (Lindenberg and Melpitz); red circle indicates fog at Rotherdbach/Oberbärenburg.
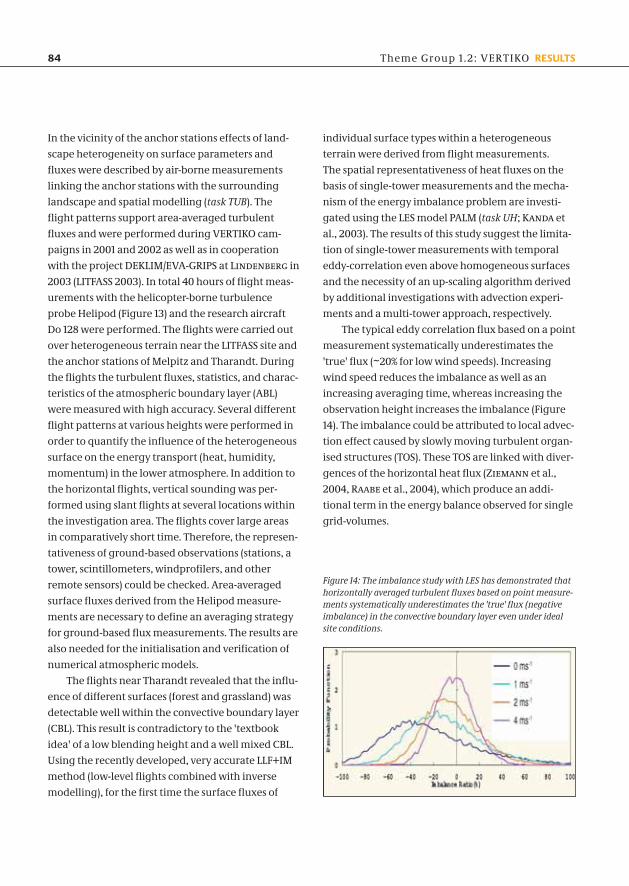
Figure 13: Tharandt 2001: Airborne measurements during STINHO-1 campaign with the aircraft Do 128. The first step for calculating area-averaged turbulent surface fluxes over different surface types in a heterogeneous terrain was the dis-tinction of e.g., wood and grassland by surface temperature.In the second step we calculated the area averaged turbulent surface heat flux using the inverse method. The heat flux above forestwas larger than over grassland. The heat flux above the forest decreased more rapidly with height than over grassland.
AFO_002 21.07.2005 13:07 Uhr Seite 83
84
In the vicinity of the anchor stations effects of land-
scape heterogeneity on surface parameters and
fluxes were described by air-borne measurements
linking the anchor stations with the surrounding
landscape and spatial modelling (task TUB). The
flight patterns support area-averaged turbulent
fluxes and were performed during VERTIKO cam-
paigns in 2001 and 2002 as well as in cooperation
with the project DEKLIM/EVA-GRIPS at Lindenberg in
2003 (LITFASS 2003). In total 40 hours of flight meas-
urements with the helicopter-borne turbulence
probe Helipod (Figure 13) and the research aircraft
Do 128 were performed. The flights were carried out
over heterogeneous terrain near the LITFASS site and
the anchor stations of Melpitz and Tharandt. During
the flights the turbulent fluxes, statistics, and charac-
teristics of the atmospheric boundary layer (ABL)
were measured with high accuracy. Several different
flight patterns at various heights were performed in
order to quantify the influence of the heterogeneous
surface on the energy transport (heat, humidity,
momentum) in the lower atmosphere. In addition to
the horizontal flights, vertical sounding was per-
formed using slant flights at several locations within
the investigation area. The flights cover large areas
in comparatively short time. Therefore, the represen-
tativeness of ground-based observations (stations, a
tower, scintillometers, windprofilers, and other
remote sensors) could be checked. Area-averaged
surface fluxes derived from the Helipod measure-
ments are necessary to define an averaging strategy
for ground-based flux measurements. The results are
also needed for the initialisation and verification of
numerical atmospheric models.
The flights near Tharandt revealed that the influ-
ence of different surfaces (forest and grassland) was
detectable well within the convective boundary layer
(CBL). This result is contradictory to the 'textbook
idea' of a low blending height and a well mixed CBL.
Using the recently developed, very accurate LLF+IM
method (low-level flights combined with inverse
modelling), for the first time the surface fluxes of
individual surface types within a heterogeneous
terrain were derived from flight measurements.
The spatial representativeness of heat fluxes on the
basis of single-tower measurements and the mecha-
nism of the energy imbalance problem are investi-
gated using the LES model PALM (task UH; Kanda et
al., 2003). The results of this study suggest the limita-
tion of single-tower measurements with temporal
eddy-correlation even above homogeneous surfaces
and the necessity of an up-scaling algorithm derived
by additional investigations with advection experi-
ments and a multi-tower approach, respectively.
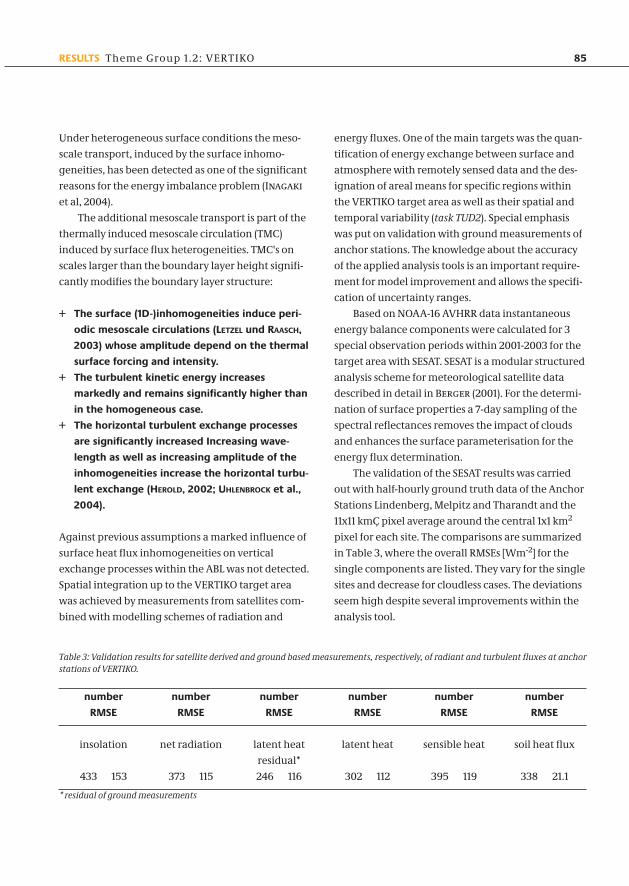
The typical eddy correlation flux based on a point
measurement systematically underestimates the
'true' flux (~20% for low wind speeds). Increasing
wind speed reduces the imbalance as well as an
increasing averaging time, whereas increasing the
observation height increases the imbalance (Figure
14). The imbalance could be attributed to local advec-
tion effect caused by slowly moving turbulent organ-
ised structures (TOS). These TOS are linked with diver-
gences of the horizontal heat flux (Ziemann et al.,
2004, Raabe et al., 2004), which produce an addi-
tional term in the energy balance observed for single
grid-volumes.
Theme Group 1.2: VERTIKO RESULTS
Figure 14: The imbalance study with LES has demonstrated thathorizontally averaged turbulent fluxes based on point measure-ments systematically underestimates the 'true' flux (negativeimbalance) in the convective boundary layer even under idealsite conditions.
AFO_002 21.07.2005 13:07 Uhr Seite 84
85RESULTS Theme Group 1.2: VERTIKO
Under heterogeneous surface conditions the meso-
scale transport, induced by the surface inhomo-
geneities, has been detected as one of the significant
reasons for the energy imbalance problem (Inagaki
et al, 2004).
The additional mesoscale transport is part of the
thermally induced mesoscale circulation (TMC)
induced by surface flux heterogeneities. TMC's on
scales larger than the boundary layer height signifi-
cantly modifies the boundary layer structure:
+ The surface (1D-)inhomogeneities induce peri-
odic mesoscale circulations (LETZEL und RAASCH,
2003) whose amplitude depend on the thermal
surface forcing and intensity.
+ The turbulent kinetic energy increases
markedly and remains significantly higher than
in the homogeneous case.
+ The horizontal turbulent exchange processes
are significantly increased Increasing wave-
length as well as increasing amplitude of the
inhomogeneities increase the horizontal turbu-
lent exchange (HEROLD, 2002; UHLENBROCK et al.,
2004).
Against previous assumptions a marked influence of
surface heat flux inhomogeneities on vertical
exchange processes within the ABL was not detected.
Spatial integration up to the VERTIKO target area
was achieved by measurements from satellites com-
bined with modelling schemes of radiation and
energy fluxes. One of the main targets was the quan-
tification of energy exchange between surface and
atmosphere with remotely sensed data and the des-
ignation of areal means for specific regions within
the VERTIKO target area as well as their spatial and
temporal variability (task TUD2). Special emphasis
was put on validation with ground measurements of
anchor stations. The knowledge about the accuracy
of the applied analysis tools is an important require-
ment for model improvement and allows the specifi-
cation of uncertainty ranges.
Based on NOAA-16 AVHRR data instantaneous
energy balance components were calculated for 3
special observation periods within 2001-2003 for the
target area with SESAT. SESAT is a modular structured
analysis scheme for meteorological satellite data
described in detail in Berger (2001). For the determi-
nation of surface properties a 7-day sampling of the
spectral reflectances removes the impact of clouds
and enhances the surface parameterisation for the
energy flux determination.
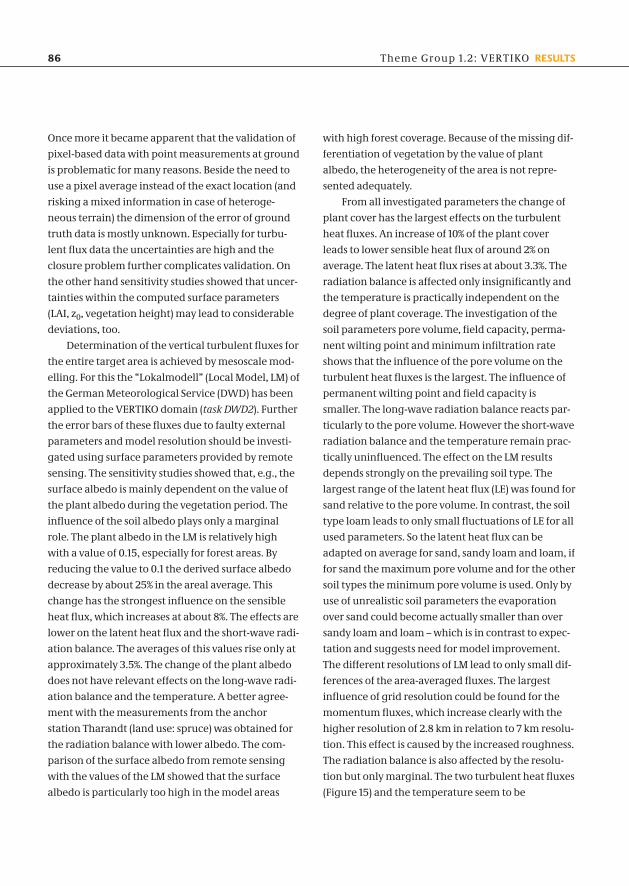
The validation of the SESAT results was carried
out with half-hourly ground truth data of the Anchor
Stations Lindenberg, Melpitz and Tharandt and the
11x11 kmÇ pixel average around the central 1x1 km2
pixel for each site. The comparisons are summarized
in Table 3, where the overall RMSEs [Wm-2] for the
single components are listed. They vary for the single
sites and decrease for cloudless cases. The deviations
seem high despite several improvements within the
analysis tool.
Table 3: Validation results for satellite derived and ground based measurements, respectively, of radiant and turbulent fluxes at anchorstations of VERTIKO.
number number number number number number
RMSE RMSE RMSE RMSE RMSE RMSE
insolation net radiation latent heat latent heat sensible heat soil heat flux
residual*
433 153 373 115 246 116 302 112 395 119 338 21.1
* residual of ground measurements
AFO_003 21.07.2005 13:10 Uhr Seite 85
86 Theme Group 1.2: VERTIKO RESULTS
Once more it became apparent that the validation of
pixel-based data with point measurements at ground
is problematic for many reasons. Beside the need to
use a pixel average instead of the exact location (and
risking a mixed information in case of heteroge-
neous terrain) the dimension of the error of ground
truth data is mostly unknown. Especially for turbu-
lent flux data the uncertainties are high and the
closure problem further complicates validation. On
the other hand sensitivity studies showed that uncer-
tainties within the computed surface parameters
(LAI, z0, vegetation height) may lead to considerable
deviations, too.
Determination of the vertical turbulent fluxes for
the entire target area is achieved by mesoscale mod-
elling. For this the “Lokalmodell” (Local Model, LM) of
the German Meteorological Service (DWD) has been
applied to the VERTIKO domain (task DWD2). Further
the error bars of these fluxes due to faulty external
parameters and model resolution should be investi-
gated using surface parameters provided by remote
sensing. The sensitivity studies showed that, e.g., the
surface albedo is mainly dependent on the value of
the plant albedo during the vegetation period. The
influence of the soil albedo plays only a marginal
role. The plant albedo in the LM is relatively high
with a value of 0.15, especially for forest areas. By
reducing the value to 0.1 the derived surface albedo
decrease by about 25% in the areal average. This
change has the strongest influence on the sensible
heat flux, which increases at about 8%. The effects are
lower on the latent heat flux and the short-wave radi-
ation balance. The averages of this values rise only at
approximately 3.5%. The change of the plant albedo
does not have relevant effects on the long-wave radi-
ation balance and the temperature. A better agree-
ment with the measurements from the anchor
station Tharandt (land use: spruce) was obtained for
the radiation balance with lower albedo. The com-
parison of the surface albedo from remote sensing
with the values of the LM showed that the surface
albedo is particularly too high in the model areas
with high forest coverage. Because of the missing dif-
ferentiation of vegetation by the value of plant
albedo, the heterogeneity of the area is not repre-
sented adequately.
From all investigated parameters the change of
plant cover has the largest effects on the turbulent
heat fluxes. An increase of 10% of the plant cover
leads to lower sensible heat flux of around 2% on
average. The latent heat flux rises at about 3.3%. The
radiation balance is affected only insignificantly and
the temperature is practically independent on the
degree of plant coverage. The investigation of the
soil parameters pore volume, field capacity, perma-
nent wilting point and minimum infiltration rate
shows that the influence of the pore volume on the
turbulent heat fluxes is the largest. The influence of
permanent wilting point and field capacity is
smaller. The long-wave radiation balance reacts par-
ticularly to the pore volume. However the short-wave
radiation balance and the temperature remain prac-
tically uninfluenced. The effect on the LM results
depends strongly on the prevailing soil type. The
largest range of the latent heat flux (LE) was found for
sand relative to the pore volume. In contrast, the soil
type loam leads to only small fluctuations of LE for all
used parameters. So the latent heat flux can be
adapted on average for sand, sandy loam and loam, if
for sand the maximum pore volume and for the other
soil types the minimum pore volume is used. Only by
use of unrealistic soil parameters the evaporation
over sand could become actually smaller than over
sandy loam and loam – which is in contrast to expec-
tation and suggests need for model improvement.
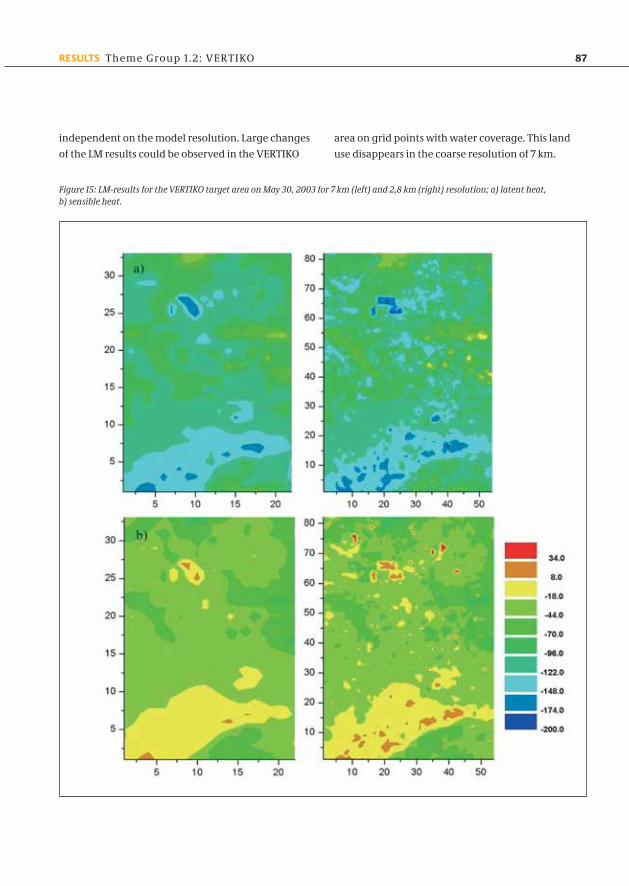
The different resolutions of LM lead to only small dif-
ferences of the area-averaged fluxes. The largest
influence of grid resolution could be found for the
momentum fluxes, which increase clearly with the
higher resolution of 2.8 km in relation to 7 km resolu-
tion. This effect is caused by the increased roughness.
The radiation balance is also affected by the resolu-
tion but only marginal. The two turbulent heat fluxes
(Figure 15) and the temperature seem to be
AFO_003 21.07.2005 13:10 Uhr Seite 86
87RESULTS Theme Group 1.2: VERTIKO
independent on the model resolution. Large changes
of the LM results could be observed in the VERTIKO
area on grid points with water coverage. This land
use disappears in the coarse resolution of 7 km.
Figure 15: LM-results for the VERTIKO target area on May 30, 2003 for 7 km (left) and 2,8 km (right) resolution; a) latent heat, b) sensible heat.
AFO_003 21.07.2005 13:10 Uhr Seite 87
Conclusions and Perspectives
Results of the VERTIKO research have confirmed
that continuous flux measurements are crucial to
understand surface-atmosphere interactions and
improve model parameterisation. However, SVAT-
model comparisons also revealed that model valida-
tions by measurements require assumptions on
energy balance closure (closed in models but not in
measurements). Campaigns have improved method-
ology of C and N flux measurements and have
shown high importance of advective fluxes in inho-
mogeneous terrain. For spatial integration it is possi-
ble to derive surface energy fluxes from satellite
with remaining inaccuracies being related to both
ground-based and remote measurements. There
exists small-scale heterogeneity in canopies that
needs to be integrated in a hierarchy of models.
Atmospheric characteristics above the active surface
might be less affected. The use of effective parame-
ters in mesoscale modelling should be challenged by
a more complete consideration of heterogeneous
landscapes to allow for a realistic feed-back between
land surfaces and the atmosphere.
Improvement of measurement accuracy and spatial
representation, specification of heterogeneity effects
on horizontal and vertical fluxes and better under-
standing of the energy balance of heterogeneous sur-
faces are future important research issues. Long-term
observation programmes reflecting seasonal and
interannual variability and landscape heterogeneity
should be continued for validation of SVAT and BGC
Models as well as regional climate models.
Acknowledgement
The authors would like to thank the staff of their
institutes and all external cooperative partners for
their contributions. Reconstruction of measurement
sites and infrastructure at Melpitz, Tharandt and
Oberbärenburg after the flood in August 2002 could
be achieved by many volunteers and financial bene-
fits of the state of Saxony and the Institute of Tropos-
pheric Research in Leipzig. Project funding by the
Federal Ministry of Education and Research (BMBF),
Germany, grant PT-UKF 07ATF37, is gratefully
acknowledged.
88 Theme Group 1.2: VERTIKO RESULTS
References
BALDOCCHI, DD, FALGE, E, GU, L., R. OLSON, D. HOLLINGER, S. RUNNING, P. ANTHONI, CH. BERNHOFER, K. DAVIS, J. FUENTES, A.GOLDSTEIN, G. KATUL, B. LAW, X. LEE, Y. MALHI, T. MEYERS, J.W. MUNGER, W. OECHEL, K. PILEGAARD, H.P. SCHMID, R.VALENTINI, S. VERMA, T. VESALA, K. WILSON AND S. WOFSY: FLUXNET: A New Tool to Study the Temporal and Spatial Vari-ability of Ecosystem-Scale Carbon Dioxide, Water Vapor and Energy Flux Densities, Bulletin of the American MeteorologicalSociety, 82, 2415-2435, 2001.
BERGER, F.H. Bestimmung des Energiehaushaltes am Erdboden mit Hilfe von Satellitendaten. Tharandter Klimaprotokolle Bd.5, Hrsg: Ch. Bernhofer, F.H. Berger, V. Goldberg, Eigenverlag TU-Dresden, 2001.
DÄMMGEN U., GRÜNHAGE L., SCHAAF S.: The precision and spatial variability of meteorological parameters needed to deter-mine vertical fluxes of air constituents, Landbauforschung Völkenrode, in preparation, 2004.
DÄMMGEN U., SCHAAF S.: Accuracy and spatial representativity of heat flux measurements. A contribution to subprojectBIATEX-2. Proceedings from the EUROTRAC-2 symposium 2002. Margraf Verlag, Weikersheim 2002.
FEDERER, C.A.: BROOK90: a simulation model for evaporation, soil water and streamflow, Version 3.1, Computer freeware anddocumentation, USDA Forest Service, P.O. Box 640, Durham NH, USA, 1995.
FOKEN, TH., WICHURA, B.: Tools for quality assessment of surface-based flux measurements, Agric. Forest Meteorol., 78, 83-105, 1996.
AFO_003 21.07.2005 13:10 Uhr Seite 88
89RESULTS Theme Group 1.2: VERTIKO
GAUGER, TH.; ANSHELM, F.; SCHUSTER, H.; ERISMAN, J.W.; VERMEULEN, A.T.; DRAAIJERS, G.P.J.; BLEEKER, A.; NAGEL, H.-D.:Mapping of ecosystem specific long-term trends in deposition loads and concentrations of air pollutants in Germany andtheir comparison with Critical Loads and Critical Levels, Umweltbundesamt und Institut für Navigation der UniversitätStuttgart, Final Report 299 42 210, part 1: 207 pages, part 2: 108 pages, 2002.
GÖCKEDE, M., MARKKANEN, T., HASAGER, C. B., FOKEN, T.: Use of footprint modelling for the characterisation of complex meas-urement sites, Bound.-Layer Meteorol., to be submitted, 2004.
GRÜNHAGE, L., HAENEL, H.-D.: PLATIN (PLant ATmosphere INteraction) I: A model of plant-atmospheric interaction for estimat-ing absorbed doses of gaseous air pollutants, Environmental Pollution, 98, 37-50, 1997.
GRÜNWALD, TH.: Langfristige Beobachtungen von Kohlendioxidflüssen mittels Eddy-Kovarianz-Technik über einem Altficht-enbestand im Tharandter Wald, Tharandter Klimaprotokolle Bd. 7, Hrsg: Ch. Bernhofer, F.H. Berger, V. Goldberg, EigenverlagTU-Dresden, 2003.
HARLEY, P.C., TENHUNEN, J. D.: Modelling the photosynthetic response of C3 leaves to environmental factors, In: K.J. Boote (ed),Modeling Crop Photosynthesis - from Biochemistry to Canopy, Proceedings of American Society of Agronomy Symposium, pp17-39, 1991.
HASAGER, C. B., JENSEN, N. O.: Surface flux aggregation in heterogeneous terrain, Quart. J. Roy. Meteorol. Soc., 125, 075-2102, 1999.
KIESE, R., LI, C., HILBERT, W., PAPEN, H., BUTTERBACH-BAHL, K.: Regional application of PnET-N-DNDC for estimating the N2Osource strength of tropical rainforests in the Wet Tropics of Australia, Global Change Biology, in press, 2004.
PLESSOW, K., ZIMMERMANN, F., MATSCHULLAT, J.: Beitrag von Ammoniak und Salpetersäure zur atmosphärischen Stickstoffde-position in Fichtenwäldern des Osterzgebirges. Tharandter Klimaprotokolle Bd. 9, Hrsg: Ch. Bernhofer, F.H. Berger, V. Gold-berg, Eigenverlag TU-Dresden, 45-47, 2003.
PLESSOW, K., SPINDLER, G., ZIMMERMANN, F., MATSCHULLAT, J.: Höhenabhängige Konzentrationsverteilung und Depositionreaktiver Stickstoffverbindungen in Sachsen (VERTIKO-Zielgebiet), Tagungsband der DACH-Tagung Karslruhe, Sep 07-10,2004.
QUECK, R.: Anchor stations, VERTIKO Newsletter No.5, TU-Dresden, 2003RANNIK, Ü., MARKKANEN, T., VESALA, T.: Turbulence statistics inside and over forest: influence on footprint prediction, Bound.-
Layer Meteorol., 109, 163-189, 2003.SCHAAF, S., DÄMMGEN, U., GRÜNHAGE, L.: Deposition of atmospheric N and S species to arable crops, Environ. Pollut., in prepa-
ration, 2005SLINN, W.G.N.: Predictions for particle deposition to vegetation surfaces, Atmos. Environ., 16, 1785-1794, 1982SUTTON, M.A., BURKHARDT, J.K., GUERIN, D., NEMITZ, E., FOWLER, D.: Development of resistance models to describe measure-
ments of bi-directional ammonia surface-atmosphere exchange, Atmos. Environ., 32, 473-480, 1998.WEIGEL, J. H., DÄMMGEN, U.: The Braunschweig Carbon Project : atmospheric flux monitoring and Free Air Carbon Dioxide Ein-
richment (FACE), J. Appl. Bot., 74, 55-60, 2000.ZIEMANN A., SCHRÖTER, M., ARNOLD, K., RAASCH, S., RAABE, A.: Vergleich von Large-Eddy Simulationen und Messungen mit
der akustischen Tomographie unter inhomogenen Oberflächenbedingungen, Tagungsband der DACH-Tagung Karslruhe,Sep 07-10, 2004.
ZIMMERMANN, F., PLESSOW, K., QUECK, R., MATSCHULLAT, J.: Modellierung von Stickstoffflüssen in einem Fichtenbestand.Tagungsband der DACH-Tagung Karlsruhe, Sep 07-10, 2004.
AFO_003 21.07.2005 13:10 Uhr Seite 89
90 Theme Group 1.2: VERTIKO RESULTS
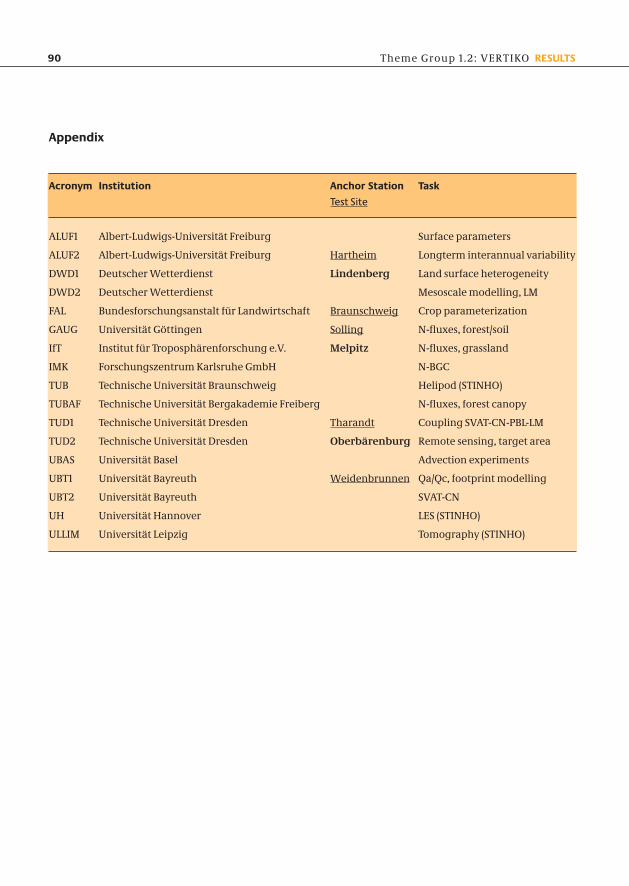
Appendix
Acronym Institution Anchor Station Task
Test Site
ALUF1 Albert-Ludwigs-Universität Freiburg Surface parameters
ALUF2 Albert-Ludwigs-Universität Freiburg Hartheim Longterm interannual variability
DWD1 Deutscher Wetterdienst Lindenberg Land surface heterogeneity
DWD2 Deutscher Wetterdienst Mesoscale modelling, LM
FAL Bundesforschungsanstalt für Landwirtschaft Braunschweig Crop parameterization
GAUG Universität Göttingen Solling N-fluxes, forest/soil
IfT Institut für Troposphärenforschung e.V. Melpitz N-fluxes, grassland
IMK Forschungszentrum Karlsruhe GmbH N-BGC
TUB Technische Universität Braunschweig Helipod (STINHO)
TUBAF Technische Universität Bergakademie Freiberg N-fluxes, forest canopy
TUD1 Technische Universität Dresden Tharandt Coupling SVAT-CN-PBL-LM
TUD2 Technische Universität Dresden Oberbärenburg Remote sensing, target area
UBAS Universität Basel Advection experiments
UBT1 Universität Bayreuth Weidenbrunnen Qa/Qc, footprint modelling
UBT2 Universität Bayreuth SVAT-CN
UH Universität Hannover LES (STINHO)
ULLIM Universität Leipzig Tomography (STINHO)
AFO_003 21.07.2005 13:10 Uhr Seite 90