Embed Size (px)
Citation preview
ENHANCED NCHRP 17-38 SPREADSHEET TOOL
USERS MANUAL
Prepared forHighway Safety Improvement Program
VERSION 2.0
JANUARY 2013


Highway Safety Improvement Program
Enhanced NCHRP 17-38 Spreadsheet Tool
Version 2.0 Users Manual
Illinois Department of Transportation
January 2013


Table of Contents
1. Introduction ............................................................................................................................... 1-1 1.1. Overview .............................................................................................................. 1-1 1.2. New Version Changes ......................................................................................... 1-1
2. Tool New Features Examples .................................................................................................. 2-1 2.1. New Data Entry Overview ................................................................................... 2-1 2.2. Multiyear Analysis Applying Growth Factor ......................................................... 2-8
3. Tool Application of the Predictive Methods ........................................................................... 3-1 3.1. Rural Two-Lane, Two-Way Roads ...................................................................... 3-1 3.2. Rural Multilane Highways .................................................................................. 3-16 3.3. Urban and Suburban Arterials ........................................................................... 3-31
4. Utilities ....................................................................................................................................... 4-1 4.1. Show Detailed Analysis ....................................................................................... 4-1 4.2. Show Calculations ............................................................................................... 4-2 4.3. Print Preview ....................................................................................................... 4-4 4.4. Export Data .......................................................................................................... 4-6 4.5. Edit/Change Analysis .......................................................................................... 4-7 4.6. Help Menu ........................................................................................................... 4-9
Appendix Appendix A: Tab Naming Definition – All Modules .......................................................... A-1 A-1 Rural Two-Lane, Two-Way Roads ................................................................ A-1 A-2 Rural Multilane Highways ............................................................................. A-3 A-3 Urban and Suburban Arterials ...................................................................... A-5 Appendix B: Troubleshooting Office 2003 ....................................................................... B-1
Tables
Table 1 Rural Two Lane Segment Data Needs ............................................................... 3-5 Table 2 Rural Two Lane Intersections Data Needs ......................................................... 3-8 Table 3 Rural Multilane Highways – Divided Segments Data Input .............................. 3-21 Table 4 Rural Multilane Highways – Undivided Segments Data Input .......................... 3-23 Table 5 Rural Multilane Highways – Intersections Data Input ....................................... 3-24 Table 6 Urban and Suburban Arterials - Segment Data Needs .................................... 3-36 Table 7 Urban and Suburban Arterial - Intersection Data Needs .................................. 3-39


ENHANCED NCHRP 17-38 SPREADSHEET TOOL USERS MANUAL
PAGE 1-1
1. Introduction
1.1. Overview
The National Cooperative Highway Research Program (NCHRP) 17-38 project deliverables included the development of briefing materials and a training course to assist highway agencies to understand the Highway Safety Manual (HSM). As part of the project, three Microsoft Excel spreadsheets were developed to help analysts understand how to apply the crash predictive methods for different facility types included in Part C of the HSM. Predictive models for rural two-lane, two-way roads, rural multilane highways, and urban and suburban arterials are provided in HSM Chapters 10, 11, and 12.
The Illinois Enhanced 17-38 Spreadsheet Tool (IEST) has been built using the NCHRP 17-38 spreadsheets as starting point, and provides a more robust and user-friendly interface for applying the three HSM Part C predictive methods.
This second version of the tool provides improved capabilities for analyzing roadway facilities. For example, users can now decide between entering Average Annual Daily Traffic (AADT) information for each year or applying a growth factor.
This manual provides step-by-step instructions for using the IEST tool developed by Illinois Department of Transportation (IDOT). It also provides several example scenarios to assist the analyst in understanding use of the tool in project development.
The manual is organized into four chapters and the appendix. Chapter 1 contains the introduction and new features of the tool. Chapter 2 provides examples of the tool new features. Chapter 3 provides examples of the application of each of the HSM predictive methods using the tool. Chapter 4 describes the utilities included in all modules. Appendix A contains the tab naming definition for all modules. And Appendix B contains the troubleshooting section for Microsoft Office 2003.
1.2. New Version Changes
The new version of the IEST tool includes several new features that are listed below:
Improved user interface
Ability to perform corridor analyses for up to 50 segment/intersection locations
Ability to analyze up to 5 years of data
Ability to apply a growth factor
Improved summary sheets
Additional data entry option using tabular format


ENHANCED NCHRP 17-38 SPREADSHEET TOOL USERS MANUAL
PAGE 2-1
2. Tool New Features Examples
2.1. New Data Entry Overview
One of the major changes in this new version is the additional data entry option. This option allows users to enter data for all segments and intersections in a table format to facilitate the data entry process.
Introduction
The following example intends to demonstrate what steps are required to run an analysis using the new data entry option. This method is similar for all three modules (rural two-lane, rural multilane, and urban and suburban arterials).
STEP 1: Select a predictive method for analysis. The rural two-lane roads module is used in this example. The main menu user form will open.
The main interface still maintains the original multiple-step process to run the analysis. A new purple button has been added and is labeled as Load Input Data from Table.
STEP 2: Select the Load Input Data from Table button to display the input data user form.

ENHANCED NCHRP 17-38 SPREADSHEET TOOL USERS MANUAL
PAGE 2-2
STEP 3: Input the information requested in the fields. Fields may vary with regards to the analysis type chosen. More details regarding each of the analysis types are provided in the examples included in Section 3.
The Total Number of Segments and the Total Number of Intersections should be a number between 0 and 50. For Study Period, enter the period for which crash data is available (for example, 2008 to 2012). The tool has been designed to handle a maximum of 5 years.
Multiyear analyses can now be conducted using either a growth factor or entering AADT for each analysis year. Multiyear analysis options will be enabled only when the difference between study period years is greater than 1. If Apply Linear Traffic Growth Factor (%) is selected, make sure to enter the respective value in percentage. If AADT for each analysis year is available, select Enter AADT for Each Year by clicking on the circle next to the text.
For this example, the study period is from 2008 to 2012. The analysis method selected is Estimate Expected Number of Crashes with Empirical Bayes (EB) adjustment using Observed Crash Data by Site Available. Details about the difference between the EB methods can be found in the Highway Safety Manual, Appendix A, Section A.2.1 (pages A-19 and A-20).
Once the user form is filled in, click Return to Main.

ENHANCED NCHRP 17-38 SPREADSHEET TOOL USERS MANUAL
PAGE 2-3
STEP 4: A warning message appears providing instructions on next steps as shown below. Click OK to continue.
STEP 5: The main interface closes, and two new tabs appear. Segment and intersection data are entered in these two tabs. The naming convention varies between different modules. TLR is for the two-lane rural roads, MLR is for multilane rural roads, and UrbArt is for Urban and Suburban Arterials. In this example, the TLR_3_Seg_Input and TLR_5_Int_Input tabs are used for data entry. The tabs are sequentially numbered, and are displayed based on the type of analysis selected.
Data must be input only in color-coded cells. Cells highlighted in yellow are hardcoded values. Cells highlighted in blue are dropdown menus with pre-set options. If particular data values are the same among all facilities, users can copy and paste, or drag values

ENHANCED NCHRP 17-38 SPREADSHEET TOOL USERS MANUAL
PAGE 2-4
among the different facility types. In the segment tab (TLR_3_Seg_Input), the top portion (1) is where the project information is entered. This information is copied to the calculation and summary sheets. Block 2 includes the list of all the variables required to apply the predictive method. Block 3 contains the facility Base Conditions (see HSM Chapter 10 for details). Each column represents one facility (4). In this case, there are two columns for the two segments. The tool is designed to analyze up to 50 segments.
Block 5 is for the observed crash data. These rows are visible because the Estimate Expected Number of Crashes analysis method was selected.
Block 6 is for the AADT data required to conduct a multiyear analysis. This is visible because the Enter AADT for Each Year option was selected as part of the Multiyear Analysis method (see Step 3).
.
There are three buttons at the bottom of the page.
Next is used to go to the next tab.
Print Input Info is used to set the segment data input tab for printing using the Page Break View.

ENHANCED NCHRP 17-38 SPREADSHEET TOOL USERS MANUAL
PAGE 2-5
Crash by Year is an optional button only used for the Estimate Expected Number of Crashes using Observed Crash Data by Site Available analysis method. This utility is used only if the user wants to document the crashes by year by segment in the spreadsheet. By clicking the button Crash by Year, additional rows at the bottom of the page will be unhidden and crash data for each segment included in the analysis, by severity levels for each study period year, can be entered. In addition, a new button appears (Upload Number of Crashes by Year), which is used to populate the crash data input in the main input table.
STEP 6: Click “Next” to go to the intersections tab (TLR_5_Int_Input). Similar to the segment tab, Block 1is for the project information and Block 2 lists the variables required to apply the predictive method. Block 3 lists the predictive method Base Conditions. Block 4 is the data required for each intersection. Each column represents one facility. Block 5 is for the observed crash data broken down by severity type. Block 6 is for the AADT required to conduct a multiyear analysis. This option is visible only when the Enter AADT for Each Year option is selected.

ENHANCED NCHRP 17-38 SPREADSHEET TOOL USERS MANUAL
PAGE 2-6
STEP 7: Once all the data have been input and reviewed, the next step is to set up the spreadsheets. Click on the LOAD DATA button to run the set-up procedure.
NOTE: There are two additional buttons at the bottom of the page.
Print Input Info is used to set the segment data input tab for printing using the Page Break View.
Crash by Year is an optional button. This utility is used only if the user wants to document the crashes by year and by segment in the spreadsheet. By clicking the button Crash by Year, additional rows at the bottom of the page will be unhidden and crash data for each segment included in the analysis, by severity levels for each study period year, can be entered. In addition, a new button appears (Upload Number of Crashes by Year) and is used to populate the crash data input in the main input table.

ENHANCED NCHRP 17-38 SPREADSHEET TOOL USERS MANUAL
PAGE 2-7
STEP 8: After the process is done running, a new window appears providing instructions about next steps. It indicates what tab contains the summary sheet, and how to move forward with the analysis. From this point forward, the steps are the same either using the original five-step process, or using the new Load Data option. Details about the five-step process are provided in Chapter 3.

ENHANCED NCHRP 17-38 SPREADSHEET TOOL USERS MANUAL
PAGE 2-8
2.2. Multiyear Analysis Applying Growth Factor
Another major change in the new version of the tool is the incorporation of a new method for conducting the multiyear analysis by applying a traffic growth factor. Originally, if the user wanted to conduct a multiyear analysis, AADT by year was a required data input. Annual AADT data are not always available; therefore, application of a growth factor will only require entering data for one year, and the tool will extrapolate the results of the predictive method by applying the growth factor.
Introduction
The following example demonstrates the steps required to run a multiyear analysis by applying a traffic growth factor. This method is similar for all three modules (rural two-lane, rural multilane, and urban and suburban arterials). The multilane rural roads predictive method is used in this example.
STEP 1: Once the user selects the predictive method for the analysis, the main menu user form will open up as seen below.
STEP 2: Select the New Project button. The Multilane Rural Roads Analysis Input user form will appear.
STEP 3: Enter the required data. For this example, two divided segments, two undivided segments, and four intersections will be included in the analysis. The study period is from 2008 to 2012. For the multiyear analysis, Apply Linear Traffic Growth Factor (%) is

ENHANCED NCHRP 17-38 SPREADSHEET TOOL USERS MANUAL
PAGE 2-9
selected, and a value of 2 is used. The analysis method for this example is the Expected Number of Crashes using observed crash data at the project level. The total number of crashes for the project per year is 16. Once all the data are entered, click on Return to Main.
STEP 4: Press the Project Information button, and enter details about the project. Once the form is filled up, press Return to Main to go back to the main menu.
STEP 5: Depending on the Analysis Input, proceed to enter the data. Yellow cells are hard coded values. Blue cells are dropdown menus with pre-set options. In this example, all facility types are included (divided and undivided segments, and intersections); to continue, click on the Divided Segment Input button. A new user form appears asking the user to choose the data input method. Data can be input either using user forms or in a table format. For this example, the Read Data from Table option is selected.

ENHANCED NCHRP 17-38 SPREADSHEET TOOL USERS MANUAL
PAGE 2-10
Once data entry is completed, press Return to Main.
STEP 6: Repeat the same process for undivided segments (if applicable). Press the button Undivided Segment Input, and complete the data entry. Click Return to Main to go back to the main interface
STEP 7: Press the button Intersection Input, and complete the data entry. Click Return to Main to go back to the main interface

ENHANCED NCHRP 17-38 SPREADSHEET TOOL USERS MANUAL
PAGE 2-11
STEP 8: Once all the data entry is completed, press the Set up Spreadsheet button. This button will run the entire set-up process for the application of the predictive method.
STEP 9: Once the process is finished running, a pop-up window will appear, providing users with instructions on the next steps, and where to find results of the analysis. Click OK to continue, and close the main menu interface to go to the summary sheet.
.

ENHANCED NCHRP 17-38 SPREADSHEET TOOL USERS MANUAL
PAGE 2-12
STEP 10: Results can be found in Tabs MLR_9_RuralMultiLn_Proj_EB_Tot and MLR_105_ProjEB_EXSum_GF.
STEP 11: To print, export, make changes, or view the detailed calculations, return to the summary sheet tabs, and use the Return to Main button located in the top right corner.

ENHANCED NCHRP 17-38 SPREADSHEET TOOL USERS MANUAL
PAGE 2-13
Once in the main menu, go to the Output Data tab to access the different utilities included in the tool.
More details about the different utilities included in the Output Data tab will be provided in section 4.


ENHANCED NCHRP 17-38 SPREADSHEET TOOL USERS MANUAL
PAGE 3-1
3. Tool Application of the Predictive Methods
3.1. Rural Two-Lane, Two-Way Roads
Introduction
The Highway Safety Manual (Chapter 10) provides a methodology for estimating the predicted average crash frequency, crash severity, and collision types for rural two-lane, two-way facilities. This chapter is applicable to facilities with two-lane and two-way traffic operations that do not have access control or are outside of cities with a population less than 5,000 people. More details about the applicability of this module can be found in the HSM Section 10.3.
This example illustrates how to apply the Rural Two-Lane, Two-Way Roads predictive method using the IEST tool.
STEP 1: The screen capture below shows the opening page of the IEST tool. Press the Rural Two-Lane, Two-Way Roads button to begin with the analysis.
STEP 2: A new window opens and shows the main menu interface. The main menu is comprised of two main tabs: Input Data and Output Data. The Input Data tab opens by default when starting the tool. The output tab contains a series of utilities including print preview, export, among others. More details about the output tab utilities are provided in section 4.
There are a total of six buttons on the Input Data tab.

ENHANCED NCHRP 17-38 SPREADSHEET TOOL USERS MANUAL
PAGE 3-2
Users now have the ability to run the analysis using two methods. The first one is using the button Load Input Data from Table (described in Section 2.1), and the second one is following steps 1 through 5 (Five Step Process). Both methods produce the same results, but the first one is an abbreviation of the second method. Section 2.1 includes an example using the Load Data from Table process.
For illustrative purposes, this example will be conducted using the Tool’s Five Step Process.
STEP 3: Select the button labeled New Project. The Analysis Input user form will appear.
STEP 4: Input the information requested in the fields. The Total Number of Segments and the Total Number of Intersections should be a number between 0 and 50. For Study Period, enter the period for which crash data is available (for example, 2008 to 2012). The tool has been designed to handle a maximum of 5 years.
Multiyear analyses can now be conducted using either a growth factor or entering AADT for each analysis year. An example with the application of growth factor is provided in Section 2.2. Multiyear analysis options will be enabled only when the difference between study period years is greater than 1. If Apply Linear Traffic Growth Factor (%) is selected, make sure to enter the respective value in percentage. If AADT for each analysis year is available, select Enter AADT for Each Year by clicking on the circle next to the text.

ENHANCED NCHRP 17-38 SPREADSHEET TOOL USERS MANUAL
PAGE 3-3
Analysis Method: If observed crash data is not available, select Estimate Predicted Number of Crashes by clicking on the circle next to the text. If observed crash data is available, select Estimate Expected Number of Crashes by clicking on the circle next to the text.
The expected crash frequency is obtained by applying the Empirical Bayes Method. This method combines the predicted average crash frequency with the observed crash data to provide a more reliable estimate. Selecting the Estimate Expected Number of Crashes option will enable the Analysis Report frame. There are two methods to apply the Empirical Bayes adjustment using observed crash data. The Observed Crash Data by Site Available option is used when available crash data is disaggregated by site (segments and/or intersections), and the Observed Crash Data for the Project Available option is used when observed crash data is only available at aggregated/project level across the all the sites. Refer to HSM Section A.2.4 and A.2.5 (Pages A-19 and A-20) for additional details on the different EB methods.
This analysis includes 2 segments and 2 intersections. The study period is from 2008 to 2012. The multiyear analysis will be conducted using AADT for each year. Estimate Expected Number of Crashes using Observed Crash Data by Site is the selected analysis method.
When complete click on the Return to Main button to return to the main input window.
STEP 5: On the main menu, select the button labeled Project Information.

ENHANCED NCHRP 17-38 SPREADSHEET TOOL USERS MANUAL
PAGE 3-4
STEP 6: Complete the information requested in the General Project Information input window. For Segments Project Information field, enter either a reference milepost or Key Route or Marked Route, or the reference milepost. Key Route refers to the Illinois Roadway Information System (IRIS) terminology and it is a universal identifier for any segment. Marked Route refers to the Division of Traffic Safety route inventory. The key route information is not necessary for intersections, but all information provided will assist in tracking projects. For Intersection Project Information, enter a description for Major Road and Minor Road (for example, SR 27 and Cicero St, respectively). When all fields have been completed, click on Return to Main.
STEP 7: Select the button labeled Segment Input.

ENHANCED NCHRP 17-38 SPREADSHEET TOOL USERS MANUAL
PAGE 3-5
NOTE: Depending on the analysis input data entered, there are instances when an additional user form appears asking about the data entry method.
Enter Data Manually: Data entry is performed one facility at a time using a user form. Read Data from Table: Data entry is performed for all facilities using a table (worksheet)
The main interface closes, and two new tabs appear. Segment and intersection data are entered in these two tabs. The naming convention varies between different modules. TLR is for two-lane rural roads, MLR is for multilane rural roads, and UrbArt is for Urban and Suburban Arterials. For this example the TLR_3_Seg_Input and TLR_5_Int_Input tabs are used for data entry. The tabs are sequentially numbered, and are displayed based on the type of analysis selected.
STEP 8: Enter data in the color-coded cells. Cells highlighted in yellow are hardcoded values. Cells highlighted in blue are dropdown menus with pre-set options. If particular data values are the same among all facilities, users can copy and paste, or drag values among the different facility types. Table 1 provides details of the different variables needed to run the predictive method for segments.
Table 1 Rural Two Lane Segment Data Needs
Variable Name Data Description Segment name Name of the roadway segment. Up to 50 segments Length of Segment Miles AADT AADT for roadway segment

ENHANCED NCHRP 17-38 SPREADSHEET TOOL USERS MANUAL
PAGE 3-6
Variable Name Data Description Lane width Feet Shoulder width Feet Shoulder type Paved, gravel, composite or turf Length of horizontal curve Miles Radius of curvature Feet Spiral transition curve Present or not present Superelevation variance Feet/feet Grade Percent Driveway density Driveways/mile Centerline rumble strips Present or not present Passing lanes Present (1 lane), present (2 lane) or not present Two-Way Left-Turn lane Present or not present Roadside hazard rating 1-7 scale with 1 the safest and 7 the most
dangerous Segment lighting Present or not present Auto speed enforcement Present or not present Calibration factor Derived from calibration process

ENHANCED NCHRP 17-38 SPREADSHEET TOOL USERS MANUAL
PAGE 3-7
There are three buttons at the bottom of the page. Return to Main is used to go to the Main Menu.
Print Input Info is used to set the segment data input tab for printing using the Page Break View.
Crash by Year is an optional button only used for the Estimate Expected Number of Crashes using Observed Crash Data by Site Available analysis method. This utility is used only if the user wants to document the crashes by year by segment in the spreadsheet. By clicking the button Crash by Year, additional rows at the bottom of the page will be unhidden and crash data for each segment included in the analysis, by severity levels for each study period year, can be entered. In addition, a new button appears (Upload Number of Crashes by Year), which is used to populate the crash data input in the main input table.
After entering the data in the worksheet for both segments, click Return to Main.
STEP 9: Select the button labeled Intersection Input.

ENHANCED NCHRP 17-38 SPREADSHEET TOOL USERS MANUAL
PAGE 3-8
STEP 10: Enter data in the color-coded cells. Cells highlighted in yellow are hardcoded values. Cells highlighted in blue are dropdown menus with pre-set options. If particular data values are the same among all facilities, users can copy and paste, or drag values among the different facility types. Table 2 provides details of the different variables needed to run the predictive method for intersections.
Table 2 Rural Two Lane Intersections Data Needs
Variable Name Data Description Intersection name Intersection Name. Up to 50
intersections Intersection type 3ST, 4ST, 4SG AADT major AADT for major roadway segment AADT minor AADT for minor roadway segment Intersection skew angle Degrees If 4ST, does skew differ from minor legs? Yes or No
Skew angle for leg 1 Degrees Skew angle for leg 2 (4ST Only) Degrees
Signalized/Uncontrolled approaches with left turn lane
Between 0 to 4
Signalized/Uncontrolled approaches with right turn lane
Between 0 to 4
Intersection lighting Present or not present Calibration factor Derived from calibration process

ENHANCED NCHRP 17-38 SPREADSHEET TOOL USERS MANUAL
PAGE 3-9
There are three buttons at the bottom of the page.
Return to Main is used to go to the Main Menu.
Print Input Info is used to set the segment data input tab for printing using the Page Break View.
Crash by Year is an optional button only used for the Estimate Expected Number of Crashes using Observed Crash Data by Site Available analysis method. This utility is used only if the user wants to document the crashes by year by segment in the spreadsheet.
After entering the data in the worksheet for both intersections, click Return to Main.

ENHANCED NCHRP 17-38 SPREADSHEET TOOL USERS MANUAL
PAGE 3-10
STEP 11: The last step in the process is to run the Set up Spreadsheet procedure. After the process is done running, a new window appears providing instructions about next steps. It indicates what tab contains the summary sheet, and how to move forward with the analysis. Click OK, and the main menu interface appears.
Close the Rural Two-Lane, Two-Way Roads main menu by clicking on the “X” located in the top right corner of the user form.

ENHANCED NCHRP 17-38 SPREADSHEET TOOL USERS MANUAL
PAGE 3-11
STEP 12: After closing the main menu, the predictive method summary is available, along with other tabs containing back up calculations.
For this example, the summary sheet is located in tab TLR_91_SiteEB_ExSum.

ENHANCED NCHRP 17-38 SPREADSHEET TOOL USERS MANUAL
PAGE 3-12
The user can navigate through the other tabs to make changes if needed. The predictive method calculations for each facility type are available and can be displayed using the utilities in the Output Tab in the main menu. Section 4 of this guide provides additional information regarding the different utilities available for all three modules.
Tab TLR_7_SiteEB_Total, contains the predicted, expected, and observed crashes for all facilities included in the analysis.

ENHANCED NCHRP 17-38 SPREADSHEET TOOL USERS MANUAL
PAGE 3-13
There are three buttons on the top right side of the summaries that can be used to return to the main menu, and to hide and unhide unused rows.
Worksheets (tabs) TLR_3_Seg_Input and TLR_5_Int_Input contain the input data used in this analysis.

ENHANCED NCHRP 17-38 SPREADSHEET TOOL USERS MANUAL
PAGE 3-14
Note: Worksheets TLR_3_Seg_Tables and TLR_5_Int_Input contain the HSM predictive method supporting tables. IDOT has developed state-specific values for all these different distributions. So there is no need to use the HSM default values.
However, the IEST tool is flexible enough to allow modifications to such tables. Input data required from the user but restricted to Yes and No options are provided in the pull-down boxes (Blue cells). Orange cells contain the locally-derived data as shown in the figure below.
STEP 13: To print the summary, export data, or make changes, click on the Return to Main button on the top right side of the summary tabs. This will prompt the main menu. Click on the Output Data tab.

ENHANCED NCHRP 17-38 SPREADSHEET TOOL USERS MANUAL
PAGE 3-15
Show Detailed Analysis: Displays the background summary calculations
Show Calculations: Displays the predictive method calculations (tabs) for each facility included in the analysis.
Print Preview: Prepares the summary sheet for printing.
Export Data: Creates a copy of the spreadsheet.
Edit/Change Analysis: Allows users to make changes, including adding facilities, changing values, and re-running the set-up process.
Help: Provides a hyperlink to the IEST Tool User’s Manual posted on IDOT website.
More details about these utilities are provided in section 4.

ENHANCED NCHRP 17-38 SPREADSHEET TOOL USERS MANUAL
PAGE 3-16
3.2. Rural Multilane Highways
Introduction
The Highway Safety Manual (Chapter 11) provides a methodology for estimating the predicted average crash frequency, crash severity, and collision types for rural multilane highways. This chapter is applicable to all multilane highways without full access control that are outside urban areas with a population less than 5,000 people. More details about the applicability of this module can be found in the HSM Section 11.3.
This example illustrates how to apply the Rural Multilane Highways predictive method using the IEST tool.
STEP 1: The screen capture below shows the opening page of the IEST tool. Press the Rural Multilane Highways button to begin with the analysis.
STEP 2: A new window opens and shows the main menu interface. The main menu is comprised of two main tabs: Input Data and Output Data. The Input Data tab opens by default when starting the tool. The output tab contains a series of utilities including print preview, export, among others. More details about the output tab utilities are provided in section 4.

ENHANCED NCHRP 17-38 SPREADSHEET TOOL USERS MANUAL
PAGE 3-17
In the Input Data tab, there are a total of seven buttons, which are used to run the analyses.
This new version of the tool includes two methods to run the analysis. The first one is using the button Load Input Data from Table, and the second one is following steps 1 through 6. This example will be conducted using the six steps.
STEP 3: Start by pressing the New Project button to display the Analysis Input form.
The Analysis Input window will appear.

ENHANCED NCHRP 17-38 SPREADSHEET TOOL USERS MANUAL
PAGE 3-18
STEP 4: Input the information requested in the fields. The Total Number of Divided Segments, the Total Number of Undivided Segments, and the Total Number of Intersections should be a number between 0 and 50. For Study Period, enter the period for which crash data is available (for example, 2008 to 2012). The maximum study period length is 5 years
Multiyear analyses can now be conducted using either a growth factor or entering AADT for each analysis year. Multiyear analysis options will be enabled only when the difference between study period years is greater than 1. If Apply Linear Traffic Growth Factor (%) is selected, make sure to enter the respective value in percentage. If AADT for each analysis year is available, select Enter AADT for Each Year by clicking on the circle next to the text.
Analysis Method: If observed crash data is not available, select Estimate Predicted Number of Crashes by clicking on the circle next to the text. If observed crash data is available, select Estimate Expected Number of Crashes by clicking on the circle next to the text.
The expected crash frequency is obtained by applying the Empirical Bayes Method. This method combines the predicted average crash frequency with the observed crash data to provide a more reliable estimate. Selecting the Estimate Expected Number of Crashes will enable the Analysis Report frame. There are two methods to apply the Empirical Bayes adjustment using observed crash data. The Observed Crash Data by Site Available is used when available crash data is disaggregated by site (segments and/or intersections), and the Observed Crash Data for the Project Available is used when observed crash data is only available at aggregated/project level across the all the sites. Refer to the HSM Section A.2.4 and A.2.5 (Pages A-19 and A-20) for additional details on the different EB methods.
This analysis includes one divided segment, one undivided segment, and two intersections. The study period is from 2008 to 2012. The Multiyear Analysis will be conducted using AADT for each year. The Estimate Expected Number of Crashes Using Observed Crash Data for the Project Available is the selected analysis method.

ENHANCED NCHRP 17-38 SPREADSHEET TOOL USERS MANUAL
PAGE 3-19
When complete click on the Return to Main button to return to the main input window.
STEP 5: On the main menu, select the button labeled Project Information.
STEP 6: Complete the information requested in the General Project Information. For Divided and Undivided segment project information – Roadway Section, enter either a reference milepost or Key Route or Marked Route. Key Route refers to the Illinois Roadway Information System (IRIS) terminology and is a universal identifier for any segment. Marked Route refers to the Division of Traffic Safety route inventory. The key route information is not necessary for intersections, but all information provided will assist in tracking projects. For Intersection Project Information, enter a description for Major Road and Minor Road (for example, Golf Road/Milwaukee Ave., respectively). When all fields have been completed, click on Return to Main.

ENHANCED NCHRP 17-38 SPREADSHEET TOOL USERS MANUAL
PAGE 3-20
The main menu will re-open.
STEP 7: Select the button labeled Divided Segment Input.
The main interface closes, and two new tabs appear. Segment and intersection data are entered in these two tabs. The naming convention varies between different modules. MLR is for multilane rural roads, TLR is for the two-lane rural roads, and UrbArt is for Urban and Suburban Arterials. For this example the MLR_4.1_Div_Seg_Input, MLR_4.2_Und_Seg_Input and MLR_6.1_Int_Input tabs are used for data entry. The tabs are sequentially numbered, and are displayed based on the type of analysis selected.
STEP 8: Enter data in the color-coded cells. Cells highlighted in yellow are hardcoded values. Cells highlighted in blue are dropdown menus with pre-set options. If particular data values are the same among all facilities, users can copy and paste, or drag values

ENHANCED NCHRP 17-38 SPREADSHEET TOOL USERS MANUAL
PAGE 3-21
among the different facility types. Table 3 provides details of the different variables needed to run the predictive method for segments.
Table 3 Rural Multilane Highways – Divided Segments Data Input
Variable Name Data Description/Units
Segment name Name of the roadway segment. Up to 50 segments
Length of Segment Miles AADT AADT for roadway segment Lane width Feet Shoulder width Feet Shoulder Type–Right Shoulder for divided
Paved, gravel, composite or turf
Median Width Feet Segment lighting Present or not present Auto speed enforcement Present or not present Calibration factor Derived from calibration process
KABC
Fatal and injury crashes recorded for the segment; this value is only applicable for Observed Crash Data by Site Available analysis method
PDO
Property damage only crashes recorded for the segment; this value is only applicable for Observed Crash Data by Site Available analysis method
There are two buttons at the bottom of the page. Return to Main is used to go to the main menu.
Print Input Info is used to set the segment data input tab for printing using the Page Break View.

ENHANCED NCHRP 17-38 SPREADSHEET TOOL USERS MANUAL
PAGE 3-22
When all fields have been completed, click on Return to Main.
STEP 9: Select the button labeled Undivided Segment Input.
STEP 10: Enter data in the color-coded cells. Cells highlighted in yellow are hardcoded values. Cells highlighted in blue are dropdown menus with pre-set options. If particular data values are the same among all facilities, users can copy and paste, or drag values among the different facility types. Table 4 provides details of the different variables needed to run the predictive method for intersections.

ENHANCED NCHRP 17-38 SPREADSHEET TOOL USERS MANUAL
PAGE 3-23
Table 4 Rural Multilane Highways – Undivided Segments Data Input
Variable Name Data Description Segment name Name of the roadway segment. Up to 50 segments Length of Segment Miles AADT AADT for roadway segment Lane width Feet Shoulder width Feet Shoulder Type–Right Shoulder for divided
Paved, gravel, composite or turf
Side Slopes 1:2 or Steeper to 1:7 or Flatter Segment lighting Present or not present Auto speed enforcement Present or not present Calibration factor Derived from calibration process
KABC Fatal and injury crashes recorded for the segment; this value is only applicable for Observed Crash Data by Site Available analysis method
PDO Property damage only crashes recorded for the segment; this value is only applicable for Observed Crash Data by Site Available analysis method
There are two buttons at the bottom of the page.
Return to Main is used to go to the Main Menu.
Print Input Info is used to set the segment data input tab for printing using the Page Break View.
When all fields have been completed, click on Return to Main.
STEP 11: Select the button labeled Intersection Input.

ENHANCED NCHRP 17-38 SPREADSHEET TOOL USERS MANUAL
PAGE 3-24
STEP 12: Enter the information requested in the fields of the Rural Multilane Intersection Input window for each intersection included in the analysis. Cells highlighted in yellow are hardcoded values. Cells highlighted in blue are dropdown menus with pre-set options. If particular data values are the same among all facilities, users can copy and paste, or drag values among the different facility types. Table 5 provides details of the different variables needed to run the predictive method for intersections.
Table 5 Rural Multilane Highways – Intersections Data Input
Variable Name Data Description Intersection name Name of the intersection. Up to 50 intersections
Intersection type Three-leg stop control (3ST), four-leg stop control (4ST), four-leg signalized intersection (4SG).
AADT major AADT for major roadway segment AADT minor AADT for minor roadway segment Intersection skew angle Degrees Number of non-STOP-Controlled approaches with LT lane
0, 1, or 2
Number of non-STOP-Controlled approaches with RT lane
0, 1, 2, 3 or 4
Intersection lighting Present or not present Calibration Factor, Cr Derived from calibration process
KABC
Fatal and injury crashes recorded for the segment; this value is only applicable for Observed Crash Data by Site Available analysis method
PDO
Property damage only crashes recorded for the segment; this value is only applicable for Observed Crash Data by Site Available Analysis method

ENHANCED NCHRP 17-38 SPREADSHEET TOOL USERS MANUAL
PAGE 3-25
There are two buttons at the bottom of the page.
Return to Main is used to go to the Main Menu.
Print Input Info is used to set the segment data input tab for printing using the Page Break View.
When all fields have been completed, click on Return to Main.
STEP 13: Select the button labeled Set up Spreadsheet.
Based on the selected options when creating a new project the user will get a message similar to the image shown below with next step instructions.

ENHANCED NCHRP 17-38 SPREADSHEET TOOL USERS MANUAL
PAGE 3-26
Click OK, and then close the Rural Multilane Highways main menu user form by clicking on the “X” button on the top right of the box..
The IEST tool can be used for analyzing single facilities, as well as for corridors with multiple segments and intersections and multi-year crash data. The Set up Spreadsheet procedure will create a customized summary sheet depending on the number of facilities, study period, and analysis method selected.
STEP 14: For this example the final results will be shown in tab MLR_102_ProjEB_ExSum. The executive summary contains predicted and expected average crash frequency for Total, Fatal and Injury (KABC), and Property Damage Only (PDO) crashes. In addition, the HSM Potential for Safety Improvement is included. The executive summary is shown below:

ENHANCED NCHRP 17-38 SPREADSHEET TOOL USERS MANUAL
PAGE 3-27
The user can navigate through the other tabs to make changes if needed. The predictive method calculations for each facility type are available and can be displayed using the utilities in the Output Tab in the main menu. Section 4 of this guide provides additional information regarding the different utilities available for all three modules.
Tab MLR_9_RuralMultiLn_Proj_EB_Tot, contains the predicted, expected, and observed crashes for all the facilities included in the analysis.

ENHANCED NCHRP 17-38 SPREADSHEET TOOL USERS MANUAL
PAGE 3-28
There are three buttons on the top right side of the summaries that can be used to return to the main menu, hide and unhide unused rows.
Tabs MLR_4.1_Div_Seg_Input, MLR_4.2_Und_Seg_Input, and MLR_6.1_Int_Input contain the input data used in this analysis.
Note: Worksheets MLR_4_Seg Tables and MLR_6_Int Tables contain the HSM predictive method supporting tables. IDOT has developed state-specific values for all these different distributions. So there is no need to use the HSM default values.
However, the IEST tool is flexible enough to allow modifications to such tables. Input data required from the user but restricted to Yes and No options are provided in the pull-down boxes (Blue cells). Orange cells contain the locally-derived data as shown in the figure below.

ENHANCED NCHRP 17-38 SPREADSHEET TOOL USERS MANUAL
PAGE 3-29
STEP 15: To print the summary, export data, or make changes, click on the Return to Main button on the top right side of the summary tabs. This will prompt the main menu. Click on the Output Data tab.

ENHANCED NCHRP 17-38 SPREADSHEET TOOL USERS MANUAL
PAGE 3-30
Show Detailed Analysis: Displays the background summary calculations
Show Calculations: Displays the predictive method calculations (tabs) for each facility included in the analysis.
Print Preview: Prepares the summary sheet for printing.
Export Data: Creates a copy of the spreadsheet.
Edit/Change Analysis: Allows users to make changes, including adding facilities, changing values, and re-running the set-up process.
Help: Provides a hyperlink to the IEST tool user’s manual posted on IDOT website.
More details about these utilities are provided in section 4.

ENHANCED NCHRP 17-38 SPREADSHEET TOOL USERS MANUAL
PAGE 3-31
3.3. Urban and Suburban Arterials
Introduction
The Highway Safety Manual (Chapter 12) provides a methodology for estimating the predicted average crash frequency, crash severity, and collision types for urban and suburban facilities. This chapter is applicable to arterials without full access control (other than freeway), with two- or four-lane undivided facilities, four-lane divided and three- and five-lane roads with center two-way left-turn lanes in urban and suburban areas. More details about the applicability of this module can be found in the HSM Section 12.3.
This example illustrates how to apply the Urban and Suburban Arterials predictive method using the IEST tool.
STEP 1: The screen capture below shows the opening page of the IEST tool. Press the Urban and Suburban Arterials button to begin with the analysis.
STEP 2: A new window opens and shows the main menu interface. The main menu is comprised of two main tabs: Input Data and Output Data. The Input Data tab opens by default when starting the tool. The output tab contains a series of utilities including print preview, export, among others. More details about the output tab utilities are provided in section 4.

ENHANCED NCHRP 17-38 SPREADSHEET TOOL USERS MANUAL
PAGE 3-32
This new version of the tool includes two methods to run the analysis. The first one is using the button Load Input Data from Table, and the second one is following steps 1 through 5. This example will be conducted using the five steps.
STEP 3: Select the button labeled New Project. The Analysis Input user form will appear.
STEP 4: Input the information requested in the fields. The Total Number of Segments and the Total Number of Intersections should be a number between 0 and 50. For Study Period, enter the period for which crash data is available (for example, 2008 to 2011).
Multiyear analyses can now be conducted using either a growth factor or entering AADT for each analysis year. Multiyear analysis options will be enabled only when the difference between study period years is greater than 1. If Apply Linear Traffic Growth Factor (%) is selected, make sure to enter the respective value in percentage. If AADT for each analysis year is available, select Enter AADT for Each Year by clicking on the circle next to the text. Details on how to apply the Linear Traffic Growth Factor can be found in Section 2.2.
Analysis Method: If observed crash data is not available, select Estimate Predicted Number of Crashes by clicking on the circle next to the text. If observed crash data is available, select Estimate Expected Number of Crashes by clicking on the circle next to the text.

ENHANCED NCHRP 17-38 SPREADSHEET TOOL USERS MANUAL
PAGE 3-33
The expected crash frequency is obtained by applying the Empirical Bayes Method. This method combines the predicted average crash frequency with the observed crash data to provide a more reliable estimate. Selecting the Estimate Expected Number of Crashes will enable the Analysis Report frame. There are two methods to apply the Empirical Bayes adjustment using observed crash data. The Observed Crash Data by Site Available is used when available crash data is disaggregated by site (segments and/or intersections), and the Observed Crash Data for the Project Available is used when observed crash data is only available at aggregated/project level across the all the sites. Refer to the HSM Section A.2.4 and A.2.5 (Pages A-19 and A-20) for additional details on the different EB methods.
This analysis includes 2 segments and 3 intersections. The study period is from 2008 to 2011. The multiyear analysis will be conducted using AADT for each year. Estimate Expected Number of Crashes using Observed Crash Data by Site is the selected analysis method.
When complete click on the Return to Main button to return to the main input window.
STEP 5: On the main menu, select the button labeled Project Information.

ENHANCED NCHRP 17-38 SPREADSHEET TOOL USERS MANUAL
PAGE 3-34
STEP 6 Complete the information requested in the General Project Information input window. For Segments Project Information, enter either a reference milepost or Key Route or Marked Route. Key Route refers to the Illinois Roadway Information System (IRIS) terminology and it is a universal identifier for any segment. Marked Route refers to the Division of Traffic Safety route inventory. The key route information is not necessary for intersections, but all information provided will assist in tracking projects. For Intersection Project Information, enter a description for Major Road and Minor Road (for example, Golf Road / Milwaukee Ave., respectively). When all fields have been completed, click on Return to Main.
STEP 7: Select the button labeled Segment Input.
ENHANCED NCHRP 17-38 SPREADSHEET TOOL USERS MANUAL
PAGE 3-35
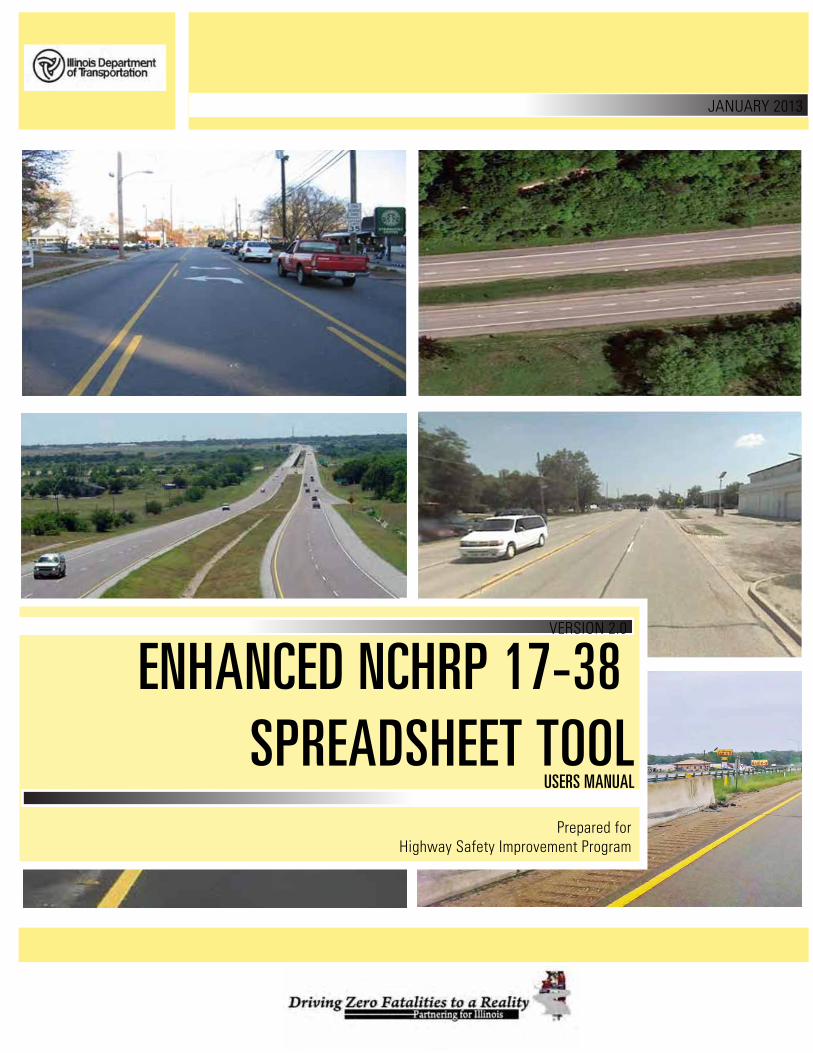
NOTE: Depending on the analysis input data entered, there are instances when an additional user form appears asking about the data entry method.
Enter Data Manually: Data entry is performed one facility at a time using a user form. Read Data from Table: Data entry is performed for all facilities using a table (worksheet)
The main interface closes, and two new tabs appear. Segment and intersection data are entered in these two tabs. The naming convention varies between different modules. TLR is for the Two-Lane Rural roads, MLR is for Multilane Rural roads, and UrbArt abbreviation is for Urban and Suburban Arterials. For this example the UrbArt_3_Seg_Input and UrbArt_5_Int_Input tabs are used for data entry. The tabs are sequentially numbered, and are displayed based on the type of analysis selected.
STEP 8: Enter data in the color-coded cells. Cells highlighted in yellow are hardcoded values. Cells highlighted in blue are dropdown menus with pre-set options. If particular data values are the same among all facilities, users can copy and paste, or drag values among the different facility types. Table 6 provides details of the different variables needed to run the predictive method for segments.

ENHANCED NCHRP 17-38 SPREADSHEET TOOL USERS MANUAL
PAGE 3-36
Table 6 Urban and Suburban Arterials - Segment Data Needs
Variable Name Data Description
Segment name Name of the roadway segment. Up to 50 segments
Roadway type 2U, 3T, 4U, 5T Length of Segment Miles AADT AADT for roadway segment Type of on-street parking None, parallel, or angle Proportion of curb length with on-street parking
Percent of on-street parking available. Includes both sides of the road (percent)
Median width-for divided only Not present, or select from scale 10 Feet to 100 Feet
Lighting Present or not present Auto speed enforcement Present or not present Major commercial driveways Number in segment Minor commercial driveways Number in segment Major industrial/institutional driveways
Number in segment
Minor industrial/institutional driveways
Number in segment
Major residential driveways Number in segment Minor residential driveways Number in segment Other driveways Number of other driveways in segment Speed Category 30mph or lower, or greater than 30mph Roadside fixed object density Fixed objects/miles Offset to roadside fixed objects Feet Calibration factor Derived from calibration process
Multiple Vehicle Driveway Crashes
KABC and PDO crashes recorded for the segment; this value is only available for Observed Crash Data by Site Available
Multiple Vehicle Non-driveway Crashes
KABC and PDO crashes recorded for the segment; this value is only available for Observed Crash Data by Site Available
Single Vehicle Crashes KABC and PDO crashes recorded for the segment; this value is only available for Observed Crash Data by Site Available

ENHANCED NCHRP 17-38 SPREADSHEET TOOL USERS MANUAL
PAGE 3-37
There are three buttons at the bottom of the page.
Return to Main is used to go to the Main Menu.
Print Input Info is used to set the segment data input tab for printing using the Page Break View.
Crash by Year is an optional button only used for the Estimate Expected Number of Crashes using Observed Crash Data by Site Available analysis method. This utility is used only if the user wants to document the crashes by year by segment in the spreadsheet. By clicking the button Crash by Year, additional rows at the bottom of the page will be unhidden and crash data for each segment included in the analysis, by severity levels for each study period year, can be entered. In addition, a new button appears (Upload Number of Crashes by Year), which is used to populate the crash data input in the main input table.

ENHANCED NCHRP 17-38 SPREADSHEET TOOL USERS MANUAL
PAGE 3-38
When all fields have been completed, click on Return to Main.
STEP 9: Select the button labeled Intersection Input.

ENHANCED NCHRP 17-38 SPREADSHEET TOOL USERS MANUAL
PAGE 3-39
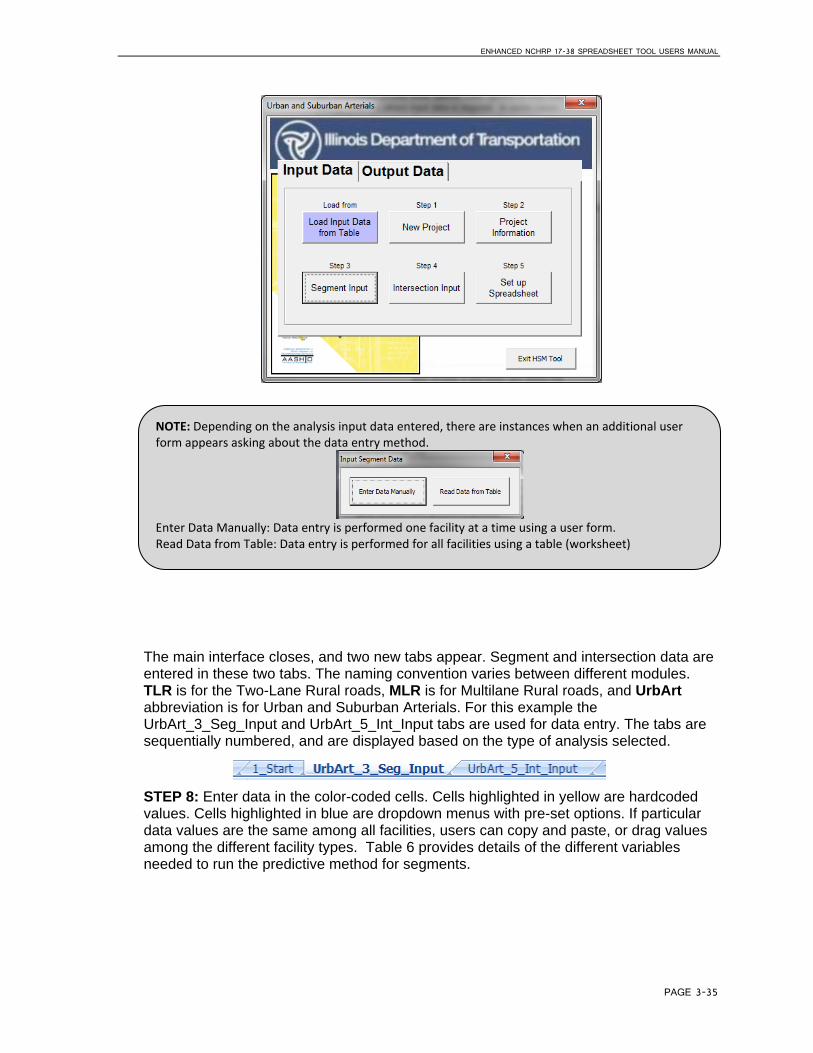
STEP 10: Enter data in the color-coded cells. Cells highlighted in yellow are hardcoded values. Cells highlighted in blue are dropdown menus with pre-set options. If particular data values are the same among all facilities, users can copy and paste, or drag values among the different facility types. Table 7 provides details of the different variables needed to run the predictive method for intersections.
Table 7 Urban and Suburban Arterial - Intersection Data Needs
Variable Name Data Description
Intersection name Name of the roadway segment. Up to 20 segments
Intersection type 3ST, 4ST, 4SG AADT major AADT for major roadway segment AADT minor AADT for major roadway segment Intersection lighting Present or not present Calibration factor Derived from calibration process Data for unsignalized intersections only Number of major-road approaches with left-turn lanes
0,1, or 2
Number of major-road approaches with right-turn lanes
0,1, or 2
Data for signalized intersections onlyNumber of approaches with left-turn lanes 0,1,2,3 or 4 Number of approaches with right-turn lanes 0,1,2,3 or 4 Number of approaches with left-turn signal passing
0,1,2,3 or 4
Type of left-turn signal phasing for Leg #1 Not applicable, permissive, protected, protected/permissive, or permissive/protected
Type of left-turn signal phasing for Leg #2 Not applicable, permissive, protected, protected/permissive, or permissive/protected
Type of left-turn signal phasing for Leg #3 Not applicable, permissive, protected, protected/permissive, or permissive/protected
Type of left-turn signal phasing for Leg #4 Not applicable, permissive, protected, protected/permissive, or permissive/protected
Number of approaches with right-turn-on-red prohibited
0,1,2,3, or 4
Intersection red light cameras Present or not present Sum of all pedestrian crossing volumes-only signalized intx
Sum of pedestrian volume
Maximum number of lanes crossed by a pedestrian
Number of lanes
Number of bus stops within 300 m (1,000 ft) of intersection
Number
Schools within 300 m (1,000 ft) of intersection
Number
Number of alcohol sales establishments Number

ENHANCED NCHRP 17-38 SPREADSHEET TOOL USERS MANUAL
PAGE 3-40
Variable Name Data Description within 300 m (1,000 ft)
Multiple Vehicle Crashes
KABC and PDO crashes recorded for the intersection; this value is only available for Observed Crash Data by Site Available
Single Vehicle Crashes
KABC and PDO crashes recorded for the intersection; this value is only available for Observed Crash Data by Site Available
There are three buttons at the bottom of the page.
Return to Main is used to go to the Main Menu.
Print Input Info is used to set the segment data input tab for printing using the Page Break View.
Crash by Year is an optional button only used for the Expected crash frequency using observed crash data by site. This utility is used only if the user wants to document the crashes by year by segment in the spreadsheet.
ENHANCED NCHRP 17-38 SPREADSHEET TOOL USERS MANUAL
PAGE 3-41
After entering the data in the worksheet for both intersections, click Return to Main.

ENHANCED NCHRP 17-38 SPREADSHEET TOOL USERS MANUAL
PAGE 3-42
STEP 11: The last step in the process is to run the Set up Spreadsheet procedure. After the process is done running, a new window appears providing instructions about next steps. It indicates what tab contains the summary sheet, and how to move forward with the analysis. Click OK, and the main menu interface appears.
Close the Urban and Suburban Arterials main menu by clicking on the “X” located in the top right corner of the user form.

ENHANCED NCHRP 17-38 SPREADSHEET TOOL USERS MANUAL
PAGE 3-43
STEP 12: After closing the main menu, the predictive method summary is available, along with other tabs containing back up calculations (see figure below).
For this example, the summary sheet is located in tab UrbArt_91_SiteEB_ExSum.
ENHANCED NCHRP 17-38 SPREADSHEET TOOL USERS MANUAL
PAGE 3-44
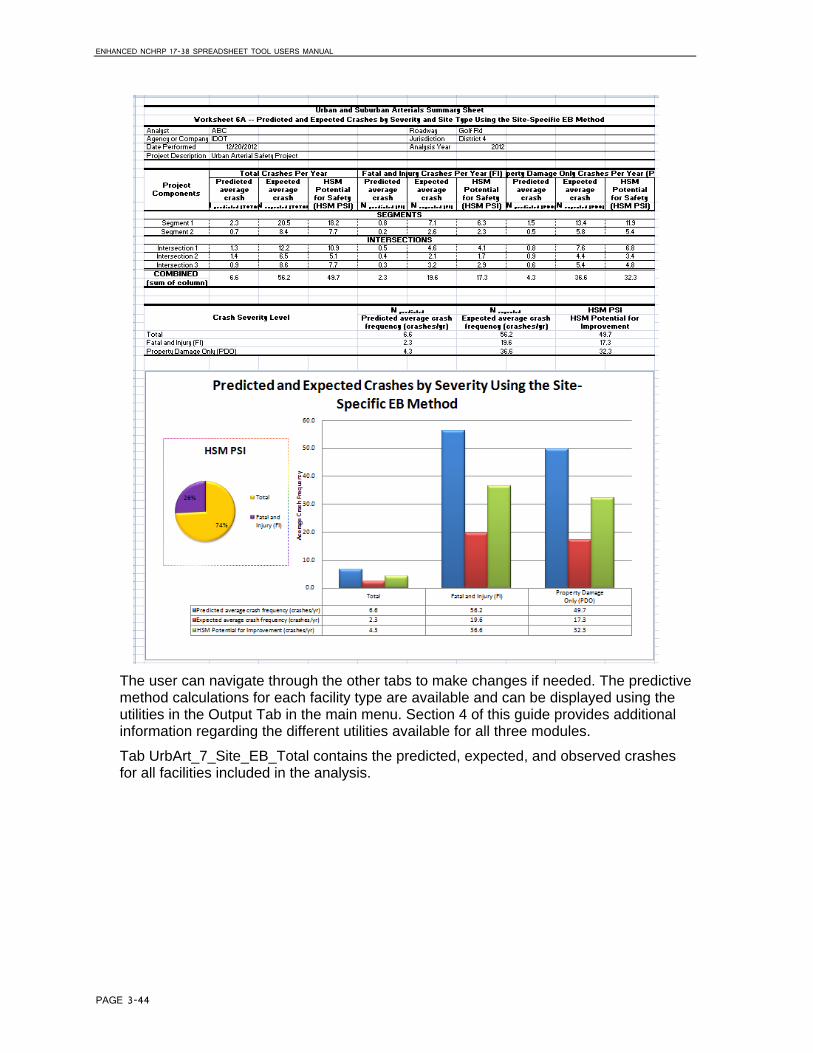
The user can navigate through the other tabs to make changes if needed. The predictive method calculations for each facility type are available and can be displayed using the utilities in the Output Tab in the main menu. Section 4 of this guide provides additional information regarding the different utilities available for all three modules.
Tab UrbArt_7_Site_EB_Total contains the predicted, expected, and observed crashes for all facilities included in the analysis.

ENHANCED NCHRP 17-38 SPREADSHEET TOOL USERS MANUAL
PAGE 3-45
There are three buttons on the top right side of the summaries that can be used to return to the main menu, and to hide and unhide unused rows.

ENHANCED NCHRP 17-38 SPREADSHEET TOOL USERS MANUAL
PAGE 3-46
Note: Worksheets UrbArt_3_Seg Tables and UrbArt_5_Int Tables contain the HSM predictive method supporting tables. IDOT has developed state-specific values for all these different distributions. So there is no need to use the HSM default values.
However, the IEST tool is flexible enough to allow modifications to such tables. Input data required from the user but restricted to Yes and No options are provided in the pull-down boxes (Blue cells). Orange cells contain the locally-derived data as shown in the figure below.
STEP 13: To print the summary, export data, or make changes, click on the Return to Main button on the top right side of the summary tabs. This will prompt the main menu. Click on the Output Data tab.

ENHANCED NCHRP 17-38 SPREADSHEET TOOL USERS MANUAL
PAGE 3-47
Show Detailed Analysis: Displays the background summary calculations
Show Calculations: Displays the predictive method calculations (tabs) for each facility included in the analysis.
Print Preview: Prepares the summary sheet for printing.
Export Data: Creates a copy of the spreadsheet.
Edit/Change Analysis: Allows users to make changes, including adding facilities, changing values, and re-running the set-up process.
Help: Provides a hyperlink to the IEST Tool User’s Manual posted on IDOT website.
More details about these utilities are provided in section 4.


ENHANCED NCHRP 17-38 SPREADSHEET TOOL USERS MANUAL
PAGE 4-1
4. Utilities
Another major change in this new version is the utility functions. The Output Data utilities functions have been expanded and now include Show Detailed Analysis, Show Calculations, Print Preview, Export Data, Edit/Change Analysis, and Help Menu options.
The following examples demonstrate what steps are required to apply the utility functions. This method is similar for all three modules (rural two-lane, rural multilane, and urban and suburban arterials).
4.1. Show Detailed Analysis
The Show Detailed Analysis option allows users to enter data for all segments and intersections in a table format facilitating the data entry process.
This example is a continuation of the Chapter 3.2 Rural Multilane Highways.
Once the Set up Spreadsheet procedure has been run, and the analysis is completed, the user has the option to unhide the summary containing the calculations.
Go back to any summary sheet, and click Return to Main. In the main menu, go to the Output Data tab.
Click on the “Show Detailed Analysis” button, to unhide the summary worksheet. A user form will pop up providing details about the tab containing the desired summary sheet.
After clicking “OK”, the user form will close down, taking users back to the main menu.
Close the main menu by clicking on the “X” located in the top right corner of the user form to access the summary sheet.

ENHANCED NCHRP 17-38 SPREADSHEET TOOL USERS MANUAL
PAGE 4-2
Tab MLR_9_RuralMultiLn_Proj_EB_Tot, contains the predicted, expected, and observed crashes for all the facilities included in the analysis.
4.2. Show Calculations
The Show Calculations button is used to access the detailed calculations of each segment and intersection. The screen captures below are the continuation of the rural multilane highways example from Section 3.2 of the manual. By clicking the Show Calculations button, the users will unhide the templates containing the HSM predictive method calculations used for the analysis.

ENHANCED NCHRP 17-38 SPREADSHEET TOOL USERS MANUAL
PAGE 4-3
After clicking on the button, the following message box pops up, indicating that the process is completed. Click “OK” to continue.
After this user form and the main menu are closed, the individual segment and intersection tabs can be accessed.

ENHANCED NCHRP 17-38 SPREADSHEET TOOL USERS MANUAL
PAGE 4-4
These tabs contain the input data for all the facilities included in the analysis.
4.3. Print Preview
The print preview button is used to set up the summary sheet for printing. After running this utility, the summary will be displayed in Page Break View format.
Go back to any summary sheet, and click Return to Main. In the main menu, go to the Output Data tab. Click the Print Preview button to run this utility.

ENHANCED NCHRP 17-38 SPREADSHEET TOOL USERS MANUAL
PAGE 4-5
After the process is done running, a message box will pop up indicating the Summary sheet print preview is ready.
Users can make changes as needed before sending the print preview page to the printer.

ENHANCED NCHRP 17-38 SPREADSHEET TOOL USERS MANUAL
PAGE 4-6
This page is set to fit into one page letter size paper. Users can use Excel’s Page Layout functions to modify the page setup.
To modify the print area, go to Page Layout, and choose Print Area in Page Setup as shown above.
The users could also go back to the main menu to perform other actions by clicking the Return to Main button.
4.4. Export Data
This function can be used anytime during the analysis. Following the Chapter 3.2 example, the main menu Output Data tab includes the Export Data option, which allows the users to export the data and save/create a copy of the analysis.

ENHANCED NCHRP 17-38 SPREADSHEET TOOL USERS MANUAL
PAGE 4-7
When the Export Data button is clicked, users will be directed to the following screen to save a copy of the analysis. Select a preferred file name and location.
After pressing the “Save” button, a copy of the spreadsheet containing the analysis is created in the specified location. Once the process is complete, two message boxes open up indicating the file has been saved, and providing instructions on how to proceed.
4.5. Edit/Change Analysis
The Edit/Change Analysis button is a new function that allows users to modify an existing analysis. Once the user has run the Set up Spreadsheet in the user form approach, or has run the process using the Load Data button, the analysis has been completed. With the Edit/Change utility, users can make changes such as adding or deleting facilities from the analysis, including additional crash data to run the EB

ENHANCED NCHRP 17-38 SPREADSHEET TOOL USERS MANUAL
PAGE 4-8
adjustments methods, or applying a growth factor instead of entering AADT for each year, among many other options.
Without running this utility, users can make very minor changes to the template worksheets containing the HSM predictive method calculations. Any other major change can only be completed/run using the Edit/Change Utility.
STEP 1: Press Return to Main button located in any summary page to go back to the main menu.
STEP 2: Users are given the option to confirm whether they want to move forward with making changes to the analysis. Note that once the process is started, the tool will be reset, and the analysis will be deleted. However, the data entered for the original analysis will be maintained.
After pressing the Edit/Change Analysis button, a message box appears asking whether users are sure they want to proceed with modifying the existing analysis.
Press “No” to cancel modifying the analysis.
Press “Yes” to continue with the changes. The analysis will be reset, but the input data will be retained. If the analysis included multiple facilities (more than 1 segment /intersection) the following message box will appear asking permission to delete the tabs that were created during the set-up process. The tool only needs 1 template tab for each facility to run. Click delete as many times as needed to complete the process.

ENHANCED NCHRP 17-38 SPREADSHEET TOOL USERS MANUAL
PAGE 4-9
STEP 3: After all the unnecessary tabs are deleted, another message box indicating that reset process is now completed will appear.
STEP 4: Press “OK” and then close the main menu. This will take the users back to the opening page of the IEST tool. Now the tool has been reset and is ready for editing and updating, while the segment and intersection original data the users have entered previously is still saved in the tool.
The tool is now ready to be modified. Repeat the steps used in the original analysis and make necessary changes as needed.
4.6. Help Menu
The Help Menu provides various resources for the users when they have questions and problems using the tool. The Help Menu can be accessed through the Output Tab in the main menu.

ENHANCED NCHRP 17-38 SPREADSHEET TOOL USERS MANUAL
PAGE 4-10
By pressing the Help button users can download the IEST Users Manual, access the different predictive methods instructions worksheets, and connect via hyperlink to the official HSM website. A screen capture of the help menu is shown below.
The instruction tabs provide information about tab naming conventions, facility types AADT thresholds, and provide a legend explaining the different color coded cells.

ENHANCED NCHRP 17-38 SPREADSHEET TOOL USERS MANUAL
PAGE 4-11
Tabs naming convention:
Facilities AADT thresholds:
Color coding scheme details in the worksheets:
Press “Finish” to close the Help Menu.


PAGE A-1
Appendix
Appendix A: Tab Naming Definition – All Modules
A-1 Rural Two-Lane, Two-Way Roads
Worksheet Name Contents
TLR_0_Instructions
Current worksheet displaying overview, summary of spreadsheet worksheets, predictive method AADT thresholds, and description of color coding included in the worksheets.
TLR_1_Construction
Data in this worksheet has been used to help define the pull-down options in the analysis worksheets. There is no need for a user to work within this worksheet, but the worksheet should be retained so that the other worksheets can continue to use the options included in this sheet.
TLR_2_Seg 1
Analysis for the rural 2-lane segments that uses lookup tables from exhibits included in the worksheet "Segment Tables." The associated HSM worksheets are 1A, 1B, 1C, 1D, and 1E.
TLR_3_Seg Tables
Includes segment tables used for analysis of HSM- provided crash trends as well as locally-derived crash information. These are HSM Tables 10-3, 10-4, and 10-12. This worksheet also includes tables used for CMF calculations, and HSM Tables 10-8, 10-9, and 10-10.
TLR_4_Int 1
Analysis for the rural 2-lane intersections that uses lookup tables from exhibits included in the worksheet "Intersection Tables." The associated HSM worksheets are 2A, 2B, 2C, 2D, and 2E.
TLR_5_Int Tables
Includes intersection tables used for analysis of HSM- provided crash trends as well as locally-derived crash information. These are HSM Tables 10-5, 10-6, and 10-15. This worksheet also includes tables used for CMF calculations. These tables include Tables 10-13 and 10-14.
TLR_6_Predicted Total
Predicted number of crashes summary sheet using results from the 2-lane segments as well as 2-lane intersections worksheets. This analysis can be performed if no historic crash data is available within the study limits. The associated HSM worksheets are 3A and 3B.

ENHANCED NCHRP 17-38 SPREADSHEET TOOL USERS MANUAL
PAGE A-2
Worksheet Name Contents
TLR_7_Site EB Total
Analysis for site-specific EB analysis using results from the rural 2-lane segment as well as rural 2-lane intersection worksheets. This analysis can be performed if the analyst knows the exact location of historic crashes within the study limits. The associated HSM worksheets are 4A and 4B.
TLR_8_Project EB Total
Analysis for project-specific EB analysis using results from the rural 2-lane segment as well as rural 2-lane intersection worksheets. This analysis can be performed if the analyst has historic crash data, but does not know the exact location within the project limits at which the crashes occurred. The associated HSM worksheets are Worksheets 5A and 5B.
TLR_91_SiteEB_ExSum
Executive summary report for site-specific EB analysis. This report uses results from tab TLR_7_Site EB Total. This report is available when users perform a site-specific EB multiyear analysis entering AADT for each year.
TLR_92_ProjEB_ExSum
Executive summary report for project-specific EB analysis. This report uses results from tab TLR_8_Project EB Total. This report is available when users perform a project-specific EB multiyear analysis entering AADT for each year.
TLR_93_EB_ExSum_GF
Executive summary report for site-specific EB analysis. This report uses results from tab TLR_7_Site EB Total. This report is available when users perform a site-specific EB multiyear analysis and apply a linear traffic growth factor.
TLR_94_Pred_ExSum_GF
Executive summary report for the predicted number of crashes method. This report uses results from tab TLR_6_Predicted Total. This report is available when users perform a predicted crash multiyear analysis and apply linear traffic growth factor.
TLR_95_ProjEB_ExSum_GF
Executive summary report for project-specific EB analysis. This report uses results from tab TLR_8_Project EB Total. This report is available when users perform a project-specific EB multiyear analysis and apply linear traffic growth factor.

PAGE A-3
A-2 Rural Multilane Highways
Worksheet Name Contents
MLR_0_Instructions Current worksheet displaying overview, summary of spreadsheet worksheets, and description of color coding included in the worksheets.
MLR_1_Construction
Data in this worksheet has been used to help define the pull-down options in the analysis worksheets. There is no need for a user to work within this worksheet, but the worksheet should be retained so that the other worksheets can continue to use the options included in this sheet.
MLR_2_Rural Div MultiLn Seg 1
Analysis for the rural divided multilane segment analysis includes AADT specific Table 11-16. The associated HSM worksheets are Worksheets 1A, 1B(a), 1C(a), 1D(a), and 1E.
MLR_3_Rural Und MultiLn Seg 1
Analysis for the rural undivided multilane segment analysis includes AADT specific Tables 11-11 and 11-12. The associated HSM worksheets are Worksheets 1A, 1B(b), 1C(b), 1D(b), and 1E.
MLR_4_Seg Tables
Worksheet shows exhibits for use by the segment worksheets. These exhibits are independent and do not depend on input values. This worksheet includes exhibits that summarize crash information and can be modified for locally-derived conditions. These are Tables 11-4, 11-6, 11-15, and 11-19. Tables specific to CMFs are also included. The CMF tables in this worksheet are 11-13, 11-14, 11-17, and 11-18.
MLR_5_Rural MultiLn Int 1 Analysis for the rural multilane intersection analysis includesTables 11-9 and 11-24. The associated HSM worksheets are Worksheets 2A, 2B, 2C, 2D, and 2E.
MLR_6_Int Tables Tables 11-9 and 11-24 are intersection exhibits for estimating crash distributions and can be modified for locally-derived conditions if this information is available.
MLR_7_Rural MultiLn Pred Total
Predicted number of crashes summary sheet using results from the rural divided and undivided segments as well as rural intersection multilane worksheets. This analysis can be performed if no historic crash data is available within the study limits. The associated HSM worksheets are 3A and 3B.

ENHANCED NCHRP 17-38 SPREADSHEET TOOL USERS MANUAL
PAGE A-4
Worksheet Name Contents
MLR_8_RuralMulti_Ln_Site_EB_Tot
Analysis for site-specific EB analysis using results from the rural divided and undivided segment as well as rural intersection multilane worksheets.This analysis can be performed if the analyst knows the exact location of historic crashes within the study limits. The associated HSM worksheets are Worksheets 3A and 3B.
MLR_9_RuralMultiLn_Proj_EB_Tot
Analysis for project-specific EB analysis using results from the rural divided and undivided segment as well as rural intersection multilane worksheets. This analysis can be performed if the analyst has historic crash data, but does not know the exact location within the project limits at which the crashes occurred. The associated HSM worksheets are Worksheets 4A and 4B.
MLR_101_SiteEB_ExSum
Executive summary report for site-specific EB analysis. This report uses results from tab MLR_8_RuralMulti_Ln_Site_EB_Tot. This report is available when users perform a site-specific EB multiyear analysis entering AADT for each year.
MLR_102_ProjEB_ExSum
Executive summary report for project-specific EB analysis. This report uses results from tab MLR_9_RuralMultiLn_Proj_EB_Tot. This report is available when users perform a project-specific EB multiyear analysis entering AADT for each year
MLR_103_Pred_ExSum_GF
Executive summary report for the predicted number of crashes method. This report uses results from tab MLR_7_Rural MultiLn Pred Total. This report is available when users perform predicted crash multiyear analysis and apply linear traffic growth factor.
MLR_104_SiteEB_ExSum_GF
Executive summary report for site-specific EB analysis. This report uses results from tab MLR_8_RuralMulti_Ln_Site_EB_Tot. This report is available when users perform a site-specific EB multiyear analysis and apply a linear traffic growth factor.
MLR_105_ProjEB_ExSum_GF
Executive summary report for project-specific EB analysis. This report uses results from tab MLR_9_RuralMultiLn_Proj_EB_Tot. This report is available when users perform a project-specific EB multiyear analysis and apply linear traffic growth factor.
PAGE A-5
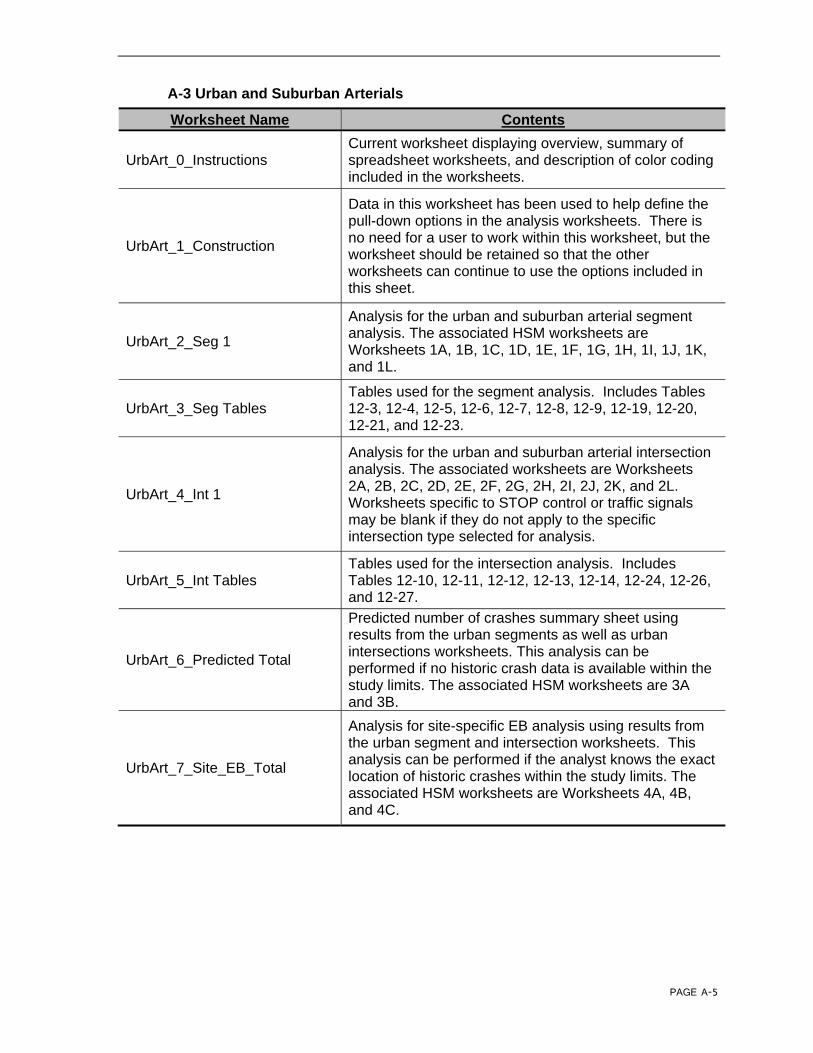
A-3 Urban and Suburban Arterials
Worksheet Name Contents
UrbArt_0_Instructions Current worksheet displaying overview, summary of spreadsheet worksheets, and description of color coding included in the worksheets.
UrbArt_1_Construction
Data in this worksheet has been used to help define the pull-down options in the analysis worksheets. There is no need for a user to work within this worksheet, but the worksheet should be retained so that the other worksheets can continue to use the options included in this sheet.
UrbArt_2_Seg 1
Analysis for the urban and suburban arterial segment analysis. The associated HSM worksheets are Worksheets 1A, 1B, 1C, 1D, 1E, 1F, 1G, 1H, 1I, 1J, 1K, and 1L.
UrbArt_3_Seg Tables Tables used for the segment analysis. Includes Tables 12-3, 12-4, 12-5, 12-6, 12-7, 12-8, 12-9, 12-19, 12-20, 12-21, and 12-23.
UrbArt_4_Int 1
Analysis for the urban and suburban arterial intersection analysis. The associated worksheets are Worksheets 2A, 2B, 2C, 2D, 2E, 2F, 2G, 2H, 2I, 2J, 2K, and 2L. Worksheets specific to STOP control or traffic signals may be blank if they do not apply to the specific intersection type selected for analysis.
UrbArt_5_Int Tables Tables used for the intersection analysis. Includes Tables 12-10, 12-11, 12-12, 12-13, 12-14, 12-24, 12-26, and 12-27.
UrbArt_6_Predicted Total
Predicted number of crashes summary sheet using results from the urban segments as well as urban intersections worksheets. This analysis can be performed if no historic crash data is available within the study limits. The associated HSM worksheets are 3A and 3B.
UrbArt_7_Site_EB_Total
Analysis for site-specific EB analysis using results from the urban segment and intersection worksheets. This analysis can be performed if the analyst knows the exact location of historic crashes within the study limits. The associated HSM worksheets are Worksheets 4A, 4B, and 4C.

ENHANCED NCHRP 17-38 SPREADSHEET TOOL USERS MANUAL
PAGE A-6
Worksheet Name Contents
UrbArt_8_Proj_EB_Tot
Analysis for project-specific EB analysis using results from the rural divided and undivided segment as well as rural intersection multilane worksheets. This analysis can be performed if the analyst has historic crash data, but does not know the exact location within the project limits at which the crashes occurred. The associated HSM worksheets are Worksheets 4A and 4B.
UrbArt_91_SiteEB_ExSum
Executive summary report for site-specific EB analysis. This report uses results from tab UrbArt_7_Site_EB_Total. This report is available when users perform a site-specific EB multiyear analysis entering AADT for each year.
UrbArt_92_ProjEB_ExSum
Executive summary report for project-specific EB analysis. This report uses results from tab UrbArt_8_Proj_EB_Tot. This report is available when users perform a project-specific EB multiyear analysis entering AADT for each year
UrbArt_93_Pred_ExSum_GF
Executive summary report for the predicted number of crashes method. This report uses results from tab UrbArt_6_Predicted Total. This report is available when users perform predicted crash multiyear analysis and apply linear traffic growth factor.
UrbArt_94_SiteEB_ExSum_GF
Executive summary report for site-specific EB analysis. This report uses results from tab UrbArt_7_Site_EB_Total. This report is available when users perform a site-specific EB multiyear analysis and apply a linear traffic growth factor.
UrbArt_95_ProjEB_ExSum_GF
Executive summary report for project-specific EB analysis. This report uses results from tab UrbArt_8_Proj_EB_Tot. This report is available when users perform a project-specific EB multiyear analysis and apply linear traffic growth factor.

PAGE B-1
Appendix B: Troubleshooting Office 2003
I opened the file from the IDOT website, and tried to run the tool, but I am getting the error shown below. How can I fix it?
You must download the tool and save it to your computer prior to use. Download the tool and click the Save button.
Choose where you would like to save the tool. Name it appropriately.

ENHANCED NCHRP 17-38 SPREADSHEET TOOL USERS MANUAL
PAGE B-2
After the download is completed, click Open, and the tool is ready to use.
When I opened the tool I clicked on Disable Macros, and the tool doesn’t work.
Close the tool without saving changes and reopen it. Make sure to enable macros.
I accidentally saved the tool with the input data for my project inside. Is there a way to obtain the original tool without all the changes I made?
Yes. Go back to IDOT website (http://www.dot.state.il.us/illinoisCHSP/hsip.html) and download and save the tool again on your computer. If you want to save the information you input for a specific project, try using the Export Data option included in the tool under Output data.

Priscilla A. Tobias, PEState Safety Engineer, Bureau Chief
Illinois Dept. of Transportation, Bureau of Safety Engineering2300 S. Dirksen Parkway, Room 323
Springfield, IL 62764ph. 217-782-3568fax 217-782-0377