Embed Size (px)
Citation preview

Version 2.2April 2003
40-0024-03
Profile P2
A Portable Instrument for Assessing the ConditionOf Circuit Breakers.
Operation Manual
KELMAN LTD.Lissue Industrial Estate East, Lisburn, Co. Antrim, N.Ireland. BT28 2RB
Tel. +44 (0)28 92622 915 Fax : +44 (0)28 92622202 e-mail: [email protected] Website: www.kelman.co.uk

Contents
1. Introduction
2. System Description
2.1 Profile P2 Handset2.2 P2 Interface Unit2.3 DC Current Probe2.4 DC Voltage Sensing Leads2.5 Main Interrupter timing using the clip-on CT2.6 Additional Equipment
3. Profile P2 Operation
3.1 Getting Started3.1.0 Turning on/off3.1.1 Batteries3.1.2 Check Display3.1.3 Date & Time3.1.4 Trigger Level
3.2 Testing a Circuit Breaker3.2.1 Connecting the Profile for a standard test3.2.2 3-Phase Testing of an Energised Circuit Breaker3.2.3 3-Phase testing of a De-energised Circuit
Breaker3.2.4 Performing a Test
4. Analysis of the Test Results
5. Examination of Stored Records
2

6. Setup Menu
6.1 Date & Time6.2 LCD6.3 Trigger Level6.4 System
6.4.1 Text Settings6.4.2 Barcode Settings6.4.3 Analysis Settings
6.5 Calibration
7. Advanced Features
7.1 Using the Barcode Reader7.2 Using the Analysis Editing Feature
3

1. Introduction
The current economic pressures on the electrical utilityindustry have posed the problem of how to operate andmaintain the system with decreasing financial andmanpower resources while increasing 'power quality' to thecustomer. This has led the industry to begin to move to a"Reliability Centered Maintenance" philosophy.
The Profile gives utility management a new tool to permitthem to move away from costly, scheduled, maintenanceprocedures and to target their maintenance budget in themost cost-effective way. It does this by providing essentialinformation on breaker performance for a fraction of theprevious expenditure.
The Profile monitors the current flowing in the dc trip orclose circuit during breaker operation. It does this by usinga Hall Effect clamp-on probe (a dc ct) to monitor the dcsupply to the breaker.
Experience has shown that the magnitude, duration, andshape of this coil current can be directly related tomechanism and contact operation, with any change in thesecritical operating parameters being shown as a change inthe shape of the coil current profile.
The Profile P2 now offers the feature of three phase testingof both energised and de-energised circuit breakers.
As a result of this new testing technique, we can offerseveral technical and economic advantages.
� By using the Profile the circuit breaker can be tested in theenergised state. For an on-line test there are noconnections to the high voltage elements of the CB, hence
4
eliminating costly outage procedures.
· A single operator can perform the test in about 10 minutes.
· By only using switching operations rather than outages, anentire bank of breakers can be tested in 1-2 hours, a featsimply not possible with traditional methods.
· By testing the breaker in service we can analyze the firsttrip, which is not possible with traditional methods. This isimportant since we can show how the breaker would haveperformed if called upon to trip in a real situation. Theprevious test methods all require the breaker to be opened,isolated, closed, and grounded before any tests can beperformed. This often is sufficient to free any stiction in themechanism thus masking breaker problems.
Using the Profile handset in conjunction with the P2Interface Unit allows the the operator to examine the spreadof the three poles of the breaker. It allows the operator totest the CB off-line by supplying 24Vdc to the main contactsso their make/break times can be accurately measured.
Using the ReplayPro software supplied with the Profile,trends in CB performance can be examined. All operationscan be compared and contrasted against previous records,or of breakers of a similar type, allowing detailed analysis ofthe CB.
The Profile P2 can be used to quickly and easily identifybreakers in need of attention and also eliminate costlyunnecessary work on the remaining healthy equipment,giving utility personnel a tool to enable them to target theirmaintenance budget in the most effective way.
5

2. System Description
The Profile is supplied in a rugged carrying case. Thesystem consists of the following parts: -
2.1 Profile P2 Handset
This is a microprocessor based data acquisition andanalysis system. It is controlled using the integral keypad toselect simple menu options on the large LCD. The handsetcan record and store up to 100 tests in nonvolatile RAM. Abacklight is provided for use in low light conditions.
In the standard configuration the unit can monitor both thedc voltage and current in the mechanism under test.Additionally, the status of the breaker interrupters aredetermined by registering the load current flowing throughthe breaker contacts during the test.
An RS-232 serial port is provided to download records to aPC and also gives the option of using a barcode reader toenter breaker ID information.
4 x 1.5V AA batteries (standard or rechargeable) power theunit in stand alone mode.
2.2 P2 Interface Unit
The P2 Interface Unit enables the operator to measuremake or break times of the main contacts, either indirectlyusing clip-on CTs for the energised breaker, or directly whenthe breaker is out of service. The Interface Unit is acpowered and equiped with necessary isolation andprotection to allow it to operate in the high induction fieldsfound in sub-stations.The Interface Unit also provides thepower to the handset, when connected. For on-line testing
6

of breakers there are three connections for the necessaryclip-on CTs. For off-line testing there are three connectionsfor the voltage supply leads to the main contacts, and onefor the common. The Interface Unit is connected to thehandset by the attached umbilical lead. There is a lightedpower switch, and a switch to dictate the mode of operation,either ‘on-line’ or ‘off-line’. Three CTs are supplied foroperation with the P2 Interface Unit.
P2 Interface Unit
A - Mains power connection.B - Power ON/OFF switch.C - Operational mode switch.D - Three clip-on CT connections for ‘on-line’ test.E - Three input voltage connections & common for ‘off-
line’ test.F - Umbilical lead connection to Profile handset.
2.3 DC Current Probe
The current probe plugs directly into the handset and isclamped over the existing dc wiring to the breaker. It has anauto-ranging input sensitivity from 2A to 20A.
7
DC
A
B
EF

A thumbwheel on the probe is used to zero out any dc offseton the measured signal. The input circuitry has beendesigned to be insensitive to the direction of the current flow.
2.4 DC Voltage Sensing Leads
A set of fused test leads is provided for monitoring the dcvoltage at the breaker during operation. The leads are ratedat 600V/0.5A. The Profile P2 will automatically correct forreverse polarity.
The dc voltage input is designed to measure between 0 Vand 265 Vdc. The voltage input will, however withstandinputs of up to 300 V dc or 250 V ac.
2.5 Main Interrupter Timing using clip-on CT
For a standard profile test a single clip-on CT is clampedaround the secondary wiring of one phase of the breakerprotection CTs to monitor the ac load current flowing throughthe breaker during a test. This will measure the presence ofcurrent through the main contacts.
For an ‘on-line’ three-phase test, three clip-on CT’s arerequired in conjunction with the Interface Unit. These areconnected to the secondary side of the main CT’s for eachphase. This input has been designed to operate with a verylarge range of secondary CT currents.
8

2.6 Additional Equipment
ReplayPro Software
A software package is available to permit records stored inthe handset to be downloaded to a PC via RS-232 serial communications. This software stores the records in adatabase structure and permits the user to search for,display and manipulate records.
There is a detailed manual for the operation of theReplayPro software.
The following equipment can be specified to give additionalcapability to the basic unit.
Barcode Reader
A barcode reader is available, which can speed up the inputof breaker ID information by scanning barcodes on eachbreaker. It is connected to the handset via the RS-232 port.
P1plus Vibration Analysis Unit
The P1plus records the vibration in the breaker structureduring trip and close operations. These vibration patternsform unique signatures for each breaker type and can beused to analyze the mechanical operation in greater detailthan with the standard profile.
9

3. Profile P2 Operation
The Profile P2 is controlled by a simple menu structuredisplayed on the LCD.
When the system is powered up the main menu isdisplayed. This provides the user with three options asshown below.
Perform a breaker test -
View previous tests -Examine system setup parameters -
Examine memory status -
3.1 Getting Started
Before the system is used for the first time there are somebasic parameters which should be checked.
3.1.0 Turning on/off
To turn on, press and hold the power button until a beep isheard. The button can then be released, and the unit willpower up.
To turn off, momentarily press the power button.
The unit will automatically power off after 7 minutes, if nokeys are pressed, unless the unit is in the ‘ARMED’ state,where it will wait indefinitely.
10
11:24:14
TEST
AUXILIARY
STATUS
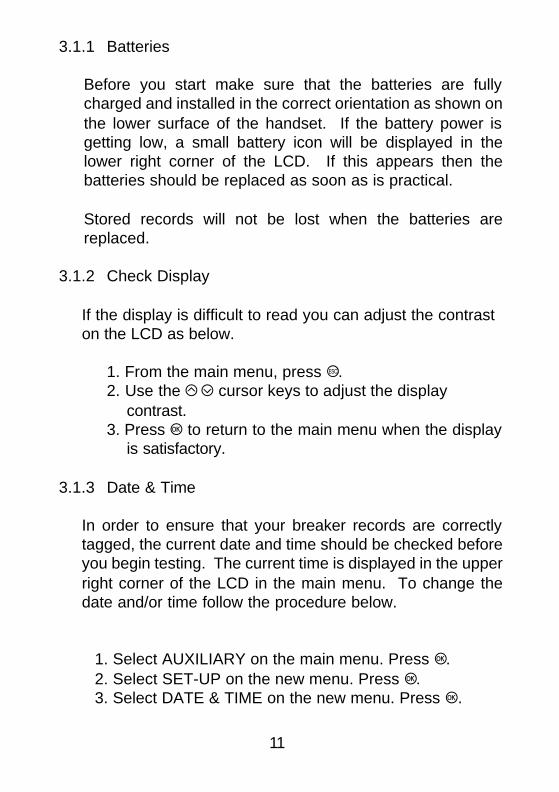
3.1.1 Batteries
Before you start make sure that the batteries are fullycharged and installed in the correct orientation as shown onthe lower surface of the handset. If the battery power isgetting low, a small battery icon will be displayed in thelower right corner of the LCD. If this appears then thebatteries should be replaced as soon as is practical.
Stored records will not be lost when the batteries arereplaced.
3.1.2 Check Display
If the display is difficult to read you can adjust the contraston the LCD as below.
1. From the main menu, press U.2. Use the S A cursor keys to adjust the display
contrast.3. Press R to return to the main menu when the display
is satisfactory.
3.1.3 Date & Time
In order to ensure that your breaker records are correctlytagged, the current date and time should be checked beforeyou begin testing. The current time is displayed in the upperright corner of the LCD in the main menu. To change thedate and/or time follow the procedure below.
1. Select AUXILIARY on the main menu. Press R.2. Select SET-UP on the new menu. Press R.3. Select DATE & TIME on the new menu. Press R.
11
4. The display will now show the current date and time inthe format below.
YY/MM/DDHH:MM:SS
5. Use the S A cursor keys to advance the highlightedparameter to the desired value. Use the B ☼ cursor keysto move between the different parameters. Press R whenthe correct information is displayed to store the date andtime. Press U to cancel changes.
3.1.4 Trigger Level.
In order to capture a breaker profile the system monitors thesignal from the dc current probe. A record will only beinitiated when the current flowing in the dc circuit of thebreaker rises above a preset level. This is called the triggerlevel.
To get the most accurate results this level should be set toas low a value as possible. The default setting is 0.2A. Thisshould be ideal for most applications, however if there areunwanted signals superimposed on the dc current it may benecessary to raise the trigger level above the 'noise floor' toget reliable results. If the trigger level is too high, no recordwill be generated on breaker operation.
To adjust the trigger level, follow the procedure below:
12
TRIGGER LEVEL
0.2A
1. Select the SETUP menu as before. Press R.
2. Select TRIGGER and press R. The current trigger levelwill be displayed as below.
3. Use the S A cursor keys to increment the displayed value to the desired level. Press R to store the new data, or U to cancel the changes.
All of the parameters listed above are stored within the unitand will remain unchanged even when the unit is poweredoff (the time will also continue to run). Therefore it shouldnot be necessary to re-adjust them even when the batteriesin the unit are replaced.
3.2 Testing a Circuit Breaker
There are many different circuit breakers in service and it isnot practical to give specific instructions for each type.However, there are several important principles to follow forsuccessful operation of the Profile P2.
The Profile P2 monitors the current flowing in the dc trip orclose circuit during breaker operation. It does this by usinga Hall Effect clamp-on probe (a dc CT) to monitor the dcsupply to the breaker. It has been shown that themagnitude, duration, and shape of this coil current can bedirectly related to mechanism and contact operation, withany change in these critical operating parameters beingshown as a change in the shape of the coil current profile.
13

3.2.1 Connecting the Profile for a standard test.
The diagram below shows a typical test connection for theProfile P2.
Profile method of connection
In connecting to the breaker under test, it is importantto remember several points.
� The current probe can be fitted anywhere in the dc currentpath. Direction of current flow is not important.
� The connection point should be chosen to eliminate anyother sources of current drain if possible. If there are otherdevices drawing current through the monitoring point, it mayobscure the trip coil profile of the breaker.
14

� It is best to fit the current probe at the negative return of thedc circuit in the circuit breaker. This means all Breakeroperations should be captured from one place.
� Try to fit the current probe away from sources of airborne RFinterference, such as auxiliary contacts, which arc duringbreaker operation. This will ensure the cleanest profilesignal.
� The current probe operates by detecting the magnetic fieldgenerated by the dc current. In order to get the mostaccurate signal it is vital that the probe is connected in sucha way so that it is not subjected to additional magneticfields. The coils themselves or other ac or dc currentsflowing in the wire bundles can sometimes generate thesefields.
� The voltage monitoring leads should be connected right atthe breaker to give the best indication of the quality of thedc supply. They should not be connected directly acrossthe trip or close coil.
� The clip-on CT should be connected to the secondaryprotection wiring for the breaker being tested. It should benoted that in order to obtain a measurement, the breakershould be on-load and a minimum of 10 mA should beflowing through the secondary wiring.
15
3.2.2 3-Phase Testing of an Energised Circuit Breaker
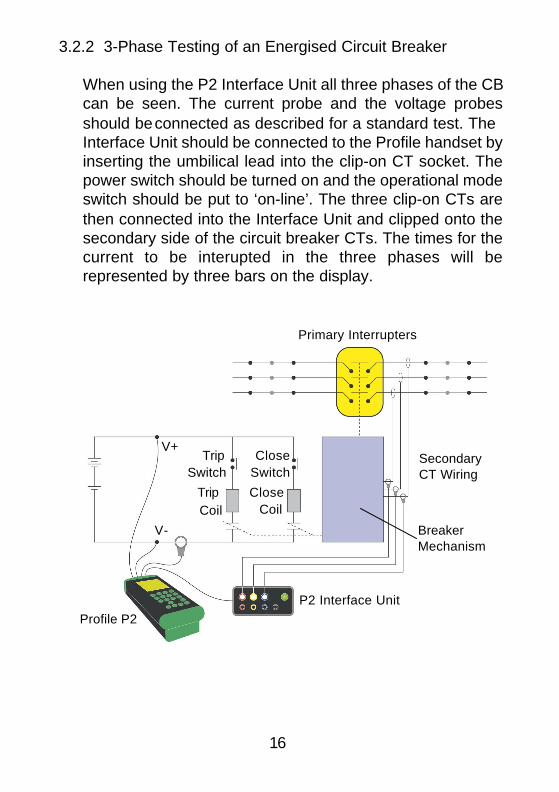
When using the P2 Interface Unit all three phases of the CBcan be seen. The current probe and the voltage probesshould beconnected as described for a standard test. TheInterface Unit should be connected to the Profile handset byinserting the umbilical lead into the clip-on CT socket. Thepower switch should be turned on and the operational modeswitch should be put to ‘on-line’. The three clip-on CTs arethen connected into the Interface Unit and clipped onto thesecondary side of the circuit breaker CTs. The times for thecurrent to be interupted in the three phases will berepresented by three bars on the display.
16
Primary Interrupters
CloseSwitch
TripSwitch
V+
V-
CloseCoil
TripCoil
P2 Interface Unit
Profile P2
SecondaryCT Wiring
BreakerMechanism

3.2.3 3-Phase testing of a De-energised Circuit Breaker.
When a circuit breaker is off-line the Profile P2 can be usedto get accurate measurements of the main contact timingsdue to the lack of arcing that exists under load conditions,hence ‘pole-spread’ can be measured. The connections forthe battery voltage measurements and the dc current probeto the breaker are the same as before. The timing of themain contacts is done slightly diiferently. The Interface Unitsupplies 24Vdc to the main contacts and enables it tomeasure their operation directly. This is done by usingcrocodile clip connections to supply the voltage at one sideof the switch, and commoning the other side. Theoperational mode switch needs set to ‘off-line’ and thepower switch turned on. This is shown in the diagram.
17
Primary Interrupters
CloseSwitch
TripSwitch
V+
V-
CloseCoil
TripCoil
P2 Interface Unit
Profile P2
SecondaryCT Wiring
BreakerMechanism

3.2.4 Performing a Test
Select the TEST option from the main menu. Press R.
� The flashing cursor can be positioned using the S A B ☼
keys. Use the alphanumeric keys to enter or edit theSUBSTATION, Breaker TYPE and Breaker ID information.(The keys will cycle through A-B-C-1-A... etc.). When thedesired information is shown on the display press the R keyto move to the next line.
Press R to enter the text.
The Test number is automatically incremented after eachrecord.
HintTry and use a simple identification system that will allowrecords to be easily grouped together once transferred toPC for storage and analysis.
� The final field is shown in the lower right corner of thedisplay. This field is used to identify the type of test beingperformed.
18
SUBSTATION :
123456789012345678901
BKR TYPE :
123456789012345678901
BKR ID :
123456789012345678901
TEST NO : 108 T
The default display is '-' but this can be cycled through T (fortrip), C (for close), TF (for trip-free) using the B ☼ cursorkeys. Note: You can leave this field as the default '-' if youare using the CT to detect load flow through the breaker.The Profile will then automatically be able to identify recordsas Trip or Close depending on the status of the CT signal.
� Connect the Probe and the handset to the breaker undertest, as shown in the diagram in section 3.2.1. Ensure thatthe current probe is turned on. Press R to proceed.
� The Profile P2 will automatically correct for small offsetsignals from the dc current probe, however if the offset istoo large the display will prompt the user to adjust thethumbwheel on the Probe until the display reads 0. PressR to continue.
� The Profile P2 is now armed and ready to record the currentprofile when the breaker is operated electrically.
The initial dc voltage is also shown on the display as a finalcheck that the voltage probes have been connectedcorrectly. This value will not change, even if you disconnectthe probes, since it represents only a 'snapshot' value of thevoltage at the time the Profile is armed.
It is important to remember to operate the breakerelectrically. There will be no current profile if thebreaker is tripped or closed using a mechanical device.
The operation can be initiated in several ways, all of whichwill provide acceptable results. For example,
Local push button control at the breaker.Remote control via SCADA.
19
Manual trip initiation from protection relay(s).Electrical jumper at the breaker.
In all cases it is important to ensure a solid trip signalto avoid corruption of the profile caused by a poorcontact.
The Profile handset can store up to 100 records in a cyclicmemory buffer. Therefore it is recommended that recordsare downloaded on a regular basis to prevent any loss ofdata.
20

4. Analysis of the Test Results
When the breaker operation has been recorded, the currentprofile is displayed on the LCD as shown below. The tripcoil current is analyzed by dividing the operation into threeregions as shown; pre latch release, latch transition, andmechanism motion.
� The time at the cursor position is given in milliseconds in thelower right corner of the LCD.
� The B ☼ cursor keys can be used to scroll the display intime.
� The S A cursor keys expand and compress the time scaleof the display around the cursor position.
� The INSERT key can be used to toggle the display of thedc voltage trace on and off.
Pressing the R key instructs the Profile P2 to begin theanalysis of the record and attempt to identify the keyparameter points shown below. After a few seconds theseare displayed along with the graph.
21

Ltch: Time when the trip latch is released (ms).Bffr: Time when the trip coil slug reaches the
end of its motion (ms).Acon: Time when the 'a' contact interrupts the trip
coil current (ms).End: Time when the trip coil current reaches
zero (ms).MC_A: Time of transition of the main interrupter
contacts.Ipk1: Amplitude of first current peak (A dc).Iplt: Maximum current during record (A dc).
If the dc voltage monitoring option is used, the followingparameters are also given.
Vini: Initial voltage before breaker operation (V dc).
Vmin: Minimum voltage during breaker operation(V dc).
Pressing R again will instruct the profile P2 to analyse thedata for the main contacts ‘pole spread’.
MC_A = ‘a’ phaseMC_B = ‘b’ phaseMC_C = ‘c’ phaseMC_S = Maximum time difference between phases, ‘pole
spread’
22
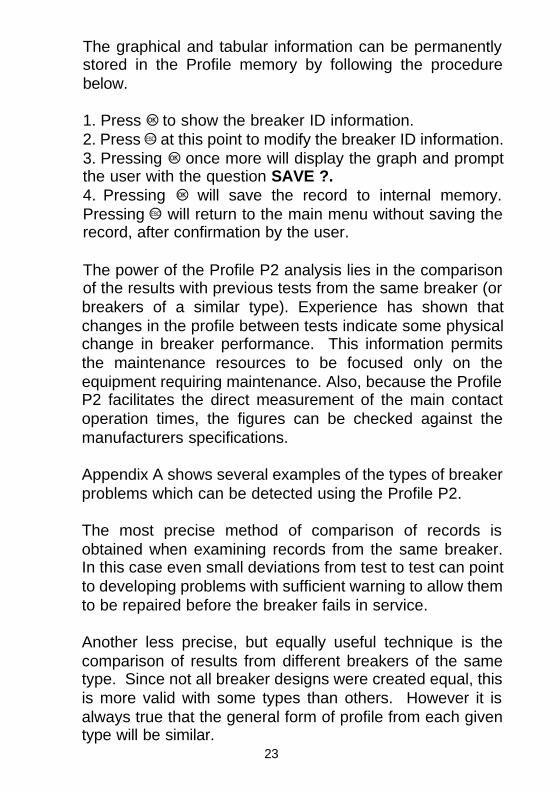
The graphical and tabular information can be permanentlystored in the Profile memory by following the procedurebelow.
1. Press R to show the breaker ID information.2. Press U at this point to modify the breaker ID information.3. Pressing R once more will display the graph and promptthe user with the question SAVE ?.4. Pressing R will save the record to internal memory.Pressing U will return to the main menu without saving therecord, after confirmation by the user.
The power of the Profile P2 analysis lies in the comparisonof the results with previous tests from the same breaker (or breakers of a similar type). Experience has shown thatchanges in the profile between tests indicate some physicalchange in breaker performance. This information permitsthe maintenance resources to be focused only on theequipment requiring maintenance. Also, because the ProfileP2 facilitates the direct measurement of the main contactoperation times, the figures can be checked against themanufacturers specifications.
Appendix A shows several examples of the types of breakerproblems which can be detected using the Profile P2.
The most precise method of comparison of records isobtained when examining records from the same breaker.In this case even small deviations from test to test can pointto developing problems with sufficient warning to allow themto be repaired before the breaker fails in service.
Another less precise, but equally useful technique is thecomparison of results from different breakers of the sametype. Since not all breaker designs were created equal, this is more valid with some types than others. However it isalways true that the general form of profile from each giventype will be similar.
23
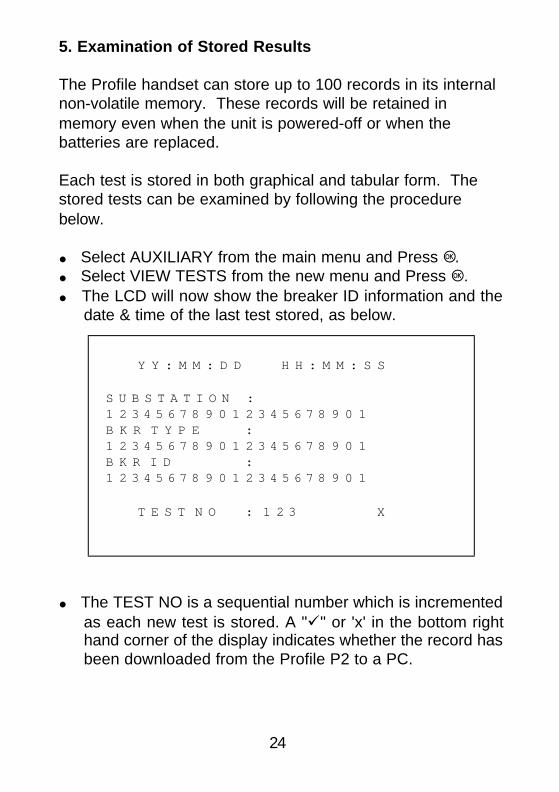
5. Examination of Stored Results
The Profile handset can store up to 100 records in its internalnon-volatile memory. These records will be retained inmemory even when the unit is powered-off or when thebatteries are replaced.
Each test is stored in both graphical and tabular form. Thestored tests can be examined by following the procedurebelow.
� Select AUXILIARY from the main menu and Press R.� Select VIEW TESTS from the new menu and Press R.� The LCD will now show the breaker ID information and the
date & time of the last test stored, as below.
� The TEST NO is a sequential number which is incrementedas each new test is stored. A "ü" or 'x' in the bottom righthand corner of the display indicates whether the record hasbeen downloaded from the Profile P2 to a PC.
24
YY:MM:DD HH:MM:SS
SUBSTATION :
123456789012345678901
BKR TYPE :
123456789012345678901
BKR ID :
123456789012345678901
TEST NO : 123 X

� The user can step through the stored tests by using the B☼ cursor keys. After each key push the information on thescreen will be seen to change. The unit will beep when thestart or end of the stored records is reached.
� Pressing D will toggle a hi-light on the date. When the dateis hi-lighted, the B ☼ cursor keys step through the storedrecords by day. The unit will beep when the start or end ofthe stored records is reached.
� Having identified the desired record the user may examinethe data by pressing R. This will display the result table asshown below.
The user can also step through the stored tests in thisdisplay by using the B ☼ cursor keys. After each key pushthe information on the screen will be seen to change. Seesection 4 for an explanation of these parameters.
� Pressing R will display, graphically and numerically the ‘polespread’ of the main contacts.
� Pressing R will display both the graphical and tabularresults in a split screen format. The user can skip througheach test stored by using the B ☼ keys showing both thesedisplays for each record. After each key push theinformation on the screen will be seen to change.
� Pressing R will display the graphical record in full screenformat. The time at the cursor position is given inmilliseconds at the top of the cursor. The B ☼
25
LTCH : 26.0 IPK1: 3.2
BFFR : 34.4 IPLT: 3.6
ACON : 119.8 VINI: 124.2
END : 140.6 VMIN: 115.6
MC_A : 90.8

cursor keys can be used to scroll the display in time. The S A cursor keys expand and compress the time scaleof the display around the cursor position. The INSERT keycan be used to toggle the display of the dc voltage trace onand off.
� Pressing R will return to the breaker ID display. In all casespressing U will return to the main menu.
26
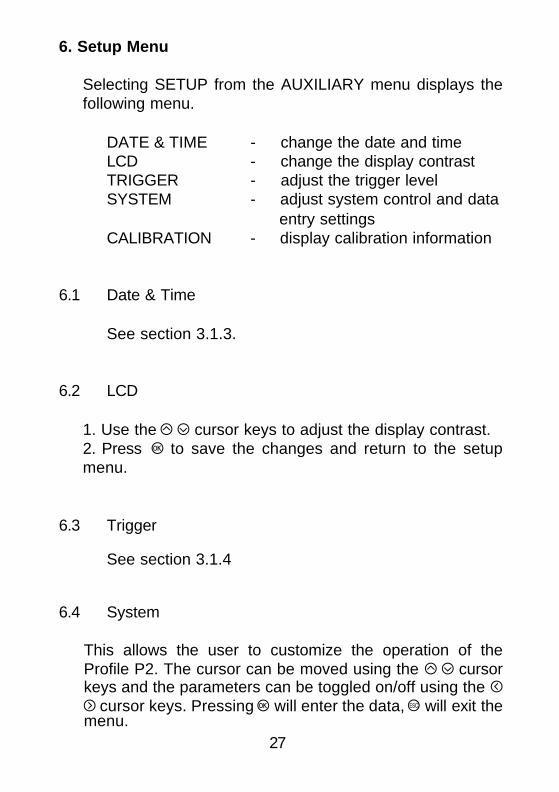
6. Setup Menu
Selecting SETUP from the AUXILIARY menu displays thefollowing menu.
DATE & TIME - change the date and timeLCD - change the display contrastTRIGGER - adjust the trigger levelSYSTEM - adjust system control and data
entry settingsCALIBRATION - display calibration information
6.1 Date & Time
See section 3.1.3.
6.2 LCD
1. Use the S A cursor keys to adjust the display contrast.2. Press R to save the changes and return to the setupmenu.
6.3 Trigger
See section 3.1.4
6.4 System
This allows the user to customize the operation of theProfile P2. The cursor can be moved using the S A cursorkeys and the parameters can be toggled on/off using the B☼ cursor keys. Pressing R will enter the data, U will exit themenu.
27

6.4.1 Text Settings
AUTOADVANCE - default ON
During text entry, when this is ON, pressing a new keycauses the cursor to automatically move one place to theright. When OFF, the user must press the ☼ key beforeentering the next letter.
NUMBERS FIRST - default OFF
During text entry, when this setting is ON, the key lettersequence is 1-A-B-C-1 ... etc.When OFF, the key letter sequence is A-B-C-1-A... etc.
6.4.2 Barcode Settings
These settings are used when the Profile P2 is equippedwith the barcode reader. They have no effect if this device isnot used.
Code 39 check - default OFF.
When ON, barcodes must contain a code 39 check digit forthe barcode to be recognizedWhen OFF, no check digit is required.
Barcode Identity - default OFF
The Profile P2 has the facility to automatically recognize abarcode prefixed by the letters below.
'S' prefix will tell the Profile P2 that this text barcode is theSubstation field.'T' prefix will tell the Profile P2 that this text is the BreakerType field.
28
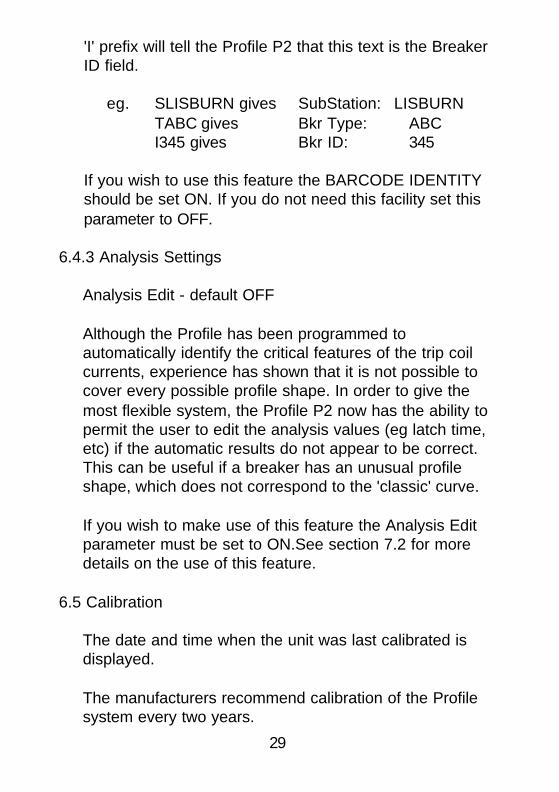
'I' prefix will tell the Profile P2 that this text is the BreakerID field.
eg. SLISBURN gives SubStation: LISBURNTABC gives Bkr Type: ABCI345 gives Bkr ID: 345
If you wish to use this feature the BARCODE IDENTITYshould be set ON. If you do not need this facility set thisparameter to OFF.
6.4.3 Analysis Settings
Analysis Edit - default OFF
Although the Profile has been programmed toautomatically identify the critical features of the trip coilcurrents, experience has shown that it is not possible tocover every possible profile shape. In order to give themost flexible system, the Profile P2 now has the ability topermit the user to edit the analysis values (eg latch time,etc) if the automatic results do not appear to be correct.This can be useful if a breaker has an unusual profileshape, which does not correspond to the 'classic' curve.
If you wish to make use of this feature the Analysis Editparameter must be set to ON.See section 7.2 for moredetails on the use of this feature.
6.5 Calibration
The date and time when the unit was last calibrated isdisplayed.
The manufacturers recommend calibration of the Profilesystem every two years.
29

7. Advanced Features
Version 4.1 onwards of the Profile P2 firmware has severaladditional features over the previous versions. Theseinclude the ability to read Substation, Breaker Type, and IDtext information using a barcode wand; the ability to edit therecord parameters such as latch time on the LCD display;and the capability of interfacing with the P1plus vibrationsensing unit. This section will explain these new advancedfeatures in detail.
7.1 Using the Barcode Reader.
The Profile P2 can be supplied with an optional barcodereader. This unit is connected to the serial port. The readeris of the pen type and is powered from the serial port. It willread a number of standard barcodes including 'Code 39'and gives an output in an ASCII format that will beunderstood by the Profile P2 handset. The barcodes can begenerated by several, commercially available, softwarepackages (see your dealer for details). The barcodereaders supplied are factory programmed to operate withthe Profile P2. Other models and types may not operatecorrectly, and may damage the P2 handset.
The breaker text information can be easily entered byfollowing the procedure below:
� First check that the Barcode Settings have been correctlyconfigured as described in section 6.4.2.
� Connect the barcode reader to the serial port of the P2.� Select the Test menu.� Position the flashing cursor on the desired line of text and
simply scan the appropriate barcode to enter theinformation.
30

� The reader usually works best with a simple smoothscanning motion across the entire code.
� Note: If you are using the 'Barcode Identity' facility (section6.4.2) it will not be necessary to position the cursormanually prior to scanning the barcodes since the P2 willautomatically enter each text string in the correct place.
� Proceed with the test as normal.
7.2 Using the Analysis Editing Features.
� Note: Before attempting to use this feature, ensure that theANAYLSIS EDIT setting is ON - see section 6.4.3.
This feature allows the user to selectively edit the timingparameters on recorded traces. It is especially useful if thetrip coil profile is of an unusual form, which does not lenditself to automatic interpretation.
The software in the P2 works by scanning through the entirerecord and identifying every discontinuity in the trip coilcurrent curve. It then uses its built-in algorithms to assign ameaning to the 4 discontinuities, which are most likely tocorrespond to the key parameters of the profile. In somecases these are not the same as a skilled operator mayhave selected and therefore they can now be changedunder operator control.
Only four of the parameters can be edited in this way. Theyare listed below.
� Ltch: Latch time (ms)� Bffr: Buffer time (ms)� Acon: Auxiliary contact time (ms)� End: Current end time (ms)
31

In order to edit these parameters you must first select thedesired record as described in section 5. This record shouldbe brought up on the LCD in the split screen format with thegraphic and tabular results displayed as below.
LTCH : 18.4 IPK1: 2.1
BFFR: 19.6 IPLT: 3.2
ACON: 42.2 VINI: 48.4
END : 56.6 VMIN: 43.5
MCON: 36.2
The dotted lines on the curve show the position of the keydiscontinuities in the profile. In order to edit these valuesyou can follow the procedure below.
�Press the A cursor key. The display will change as shownbelow.
LTCH > 18.4 IPK1: 2.1
BFFR: 19.6 IPLT: 3.2
ACON: 42.2 VINI: 48.4
END : 56.6 VMIN: 43.5MCON: 36.2
32
23.6 Time at cursor
204 Record Number

� The display changes with the Latch time displayed with a '>'rather than the standard ':' and the graph shows only thedotted line for the latch time.
� You can cycle through the 4 parameters by continuing topress the S A cursor keys until you have selected thedesired location.
� Press R to enter editing mode. The dotted cursor willchange to a solid line to indicate this mode.
There are now two ways to change the value of theparameter. The first way is to scroll through the'discontinuity' points that the P2 has already found. The SA cursor keys will expand and compress the time scale onthe display.
� Press the B ☼ cursor keys to move the cursor along thecurve to the desired position for the new value.
� Press R to enter the new value. Check that the solid linereturns to a dotted line. You may now scroll to anotherparameter to edit or press U to return to normal operation.
If the 'discontinuities' found by the P2 do not correspond tothe time you want you may select any time for theparameter by following the steps below.
� Enter edit mode as before, select the desired parameterand confirm that you have a solid line cursor.
� Pressing the INSERT key will change from 'DiscontinuityMode' to 'Continuous Mode'. Again you can expand thegraphical display to show any detail on the curve using theS A cursor keys.
� You may then scroll the cursor through the displaycontinuously by holding the B ☼ cursor keys until you arriveat the desire point.
33

� Pressing R enters the new value and returns to the dottedcursor.
Any stored record can be edited in this manner. It isimportant to remember that if you wish to change thesemeasurements that they should be edited beforedownloading the PC so that all copies of the record willremain consistent.
It is also possible to edit measured parameters immediatelyafter the test has been recorded if you wish.
34

Appendix A
Trip Coil Profile Tutorial
35

Increasing Trip Latch Friction
This example shows the effect of increasing friction the triplatch release mechanism of the breaker. Each millisecond ofdelay to the trip release point will cause the same delay in themain contact opening time. The breaker will therefore have aproportionally extended fault clearance time.
Notice that although the latch release time is delayed the actualmechanism velocity in not changed, i.e. once the trip latch isreleased the mechanism performs to spec. This is shown bythe fact that the time difference between the latch release pointand the time the 'a' contact drops out the trip coil remainsconstant at 52 ms.
This is typical of many problems in the field. It can be causedby a variety of problems, from mechanical wear to poor orincorrect lubrication. If left untreated the breaker will fail to tripin the near future. This type of problem is often first revealed bytemperature extremes.

Burned-out Trip Coil
This example shows the trip coil profile caused by a semi-burned-out coil. The general form of the profile is valid for bothtrip and close coils. Arcing within the coil as the insulation isbreaking down causes the noise superimposed on the normalprofile.
The coil remaining energised for much longer than specifiedusually causes coil burnout. Since trip coils generally onlyconduct for a few milliseconds, continuous current can easilydamage them. This type of fault is interesting for severalreasons.
� The breaker operation (trip times and velocity) remains
37

unchanged by this problem, until the breaker suddenly fails. Therefore a conventional timing test is unlikely to showthis problem.
� The problem can be fixed by simply replacing the coil,however this ignores the likely cause of the coil damage. Theroot cause of this is probably a problem with the auxiliarycontacts in the dc control circuitry. (Ref. Auxiliary contactproblems).
38

Poor Contact in Trip Circuit
This example shows the trip coil profile caused by a poorcontact, or loose wire in the trip circuit. The general form of theprofile is valid for both trip and close coils.
Loose fuses in the breaker cabinet can often cause this type offault, however if this is the case, the problem should also bevisible in the dc voltage trace.
This type of fault is interesting since the breaker operation (triptimes and velocity) remains unchanged by this problem, untilthe breaker suddenly fails. Therefore a conventional timing testis unlikely to show this problem.
39

Anti-pump Relay Scheme Failure
Many breakers incorporate an 'anti-pump' relay scheme in thedc control circuit. This is also known as an X-Y scheme. Itusually uses 52x and 52y relays in a self seal-in mode toprevent the breaker from cycling open-close-open etcindefinitely under some operating conditions. If this occurs themechanical forces can destroy a breaker in a matter ofseconds.
This example shows a 'trip-free' or close-open operation tosimulate the effect of a breaker closing into a faulted line. In the'good' trace the close coil can be seen to be interrupted atapprox. 50 ms, this is then followed by the trip coil from approx.170 ms to 240 ms to reopen the breaker immediately.
40

In the 'bad' example the close coil current should have beeninterrupted after approximately 50 ms by a self-sealing relaycontact. The faulty trace shows the relay contact attempt tointerrupt the current but failing to remain open, allowing thecurrent to continue to flow until interrupted by another seriesauxiliary contact after approximately 100ms. This is thenfollowed by the trip coil as before, but since the anti-pumpscheme is faulty, the close coil becomes energised again atapprox. 235 ms. The tripping and closing coil currents aresuperimposed on the profile. The breaker can then be seen tocontinue to cycle open-close indefinitely.
41

Reduced Mechanism Operating Speed
This example shows the effect of reduced mechanismoperating speed on 'a' contact operating times.
This will cause a delay in the main contact opening time, butmore importantly a reduction in the speed at which the contactsare moving as they part. The fault current interrupting capabilityof the breaker will be greatly reduced if the tripping velocity isout of spec. Increased contact erosion and insulatorcontamination will result from the longer arcing times, if thisproblem is not rectified.
The problem can be caused by, low operating air/oil pressure,insufficient spring tension, or friction in the mechanism,amongst others. It is often first revealed by temperatureextremes.
42

An increased 'a' contact time gives the best indication of slowoperating speeds when comparing sequential records from thesame breaker. Manufacturing tolerances between breakers ofthe same type can often mask speed problems whencomparing profiles from breakers of similar design.
43
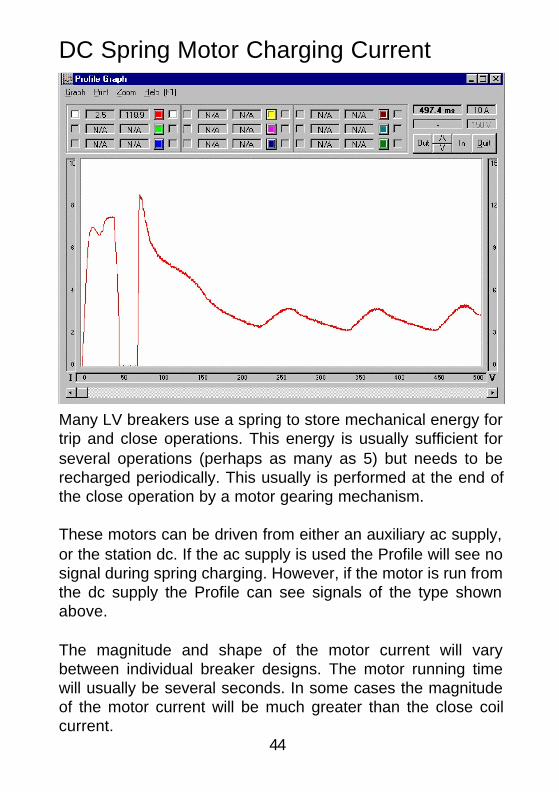
DC Spring Motor Charging Current
Many LV breakers use a spring to store mechanical energy fortrip and close operations. This energy is usually sufficient forseveral operations (perhaps as many as 5) but needs to berecharged periodically. This usually is performed at the end ofthe close operation by a motor gearing mechanism.
These motors can be driven from either an auxiliary ac supply,or the station dc. If the ac supply is used the Profile will see nosignal during spring charging. However, if the motor is run fromthe dc supply the Profile can see signals of the type shownabove.
The magnitude and shape of the motor current will varybetween individual breaker designs. The motor running timewill usually be several seconds. In some cases the magnitudeof the motor current will be much greater than the close coilcurrent.
44

Faulty Battery Charger
This example shows a 12 volt peak-peak ripple superimposedon the station battery voltage. The ripple frequency is 180 Hz (3times system frequency) indicating a problem with the 3 phasebattery charger in the station.
The ripple can also be seen reflected in the trip coil currentprofile.
While this is not a direct threat to the breaker under test, it doesrepresent a potentially serious problem for the entire substationif not repaired quickly.
45

High Impedance DC Supply
These records show the voltage drop during breaker operationcaused by increased resistance in the dc supply of the breaker.This can be caused by several problems ranging from a highimpedance cell, to poor wiring, to bad connections in the circuit.
It should be noted that the level of the dc current is alsoreduced. In this example the breaker operation time is sloweralthough this is not necessarily caused solely by the dc voltagedrop.
46

Faulty Auxiliary Contact Operation
This example shows the effect of a faulty auxiliary contact thatis failing to interrupt the coil current and the end of the breakerclose operation. Similar effects can be observed in the tripcircuit.
If this problem is not repaired it will lead to coil burnout andeventually failure of the breaker to operate on command. (Ref.Coil burnout traces).
Notice that in this close operation, the characteristic coil profileshape is preceded by a few milliseconds of very low current.This can often be observed in the close profiles as the actualclose coil is usually energised by an interposing auxiliary relay(X-relay).
47

Product Support
For Servicing and Repairs, please contact ourCutomer Services Department.
Tel: +44 (0)28 9262 2915Fax: +44 (0)28 9262 2202E-mail: [email protected]: www.kelman.co.uk