Embed Size (px)
Citation preview
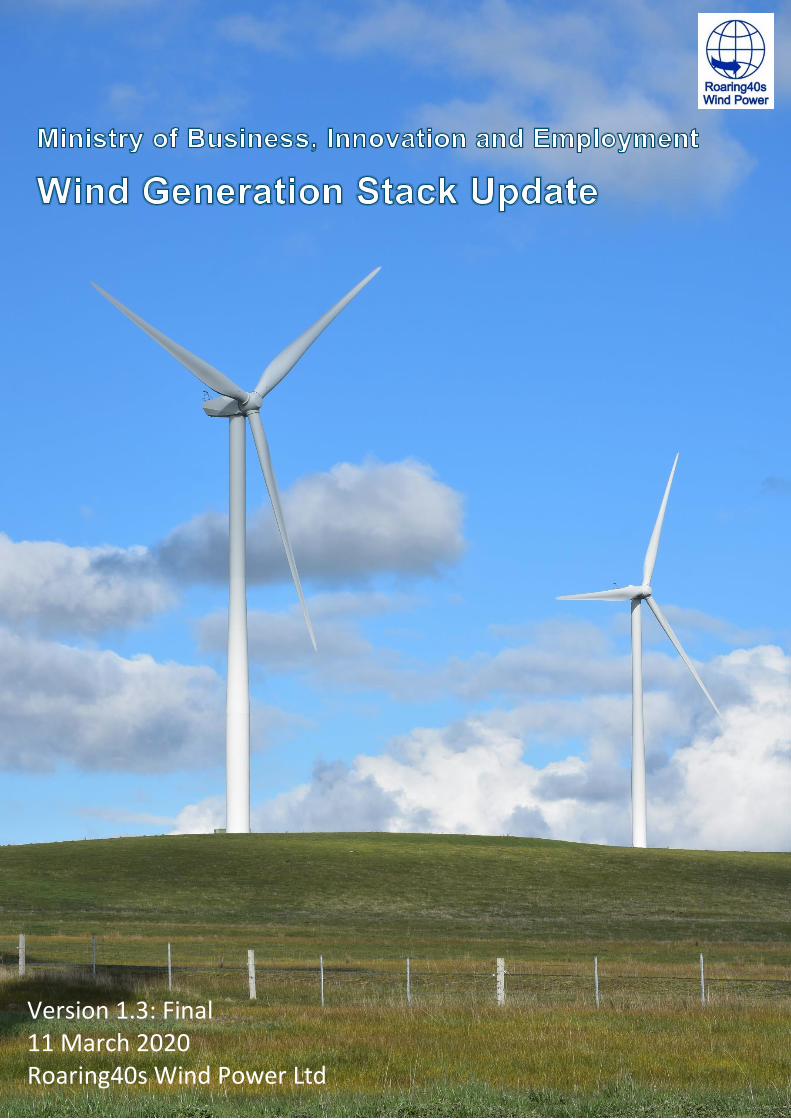
Version 1.3: Final 11 March 2020 Roaring40s Wind Power Ltd
Document Control
Revision No. Date Revision Details Author
1.0 12 December 2019 Draft for review SH/PB
1.1 14 January 2020 Second Draft for review SH/PB
1.2 12 February 2020 Final Draft SH/PB
1.3 11 March 2020 FINAL SH/PB
Wind Generation Stack Update
Page|3
Table of Contents 1. Introduction .............................................................................................................................................. 4
2. Objective ................................................................................................................................................... 5
3. Methodology – Wind Generation Stack update ....................................................................................... 5
3.1. Background ....................................................................................................................................... 5
3.2. Current and future wind technology trends ..................................................................................... 5
3.2.1. World-wide installation ............................................................................................................. 6
3.2.2. Current onshore wind farm cost trends .................................................................................... 6
3.2.3. Future onshore wind cost trends ............................................................................................ 10
3.2.4. Offshore wind farm cost trends .............................................................................................. 12
3.3. Mapping future wind farm sites ...................................................................................................... 15
3.4. Identification of wind farm sites for the Generation Stack ............................................................. 15
3.4.1. Phase 1 (years 2020 – 2030) ................................................................................................... 15
3.4.2. Phase 2 (years 2030 – 2060) ................................................................................................... 16
3.4.3. Site reduction factor................................................................................................................ 16
3.5. Likelihood (of being developed) ...................................................................................................... 17
3.6. Generation Stack Plant Information ............................................................................................... 18
3.6.1. Construction Cost Estimate ..................................................................................................... 18
3.6.2. Model Validation ..................................................................................................................... 20
3.7. Wind Generation Stack project order ............................................................................................. 21
3.7.1. Levelised Cost of Energy (LCOE) .............................................................................................. 21
3.7.2. LCOE Sensitivity ....................................................................................................................... 22
3.7.3. Wind Generation Stack project parameters ........................................................................... 24
4. Results ..................................................................................................................................................... 24
4.1. Introduction .................................................................................................................................... 24
4.2. Site summary ................................................................................................................................... 24
4.3. WGS – offshore wind farms ............................................................................................................ 28
4.4. WGS project order and key parameters ......................................................................................... 28
4.5. Turbine Trends – in the NZ context ................................................................................................. 29
4.6. Feasibility of joint wind/solar in NZ ................................................................................................ 30
5. Summary ................................................................................................................................................. 31
6. About the authors ................................................................................................................................... 32
7. References ............................................................................................................................................... 33
Appendix A Relevant Maps
Appendix B Regional Wind Profiles
Wind Generation Stack Update
Page|4
1. Introduction The Ministry of Business, Innovation and Employment (MBIE), with support from Transpower, has engaged Roaring40s Wind Power Ltd (R40s) to review and update the wind generation component of the “Generation Stack”. The Generation Stack is a detailed list of potential future electricity generation projects in New Zealand covering information such as the size, location and anticipated commissioning of each project. There is a need to update the Generation Stack database to ensure that the information is current and accurate so that any modelling based upon it is robust and delivers reliable results.
The Generation Stack is used by MBIE in the development of Energy Sector and Climate Change policies – and also by Transpower to help identify potential future transmission grid constraints and/or to identify where the grid may need to be strengthened to accommodate new generation growth. The future of the New Zealand (NZ) electricity system has been the focus of a number of studies in recent years with reports undertaken by Transpower1, the Interim Climate Change Committee2, MBIE (Ministry of Business, Innovation and Employment)3 and the Productivity Commission4 being the most noteworthy. These reports address the growth of NZ’s electricity market (out to 2035 in the ICCC report and to 2050 in the other reports) and what this means in regards to NZ’s electricity demand - and mix of technologies - as it moves towards a 100% renewable generation goal and a low carbon economy.
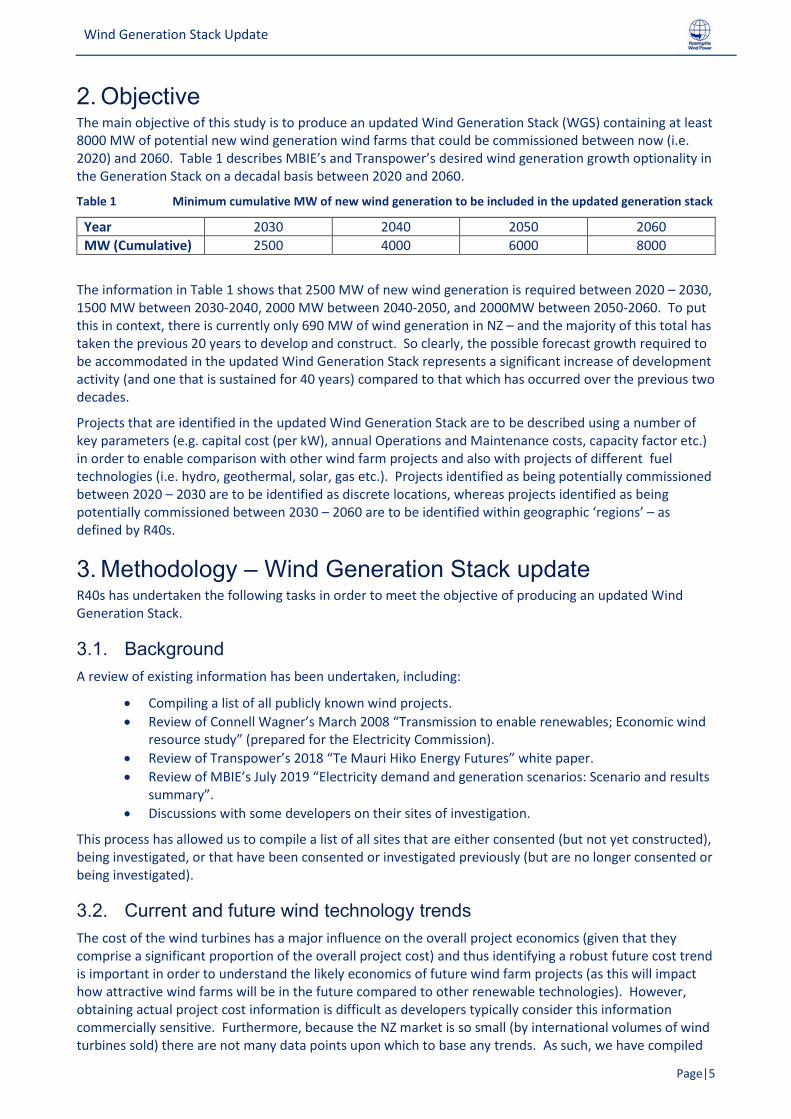
All reports suggest the potential for a significant increase in electricity demand over the next few decades with the ICCC report suggesting a total annual demand of between 49-57 TWh by 2035 and the others estimating total demand of up to approximately 70 TWh by 20505. NZ’s current demand is ~40 TWh/annum. Figure 1 shows NZ’s actual electricity demand for the previous between 1998 to 2018 and the future demand growth forecasts as modelled by ICCC, MBIE and Transpower.
Figure 1. NZ Electricity Demand Forecasts
1 Transpower (2018). Te Mauri Hiko – Energy Futures (White Paper)
2 ICCC (2019). Accelerated electrification: Evidence, analysis and recommendations, Interim Climate Change Committee.
3 New Zealand Government [MBIE] (2018). Electricity Price Review Hikohiko Te Uira. First Report for Discussion.
4 New Zealand Productivity Commission (2018). Low-emissions economy – Final Report.
5 Transpower’s Te Mauri Hiko (2018) report suggests that the demand by 2050 could be as high as 90 TWh/annum by 2050; however, a recent remodeling exercise undertaken by Transpower has revised this total down to approximately 70 TWh/annum.
30
35
40
45
50
55
60
65
70
75
1998
2000
2002
2004
2006
2008
2010
2012
2014
2016
2018
2020
2022
2024
2026
2028
2030
2032
2034
2036
2038
2040
2042
2044
2046
2048
2050
TWh
Year
NZ Electricity Demand Forecasts
MBIE Global
MBIE Disruptive
ICCC Accelerated Electrification
Transpower Business as Usual
Transpower Accelerated Electricfication
Actual
Source: Transpower (by email, 2020)
Wind Generation Stack Update
Page|5
2. Objective The main objective of this study is to produce an updated Wind Generation Stack (WGS) containing at least 8000 MW of potential new wind generation wind farms that could be commissioned between now (i.e. 2020) and 2060. Table 1 describes MBIE’s and Transpower’s desired wind generation growth optionality in the Generation Stack on a decadal basis between 2020 and 2060.
Table 1 Minimum cumulative MW of new wind generation to be included in the updated generation stack
Year 2030 2040 2050 2060
MW (Cumulative) 2500 4000 6000 8000
The information in Table 1 shows that 2500 MW of new wind generation is required between 2020 – 2030, 1500 MW between 2030-2040, 2000 MW between 2040-2050, and 2000MW between 2050-2060. To put this in context, there is currently only 690 MW of wind generation in NZ – and the majority of this total has taken the previous 20 years to develop and construct. So clearly, the possible forecast growth required to be accommodated in the updated Wind Generation Stack represents a significant increase of development activity (and one that is sustained for 40 years) compared to that which has occurred over the previous two decades.
Projects that are identified in the updated Wind Generation Stack are to be described using a number of key parameters (e.g. capital cost (per kW), annual Operations and Maintenance costs, capacity factor etc.) in order to enable comparison with other wind farm projects and also with projects of different fuel technologies (i.e. hydro, geothermal, solar, gas etc.). Projects identified as being potentially commissioned between 2020 – 2030 are to be identified as discrete locations, whereas projects identified as being potentially commissioned between 2030 – 2060 are to be identified within geographic ‘regions’ – as defined by R40s.
3. Methodology – Wind Generation Stack update R40s has undertaken the following tasks in order to meet the objective of producing an updated Wind Generation Stack.
3.1. Background A review of existing information has been undertaken, including:
• Compiling a list of all publicly known wind projects.
• Review of Connell Wagner’s March 2008 “Transmission to enable renewables; Economic wind resource study” (prepared for the Electricity Commission).
• Review of Transpower’s 2018 “Te Mauri Hiko Energy Futures” white paper.
• Review of MBIE’s July 2019 “Electricity demand and generation scenarios: Scenario and results summary”.
• Discussions with some developers on their sites of investigation.
This process has allowed us to compile a list of all sites that are either consented (but not yet constructed), being investigated, or that have been consented or investigated previously (but are no longer consented or being investigated).
3.2. Current and future wind technology trends
The cost of the wind turbines has a major influence on the overall project economics (given that they comprise a significant proportion of the overall project cost) and thus identifying a robust future cost trend is important in order to understand the likely economics of future wind farm projects (as this will impact how attractive wind farms will be in the future compared to other renewable technologies). However, obtaining actual project cost information is difficult as developers typically consider this information commercially sensitive. Furthermore, because the NZ market is so small (by international volumes of wind turbines sold) there are not many data points upon which to base any trends. As such, we have compiled
Wind Generation Stack Update
Page|6
our view on the future trends of wind turbine cost by researching publicly available international information and applying these trends to the NZ context.
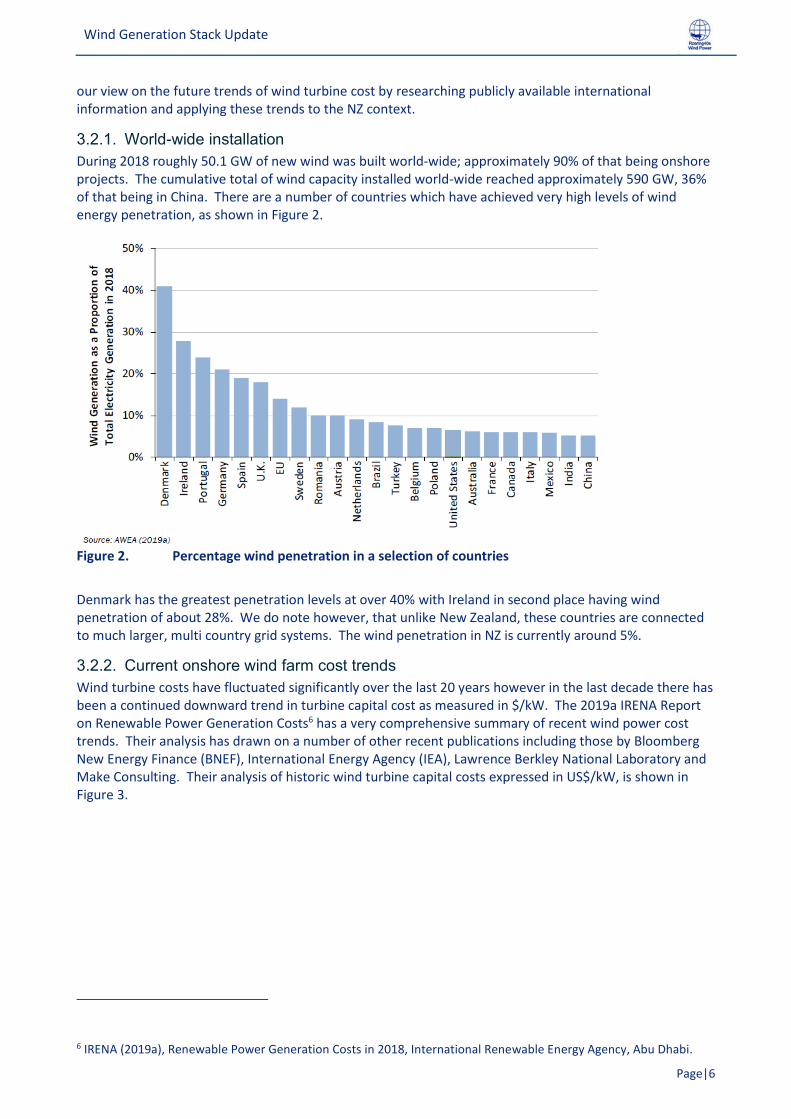
3.2.1. World-wide installation During 2018 roughly 50.1 GW of new wind was built world-wide; approximately 90% of that being onshore projects. The cumulative total of wind capacity installed world-wide reached approximately 590 GW, 36% of that being in China. There are a number of countries which have achieved very high levels of wind energy penetration, as shown in Figure 2.
Figure 2. Percentage wind penetration in a selection of countries
Denmark has the greatest penetration levels at over 40% with Ireland in second place having wind penetration of about 28%. We do note however, that unlike New Zealand, these countries are connected to much larger, multi country grid systems. The wind penetration in NZ is currently around 5%.
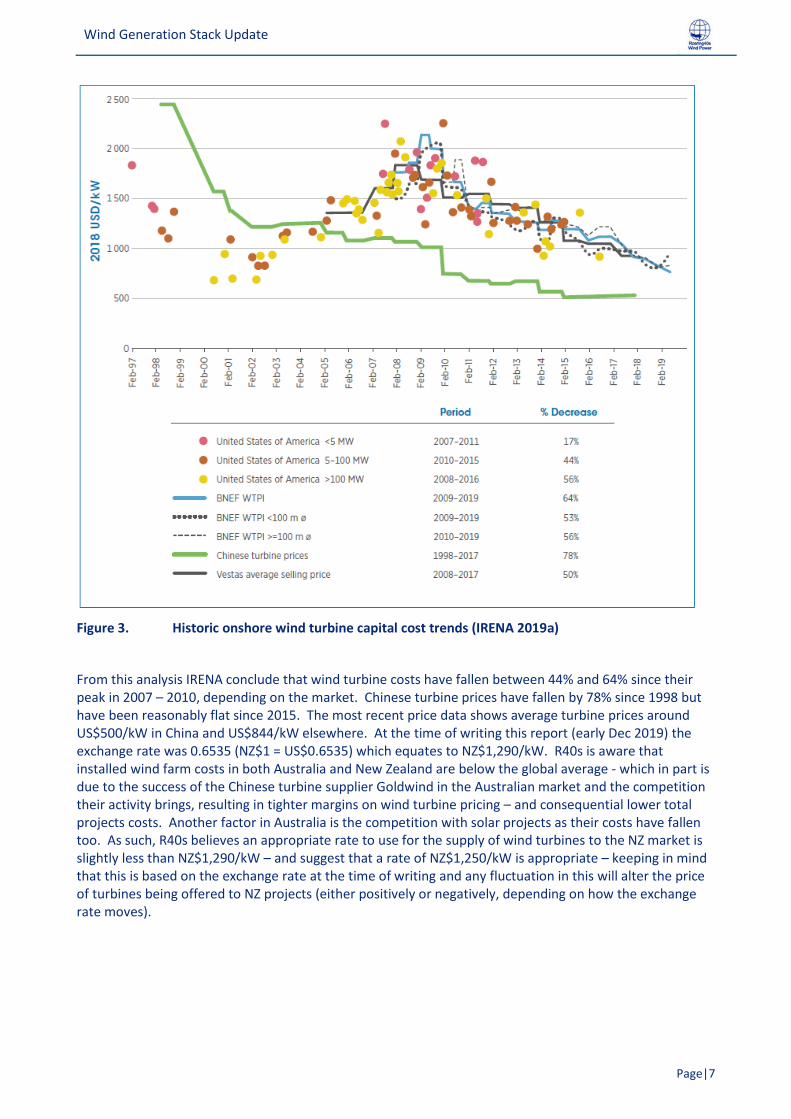
3.2.2. Current onshore wind farm cost trends Wind turbine costs have fluctuated significantly over the last 20 years however in the last decade there has been a continued downward trend in turbine capital cost as measured in $/kW. The 2019a IRENA Report on Renewable Power Generation Costs6 has a very comprehensive summary of recent wind power cost trends. Their analysis has drawn on a number of other recent publications including those by Bloomberg New Energy Finance (BNEF), International Energy Agency (IEA), Lawrence Berkley National Laboratory and Make Consulting. Their analysis of historic wind turbine capital costs expressed in US$/kW, is shown in Figure 3.
6 IRENA (2019a), Renewable Power Generation Costs in 2018, International Renewable Energy Agency, Abu Dhabi.
Wind Generation Stack Update
Page|7
Figure 3. Historic onshore wind turbine capital cost trends (IRENA 2019a)
From this analysis IRENA conclude that wind turbine costs have fallen between 44% and 64% since their peak in 2007 – 2010, depending on the market. Chinese turbine prices have fallen by 78% since 1998 but have been reasonably flat since 2015. The most recent price data shows average turbine prices around US$500/kW in China and US$844/kW elsewhere. At the time of writing this report (early Dec 2019) the exchange rate was 0.6535 (NZ$1 = US$0.6535) which equates to NZ$1,290/kW. R40s is aware that installed wind farm costs in both Australia and New Zealand are below the global average - which in part is due to the success of the Chinese turbine supplier Goldwind in the Australian market and the competition their activity brings, resulting in tighter margins on wind turbine pricing – and consequential lower total projects costs. Another factor in Australia is the competition with solar projects as their costs have fallen too. As such, R40s believes an appropriate rate to use for the supply of wind turbines to the NZ market is slightly less than NZ$1,290/kW – and suggest that a rate of NZ$1,250/kW is appropriate – keeping in mind that this is based on the exchange rate at the time of writing and any fluctuation in this will alter the price of turbines being offered to NZ projects (either positively or negatively, depending on how the exchange rate moves).
Wind Generation Stack Update
Page|8
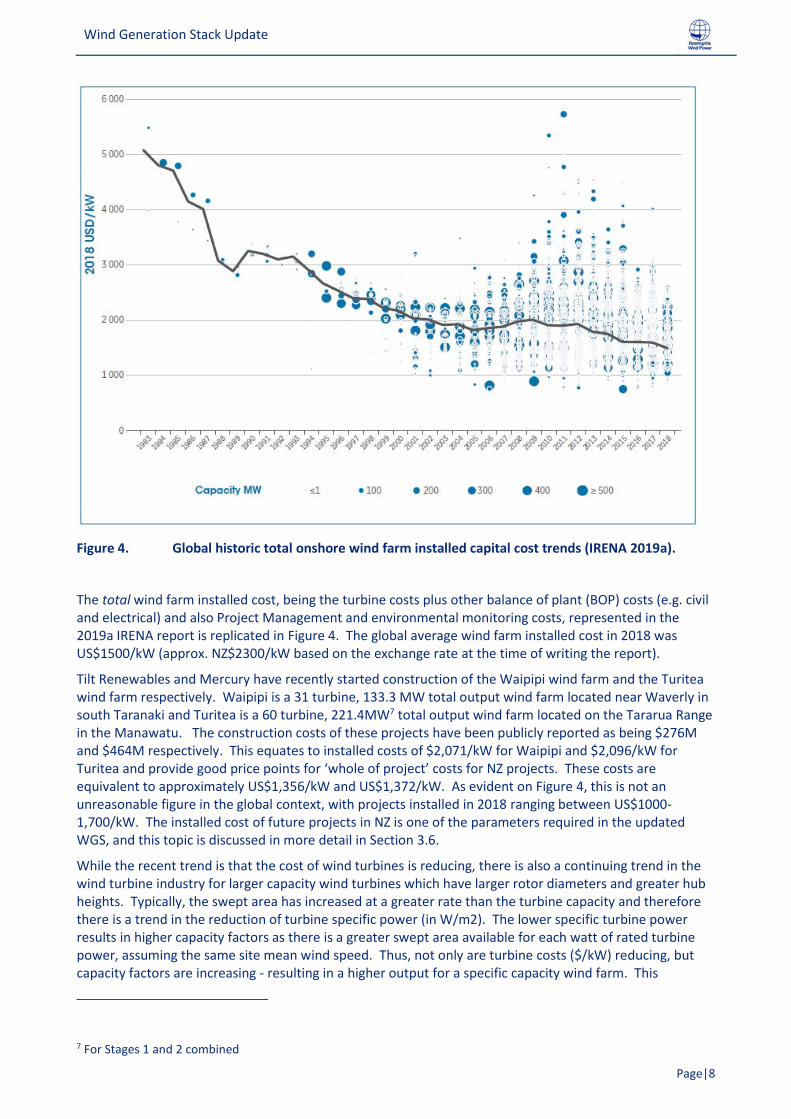
Figure 4. Global historic total onshore wind farm installed capital cost trends (IRENA 2019a).
The total wind farm installed cost, being the turbine costs plus other balance of plant (BOP) costs (e.g. civil and electrical) and also Project Management and environmental monitoring costs, represented in the 2019a IRENA report is replicated in Figure 4. The global average wind farm installed cost in 2018 was US$1500/kW (approx. NZ$2300/kW based on the exchange rate at the time of writing the report).
Tilt Renewables and Mercury have recently started construction of the Waipipi wind farm and the Turitea wind farm respectively. Waipipi is a 31 turbine, 133.3 MW total output wind farm located near Waverly in south Taranaki and Turitea is a 60 turbine, 221.4MW7 total output wind farm located on the Tararua Range in the Manawatu. The construction costs of these projects have been publicly reported as being $276M and $464M respectively. This equates to installed costs of $2,071/kW for Waipipi and $2,096/kW for Turitea and provide good price points for ‘whole of project’ costs for NZ projects. These costs are equivalent to approximately US$1,356/kW and US$1,372/kW. As evident on Figure 4, this is not an unreasonable figure in the global context, with projects installed in 2018 ranging between US$1000-1,700/kW. The installed cost of future projects in NZ is one of the parameters required in the updated WGS, and this topic is discussed in more detail in Section 3.6.
While the recent trend is that the cost of wind turbines is reducing, there is also a continuing trend in the wind turbine industry for larger capacity wind turbines which have larger rotor diameters and greater hub heights. Typically, the swept area has increased at a greater rate than the turbine capacity and therefore there is a trend in the reduction of turbine specific power (in W/m2). The lower specific turbine power results in higher capacity factors as there is a greater swept area available for each watt of rated turbine power, assuming the same site mean wind speed. Thus, not only are turbine costs ($/kW) reducing, but capacity factors are increasing - resulting in a higher output for a specific capacity wind farm. This
7 For Stages 1 and 2 combined
Wind Generation Stack Update
Page|9
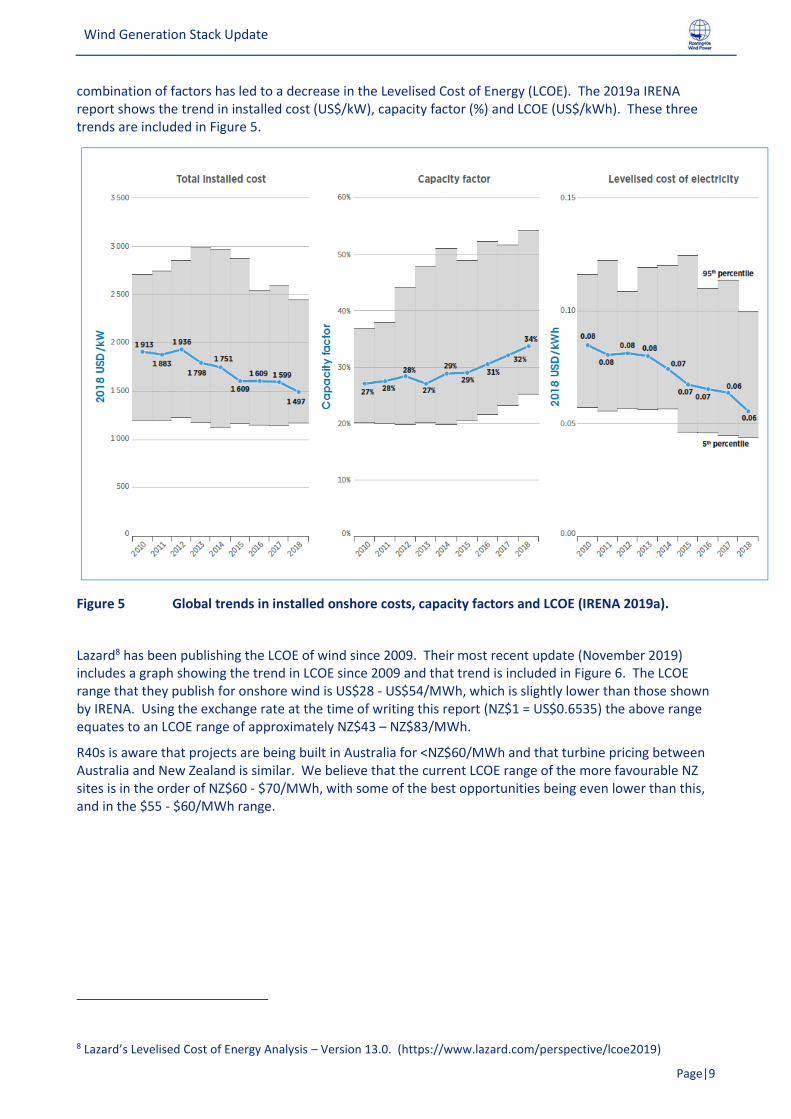
combination of factors has led to a decrease in the Levelised Cost of Energy (LCOE). The 2019a IRENA report shows the trend in installed cost (US$/kW), capacity factor (%) and LCOE (US$/kWh). These three trends are included in Figure 5.
Figure 5 Global trends in installed onshore costs, capacity factors and LCOE (IRENA 2019a).
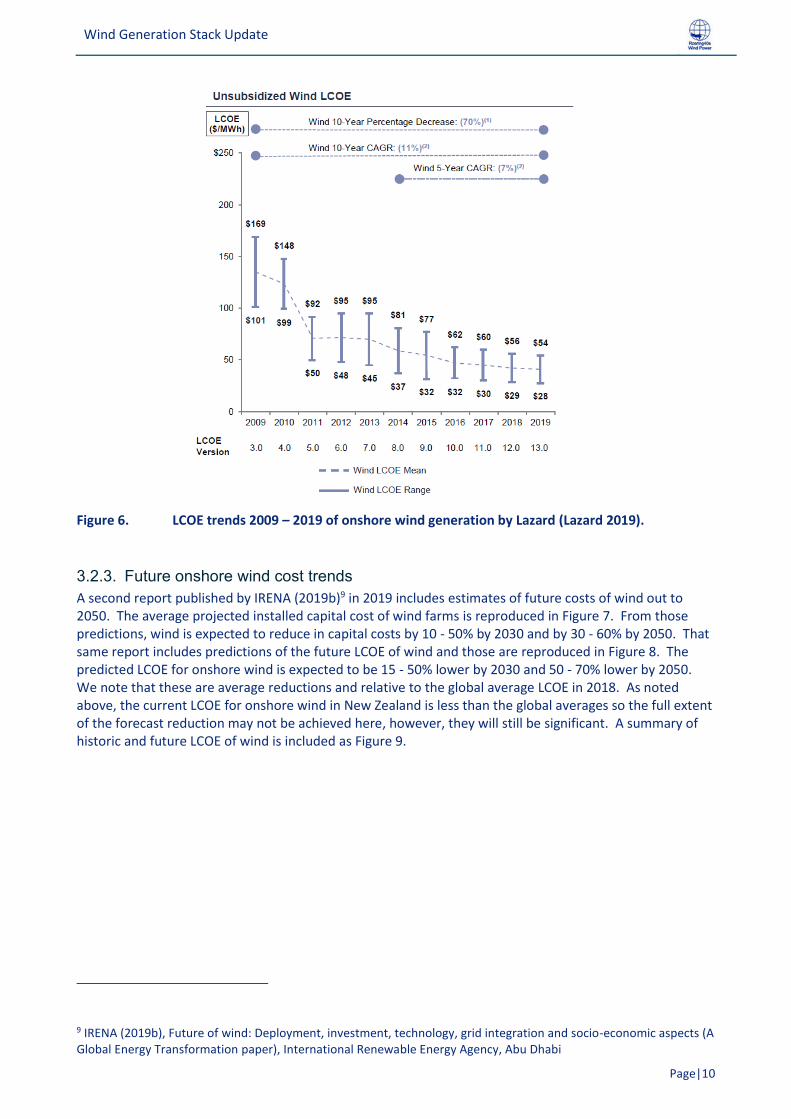
Lazard8 has been publishing the LCOE of wind since 2009. Their most recent update (November 2019) includes a graph showing the trend in LCOE since 2009 and that trend is included in Figure 6. The LCOE range that they publish for onshore wind is US$28 - US$54/MWh, which is slightly lower than those shown by IRENA. Using the exchange rate at the time of writing this report (NZ$1 = US$0.6535) the above range equates to an LCOE range of approximately NZ$43 – NZ$83/MWh.
R40s is aware that projects are being built in Australia for <NZ$60/MWh and that turbine pricing between Australia and New Zealand is similar. We believe that the current LCOE range of the more favourable NZ sites is in the order of NZ$60 - $70/MWh, with some of the best opportunities being even lower than this, and in the $55 - $60/MWh range.
8 Lazard’s Levelised Cost of Energy Analysis – Version 13.0. (https://www.lazard.com/perspective/lcoe2019)
Wind Generation Stack Update
Page|10
Figure 6. LCOE trends 2009 – 2019 of onshore wind generation by Lazard (Lazard 2019).
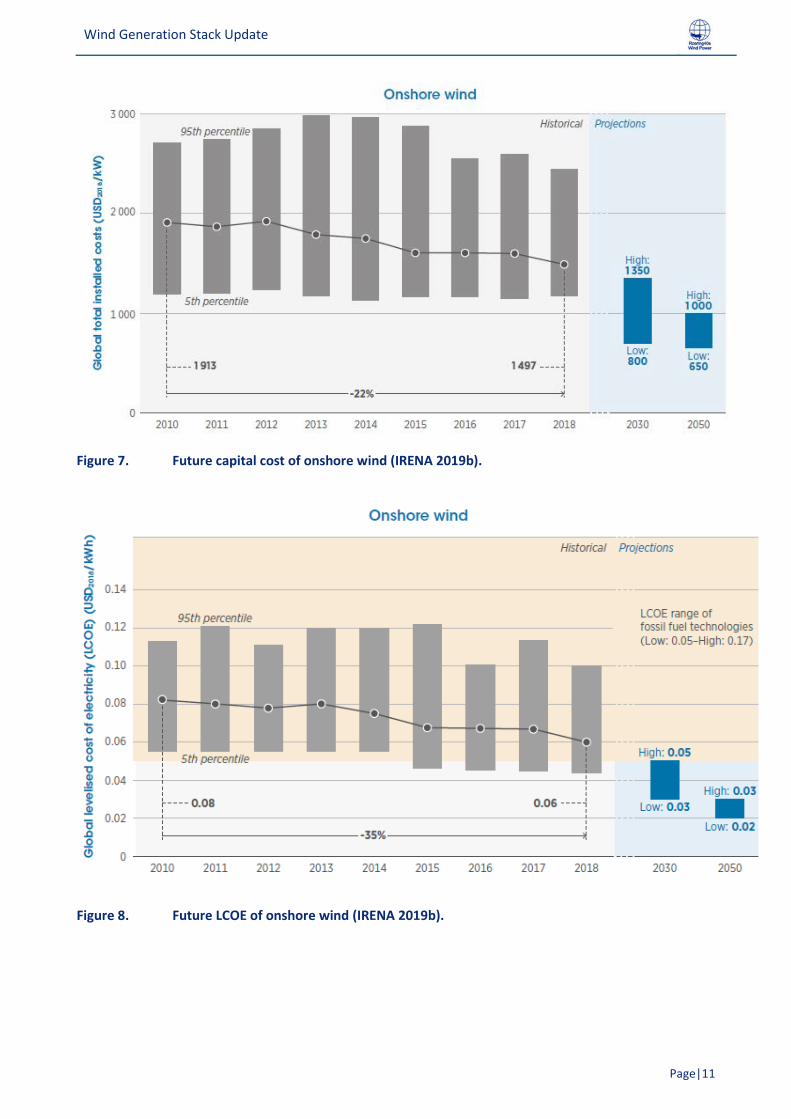
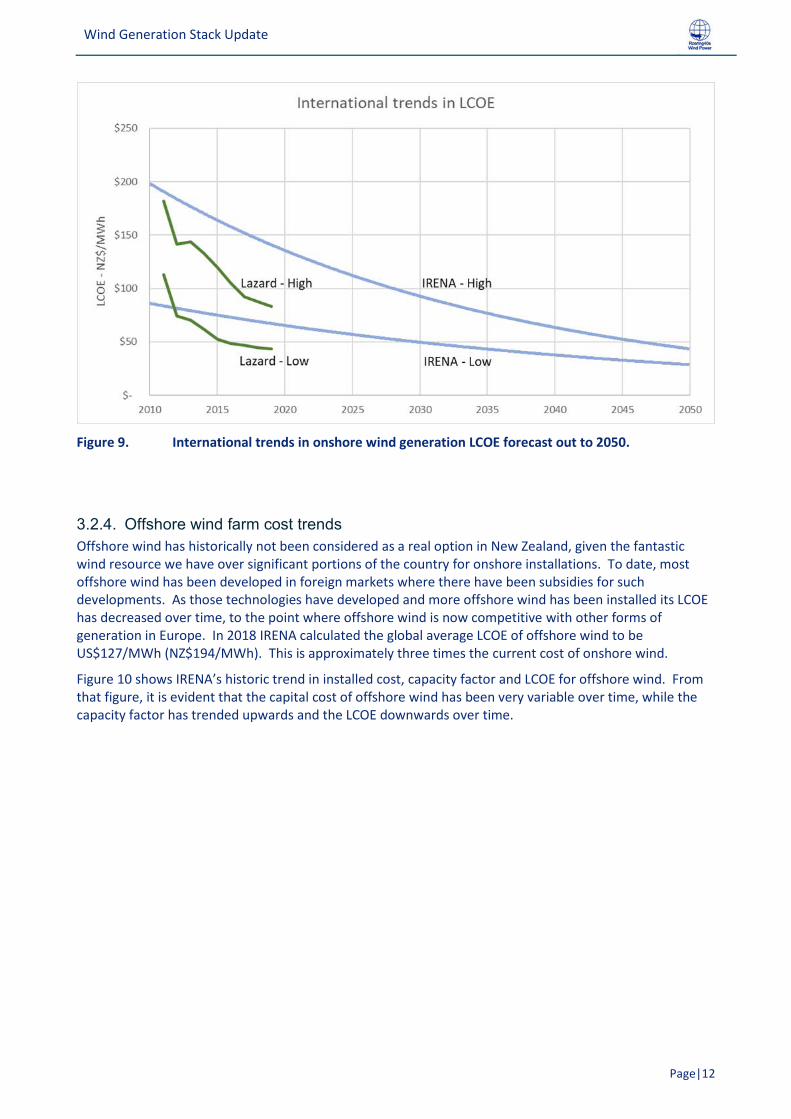
3.2.3. Future onshore wind cost trends A second report published by IRENA (2019b)9 in 2019 includes estimates of future costs of wind out to 2050. The average projected installed capital cost of wind farms is reproduced in Figure 7. From those predictions, wind is expected to reduce in capital costs by 10 - 50% by 2030 and by 30 - 60% by 2050. That same report includes predictions of the future LCOE of wind and those are reproduced in Figure 8. The predicted LCOE for onshore wind is expected to be 15 - 50% lower by 2030 and 50 - 70% lower by 2050. We note that these are average reductions and relative to the global average LCOE in 2018. As noted above, the current LCOE for onshore wind in New Zealand is less than the global averages so the full extent of the forecast reduction may not be achieved here, however, they will still be significant. A summary of historic and future LCOE of wind is included as Figure 9.
9 IRENA (2019b), Future of wind: Deployment, investment, technology, grid integration and socio-economic aspects (A Global Energy Transformation paper), International Renewable Energy Agency, Abu Dhabi
Wind Generation Stack Update
Page|11
Figure 7. Future capital cost of onshore wind (IRENA 2019b).
Figure 8. Future LCOE of onshore wind (IRENA 2019b).
Wind Generation Stack Update
Page|12
Figure 9. International trends in onshore wind generation LCOE forecast out to 2050.
3.2.4. Offshore wind farm cost trends Offshore wind has historically not been considered as a real option in New Zealand, given the fantastic wind resource we have over significant portions of the country for onshore installations. To date, most offshore wind has been developed in foreign markets where there have been subsidies for such developments. As those technologies have developed and more offshore wind has been installed its LCOE has decreased over time, to the point where offshore wind is now competitive with other forms of generation in Europe. In 2018 IRENA calculated the global average LCOE of offshore wind to be US$127/MWh (NZ$194/MWh). This is approximately three times the current cost of onshore wind.
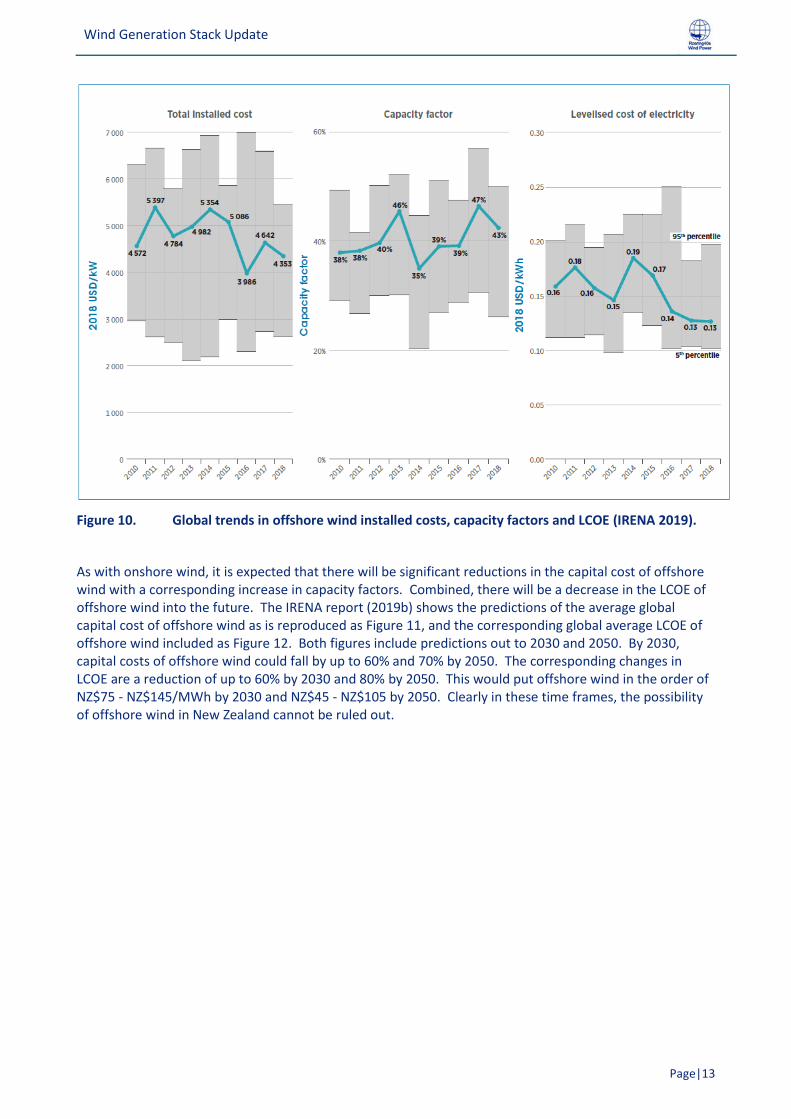
Figure 10 shows IRENA’s historic trend in installed cost, capacity factor and LCOE for offshore wind. From that figure, it is evident that the capital cost of offshore wind has been very variable over time, while the capacity factor has trended upwards and the LCOE downwards over time.
Wind Generation Stack Update
Page|13
Figure 10. Global trends in offshore wind installed costs, capacity factors and LCOE (IRENA 2019).
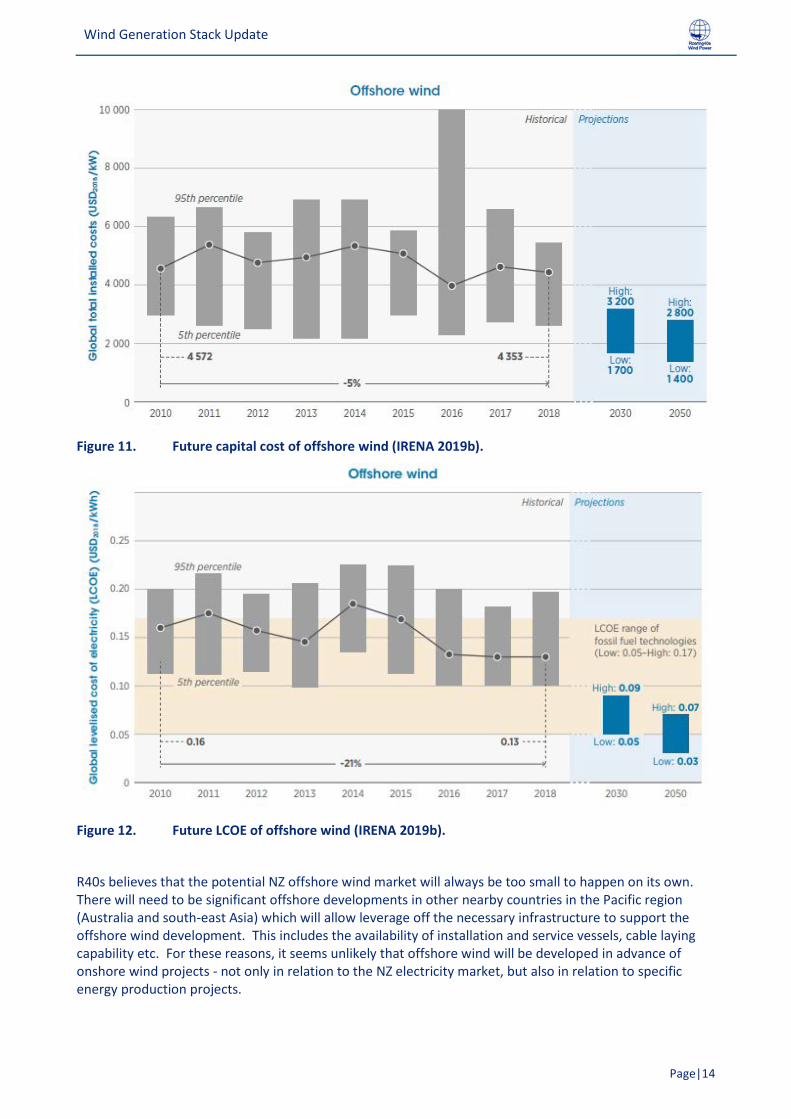
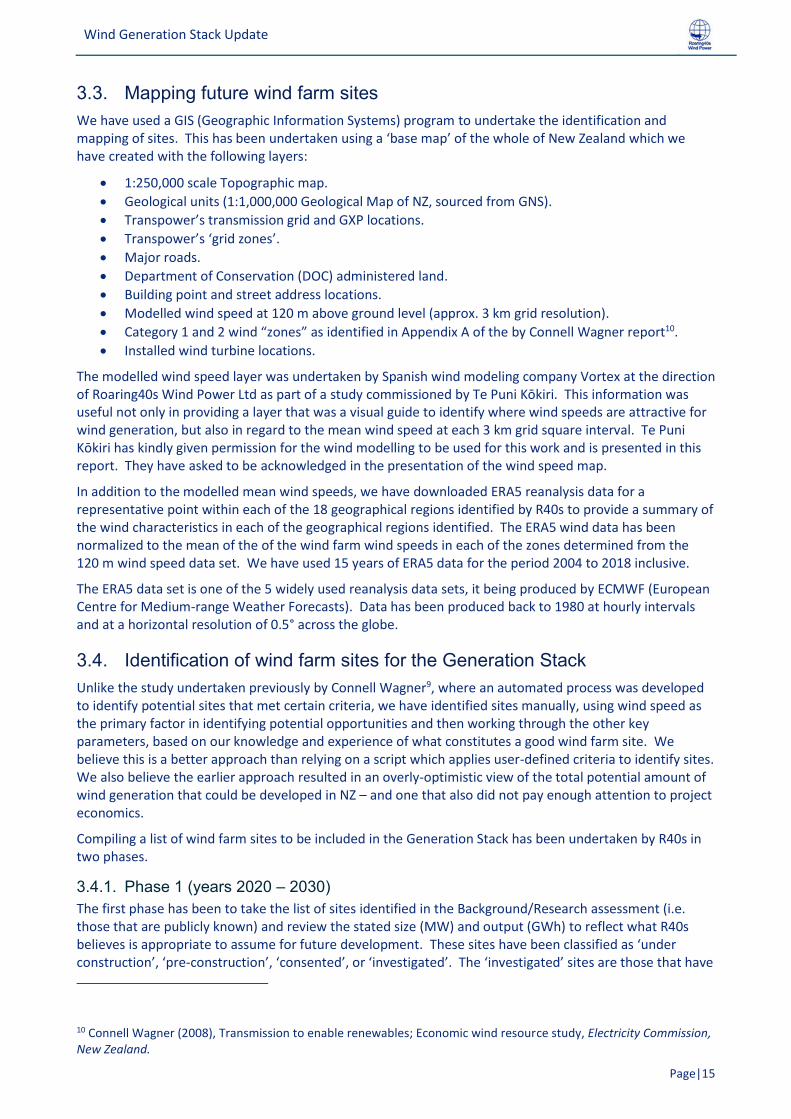
As with onshore wind, it is expected that there will be significant reductions in the capital cost of offshore wind with a corresponding increase in capacity factors. Combined, there will be a decrease in the LCOE of offshore wind into the future. The IRENA report (2019b) shows the predictions of the average global capital cost of offshore wind as is reproduced as Figure 11, and the corresponding global average LCOE of offshore wind included as Figure 12. Both figures include predictions out to 2030 and 2050. By 2030, capital costs of offshore wind could fall by up to 60% and 70% by 2050. The corresponding changes in LCOE are a reduction of up to 60% by 2030 and 80% by 2050. This would put offshore wind in the order of NZ$75 - NZ$145/MWh by 2030 and NZ$45 - NZ$105 by 2050. Clearly in these time frames, the possibility of offshore wind in New Zealand cannot be ruled out.
Wind Generation Stack Update
Page|14
Figure 11. Future capital cost of offshore wind (IRENA 2019b).
Figure 12. Future LCOE of offshore wind (IRENA 2019b).
R40s believes that the potential NZ offshore wind market will always be too small to happen on its own. There will need to be significant offshore developments in other nearby countries in the Pacific region (Australia and south-east Asia) which will allow leverage off the necessary infrastructure to support the offshore wind development. This includes the availability of installation and service vessels, cable laying capability etc. For these reasons, it seems unlikely that offshore wind will be developed in advance of onshore wind projects - not only in relation to the NZ electricity market, but also in relation to specific energy production projects.
Wind Generation Stack Update
Page|15
3.3. Mapping future wind farm sites
We have used a GIS (Geographic Information Systems) program to undertake the identification and mapping of sites. This has been undertaken using a ‘base map’ of the whole of New Zealand which we have created with the following layers:
• 1:250,000 scale Topographic map.
• Geological units (1:1,000,000 Geological Map of NZ, sourced from GNS).
• Transpower’s transmission grid and GXP locations.
• Transpower’s ‘grid zones’.
• Major roads.
• Department of Conservation (DOC) administered land.
• Building point and street address locations.
• Modelled wind speed at 120 m above ground level (approx. 3 km grid resolution).
• Category 1 and 2 wind “zones” as identified in Appendix A of the by Connell Wagner report10.
• Installed wind turbine locations.
The modelled wind speed layer was undertaken by Spanish wind modeling company Vortex at the direction of Roaring40s Wind Power Ltd as part of a study commissioned by Te Puni Kōkiri. This information was useful not only in providing a layer that was a visual guide to identify where wind speeds are attractive for wind generation, but also in regard to the mean wind speed at each 3 km grid square interval. Te Puni Kōkiri has kindly given permission for the wind modelling to be used for this work and is presented in this report. They have asked to be acknowledged in the presentation of the wind speed map.
In addition to the modelled mean wind speeds, we have downloaded ERA5 reanalysis data for a representative point within each of the 18 geographical regions identified by R40s to provide a summary of the wind characteristics in each of the geographical regions identified. The ERA5 wind data has been normalized to the mean of the of the wind farm wind speeds in each of the zones determined from the 120 m wind speed data set. We have used 15 years of ERA5 data for the period 2004 to 2018 inclusive.
The ERA5 data set is one of the 5 widely used reanalysis data sets, it being produced by ECMWF (European Centre for Medium-range Weather Forecasts). Data has been produced back to 1980 at hourly intervals and at a horizontal resolution of 0.5° across the globe.
3.4. Identification of wind farm sites for the Generation Stack Unlike the study undertaken previously by Connell Wagner9, where an automated process was developed to identify potential sites that met certain criteria, we have identified sites manually, using wind speed as the primary factor in identifying potential opportunities and then working through the other key parameters, based on our knowledge and experience of what constitutes a good wind farm site. We believe this is a better approach than relying on a script which applies user-defined criteria to identify sites. We also believe the earlier approach resulted in an overly-optimistic view of the total potential amount of wind generation that could be developed in NZ – and one that also did not pay enough attention to project economics.
Compiling a list of wind farm sites to be included in the Generation Stack has been undertaken by R40s in two phases.
3.4.1. Phase 1 (years 2020 – 2030) The first phase has been to take the list of sites identified in the Background/Research assessment (i.e. those that are publicly known) and review the stated size (MW) and output (GWh) to reflect what R40s believes is appropriate to assume for future development. These sites have been classified as ‘under construction’, ‘pre-construction’, ‘consented’, or ‘investigated’. The ‘investigated’ sites are those that have
10 Connell Wagner (2008), Transmission to enable renewables; Economic wind resource study, Electricity Commission, New Zealand.
Wind Generation Stack Update
Page|16
had wind monitoring and/or other investigations undertaken and also includes sites that have been consented previously, but which have since lapsed or have been surrendered – and thus, would require a new consent before construction can be contemplated.
3.4.2. Phase 2 (years 2030 – 2060) The second part is to identify the ‘potential’ sites – being those sites which are new – and as far as R40s is aware, have either not been investigated previously, or have been investigated, but not to any significant level and unlikely to have hub height wind data. We have undertaken this exercise by interpreting the features of the GIS base map (described in Section 3.3) and using our knowledge of wind investigations in NZ. As noted previously, the main factor in site identification is wind speed – but the analysis goes much deeper than that and identifies potential wind farm sites that are expected to provide attractive project economics and for which there are no obvious ‘fatal flaws’ from a construction or consent perspective. Such sites have been filtered on the following basis:
• Have attractive wind speeds (using those modelled at 120 m elevation above ground level presented in the wind speed map).
• Are not within DoC administered land.
• Are within a reasonable proximity to major roads, i.e. have reasonable access.
• Are within a reasonable proximity to the Transpower transmission grid.
• Are not of extreme elevation.
• Are not on steep or extremely complex terrain.
• Are of appropriate size.
• Are not in, or too close to, densely populated areas.
Although reasonably labour intensive, this exercise has provided a lot of data about each potential site that was used in subsequent analysis described later in this report. The process of potential site identification has been aided by R40s prior experience and knowledge of wind farm investigations in NZ. Each of these potential wind farm sites have been digitized as discrete areas and subsequently analysed and assessed as such, but ultimately the results have been summarised into 18 different geographic ‘regions’, as defined by R40s.
3.4.3. Site reduction factor For all sites that have been identified in Phase 2 (i.e. the ‘potential’ sites) we have then applied a reduction factor to the area of land within each wind farm site to determine what we believe is an appropriate wind farm size within each identified site. We have used our previous wind farm investigation experience to assist in determining the appropriate reduction factor to apply. Analysis of existing operational and consented wind farms allowed us to determine the wind farm capacity density (MW/ha) of those wind farms. Typically for the older wind farms in New Zealand, when a boundary is drawn around the extent of the wind turbines, the wind farms have a density of 0.1 MW/ha. We note that Connell Wagner came to the same conclusion in their 2008 study11 and used this figure in their site assessment work.
We note that for the two wind farms that have recently commenced construction (Waipipi and Turitea) and two other wind farms that are in the pre-construction planning and tendering phase (Mt Cass and Harapaki), the turbine density is greater - in the range of 0.16 to 0.24 MW/ha. While this difference is in part due to the increased individual turbine capacity of the recent projects, the closer spacing between these larger turbines is the main reason for the increased density factor of these new wind farms.
However, we do not necessarily interpret these recent project examples as a new trend and a move to a greater density of MW/ha for future sites. For three of these projects (Turitea, Mt Cass and Harapaki), the simple fact is that the consents are old and the layouts were based on turbines with smaller rotor
11 Connell Wagner (2008), Transmission to enable renewables; Economic wind resource study, Electricity Commission, New Zealand.

Wind Generation Stack Update
Page|17
diameters than what is available on the market today. The greater turbine density associated with these projects reflects larger rotor turbines being squeezed to a layout designed for smaller rotor turbines.
The Waipipi wind farm is being constructed with turbines that have 130 m diameter rotors. It has the advantage of being located on flat and coastal land (meaning low wind inflow angles). The Waipipi site also has minimal siting constraints, meaning the entire area of land is essentially usable. This is in contrast to other developed sites where there are gullies, low lying land and vegetated areas which add to the overall land area but are essentially wasted space. This drives a higher than normal turbine density for the Waipipi site.
Because of these reasons, we believe the higher turbine density of these four new wind farms, are more of an anomaly, as opposed to reflecting a new trend. As such, we have retained the figure of 0.1 MW/ha as the ‘Occupation Factor’ to apply to the area of land within the identified wind farm sites.
We have also applied an additional reduction factor – which we have named the ‘Development Factor’ to reflect the uncertainty that exists in the potential of a site between when it is first identified to when a project has been developed and consented. Given that for operational and consented wind farms, all the site constraints (e.g. noise, set-backs, avoidance of ecological zones and planning related aspects etc.) have already been taken into account in the wind farm layout, it is logical to assume that the turbine density will be greater than for those sites/areas that have been identified as suitable but where detailed constraints have yet to be mapped and considered in the wind farm layout.
We believe an appropriate Development Factor is 50%, which gives an overall result of 0.05MW/ha (combined for the Occupation and Development Factors) as a theoretical maximum wind farm size for each site identified. We have then further moderated the results to a “rounded” capacity that we believe to be sensible in each area identified – and to ensure an appropriate degree of conservatism in the results. This moderation approach has reduced the theoretical onshore MW capacity from 15.5 GW to 10.8 GW, a 30% overall reduction.
For offshore projects, we have used a density of 1 GW per 150 km2 or 0.069 MW/ha. This is based on a 13 MW offshore turbine (which is anticipated to be the size of commercially available offshore turbines by 203012), having a rotor diameter of 212 m and applying a spacing of 9 rotor diameters ‘downwind’ (the predominant wind direction) and 6 rotor diameters ‘cross-wind (i.e. perpendicular to the predominant wind direction). This compares to the onshore wind farm layouts which typically have a 5 - 6 rotor diameter down-wind spacing and a 2 ½ – 4 rotor diameter cross-wind spacing.
3.5. Likelihood (of being developed) For all potential projects, an estimate of the likelihood of being developed is provided. This is R40s own terminology but is essentially exchangeable with Transpower’s ‘do-able’ criteria, as originally proposed in the Scope of Works. The change in terminology is subtle, but the reason for the change is reasonably important. In our view, the site selection methodology used to identify potential sites has already considered whether a site is ‘do-able’ or not – in that, this filter has already been applied and the sites identified are all ‘do-able’, within reason.
Likelihood, is a measure of how likely a site will be able to negotiate the development issues encountered from site identification through to construction and includes consideration of:
• Land access difficulty (via investigation and development agreements).
• Stakeholder type and number (e.g. Councils, DOC, iwi etc.).
• Anticipated level of community acceptance.
• Planning regime and potential planning issues (Classification of activity, Coastal Zones etc.).
• Potential land constraints (proximity to National Parks, protected or special character areas etc.).
• Overall consent risk assessment and whether it will be pursued for consent.
12 Discussions with BVG Associates in the UK, consultants to the offshore wind industry (www.bvgassociates.com)
Wind Generation Stack Update
Page|18
• Cumulative impact from other nearby wind farms.
• Location (in relation to the HVDC).
Note that Likelihood does not include whether a project is economic - it is an assessment of non-economic factors. The Location criteria of the Likelihood measure is a somewhat crude, but an important factor nonetheless - it essentially applies a penalty to South Island projects – or at least those of significant size located south of Christchurch. With so much generation already located in the South Island, the transmission constraint/risk that exists in the HVDC and the uncertainty over the future of the Tiwai aluminum smelter (whose demand is approximately 13% of NZ’s total energy demand) it is only natural for South Island projects to be less desirable than those located in the North Island. Some South Island projects, especially those north of Christchurch like Mt Cass and Hurunui, are not impacted as greatly as those located further south.
The Likelihood parameter has been applied to the LCOE for each of the projects to produce a project ranking that defines the order in the WGS, and thus their potential order of commissioning.
3.6. Generation Stack Plant Information Following the site identification process described in Section 3.4, each site area has been analysed to provide a number of key parameters for use in establishing the potential generation and construction cost estimates – these being important aspects required in the generation stack plant information output.
3.6.1. Construction Cost Estimate The construction cost for each project/site has been estimated using a detailed ‘bottom-up’ compilation of construction related tasks. To this end a construction cost model was developed using rates, quantities and costs based on R40s prior knowledge of wind farm construction, with input from various consultants and construction contractors familiar with wind farm construction. The model covers the entire project lifecycle costs from investigation through to construction and operation. The only aspect not included are the decommissioning costs. In total the model has 92 inputs; 63 wind farm construction related inputs and 29 transmission line and grid connection related inputs. Project management, environmental monitoring, civil works and internal electrical works costs have been based on R40s previous experience of wind farm construction. Grid connection costs and transmission line costs are based on up-to-date cost information received from Transpower and BECA. Wind turbine costs have been set at $1,250/kW for all projects (see Section 3.2.2).
Formulae and look-up tables have been established for each of these 92 cost inputs to enable the extrapolation of the base data to a project of any size and configuration. A number of site-specific parameters are required for each site in order for the extrapolation of the base data to each new site to reflect the characteristics of each site appropriately. Such parameters include the topography, geology, and shape of the site. This enables a more realistic construction cost estimate to be created for each site. For instance, a site located on poor geology or steep, undulating terrain, is likely to have greater civil works costs than one having flat or gently undulating terrain. The majority of the site parameters are obtained through interrogation of the mapping generated in the GIS database.
This detailed ‘cost compilation model’ results in a far more accurate construction cost estimate for each potential site than would typically be attempted at such an early stage of site investigation and one that is undertaken entirely as a desk-top exercise. The cost compilation model used for this report ensures that the site-specific differences between projects are recognized and are appropriately reflected in the construction cost estimate, which ultimately enables a more robust economic ranking (see Section 3.6.2).
The following describes the user-defined parameters that are required for each site, and the method by which they are obtained.
Installed capacity
• Obtained through establishing the potential area of the site (as mapped in GIS – see Section 3.2) and then multiplying the area by the site reduction factor (i.e. the Occupation factor and the Development factor (Section 3.4.3)). For Consented or Investigated sites, the Installed Capacity is typically already understood/established, and a reduction factor is not required.
Wind Generation Stack Update
Page|19
Number of wind turbines
• Obtained by dividing the Installed capacity by the wind turbine size.
Number of wind farm landowners
• As estimated using the site area and the LINZ property database.
Annual Wind Farm Generation (net, after losses)
• The wind farm generation was calculated as follows: o The mean 120 m hub height wind speed was determined for each of the individual
sites. o The Weibull shape factor (k) for the site was determined from the regional wind data
set (i.e. the shape factor of the wind speed distribution was the same at each wind farm within a region).
o Four representative modern wind turbine power curves were obtained, two for Class I wind speeds (> 8.5 m/s) and two for Class II wind speeds (7.5 m/s to 8.5 m/s). While the upper limit of a Class II wind turbine is 8.5 m/s, we have used an 8.7 m/s limit for the energy assessment as depending on the site air density and other loads, turbines can often be located at sites just above their design range.
o The gross energy output and corresponding gross capacity factor were calculated for the two turbines and the average capacity factor determined. That average capacity factor was used to determine the gross output for the individual wind farm based on the installed capacity
o The net energy output and net capacity factor has been determined by assuming a 15% and 25% wind farm loss factor. These factors account for both wind farm losses and give a likely generation output range, given the uncertainties associated with the base wind speed mapping.
o We note that while each individual turbine has a specific power curve, generally the capacity factor for similar Class turbines are reasonably close. By considering two current models in each wind speed class, and determining an average capacity factor, it will be representative of typical turbines in that wind class.
o Wind generation profiles for each of the eighteen R40s geographic regions are contained in Appendix B.
Wind Turbine Cost (expressed as $/kW)
• This is set as a constant figure of NZD$1,250/kW reflecting turbine supply, delivery and installation. This figure has been derived from current evidence of wind farm construction globally and locally (see Section 3.2.2) and is considered by R40s to be an appropriate rate, based on current pricing for modern turbines in the 3.5 – 4.5 MW range.
Civil Works
• There are a number of site parameters that are used in establishing the costs of the civil works for a given site, including:
o Internal wind farm road density (dependent on topography and turbine size). o Civil works difficulty factor (dependent on geology and topography). o Turbine foundation factor (dependent on geology). o External road access cost (dependent on distant from existing road network and
anticipated difficulty of port to site turbine transportation route). o Cable trenching difficulty (depending on the geology and topography).
Internal Electrical Works
• There are a number of site parameters that are used in establishing the costs of the electrical works for a given site, including:
o Cable rating factor (dependent on the geology). o Cabling shape factor (dependent on the shape of the site).
Wind Generation Stack Update
Page|20
o Number of cable ‘strings’ (dependent on the maximum MW per string, which itself is dependent on the cable rating factor).
o Length of cabling (dependent on the number of strings and shape factor). o Number of wind farm substations and number of transformers (dependent on wind
farm capacity).
External Electrical Works
• These are the costs associated with transmission line and grid connection costs, including: o GIP connection type (new, or existing – depending on whether an existing GXP is
close). o GIP voltage (50 kV, 66 kV, 110 kV, 220 kV or 400 kV). o Grid connection difficulty factor (dependent on topography and geology of GIP
location). o Transmission line voltage (assumed to be the same as the line to which connection will
be made, or the most appropriate voltage where connection to an existing GXP occurs).
o Transmission line length (distance between centre of wind farm and future GIP or existing GIP if in reasonable proximity of the wind farm site13).
o Transmission line difficulty factor (dependent on geology and topography - impacts foundation cost and number of towers required).
o Percentage of towers as monopoles (monopoles, which are more costly than standard pylons are anticipated to be preferred in locations close to concentrations of people).
o Single or Double Circuit (dependent on wind farm capacity). o Simplex or Duplex (dependent on wind farm capacity). o Number of properties along the Transmission line route (as estimated off the LINZ
property database).
Environmental Factors
• Although not a big component of costs associated with wind farm construction, the costs associated with environmental monitoring and consent compliance have been included for completeness. There are four Environmental factors as follows:
o Ecological (Avifauna) – e.g. monitoring of birds and bats. o Ecological (Other) – e.g. vegetation, lizard, snail surveys and/or relocations etc. o Archaeology/Cultural. o Council Compliance.
3.6.2. Model Validation A validation of the model was undertaken – using the two wind farm projects that have recently been publicly announced for construction (Waipipi and Turitea) and for which there are known construction costs (as reported by the developers). The validation was to prove the concept of being able to extrapolate data from a generic project to any project of differing size and characteristic.
Site specific user-defined parameters were entered into the model for projects Waipipi and Turitea, using the various methods described in Section 3.6.1. Turbine costs were assumed to be the same as that estimated by R40s (i.e. NZ$1,250/kW) as being relevant in the current market, but slightly adjusted to reflect the exchange rate at the time the contracts for turbine supply were entered into. These dates are 6 September 2019 for Waipipi – as announced on the NZX that day, and 27 March 2019 for Turitea Stage 1 (33 turbines) and 12 November 2019 for Turitea Stage 2 (27 turbines). The price of the Turitea turbines is complicated not only by the difference in dates, but also by the fact that the turbine output changed
13 If an existing GXP is less than 10 km more than the direct line for a 110 kV connection, or less than 15 km more than the direct line for a 220 kV connection then the existing GXP will be the point of connection
Wind Generation Stack Update
Page|21
between these dates (the first stage has 3.6MW Vestas turbines while the second stage has 3.8MW Vestas turbines – these being an up-rated version of the 3.6MW turbine).
The model then derives appropriate quantities for the civil works and internal electrical reticulation based on the user defined parameters and applies the rates from the generic project to obtain civil costs and lookup tables to obtain electrical costs. Waipipi and Turitea are quite different in regard to their respective site characteristics. The Waipipi site is essentially flat (meaning easier and cheaper road construction costs) but the geology is mostly unconsolidated sands resulting in much larger and more costly wind turbine foundations than normal. Conversely, the Turitea site is undulating meaning greater, and more expensive roading costs but the geology consists of stronger sedimentary rock (mainly greywacke). This means that the wind turbine foundations are more typical in size, and thus cheaper than those at Waipipi.
Transmission line costs for both projects are calculated using lookup tables for the given length, voltage, types of structures (i.e. poles or pylons) and the difficulty of line construction. Lookup tables are also used to establish the grid connection costs for the voltage and the type of grid connection (i.e. existing or new GIP). In the case of Waipipi, the grid connection is to an existing (Waverly) substation (at 110kV), whereas the Turitea project connects to the existing Linton substation at 220kV and has an internal wind farm substation within each of the two stages, with 220kV lines between these and to the Linton substation.
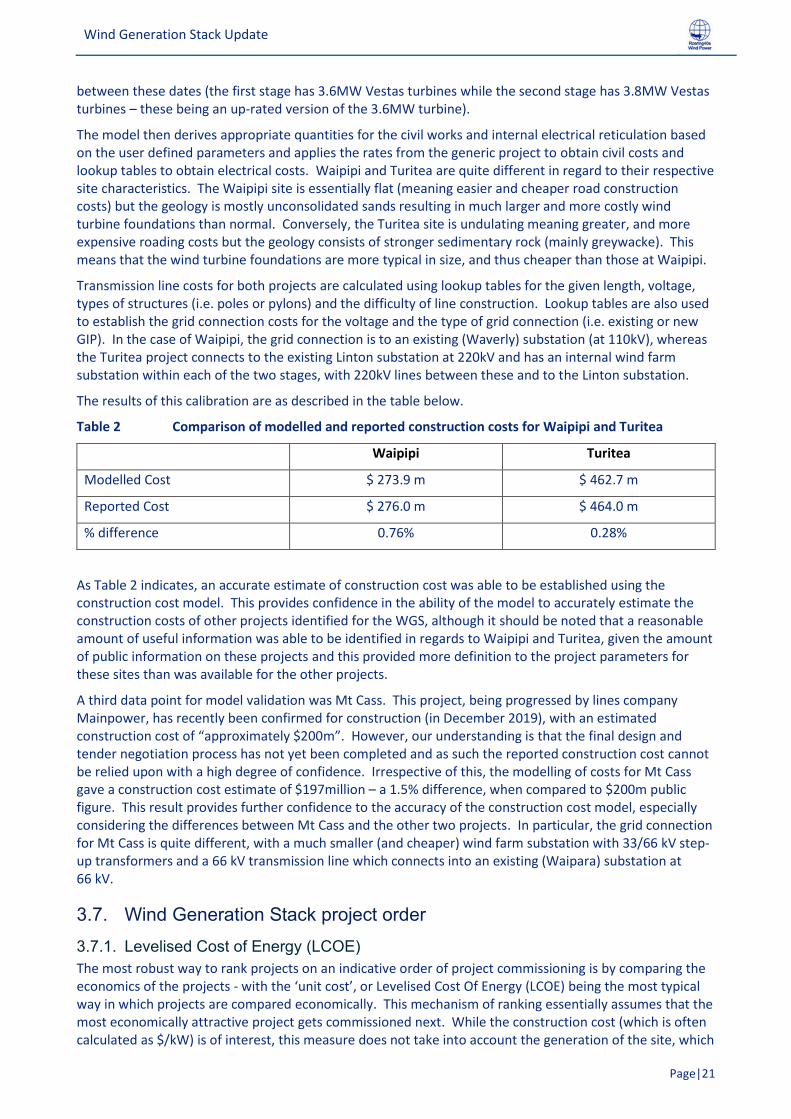
The results of this calibration are as described in the table below.
Table 2 Comparison of modelled and reported construction costs for Waipipi and Turitea
Waipipi Turitea
Modelled Cost $ 273.9 m $ 462.7 m
Reported Cost $ 276.0 m $ 464.0 m
% difference 0.76% 0.28%
As Table 2 indicates, an accurate estimate of construction cost was able to be established using the construction cost model. This provides confidence in the ability of the model to accurately estimate the construction costs of other projects identified for the WGS, although it should be noted that a reasonable amount of useful information was able to be identified in regards to Waipipi and Turitea, given the amount of public information on these projects and this provided more definition to the project parameters for these sites than was available for the other projects.
A third data point for model validation was Mt Cass. This project, being progressed by lines company Mainpower, has recently been confirmed for construction (in December 2019), with an estimated construction cost of “approximately $200m”. However, our understanding is that the final design and tender negotiation process has not yet been completed and as such the reported construction cost cannot be relied upon with a high degree of confidence. Irrespective of this, the modelling of costs for Mt Cass gave a construction cost estimate of $197million – a 1.5% difference, when compared to $200m public figure. This result provides further confidence to the accuracy of the construction cost model, especially considering the differences between Mt Cass and the other two projects. In particular, the grid connection for Mt Cass is quite different, with a much smaller (and cheaper) wind farm substation with 33/66 kV step-up transformers and a 66 kV transmission line which connects into an existing (Waipara) substation at 66 kV.
3.7. Wind Generation Stack project order 3.7.1. Levelised Cost of Energy (LCOE) The most robust way to rank projects on an indicative order of project commissioning is by comparing the economics of the projects - with the ‘unit cost’, or Levelised Cost Of Energy (LCOE) being the most typical way in which projects are compared economically. This mechanism of ranking essentially assumes that the most economically attractive project gets commissioned next. While the construction cost (which is often calculated as $/kW) is of interest, this measure does not take into account the generation of the site, which
Wind Generation Stack Update
Page|22
can vary greatly depending on the wind resource and type of wind turbine. It is only when the generation potential of the project is considered that the true value of the project can be known.
However, calculating the LCOE for a project is not a straightforward exercise as it requires an economic model to be constructed and a number of assumptions have to be made (e.g. the Weighted Average Cost of Capital (WACC), depreciation and tax), which may differ between developers of sites. To this end, R40s created an economic model which uses site-specific annual generation, construction costs, construction duration and operational costs, in conjunction with the following consistent project parameters:
• Lifetime Expectancy: 30 years.
• Corporate Tax Rate: 28%.
• Inflation: 2%.
• Depreciation – Civil: 4%.
• Depreciation – Electrical: 8%.
• Depreciation – Turbines: 20%.
In addition to the above we have assumed a (post-tax) nominal discount rate of 7%. This is equivalent to a (post-tax) real discount rate of 4.9% (assuming 2% inflation and a pre-tax real discount rate of 6.8% and a corporate tax rate of 28%). Clearly these discount rates won’t be valid for every project and all wind farm project developers, but they have been adopted as being suitable to use for this project economic modelling ranking exercise. We note that the current Default pre-tax real discount rate recommended by Treasury is 6% - this being the same rate as they recommended for Infrastructure projects14. However, we believe it is appropriate to incorporate a degree of conservatism and therefore we have adopted the values described above. We note that the absolute value of the discount rate used does not impact the ranking of the projects – provided that the discount rates used are consistent for all projects.
In regard to the annual generation estimate for each site, this has been established as described in Section 3.6.1. The Operations and Maintenance (O&M) costs have been established for each site through the compilation of costs associated with eight parameters relevant to operations and maintenance as follows:
o Wind turbine O&M ($/MW). o Wind farm substation maintenance. o Transmission line and GIP maintenance. o Landowner payments. o Council Rates. o Wind farm civil works maintenance. o Wind farm electrical reticulation maintenance. o Project overhead and Insurance.
Following the economic analysis, the projects can then be ranked on unit cost, with lowest unit cost being the most economically attractive. This project order is then reviewed and revised, making any changes necessary after the project Likelihood parameter (Section 3.5) is considered. The outcome of this exercise is the WGS project order.
3.7.2. LCOE Sensitivity The scope of this study did not include calculating and reporting the LCOE for each possible wind farm site identified, rather, the LCOE has been used to rank the projects in order to establish an indicative project commissioning order and also to provide a likely range of LCOE for projects commissioned by decade.
14 https://treasury.govt.nz/information-and-services/state-sector-leadership/guidance/financial-reporting-policies-and-guidance/discount-rates
Wind Generation Stack Update
Page|23
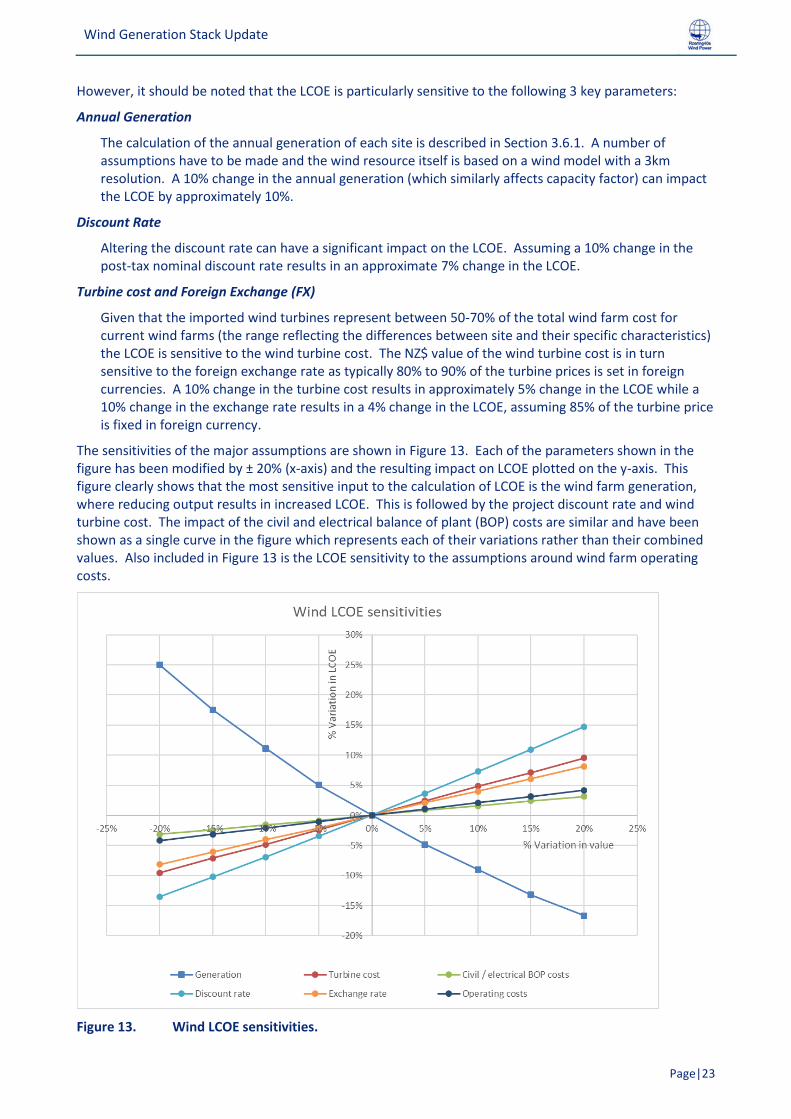
However, it should be noted that the LCOE is particularly sensitive to the following 3 key parameters:
Annual Generation
The calculation of the annual generation of each site is described in Section 3.6.1. A number of assumptions have to be made and the wind resource itself is based on a wind model with a 3km resolution. A 10% change in the annual generation (which similarly affects capacity factor) can impact the LCOE by approximately 10%.
Discount Rate
Altering the discount rate can have a significant impact on the LCOE. Assuming a 10% change in the post-tax nominal discount rate results in an approximate 7% change in the LCOE.
Turbine cost and Foreign Exchange (FX)
Given that the imported wind turbines represent between 50-70% of the total wind farm cost for current wind farms (the range reflecting the differences between site and their specific characteristics) the LCOE is sensitive to the wind turbine cost. The NZ$ value of the wind turbine cost is in turn sensitive to the foreign exchange rate as typically 80% to 90% of the turbine prices is set in foreign currencies. A 10% change in the turbine cost results in approximately 5% change in the LCOE while a 10% change in the exchange rate results in a 4% change in the LCOE, assuming 85% of the turbine price is fixed in foreign currency.
The sensitivities of the major assumptions are shown in Figure 13. Each of the parameters shown in the figure has been modified by ± 20% (x-axis) and the resulting impact on LCOE plotted on the y-axis. This figure clearly shows that the most sensitive input to the calculation of LCOE is the wind farm generation, where reducing output results in increased LCOE. This is followed by the project discount rate and wind turbine cost. The impact of the civil and electrical balance of plant (BOP) costs are similar and have been shown as a single curve in the figure which represents each of their variations rather than their combined values. Also included in Figure 13 is the LCOE sensitivity to the assumptions around wind farm operating costs.
Figure 13. Wind LCOE sensitivities.
Wind Generation Stack Update
Page|24
3.7.3. Wind Generation Stack project parameters The output of the modelling undertaken in Sections 3.6.1, 3.6.2 and 3.6.3 can be used to provide the necessary inputs into the WGS (being the overall objective of this study), as follows:
• Largest generating unit, MW.
• Capital cost, $/kW.
• FX component (e.g. USD, Euro, Yen), $/kW.
• NZD component, $/kW.
• O&M fixed cost, $/kW/year.
• O&M variable cost, $/MWh.
• Construction period.
• Expected operating life, years.
• Transmission to connect to grid, kms.
• Capacity factor, %.
In regard to the costs exposed to the foreign exchange (FX) and those that are local (NZD) costs, we have assumed that the wind turbines and any substation transformers will be the imported components and thus comprise the FX component. This split of costs is the most likely split for any wind farm constructed in NZ given that it is unlikely that any new grid connected wind farm constructed in NZ will utilize NZ made wind turbines in the foreseeable future15
4. Results 4.1. Introduction The following section describes the results of the analysis undertaken and provides a summary of the potential wind farm sites identified during this study.
4.2. Site summary Table 3 includes a summary of the individual site results and Table 4 gives a summary by geographical region. Note that, in addition to the projects summarised in this section, a further four sites exist but which have not been modelled via the methodology described in this report. These four sites are Waipipi, Turitea, Harapaki and Mt Cass. As these sites are either under construction (Waipipi and Turitea) or in an advanced pre-construction phase (Harapaki and Mt Cass) it was not necessary to use the modelling technique described in Section 3 to determine the potential size and generation for these projects. The size and generation potential of these four sites is known and the timing of construction is known for projects Waipipi and Turitea and assumed to be imminent for projects Harapaki and Mt Cass.
To clarify, these four projects are in the WGS, they are just not included in the list of potential future sites (on the basis that they are considered more certain than potential).
The salient details of projects identified in this study are:
• There are 82 onshore projects, totalling 11,400 MW and a combined annual generation of 39,000 - 44,000 GWh/annum.
• Two of these projects are under construction (Waipipi and Turitea) and two are in an advanced pre construction phase (Harapaki and Mt Cass) and are anticipated to begin construction during 2020. These four projects have not been modelled in the same way as the other sites given the definitive nature of their status.
15 NZ based wind turbine manufacturing company Windflow Technology entered into voluntary liquidation on 23 December 2019.
Wind Generation Stack Update
Page|25
• Of the remaining 78 ‘new’ projects 57 are located in the North Island, totalling approximately 7,900 MW and would generate 27,000 - 31,000 GWh/annum. 21 projects are located in the South Island, totalling approximately 2,900 MW and would generate 10,000 - 11,000 GWh/annum.
• Projects range in size from 10-500 MW, with the first and third quartiles being 85 and 150 MW respectively.
• 14 projects, comprising 6% of the total MW and GWh, are 75MW or less and many of these are likely to be connected to the local distribution network (i.e. ‘embedded’). These ‘small scale’ projects may not be directly connected to the Transpower Grid and are typically assumed to connect to the respective Lines Company network voltage, which is assumed to be 50 kV, but could also be 33 kV or 66 kV.
• For two specific embedded projects, a 110 kV connection has been assumed (based on knowledge of the particular sites and the available 110 kV network that is owned by the relevant Lines Company).
• 71 projects will require a new transmission line to connect to the local network or grid.
• The first and third quartiles for transmission line length are 5 and 21 km respectively.
• The longest transmission line is 100 km (although this is somewhat of an outlier, with the next longest being half that length (50 km).
• There are 7 sites that do not require a transmission line (i.e. an existing transmission line passes through the project site).
Wind Generation Stack Update
Page|26
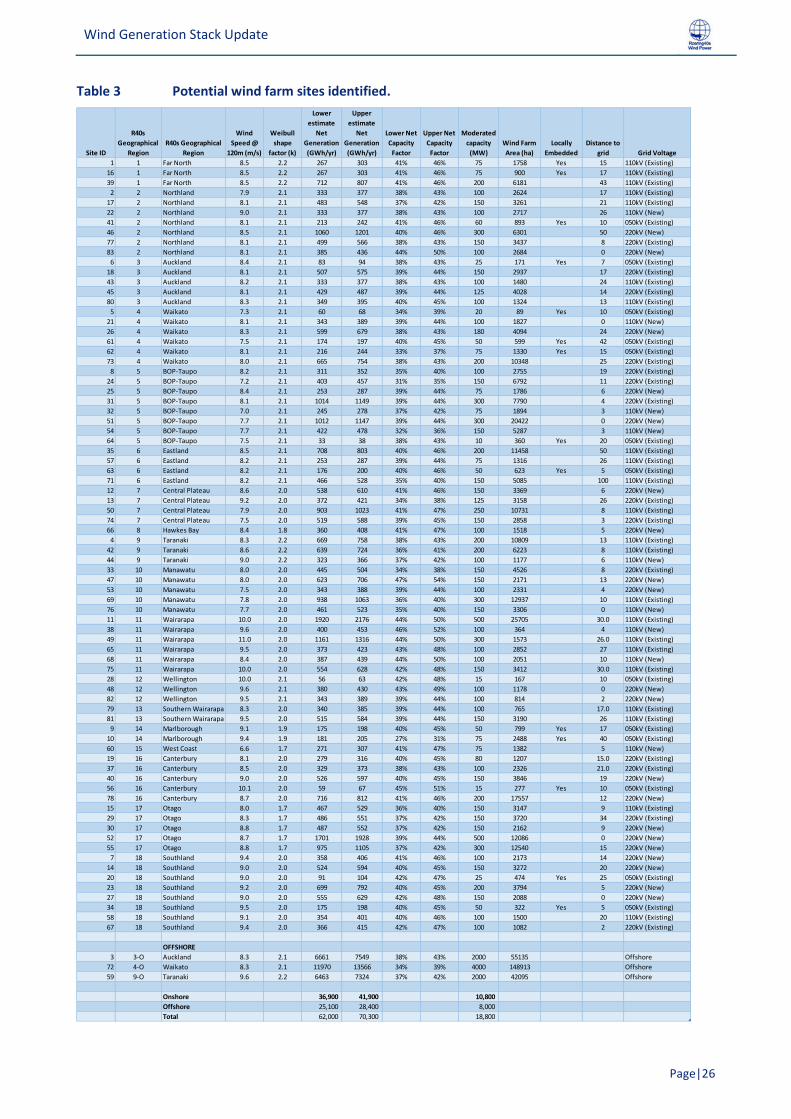
Table 3 Potential wind farm sites identified.
Site ID
R40s
Geographical
Region
R40s Geographical
Region
Wind
Speed @
120m (m/s)
Weibull
shape
factor (k)
Lower
estimate
Net
Generation
(GWh/yr)
Upper
estimate
Net
Generation
(GWh/yr)
Lower Net
Capacity
Factor
Upper Net
Capacity
Factor
Moderated
capacity
(MW)
Wind Farm
Area (ha)
Locally
Embedded
Distance to
grid Grid Voltage
1 1 Far North 8.5 2.2 267 303 41% 46% 75 1758 Yes 15 110kV (Existing)
16 1 Far North 8.5 2.2 267 303 41% 46% 75 900 Yes 17 110kV (Existing)
39 1 Far North 8.5 2.2 712 807 41% 46% 200 6181 43 110kV (Existing)
2 2 Northland 7.9 2.1 333 377 38% 43% 100 2624 17 110kV (Existing)
17 2 Northland 8.1 2.1 483 548 37% 42% 150 3261 21 110kV (Existing)
22 2 Northland 9.0 2.1 333 377 38% 43% 100 2717 26 110kV (New)
41 2 Northland 8.1 2.1 213 242 41% 46% 60 893 Yes 10 050kV (Existing)
46 2 Northland 8.5 2.1 1060 1201 40% 46% 300 6301 50 220kV (New)
77 2 Northland 8.1 2.1 499 566 38% 43% 150 3437 8 220kV (Existing)
83 2 Northland 8.1 2.1 385 436 44% 50% 100 2684 0 220kV (New)
6 3 Auckland 8.4 2.1 83 94 38% 43% 25 171 Yes 7 050kV (Existing)
18 3 Auckland 8.1 2.1 507 575 39% 44% 150 2937 17 220kV (Existing)
43 3 Auckland 8.2 2.1 333 377 38% 43% 100 1480 24 110kV (Existing)
45 3 Auckland 8.1 2.1 429 487 39% 44% 125 4028 14 220kV (Existing)
80 3 Auckland 8.3 2.1 349 395 40% 45% 100 1324 13 110kV (Existing)
5 4 Waikato 7.3 2.1 60 68 34% 39% 20 89 Yes 10 050kV (Existing)
21 4 Waikato 8.1 2.1 343 389 39% 44% 100 1827 0 110kV (New)
26 4 Waikato 8.3 2.1 599 679 38% 43% 180 4094 24 220kV (New)
61 4 Waikato 7.5 2.1 174 197 40% 45% 50 599 Yes 42 050kV (Existing)
62 4 Waikato 8.1 2.1 216 244 33% 37% 75 1330 Yes 15 050kV (Existing)
73 4 Waikato 8.0 2.1 665 754 38% 43% 200 10348 25 220kV (Existing)
8 5 BOP-Taupo 8.2 2.1 311 352 35% 40% 100 2755 19 220kV (Existing)
24 5 BOP-Taupo 7.2 2.1 403 457 31% 35% 150 6792 11 220kV (Existing)
25 5 BOP-Taupo 8.4 2.1 253 287 39% 44% 75 1786 6 220kV (New)
31 5 BOP-Taupo 8.1 2.1 1014 1149 39% 44% 300 7790 4 220kV (Existing)
32 5 BOP-Taupo 7.0 2.1 245 278 37% 42% 75 1894 3 110kV (New)
51 5 BOP-Taupo 7.7 2.1 1012 1147 39% 44% 300 20422 0 220kV (New)
54 5 BOP-Taupo 7.7 2.1 422 478 32% 36% 150 5287 3 110kV (New)
64 5 BOP-Taupo 7.5 2.1 33 38 38% 43% 10 360 Yes 20 050kV (Existing)
35 6 Eastland 8.5 2.1 708 803 40% 46% 200 11458 50 110kV (Existing)
57 6 Eastland 8.2 2.1 253 287 39% 44% 75 1316 26 110kV (Existing)
63 6 Eastland 8.2 2.1 176 200 40% 46% 50 623 Yes 5 050kV (Existing)
71 6 Eastland 8.2 2.1 466 528 35% 40% 150 5085 100 110kV (Existing)
12 7 Central Plateau 8.6 2.0 538 610 41% 46% 150 3369 6 220kV (New)
13 7 Central Plateau 9.2 2.0 372 421 34% 38% 125 3158 26 220kV (Existing)
50 7 Central Plateau 7.9 2.0 903 1023 41% 47% 250 10731 8 110kV (Existing)
74 7 Central Plateau 7.5 2.0 519 588 39% 45% 150 2858 3 220kV (Existing)
66 8 Hawkes Bay 8.4 1.8 360 408 41% 47% 100 1518 5 220kV (New)
4 9 Taranaki 8.3 2.2 669 758 38% 43% 200 10809 13 110kV (Existing)
42 9 Taranaki 8.6 2.2 639 724 36% 41% 200 6223 8 110kV (Existing)
44 9 Taranaki 9.0 2.2 323 366 37% 42% 100 1177 6 110kV (New)
33 10 Manawatu 8.0 2.0 445 504 34% 38% 150 4526 8 220kV (Existing)
47 10 Manawatu 8.0 2.0 623 706 47% 54% 150 2171 13 220kV (New)
53 10 Manawatu 7.5 2.0 343 388 39% 44% 100 2331 4 220kV (New)
69 10 Manawatu 7.8 2.0 938 1063 36% 40% 300 12937 10 110kV (Existing)
76 10 Manawatu 7.7 2.0 461 523 35% 40% 150 3306 0 110kV (New)
11 11 Wairarapa 10.0 2.0 1920 2176 44% 50% 500 25705 30.0 110kV (Existing)
38 11 Wairarapa 9.6 2.0 400 453 46% 52% 100 364 4 110kV (New)
49 11 Wairarapa 11.0 2.0 1161 1316 44% 50% 300 1573 26.0 110kV (Existing)
65 11 Wairarapa 9.5 2.0 373 423 43% 48% 100 2852 27 110kV (Existing)
68 11 Wairarapa 8.4 2.0 387 439 44% 50% 100 2051 10 110kV (New)
75 11 Wairarapa 10.0 2.0 554 628 42% 48% 150 3412 30.0 110kV (Existing)
28 12 Wellington 10.0 2.1 56 63 42% 48% 15 167 10 050kV (Existing)
48 12 Wellington 9.6 2.1 380 430 43% 49% 100 1178 0 220kV (New)
82 12 Wellington 9.5 2.1 343 389 39% 44% 100 814 2 220kV (New)
79 13 Southern Wairarapa 8.3 2.0 340 385 39% 44% 100 765 17.0 110kV (Existing)
81 13 Southern Wairarapa 9.5 2.0 515 584 39% 44% 150 3190 26 110kV (Existing)
9 14 Marlborough 9.1 1.9 175 198 40% 45% 50 799 Yes 17 050kV (Existing)
10 14 Marlborough 9.4 1.9 181 205 27% 31% 75 2488 Yes 40 050kV (Existing)
60 15 West Coast 6.6 1.7 271 307 41% 47% 75 1382 5 110kV (New)
19 16 Canterbury 8.1 2.0 279 316 40% 45% 80 1207 15.0 220kV (Existing)
37 16 Canterbury 8.5 2.0 329 373 38% 43% 100 2326 21.0 220kV (Existing)
40 16 Canterbury 9.0 2.0 526 597 40% 45% 150 3846 19 220kV (New)
56 16 Canterbury 10.1 2.0 59 67 45% 51% 15 277 Yes 10 050kV (Existing)
78 16 Canterbury 8.7 2.0 716 812 41% 46% 200 17557 12 220kV (New)
15 17 Otago 8.0 1.7 467 529 36% 40% 150 3147 9 110kV (Existing)
29 17 Otago 8.3 1.7 486 551 37% 42% 150 3720 34 220kV (Existing)
30 17 Otago 8.8 1.7 487 552 37% 42% 150 2162 9 220kV (New)
52 17 Otago 8.7 1.7 1701 1928 39% 44% 500 12086 0 220kV (New)
55 17 Otago 8.8 1.7 975 1105 37% 42% 300 12540 15 220kV (New)
7 18 Southland 9.4 2.0 358 406 41% 46% 100 2173 14 220kV (New)
14 18 Southland 9.0 2.0 524 594 40% 45% 150 3272 20 220kV (New)
20 18 Southland 9.0 2.0 91 104 42% 47% 25 474 Yes 25 050kV (Existing)
23 18 Southland 9.2 2.0 699 792 40% 45% 200 3794 5 220kV (New)
27 18 Southland 9.0 2.0 555 629 42% 48% 150 2088 0 220kV (New)
34 18 Southland 9.5 2.0 175 198 40% 45% 50 322 Yes 5 050kV (Existing)
58 18 Southland 9.1 2.0 354 401 40% 46% 100 1500 20 110kV (Existing)
67 18 Southland 9.4 2.0 366 415 42% 47% 100 1082 2 220kV (Existing)
OFFSHORE
3 3-O Auckland 8.3 2.1 6661 7549 38% 43% 2000 55135 Offshore
72 4-O Waikato 8.3 2.1 11970 13566 34% 39% 4000 148913 Offshore
59 9-O Taranaki 9.6 2.2 6463 7324 37% 42% 2000 42095 Offshore
Onshore 36,900 41,900 10,800
Offshore 25,100 28,400 8,000
Total 62,000 70,300 18,800
Wind Generation Stack Update
Page|27
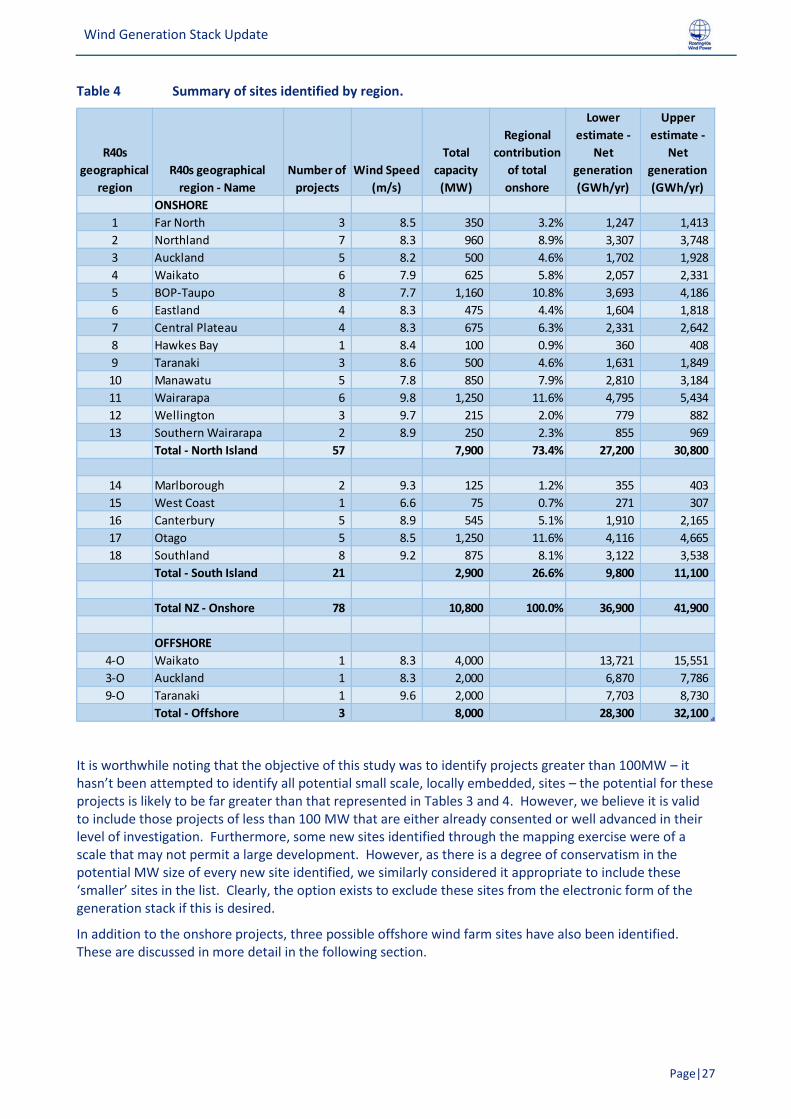
Table 4 Summary of sites identified by region.
It is worthwhile noting that the objective of this study was to identify projects greater than 100MW – it hasn’t been attempted to identify all potential small scale, locally embedded, sites – the potential for these projects is likely to be far greater than that represented in Tables 3 and 4. However, we believe it is valid to include those projects of less than 100 MW that are either already consented or well advanced in their level of investigation. Furthermore, some new sites identified through the mapping exercise were of a scale that may not permit a large development. However, as there is a degree of conservatism in the potential MW size of every new site identified, we similarly considered it appropriate to include these ‘smaller’ sites in the list. Clearly, the option exists to exclude these sites from the electronic form of the generation stack if this is desired.
In addition to the onshore projects, three possible offshore wind farm sites have also been identified. These are discussed in more detail in the following section.
R40s
geographical
region
R40s geographical
region - Name
Number of
projects
Wind Speed
(m/s)
Total
capacity
(MW)
Regional
contribution
of total
onshore
Lower
estimate -
Net
generation
(GWh/yr)
Upper
estimate -
Net
generation
(GWh/yr)
ONSHORE
1 Far North 3 8.5 350 3.2% 1,247 1,413
2 Northland 7 8.3 960 8.9% 3,307 3,748
3 Auckland 5 8.2 500 4.6% 1,702 1,928
4 Waikato 6 7.9 625 5.8% 2,057 2,331
5 BOP-Taupo 8 7.7 1,160 10.8% 3,693 4,186
6 Eastland 4 8.3 475 4.4% 1,604 1,818
7 Central Plateau 4 8.3 675 6.3% 2,331 2,642
8 Hawkes Bay 1 8.4 100 0.9% 360 408
9 Taranaki 3 8.6 500 4.6% 1,631 1,849
10 Manawatu 5 7.8 850 7.9% 2,810 3,184
11 Wairarapa 6 9.8 1,250 11.6% 4,795 5,434
12 Wellington 3 9.7 215 2.0% 779 882
13 Southern Wairarapa 2 8.9 250 2.3% 855 969
Total - North Island 57 7,900 73.4% 27,200 30,800
14 Marlborough 2 9.3 125 1.2% 355 403
15 West Coast 1 6.6 75 0.7% 271 307
16 Canterbury 5 8.9 545 5.1% 1,910 2,165
17 Otago 5 8.5 1,250 11.6% 4,116 4,665
18 Southland 8 9.2 875 8.1% 3,122 3,538
Total - South Island 21 2,900 26.6% 9,800 11,100
Total NZ - Onshore 78 10,800 100.0% 36,900 41,900
OFFSHORE
4-O Waikato 1 8.3 4,000 13,721 15,551
3-O Auckland 1 8.3 2,000 6,870 7,786
9-O Taranaki 1 9.6 2,000 7,703 8,730
Total - Offshore 3 8,000 28,300 32,100
Wind Generation Stack Update
Page|28
4.3. WGS – offshore wind farms R40s is of the opinion that within the next 20 to 30 years there could be some offshore wind farm developments in New Zealand. This is based on the current offshore wind farm economics and the rate that it is trending along with other constraints that may impact onshore wind farms in the future. The majority of today’s offshore wind farms are located in water depths of less than 30 m, using monopile foundations fixed to the seabed. Mono-piles in the 10 m to 20 m water depth range are the cheapest foundation approach but can be used up to about 40 m. It is expected that in depths of greater than 55 m, floating wind turbines will be the most economic offshore solution in the future.
We have identified three regions that could be suitable for offshore wind farms, as follows:
1 Off the west coast of Auckland.
2 Off the Waikato west coast.
3 Off the South Taranaki coast.
These are identified on Figure A9 in Appendix A and their approximate size (MW) and generation potential (GWh/annum) are listed in Tables 3 and 4. The South Taranaki coast option is a large area with an extremely good wind resource (average wind speed 9.6 m/s) and a water depth of less than 50 m. The Auckland and Waikato coast options aren’t as attractive from a wind resource perspective (average wind speed 8.3m/s) and are in deeper water (60 m to 150 m deep) but have the advantage of being closer to the large load centre of the Auckland Region. By siting the offshore wind farms in these zones there would be less onshore transmission grid upgrades than would be required for the South Taranaki offshore project. Note also that the zones off the Waikato and Auckland coasts were selected to be beyond the 12 nautical mile limit, as a marine mammal sanctuary extends off the west coast of NZ in this region.
The three sites identified by R40s corresponds with the modelling work undertaken by the International Energy Agency to identify the global offshore wind potential classified by water depth and distance from shore and population density offshore wind resource16.
4.4. WGS project order and key parameters As described previously, the overall objective of this study is to produce an updated Wind Generation Stack and accompanying project parameters. This has been achieved through a detailed mapping exercise, a robust assessment of construction cost, and a project ranking based on calculated unit cost (and to a lesser degree, ‘Likelihood’), which provides an indicative order of commissioning.
However, what this study has not done, is restrict any project in regard to its size or position in WGS (based on economic attractiveness), in regard to any existing transmission grid constraints. Thus it assumes that the location of the grid connection for any given project is able to accommodate the additional generation supplied by the new plant. It has been assumed that this was intended by Transpower and MBIE as the location of new plant in this unconstrained merit order will help identify where grid upgrades will need to occur, and by when.
The complete information set is provided electronically in spreadsheet format but cannot be included within this report as the number of projects makes a summary in tabular form too cumbersome. However, some salient summary information is described as follows:
• In the first decade (2020 – 2030), 16 projects have been identified in order to meet the required 2,500MW in the WGS.
• The order of the first two is confirmed – Waipipi and Turitea, with commissioning of these projects anticipated to be first quarter 2021 and first quarter 2022 respectively.
• The third and fourth projects are anticipated to be Harapaki and Mt Cass.
16 IEA (2019), Offshore Wind Outlook 2019: World Energy Outlook Special Report, International Energy Agency
Wind Generation Stack Update
Page|29
• The remainder of the projects are in an order based on ranking exercise, but it is likely that the order of commissioning of these projects may change, as dependent on consenting, the electricity market and developer appetite.
• All of these 16 sites are identified on Figure A8 (Appendix A). They are: o Waipipi. o Turitea. o Harapaki. o Mt Cass. o Puketoi. o Castle Hill. o Kaiwera Downs. o Awhitu. o Central Wind. o Mt Munro. o Waitahora. o Kaimai. o Flemington. o Mahinerangi Stage 2. o Hurunui.
• Of these 16 sites all have existing resource consents except for: o Waitahora (which was consented previously but has since lapsed). o Kaimai (currently in the consenting process). o Mt Munro (a consent application was previously lodged but subsequently withdrawn). o Flemington (no previous consent application).
• It has been assumed that some developers will choose to revise and update the conditions of consent for some of the consented projects (by way of variations of consent) in order to allow larger rotor wind turbines in order to deliver more attractive project economics Consent lapse dates may be extended too.
• The majority of the first 16 projects have a unit cost between $60 – 70/MWh, with some projects potentially having unit costs lower than this range.
• The capital costs for first 16 projects ranges between $1990 – 2400/kW, with the majority in the range $2000 – 2200/kW.
• Projects anticipated to be commissioned between 2020 – 2030 will typically have turbines between 4-5MW in output, although some projects may potentially have larger turbines, and some smaller.
• Projects anticipated to be commissioned between 2030 – 2060 will typically have turbines between 4-6MW in output, although some projects may potentially have larger turbines, and some smaller.
• Only one project anticipated to be commissioned after 2030 has a current consent – Taumatatotara – however this project is anticipated to have a total output of approximately 10MW and thus is not significant from an electricity market and grid planning perspective. Two other sites, Taharoa and Long Gully, have previously been consented, but these have since lapsed.
• The order of projects between years 2030-2060, whilst ranked based on their indicative project economics, should not be assumed as definitive. As the majority of these sites are either currently not yet investigated at all, or only at initial stages of wind monitoring, it is too uncertain which will be consented and developed first. We do however believe that in the future there is a higher probability that projects will be built once consented rather than a number of consents being banked.
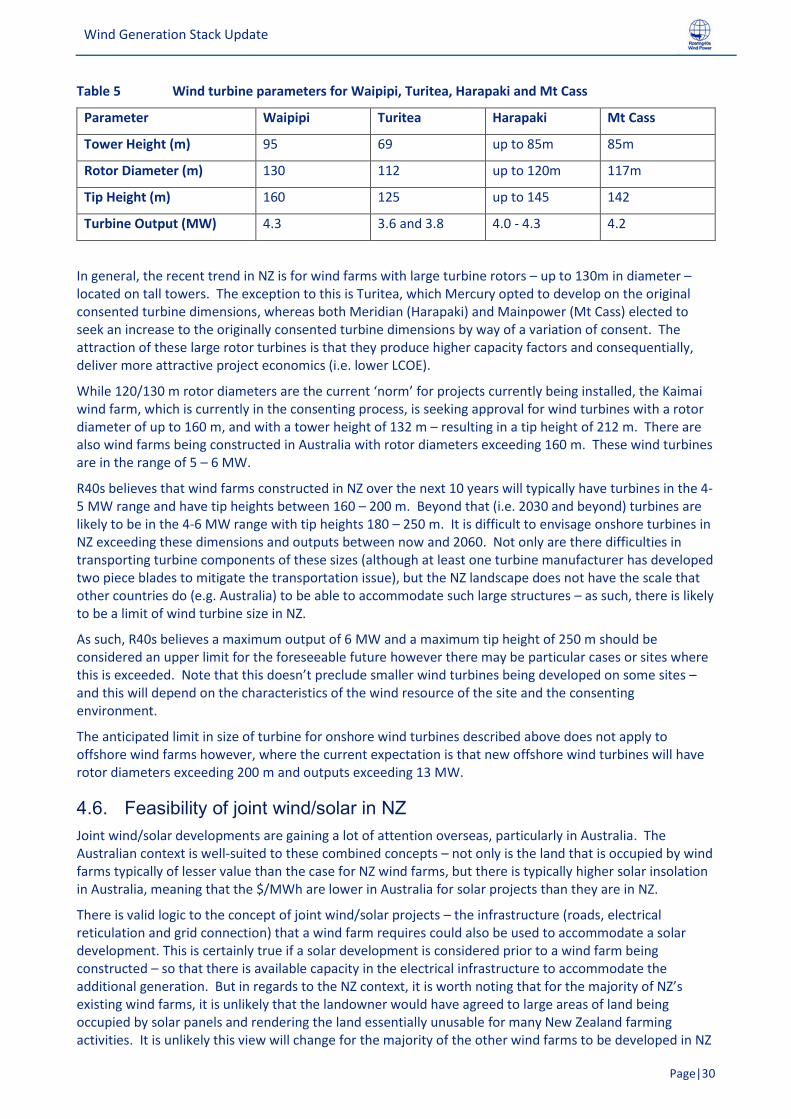
4.5. Turbine Trends – in the NZ context Table 5 describes the key parameters of the Waipipi and Turitea wind farms that have recently been approved for construction and the anticipated range of turbine parameters for projects Harapaki and Mt Cass, which are considered likely to begin construction during 2020.
Wind Generation Stack Update
Page|30
Table 5 Wind turbine parameters for Waipipi, Turitea, Harapaki and Mt Cass
Parameter Waipipi Turitea Harapaki Mt Cass
Tower Height (m) 95 69 up to 85m 85m
Rotor Diameter (m) 130 112 up to 120m 117m
Tip Height (m) 160 125 up to 145 142
Turbine Output (MW) 4.3 3.6 and 3.8 4.0 - 4.3 4.2
In general, the recent trend in NZ is for wind farms with large turbine rotors – up to 130m in diameter – located on tall towers. The exception to this is Turitea, which Mercury opted to develop on the original consented turbine dimensions, whereas both Meridian (Harapaki) and Mainpower (Mt Cass) elected to seek an increase to the originally consented turbine dimensions by way of a variation of consent. The attraction of these large rotor turbines is that they produce higher capacity factors and consequentially, deliver more attractive project economics (i.e. lower LCOE).
While 120/130 m rotor diameters are the current ‘norm’ for projects currently being installed, the Kaimai wind farm, which is currently in the consenting process, is seeking approval for wind turbines with a rotor diameter of up to 160 m, and with a tower height of 132 m – resulting in a tip height of 212 m. There are also wind farms being constructed in Australia with rotor diameters exceeding 160 m. These wind turbines are in the range of 5 – 6 MW.
R40s believes that wind farms constructed in NZ over the next 10 years will typically have turbines in the 4-5 MW range and have tip heights between 160 – 200 m. Beyond that (i.e. 2030 and beyond) turbines are likely to be in the 4-6 MW range with tip heights 180 – 250 m. It is difficult to envisage onshore turbines in NZ exceeding these dimensions and outputs between now and 2060. Not only are there difficulties in transporting turbine components of these sizes (although at least one turbine manufacturer has developed two piece blades to mitigate the transportation issue), but the NZ landscape does not have the scale that other countries do (e.g. Australia) to be able to accommodate such large structures – as such, there is likely to be a limit of wind turbine size in NZ.
As such, R40s believes a maximum output of 6 MW and a maximum tip height of 250 m should be considered an upper limit for the foreseeable future however there may be particular cases or sites where this is exceeded. Note that this doesn’t preclude smaller wind turbines being developed on some sites – and this will depend on the characteristics of the wind resource of the site and the consenting environment.
The anticipated limit in size of turbine for onshore wind turbines described above does not apply to offshore wind farms however, where the current expectation is that new offshore wind turbines will have rotor diameters exceeding 200 m and outputs exceeding 13 MW.
4.6. Feasibility of joint wind/solar in NZ Joint wind/solar developments are gaining a lot of attention overseas, particularly in Australia. The Australian context is well-suited to these combined concepts – not only is the land that is occupied by wind farms typically of lesser value than the case for NZ wind farms, but there is typically higher solar insolation in Australia, meaning that the $/MWh are lower in Australia for solar projects than they are in NZ.
There is valid logic to the concept of joint wind/solar projects – the infrastructure (roads, electrical reticulation and grid connection) that a wind farm requires could also be used to accommodate a solar development. This is certainly true if a solar development is considered prior to a wind farm being constructed – so that there is available capacity in the electrical infrastructure to accommodate the additional generation. But in regards to the NZ context, it is worth noting that for the majority of NZ’s existing wind farms, it is unlikely that the landowner would have agreed to large areas of land being occupied by solar panels and rendering the land essentially unusable for many New Zealand farming activities. It is unlikely this view will change for the majority of the other wind farms to be developed in NZ
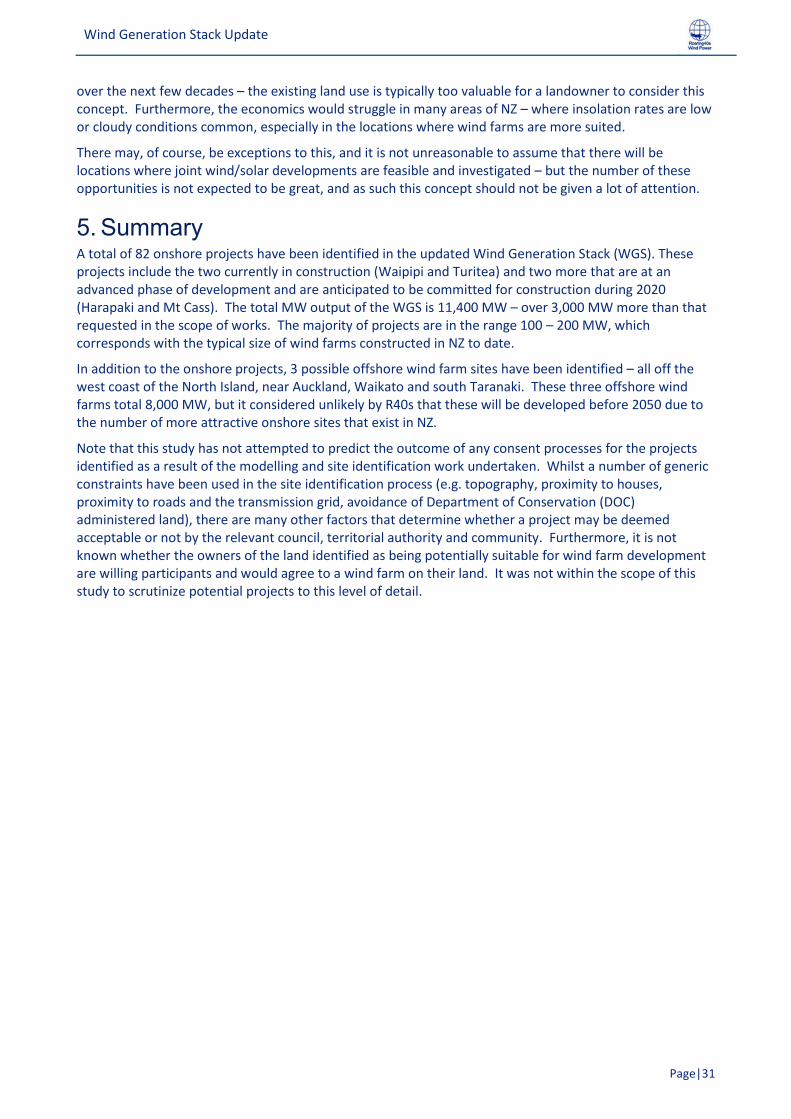
Wind Generation Stack Update
Page|31
over the next few decades – the existing land use is typically too valuable for a landowner to consider this concept. Furthermore, the economics would struggle in many areas of NZ – where insolation rates are low or cloudy conditions common, especially in the locations where wind farms are more suited.
There may, of course, be exceptions to this, and it is not unreasonable to assume that there will be locations where joint wind/solar developments are feasible and investigated – but the number of these opportunities is not expected to be great, and as such this concept should not be given a lot of attention.
5. Summary A total of 82 onshore projects have been identified in the updated Wind Generation Stack (WGS). These projects include the two currently in construction (Waipipi and Turitea) and two more that are at an advanced phase of development and are anticipated to be committed for construction during 2020 (Harapaki and Mt Cass). The total MW output of the WGS is 11,400 MW – over 3,000 MW more than that requested in the scope of works. The majority of projects are in the range 100 – 200 MW, which corresponds with the typical size of wind farms constructed in NZ to date.
In addition to the onshore projects, 3 possible offshore wind farm sites have been identified – all off the west coast of the North Island, near Auckland, Waikato and south Taranaki. These three offshore wind farms total 8,000 MW, but it considered unlikely by R40s that these will be developed before 2050 due to the number of more attractive onshore sites that exist in NZ.
Note that this study has not attempted to predict the outcome of any consent processes for the projects identified as a result of the modelling and site identification work undertaken. Whilst a number of generic constraints have been used in the site identification process (e.g. topography, proximity to houses, proximity to roads and the transmission grid, avoidance of Department of Conservation (DOC) administered land), there are many other factors that determine whether a project may be deemed acceptable or not by the relevant council, territorial authority and community. Furthermore, it is not known whether the owners of the land identified as being potentially suitable for wind farm development are willing participants and would agree to a wind farm on their land. It was not within the scope of this study to scrutinize potential projects to this level of detail.

Wind Generation Stack Update
Page|32
6. About the authors Roaring40s Wind Power Ltd (R40s) was formed in 2018 to provide consultancy services to organisations wanting to identify, investigate and develop wind power projects in New Zealand. Our experience includes both small scale and grid connected projects and covers the entire project development process.
We are a small team - Paul Botha, Graeme Mills and Steve Harding - however we have a significant amount of experience in the wind industry and our skills are complementary:
• Paul, a mechanical engineer with 28 years’ experience in the wind energy industry, has spent a significant amount of time undertaking site identification, wind data analysis, energy modelling, developing wind farm layouts, wind turbine procurement and assessing wind turbine operational performance. He has worked for National Wind Power (UK), DesignPower, Garrad Hassan, Wind Farm Developments Ltd and Meridian Energy Ltd.
• Graeme, a land manager with a background in civil engineering, has over 30 years’ experience in the New Zealand electricity industry, with his focus being primarily on wind farm site identification, land access negotiations and stakeholder engagement. He has previously worked for the Electricity Corporation of New Zealand (ECNZ), Transalta, Meridian Energy Ltd and Kakariki Project Management.
• Steve, a project manager with a background in geology and hydrology, has over 20 years’ experience in the New Zealand and Australian electricity industries, with the bulk of this time spent managing projects from site identification through the resource consent process, stakeholder engagement and detailed design. He has previously worked for the Electricity Corporation of New Zealand (ECNZ), Opus Consultancy, Snowy Hydro, Unison Networks and Meridian Energy Limited.
Together, the R40s team has significant experience in investigating and developing wind farm projects in New Zealand, many of which have since been constructed and are operational today. This is complemented with overseas experience investigating wind farm opportunities in Australia, the Pacific Islands, Antarctica, USA, Europe and Africa.
Our core capabilities include:
• Site identification and landowner negotiations.
• Wind measurements, flow modelling, wind farm design and energy assessments.
• Wind turbine acoustics.
• Strategic planning of wind farm developments, project scoping and feasibility assessments.
• Wind turbine selection construction management and wind farm performance assessment.
• Consent application strategy, preparation and management of consent hearings.
• Stakeholder engagement.
• Management of detailed design studies and project economic analysis.
• Transmission line route identification and land access easement acquisition.
Wind Generation Stack Update
Page|33
7. References Connell Wagner (2008), Transmission to enable renewables; Economic wind resource study, Electricity Commission, New Zealand.
ICCC (2019), Accelerated electrification: Evidence, analysis and recommendations, Interim Climate Change Committee.
IEA (2019), Offshore Wind Outlook 2019: World Energy Outlook Special Report, International Energy Agency.
IRENA (2019a), Renewable Power Generation Costs in 2018, International Renewable Energy Agency, Abu Dhabi.
IRENA (2019b), Future of wind: Deployment, investment, technology, grid integration and socio-economic aspects (A Global Energy Transformation paper), International Renewable Energy Agency, Abu Dhabi.
Lazard (2019), Levelized Cost of Energy, Version 13.0. https://www.lazard.com/perspective/lcoe2019.
Lazard (2019), Levelized Cost of Storage, Version 5.0. https://www.lazard.com/perspective/lcoe2019.
Meridian Energy Limited (November 2018) – Investor Roadshow Presentation. https://www.meridianenergy.co.nz/assets/Investors/12350c98b5/roadshow-presentation-with-NZX-cover.pdf.
Ministry of Business, Innovation and Employment (2019), Electricity demand and generation scenarios: Scenario and results summary, Ministry of Business, Innovation and Employment.
New Zealand Productivity Commission (August 2018). Low-emissions economy – Final Report.
Transpower (2018), Te Mauri Hiko - Energy Futures (White Paper), Transpower, New Zealand.

Appendix A – Relevant maps
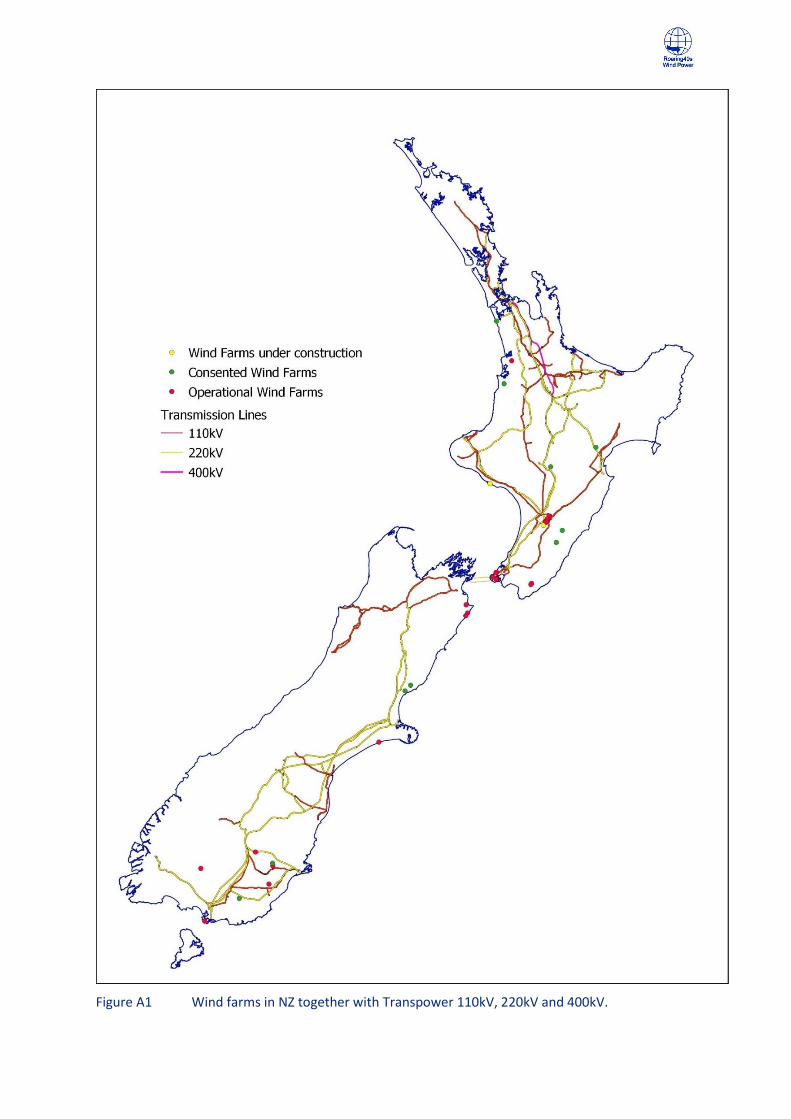
Figure A1 Wind farms in NZ together with Transpower 110kV, 220kV and 400kV.
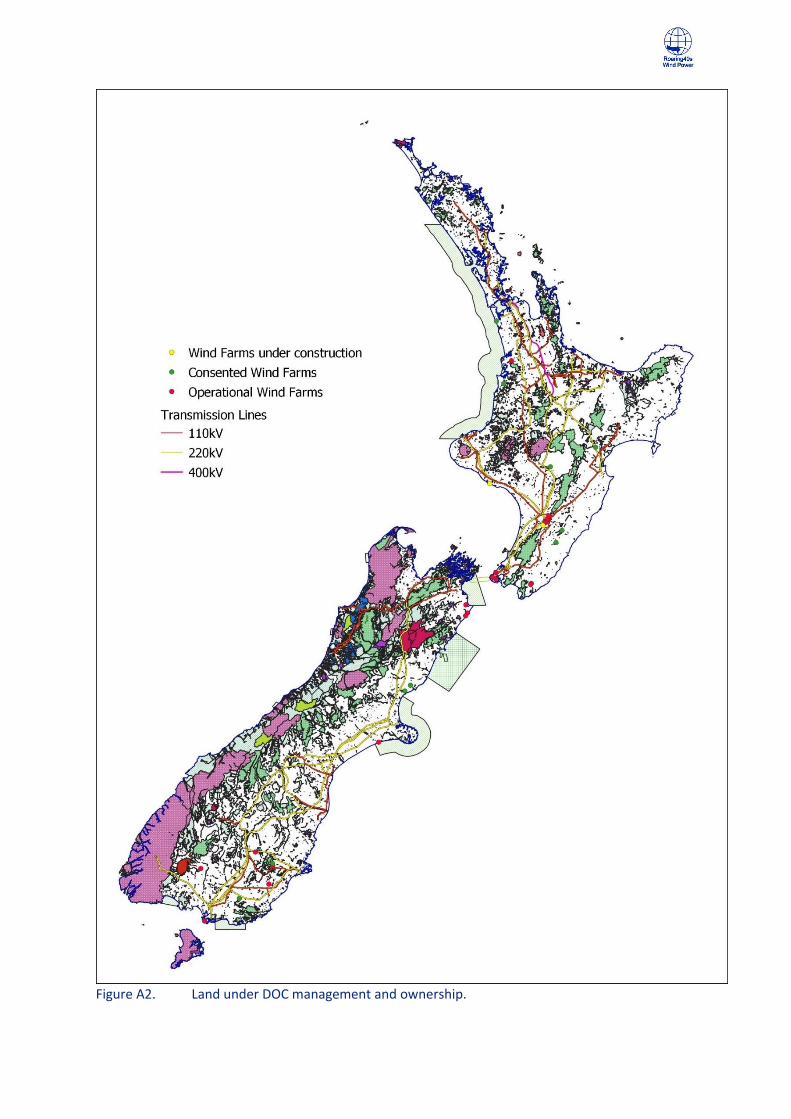
Figure A2. Land under DOC management and ownership.

Figure A3. Wind speeds over NZ at 120 m above ground level.
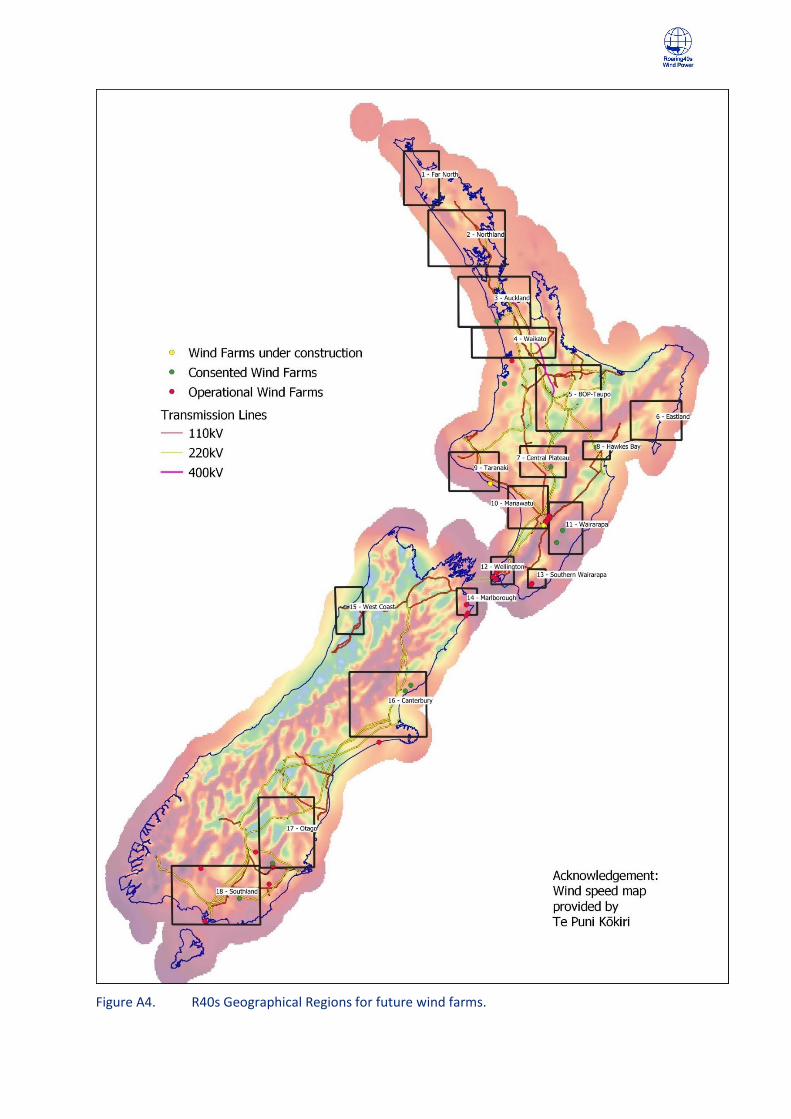
Figure A4. R40s Geographical Regions for future wind farms.
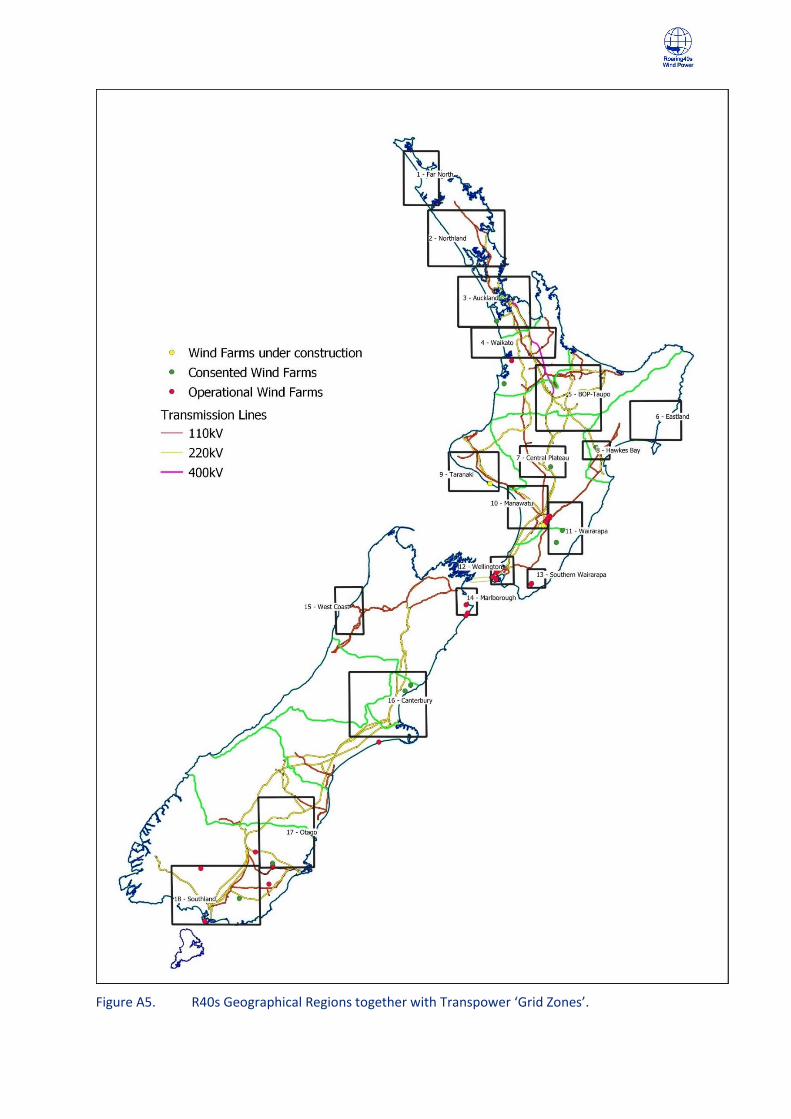
Figure A5. R40s Geographical Regions together with Transpower ‘Grid Zones’.
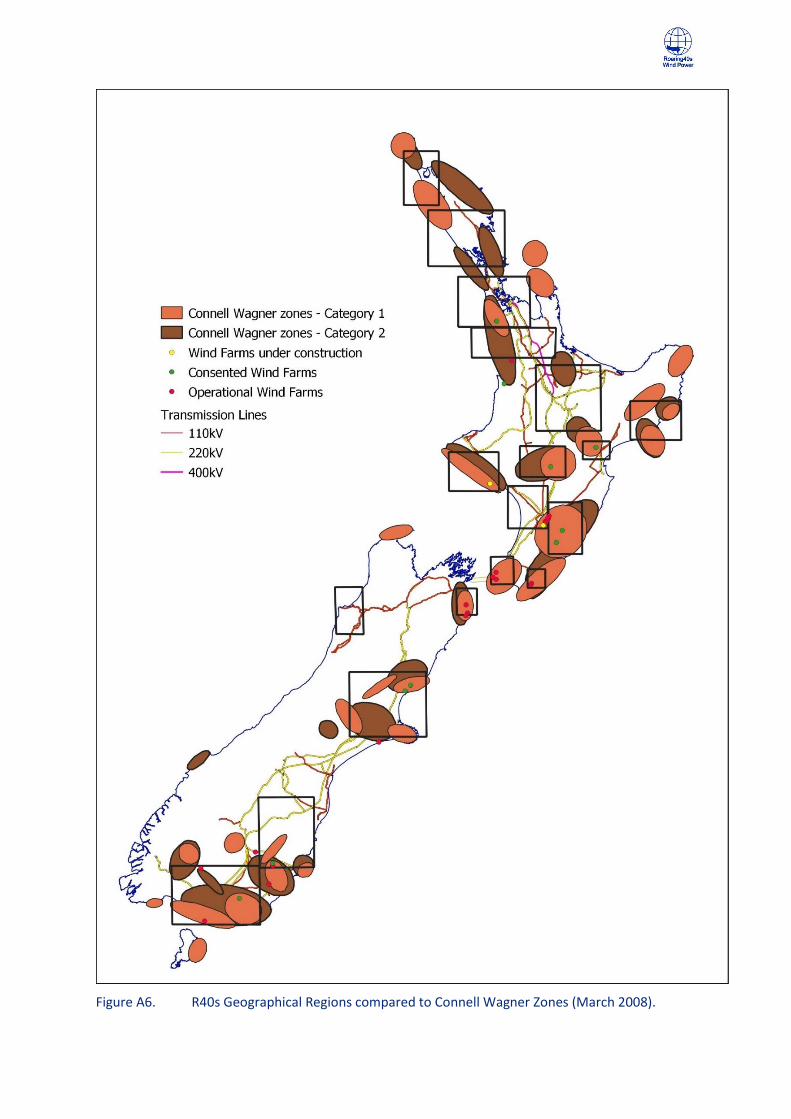
Figure A6. R40s Geographical Regions compared to Connell Wagner Zones (March 2008).
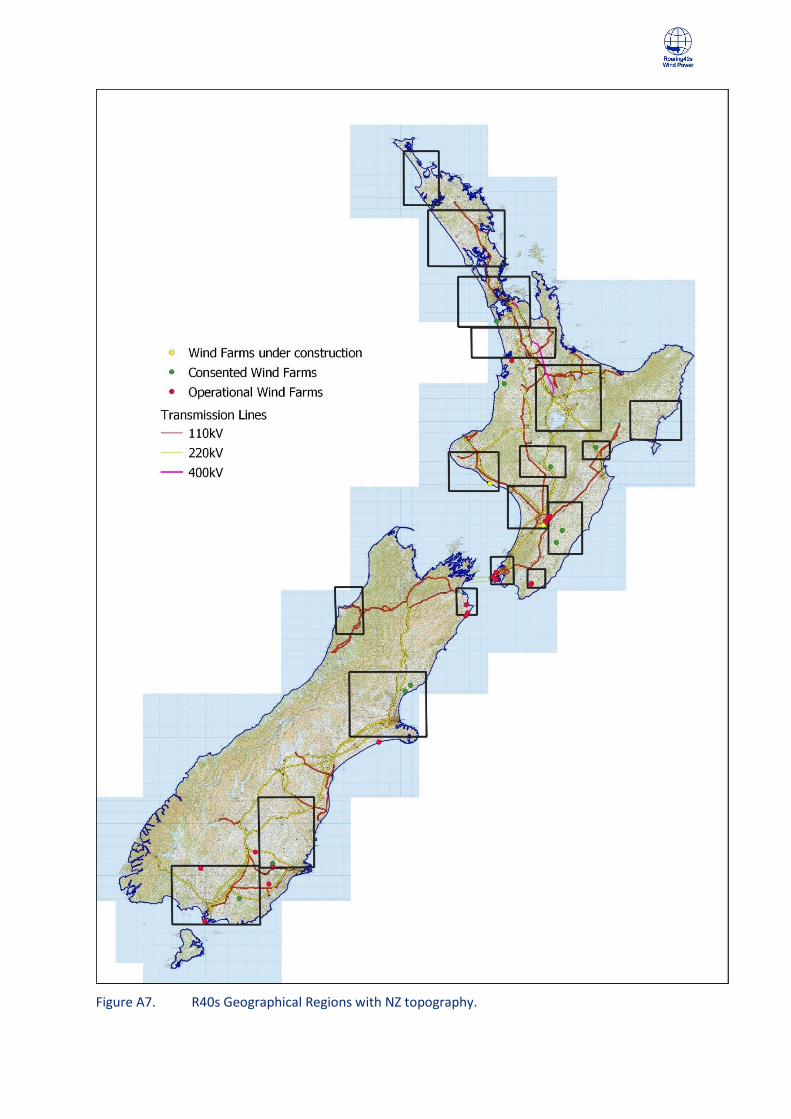
Figure A7. R40s Geographical Regions with NZ topography.
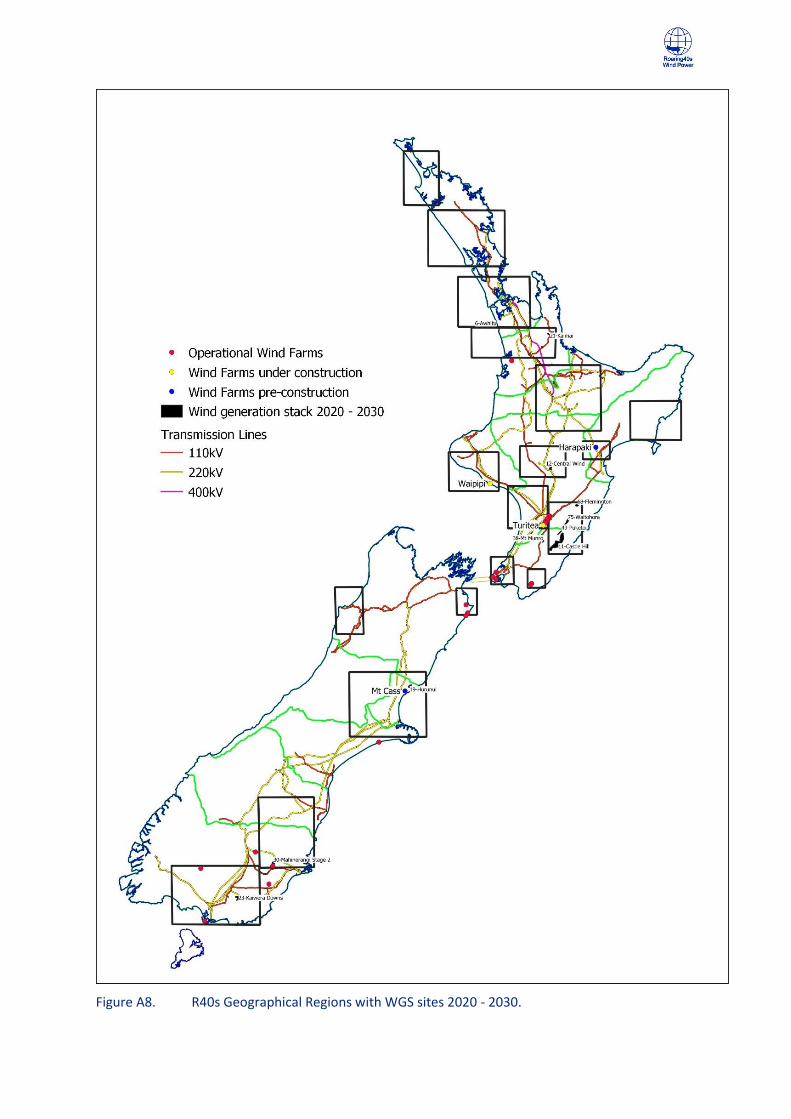
Figure A8. R40s Geographical Regions with WGS sites 2020 - 2030.

Figure A9. Possible offshore wind farm areas
Appendix B – Regional Wind Profiles
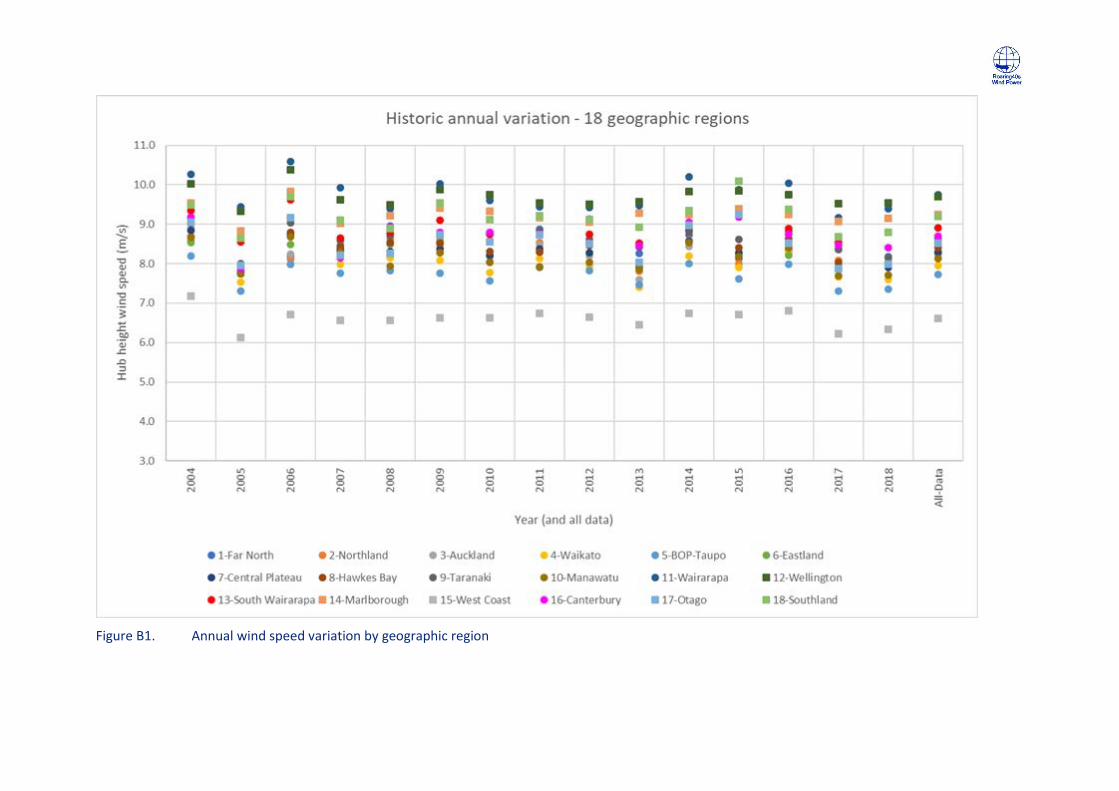
Figure B1. Annual wind speed variation by geographic region
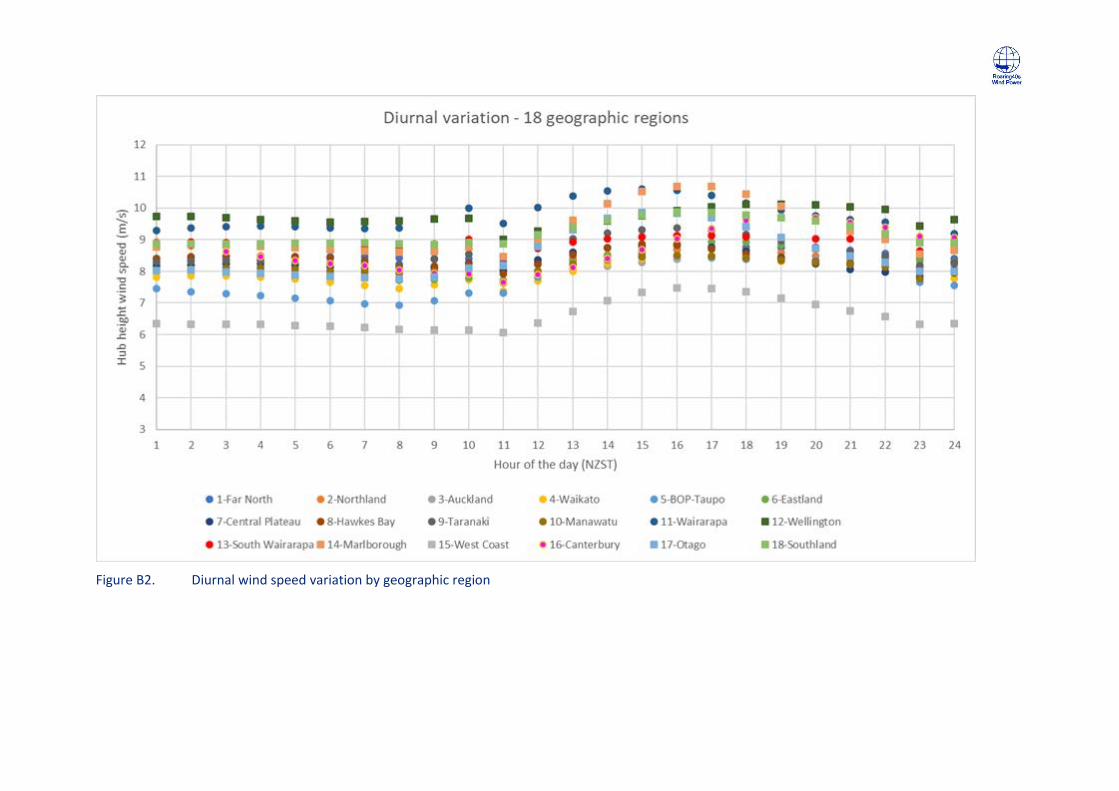
Figure B2. Diurnal wind speed variation by geographic region
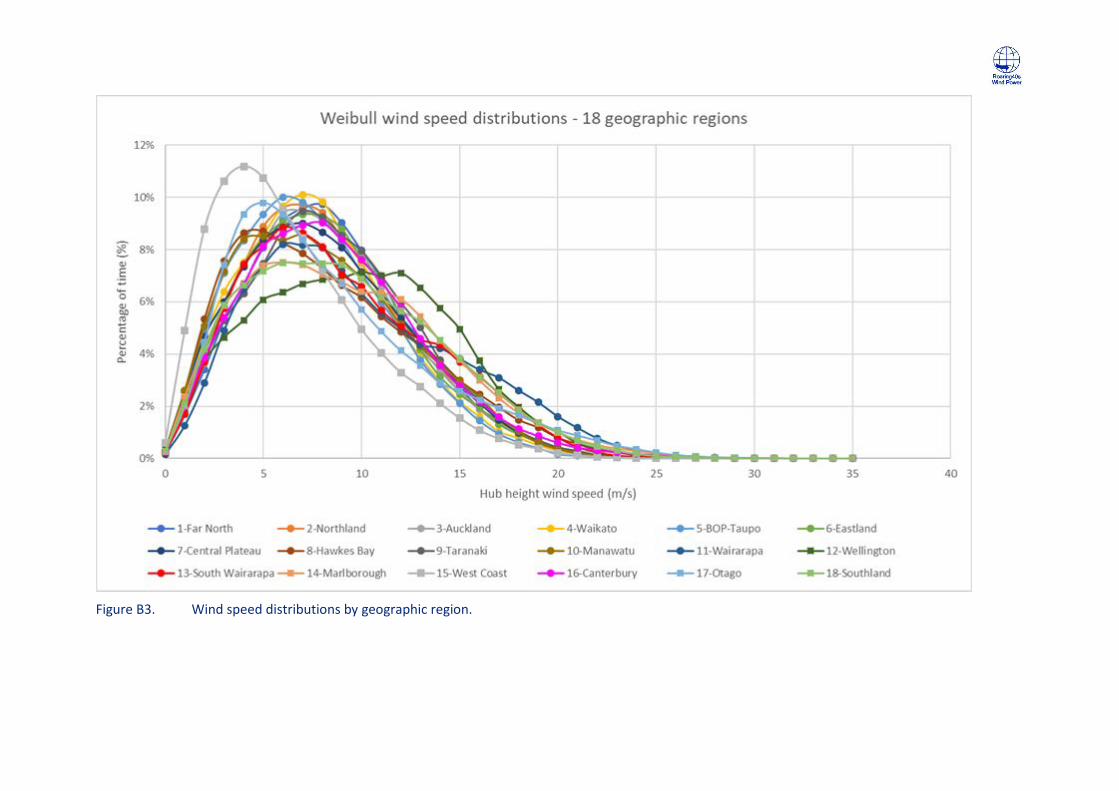
Figure B3. Wind speed distributions by geographic region.