Embed Size (px)
Citation preview

DATE
8 May 2017 AUTHOR
Veiligheid & Milieu VERSION
1.0 STATUS
Definitive
Annual environmental report 2016
Report of the environmental results of Wageningen University & Research

Annual Environmental Report 2016
Page 2 of 44
Contents
1 Introduction 3
2 Environmental policy and environmental objectives of WUR 4
3 Environmental policy areas 6 3.1 Energy 6 3.2 Waste 8 3.3 Water and waste water 9 3.4 Soil 10 3.5 Noise 10 3.6 Air 10 3.7 Flora and fauna 10 3.8 Biosafety 11 3.9 External safety 12 3.10 Asbestos 12 3.11 Transport and traffic 13
4 Permits 15 4.1 Permit regulations 15 4.2 Changes to permits 16 4.3 Environmental audits 18
5 Complaints and incidents 19
6 Sustainability 21 6.1 CSR Agenda 21 6.2 Procurement 21 6.3 Catering 22 6.4 Green Office Wageningen 22 6.5 Carbon footprint and CO2 compensation footprint 23 6.6 Overview of WUR overall sustainability figures 28
7 Organisation 30
Appendix 1. Glossary of terms 32
Appendix 2. Waste figures Wageningen University & Research (including third parties) 33
Appendix 3. Energy consumption WUR in 2005 and 2008-2016 41
Appendix 4. Water/waste water consumption WUR in 2005-2016 43

Annual Environmental Report 2016
Page 3 of 44
1 Introduction
Each year, Wageningen University & Research (WUR) issues an annual environmental report. With this report, WUR provides a picture of its activities relating to the environment and complies with the regulations set out in the various environmental permits. WUR has buildings at various locations in the Netherlands. Environmental permits are required for the activities conducted by WUR at these locations. The permits are clustered by location/complex as far as possible. The large environmental permits (at complex level) include regulations with which WUR's annual environmental report must comply. These have been formulated as follows for the Wageningen Campus complex permit: The permit holder must issue an environmental report annually (by 1 May at the latest) for the cognisance of the competent authority. The environmental report must cover the following subjects at a minimum: energy consumption and improvements to energy efficiency, waste products (disposal and extent of reuse), waste water, air, water consumption, soil protection, transport, sustainability and noise. In regards to the topics mentioned, the annual environmental report must include information on: • The environmental impact caused by the institution (WUR) over the previous calendar year. • The environmental measures, studies and activities performed in the previous calendar year aimed at further
reducing the environmental impact caused by the institution, as well as any changes with respect to the measures, studies and activities originally planned (possible changes with respect to the annual environmental plan).
• Any newly formulated or other environmental policy intentions not falling under one of those plans in the year under review and in the following year under review.
• Incidents, significant disruptions and/or other unusual occurrences and complaints and how they have been dealt with in the year under review.
The annual environmental report discusses the points formulated in WUR’s 2016-2018 multi-year environmental plan in more detail. This plan sets out which environment-related subjects WUR will be focusing on over the coming years. As well as information about WUR at a corporate level, this annual environmental report contains relevant supplementary information per organisational component. This supplementary information is also included in the various health & safety and environmental reports by the organisational components of WUR. Structure of this document Chapter 2 sets out WUR's policy and the concomitant goals for 2016. Chapter 3 discusses the results achieved in 2016 in the environmental policy areas. Permit regulations and changes to these, as well as audits carried out, are explained in chapter 4. Chapter 5 presents the incidents and complaints which occurred in 2016. Chapter 6 sets out the results of the sustainability policy of WUR. And finally, chapter 7 explains the organisation of WUR's Quality, Health & Safety and Environment column.

Annual Environmental Report 2016
Page 4 of 44
2 Environmental policy and environmental objectives of WUR The environmental policy of WUR is focused on:
1. Complying with or exceeding the current legislation and regulations. 2. The formulated sustainability ambition.
In addition to the statutory framework, WUR has formulated a sustainability ambition. WUR has chosen to be a ‘pioneer’ in terms of its operational management. This means that WUR takes an integrated approach to sustainability in its operational management and communicates this to the outside world, and that sustainability is an integral part of decision-making. This ambition fits in with WUR's mission regarding education, research and operational management. Logically, the environment is an important part of this ambition. The environmental policy leads to the following environmental objectives for WUR:
1. Complying with the regulations for the environmental permits. 2. Implementing the WUR 2015-2018 strategic plan.
1. Complying with the regulations for the environmental permits The environmental permits for WUR are issued by the competent authorities (municipalities) per complex. The following environmental permits (permits relating to the Dutch Environmental Management Act) have been issued for WUR:
Wageningen Campus De Dreijen Wageningen WUR complex Lelystad WBVR Houtribweg Lelystad
The remaining environmental permits are clustered under: Other Wageningen Other locations
WUR consists of various sciences groups and components (see figure 1).
Figure 1. Organigram WUR

Annual Environmental Report 2016
Page 5 of 44
The various organisational components are distributed across 26 different locations, and clustered in complexes for which environmental permits have been issued (see Table 1). Table 1. Overview of the organisational components falling under the various (and complex) environmental permits as of 01
January 2016 Locations Wageningen
Campus De Dreijen Wageningen
WUR complex Lelystad
WBVR Houtribweg Lelystad
Other Wageningen
Other locations
Agrotechnology & Food Sciences Group (AFSG)
X X
Animal Sciences Group (ASG)
X X X X1
Environmental Sciences Group (ESG)
X X2
Energy & Exploitation Lelystad (E&EL)3
X
Plant Sciences Group (PSG)
X X X1
Social Sciences Group (SSG)
X4 X5
Wageningen Marine Research (WMR)
X6
RIKILT X Facilities and Services (FB)
X X X X7 X8
Corporate Staff+ (CS+)9
X X10 X11
1. Test facilities 2. Sinderhoeve (Renkum) 3. E&EL (Energy & Exploitation Lelystad) has been a separate organisational component of WUR since 2013. 4. De Leeuwenborch 5. WECR The Hague and other locations 6. IJmuiden, Yerseke, Den Helder 7. De Bongerd Sports Centre, Belmonte Botanical Garden 8. Schoutenhoef (Bennekom) 9. The Corporate Staff (CS), Wageningen International (WI) and Wageningen Academy (WA) together make up CS+. 10. Main Auditorium, Achter de Aula, student accommodation in Wageningen (Haarweg and Stadsbrink) 11. Bennekom (Beringhem)
2. Implementing the WUR 2015-2018 strategic plan Sustainability is an important pillar within the primary process of research and education. This is expressed in the mission, 'To explore the potential of nature to improve the quality of life,' and in the ambition to take a leading role in the area of sustainable operational management. In the 2015-2018 Strategic Plan risks and opportunities have been formulated in regards to sustainability and Corporate Social Responsibility (CSR). WUR is developing a clear and recognisable CSR strategy. The core of this strategy consists of making decisions in such a way that scientific, social and economic interests balance each other out. We make integral considerations for everything that we do, whereby our responsibility reaches further than WUR's own activities, for example through sustainable purchasing. The basic principle for sustainable operational management is: achieving a balance in the current social, environmental and economic needs without endangering future needs. Choosing the ambition of 'pioneering' means that WUR acts on and promotes sustainability in its operational management in an integrated way. Sustainability is also an inherent aspect of our decision-making process, as is the application of proven technology. The high scores for official benchmarks such as SustainaBul, GreenMetric and Transparency Benchmark illustrate how successful WUR is in increasing the sustainability of its operational management. Sustainability activities will be discussed in chapter 6. An overview of key figures, goals formulated and results for 2016 can be found in paragraph 6.3.

Annual Environmental Report 2016
Page 6 of 44
3 Environmental policy areas The regular work activities falling under the environmental policy areas were carried out in 2016. These policy areas are: energy, waste, water and waste water, noise, air, flora and fauna (biodiversity), biosafety, external safety, substances hazardous to the environment, transport and sustainable building. The paragraphs below present the results achieved in 2016 for the proposed actions and targets from the 2016-2018 multi-year environmental plan as well as any special details. 3.1 Energy WUR has committed itself to the third Multi-Year Agreement for Energy (MJA-3). The most important obligation arising from this Agreement is to improve energy efficiency by 30% in the period 2005-2020. This improvement of 2% per year can be achieved by reducing energy use, generating sustainable energy and/or purchasing sustainable energy generated elsewhere. WUR will comply with the commitments which follow from the MJA-3, leading to the following results:
The energy management implementation programme has been completed and the quality control has been embedded in the procedure.
The measures from the 2013-2016 energy efficiency plan are being carried out, including the sustainable energy supply project for Campus Noord.
The 2017-2020 energy efficiency plan was laid down in 2016 and will be implemented in the coming period. The energy incentive has been rolled out. In order to give the organisational components insight into their
energy consumption and further stimulate energy saving, they will be made responsible for their own budgets. Reference years have been established for PSG (2011), ASG (2013), ESG (2013), SSG (2014) and AFSG (2017).
Energy consumption The energy use in 2016 for WUR's buildings and installations is listed in Table 2, below, and in appendix 3. Table 2. WUR energy consumption and energy performance in the reference year 2005 and in 2013-2016
Year 2016 2015 2014 2013 2005 Electricity (kWh) 54,930,781 55,660,591 57,129,458 59,190,720 59,581,768 Natural gas (Nm3) 6,302,302 6,503,170 6,273,363 7,985,127 11,031,812 Primary energy (GJ) 693,845 706,771 712,717 785,446 886,033 CO2 (tonnes) 11,290 11,650 12,095 15,192 53,598 Energy performance
% 2016 as compared to 2015
% 2016 as compared to 2005
% corrected 2016 as compared to 2015
Electricity (kWh) -1.3% -8% -1.0% Natural gas (Nm3) -3.1% -43% -5.5% Primary energy (GJ) -1.8% -22% -2.3% CO2 (tonnes) -3.1% -79% -5.5%
Usage of electricity, natural gas, heat, cooling and water is measured at all relevant buildings and installations and registered in Erbis, the central energy registration, management and information system. Erbis is a professional system in use at most Dutch universities. For the connections belonging to major users (approximately 95% of total use) of electricity, natural gas and water, the certified monitoring companies deliver validated measurement data on a monthly basis. For the smaller connections, the meter readings are taken on a regular basis, usually monthly and usually manually. For keeping track internally of use by individual buildings and even individual users, private interim meters are used. In a number of extraordinary cases where it is not possible to install a meter, energy use is attributed on the basis of the distribution from the location account. Use by third parties and student housing has been deducted from the total use. In order to make a better comparison between different years, we correct the calculations for climate influences. To make the corrections for cooling and heating, we use the official figures which are released annually by the Netherlands Enterprise Agency (RVO.nl).

Annual Environmental Report 2016
Page 7 of 44
Energy efficiency The WUR 2030 Energy Vision was approved in 2014. The starting point is reliable, affordable energy provision in which sustainability takes a central role. Increased sustainability is to be achieved through the following methods, listed in order of priority:
1. reducing energy use 2. generating sustainable energy 3. compensating CO2 emissions
1. Energy savings Despite a rise in student numbers, WUR has used less energy. We have achieved energy savings by improving our use of existing buildings, effectively using heat pumps, using more heat-recovery technology and using LED lamps. We also used the ‘building management system’ to fine-tune air-conditioning systems. As the thermal heat storage system began to serve three more buildings in 2015, the existing cooling machines used considerably less energy in 2016. We reduced energy use by 2.3% in 2015 as compared to 2014. This includes the correction for the influence of climate on cooling and heating. Without correction, energy use was reduced by 1.8%. This means that the MJA-3 target was reached in 2016 as well. We achieved this reduction in spite of the continued increase in student numbers. The savings were achieved in part by improving the use of existing buildings, optimal use of heat pumps, application of heat recovery and use of LED lighting. Climate control was optimised further via the building management system. The expansion of the thermal storage system in 2015, which now cools of three more buildings, resulted in a significantly decrease in the energy consumption of existing refrigeration units. IT energy consumption WUR also specifically monitors its energy use for IT. In 2016 the data centres used a total of 1.57 million kWh. In 2015 this number was 1.55 million kWh. In addition, the energy balances and monitoring data reveal that the buildings used approximately 3.75 million kWh for IT. In 2016 WUR used a total of approximately 5.3 million kWh of electricity for IT. This works out to 332 kWh per student or employee and 11 kWh per square metre. The electricity used by IT makes up 7% of WUR total electricity consumption. Energy savings in organisational components The energy incentive encouraged organisational components to implement energy-saving measures at their location. The projects at RIKILT and PSG provide some examples of this: Alongside introducing Polaris III (a 30-cubic-metre, low-energy, -80°C storage unit across four floors), PSG
installed LED light bulbs in Radix West and two climate cells, as well as window switches on the fume cupboards in Radix (middle).
RIKILT optimised the energy use of the cooling and freezer unit by replacing the old freezer units with low-energy freezers. It also researched whether it could install a central cooling and freezer storage unit and tested out LED lamps in the corridors.
2. Generating sustainable energy In 2016 WUR generated sustainable energy on a large scale. The wind turbines in Lelystad generated more than 58 million kWh in 2016. This is in part due to less favourable wind conditions. In addition, sustainable energy was also provided by combined heat and power generators using biofuel (bio-CHP) at several locations, the Wageningen Campus thermal storage system and solar panels (see Table 3). When WUR's total energy consumption is corrected for the influence of climate, 87% of the energy consumed was generated using sustainable methods. 3. Compensating CO2 emissions The reduction in energy and the purchase of 100% green wind energy (registered with Certiq) reduced CO2 emissions from electricity and natural gas consumption by 79% in comparison with the baseline year 2005.

Annual Environmental Report 2016
Page 8 of 44
Table 3. Sustainable energy generated by WUR in 2016 (in primary GJ) Source 2016 Type of energy Lelystad wind turbines1 526,714 GJ
Bio-CHPs2 13,327 GJ
Wageningen Campus thermal storage 62,602 GJ
Solar panels3 1,005 GJ
Total 603,556 GJ
Energy consumption 693,845 GJ
Energy consumption corrected for climate influences 690,387 GJ Sustainable generation as a percentage of total energy consumption
87%
1 Refers to the three wind farms in Lelystad owned by WUR. 2 ACRRES Lelystad and De Marke Hengelo. The installation at Dairy Campus Goutum and VIC Sterksel is being managed by an external party. 3 ACRRES Lelystad, Imares Yerseke (2014), KTC de Marke Hengelo, Sinderhoeve Renkum (2015) and Sports Centre De Bongerd (2016).
3.2 Waste WUR has three main waste flows: industrial waste, paper waste and hazardous waste. The waste policy relating to these waste flows was established in 2013. This annual environmental report includes the waste figures of the locations, buildings and activities (including from third parties) which have been granted permits, unless specified otherwise. Table 4. Total amount of waste produced by WUR in 2016, 2015 and 2014 (in kg)
Source 2016 2015 2014 Industrial waste 1,548,002 1,291,922 1,361,400
Paper waste 296,788 295,184 329,447
Hazardous waste 352,125 309,964 305,932
Total WUR (excluding third parties)
2,196,915 1,897,070 1,996,779
Waste produced by each employee 447 379 391
Waste produced by each student 195 183 209 Waste produced by each employee and student
135 123 136
Please see appendices 2i and 2j for a breakdown of each organisational component. Annex 2d shows the amount of waste produced by each municipality, while 2e shows the waste figures for the complex licences of Wageningen Campus, WUR complex Lelystad and De Dreijen. The increase in the amount of industrial waste in 2016 (+ 256 tonnes) may be due to a large increase in the amount of residual waste (+ 189 tonnes). This was a result of removal activities in divested buildings at De Dreijen (Wageningen) and Edelhertweg 15 (Lelystad). Construction activities at Sterksel, Nexus and other locations increased the amount of building-related waste (+ 34 tonnes). The amount of hazardous waste increased by 42 tonnes, in particular because of a strong increase in the amount of animal waste (+ 35 tonnes) resulting from the variation in research activities. The increase in the amount of waste on Wageningen Campus is due to the commissioning of the Helix building and the more intense use of teaching and other facilities (as a result of the increase in student numbers). Hazardous waste By hazardous waste, we mean all waste that is hazardous to humans, animals and the environment, as defined in article 1.1, paragraph 1 of the Dutch Environmental Management Act. The hazardous waste must not find its way into the environment but must be handled in an appropriate, sustainable manner. Because the hazardous waste flow is varied, there are many different types of end processors. Examples are the recovery of metals (from fixatives, batteries, lamps, electronics, etc.); recycling of glass; reuse of oil; and decontamination, neutralisation and dehydration of watery mixtures containing acids or bases.
Annual Environmental Report 2016
Page 9 of 44
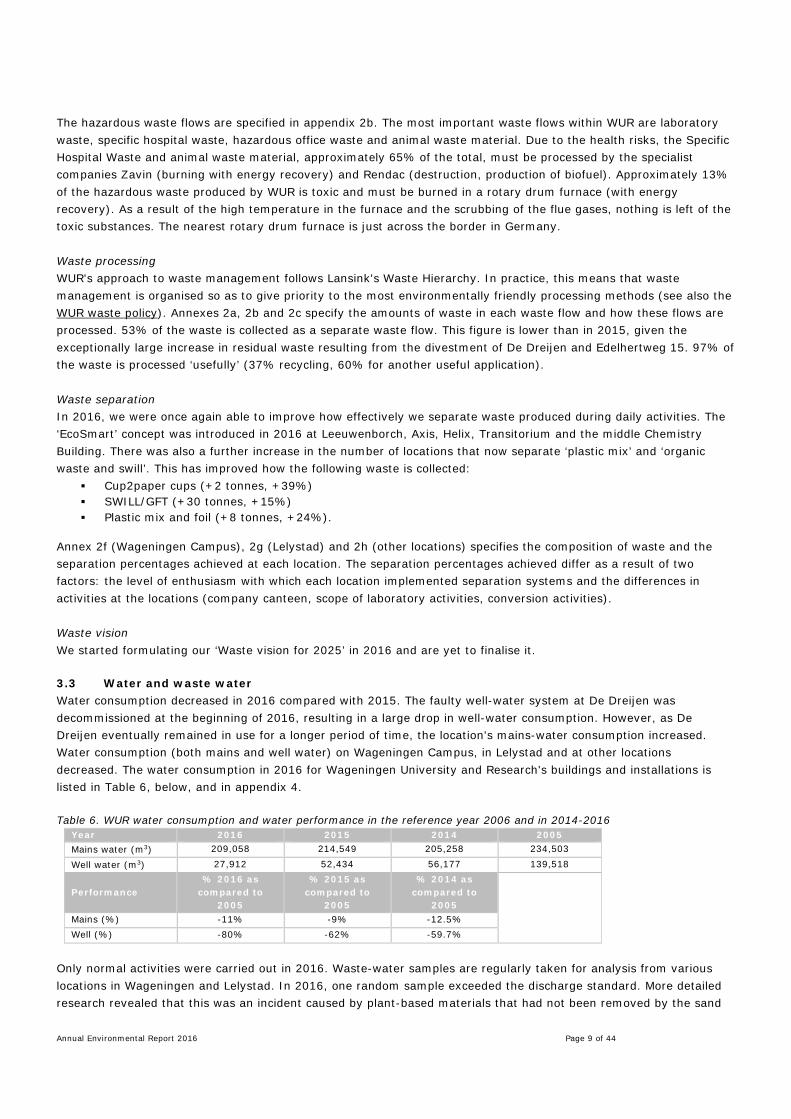
The hazardous waste flows are specified in appendix 2b. The most important waste flows within WUR are laboratory waste, specific hospital waste, hazardous office waste and animal waste material. Due to the health risks, the Specific Hospital Waste and animal waste material, approximately 65% of the total, must be processed by the specialist companies Zavin (burning with energy recovery) and Rendac (destruction, production of biofuel). Approximately 13% of the hazardous waste produced by WUR is toxic and must be burned in a rotary drum furnace (with energy recovery). As a result of the high temperature in the furnace and the scrubbing of the flue gases, nothing is left of the toxic substances. The nearest rotary drum furnace is just across the border in Germany. Waste processing WUR's approach to waste management follows Lansink's Waste Hierarchy. In practice, this means that waste management is organised so as to give priority to the most environmentally friendly processing methods (see also the WUR waste policy). Annexes 2a, 2b and 2c specify the amounts of waste in each waste flow and how these flows are processed. 53% of the waste is collected as a separate waste flow. This figure is lower than in 2015, given the exceptionally large increase in residual waste resulting from the divestment of De Dreijen and Edelhertweg 15. 97% of the waste is processed ‘usefully’ (37% recycling, 60% for another useful application). Waste separation In 2016, we were once again able to improve how effectively we separate waste produced during daily activities. The ‘EcoSmart’ concept was introduced in 2016 at Leeuwenborch, Axis, Helix, Transitorium and the middle Chemistry Building. There was also a further increase in the number of locations that now separate ‘plastic mix’ and ‘organic waste and swill’. This has improved how the following waste is collected:
Cup2paper cups (+2 tonnes, +39%) SWILL/GFT (+30 tonnes, +15%) Plastic mix and foil (+8 tonnes, +24%).
Annex 2f (Wageningen Campus), 2g (Lelystad) and 2h (other locations) specifies the composition of waste and the separation percentages achieved at each location. The separation percentages achieved differ as a result of two factors: the level of enthusiasm with which each location implemented separation systems and the differences in activities at the locations (company canteen, scope of laboratory activities, conversion activities). Waste vision We started formulating our ‘Waste vision for 2025’ in 2016 and are yet to finalise it. 3.3 Water and waste water Water consumption decreased in 2016 compared with 2015. The faulty well-water system at De Dreijen was decommissioned at the beginning of 2016, resulting in a large drop in well-water consumption. However, as De Dreijen eventually remained in use for a longer period of time, the location's mains-water consumption increased. Water consumption (both mains and well water) on Wageningen Campus, in Lelystad and at other locations decreased. The water consumption in 2016 for Wageningen University and Research's buildings and installations is listed in Table 6, below, and in appendix 4. Table 6. WUR water consumption and water performance in the reference year 2006 and in 2014-2016
Year 2016 2015 2014 2005 Mains water (m3) 209,058 214,549 205,258 234,503
Well water (m3) 27,912 52,434 56,177 139,518
Performance % 2016 as
compared to 2005
% 2015 as compared to
2005
% 2014 as compared to
2005
Mains (%) -11% -9% -12.5% Well (%) -80% -62% -59.7%
Only normal activities were carried out in 2016. Waste-water samples are regularly taken for analysis from various locations in Wageningen and Lelystad. In 2016, one random sample exceeded the discharge standard. More detailed research revealed that this was an incident caused by plant-based materials that had not been removed by the sand
Annual Environmental Report 2016
Page 10 of 44
filter. Preventive measures were then implemented, and the incident was reported to the Vallei en Veluwe water board. This incident also had no further negative environmental effects. 3.4 Soil No soil research was carried out in 2016. 3.5 Noise In 2014 the municipality of Wageningen drew up a noise vision and the zoning plan Geluidruimteverdeling Wageningen Campus e.o. (noise allowance distribution for Wageningen Campus and environs). This offers local residents the security that noise pollution will not increase above current levels, while also creating flexibility and clarity as regards the distribution of noise allowance for businesses within this area, including Wageningen University & Research. Both documents are used as a framework for the development of the Business Strip at the southern edge of Wageningen Campus between Bornsesteeg and Mansholtlaan. WUR is working on systematically testing the acoustic consequences of current and future changes to operational management (including buildings and activities) on Wageningen Campus and De Dreijen. The acoustics for the following projects were calculated in 2016:
- Demolition of Q5 and new build of Phenomea (Campus) - Completion of Orion (Campus)
Since May 2014, in addition to being evaluated in terms of the permit regulations for noise, projects have been evaluated in terms of the plot value listed in the zoning plan Geluidruimteverdeling Wageningen Campus e.o. The completed noise reports indicate that Wageningen Campus can comply with the relevant noise regulations if it takes certain supplementary measures such as noise screens or measures to address noise sources. The noise measures will be a part of construction projects or activities. 3.6 Air Regular activities are carried out in relation to the Dutch Emission Guidelines for Air (Nederlandse emissierichtlijn Lucht, NeR). 3.7 Flora and fauna In 2013 the flora and fauna policy for Wageningen Campus was established. The fundamental principles were:
Complying with or exceeding current relevant legislation and regulations. Complying with the requirements and wishes of WUR, whereby education and research are the priorities and
the operational management facilitates and is secondary to these functions. Where possible, strengthening biodiversity on Wageningen Campus through education and research.
Maintaining biodiversity by means of a well-considered maintenance approach. We began to reassess our flora and fauna policy in 2016. This reassessment will continue in 2017. Dutch Flora and Fauna Act/Nature Conservation Act In connection with the proposed demolition of various buildings, a flora and fauna quick scan was carried out in 2016. Habitat suitability evaluations were also carried out in the local environment. If it was found that the demolition work causes negative effects and contraventions of the Flora and Fauna Act or the Nature Conservation Act, further study was carried out. On the basis of the scans and evaluations, exemption procedures were implemented and/or mitigating measures were carried out. The following projects were specifically carried out in 2016:
Due to the proposed demolition of four staff residences on the Houtribweg in Lelystad in 2015, flora and fauna quick scans were carried out. This led to carrying out a year-round investigation which will be performed in the course of 2016. This investigation did not reveal any peculiarities.
The proposed demolition of a former laboratory on Runderweg 6 (Lelystad) prompted a quick scan for flora and fauna. This then led to additional research that was carried out in 2017.
The proposed demolition of a farmyard barn on Kielekampsesteeg 1 (Wageningen) prompted a quick scan for flora and fauna. This then led to additional research that started in 2017.

Annual Environmental Report 2016
Page 11 of 44
The construction of the Phenomea building and the demolition of the former Klimaatgebouw on Bornse Weilanden prompted exploratory nature research, which in turn led to follow-up actions.
The proposed expansion of Wageningen Bioveterinary Research (WBVR) on Houtribweg (Lelystad) prompted exploratory nature research, which in turn led to follow-up actions.
The creation of a new car park and tree-felling activities at WBVR (Lelystad) prompted a tree survey and more detailed research, which in turn led to further follow-up actions. To comply with the Dutch Forestry Act (Boswet), we reported the tree-felling activities to the Netherlands Enterprise Agency (‘Rijksdienst voor Ondernemend Nederland,’ RVO).
The proposed demolition of the sundry buildings on Edelhertweg 16 (Lelystad) prompted a year-round nature-value survey in 2015. Due to the introduction of the new Nature Conservation Act (Nieuwe Natuurwet), the application process for a permit was not started in 2016, but in 2017.
Planting new trees due to the obligation to replant. Various trees were planted in 2016.
Felling licences and the obligation to replant Due to renovation, demolition, construction and infrastructure adjustments, a great deal has changed on the WUR grounds. It was necessary to fell trees in many of these circumstances. Various diseased trees and/or trees posing risk to their environment (for example in case of a storm), have also been felled. The table of permit applications (paragraph 4.2, Table 8) details the number of felling permits granted in 2016 on the condition that trees be replanted. Up to 2013, the Wageningen Campus' zoning plan was used as the guide for compensating felled trees. One component of this entailed planting lanes of oak trees to connect with the linear structures of the Binnenveld's cultural landscape. For this reason, 249 oak trees (Quercus robur) were planted along the Droevendaalsteeg, Bornse Weilanden and Bronland. These oak lanes were considered to be compensation for indigenous trees felled up to 2016, to the extent that it was not possible or realistic to replace the same species of tree in the same locations. Up to 2015, this concerned 104 of the 249 trees planted. In 2016, all felled trees were compensated as part of an integrated ‘greening’ plan for the campus. Tree species are selected in consultation with the municipality (if this relates to the bus lane and Helix). In addition, WUR has planted various trees that represent the organisation's fields of work. We have planted 325 trees in total, 293 of which are indigenous to the Netherlands. As 268 trees were felled for the bus lane and Helix, we have achieved an 'overcompensation’ amounting to 57 trees. This figure does not include the 135 apple trees that were planted as part of the ‘Timeline of apple production’ project (‘Tijdlijn van de appelproductie’). Monumental trees In 2016, the municipality carried out a survey of the monumental trees within its borders. This survey indicated fourteen trees on WUR's grounds that are now on the monumental tree register. These are:
Bornsesteeg 48: 4 Quercus robur, 1 Fagus sylv. Pendula, 1 Tilia tomentosa. Duivendaal complex: 1 Platanus acerifolia, 1 Fagus syl. Atropunicea, 2 Acer pseudoplatanus, 1 Aesculus
carnea, 1 Quercus robur, 1 Fraxinus excelsior. Bennekomsesteeg: 1 Quercus robur.
3.8 Biosafety The new Decree and regulations on genetically modified organisms (GMO) (Besluit en Regeling genetisch gemodificeerde organismen) came into effect on 1 March 2015. The permit requirement for ‘contained use’ on levels 1 and II-k has been replaced by notification obligations. This entails that Bureau GGO, the Dutch GMO regulator, will not grant a permit for ‘contained use’; instead, a user must perform a risk assessment and determine which additional rules apply. Bureau GGO grants permits for the other ‘containment levels’, with each level requiring a separate permit. The Human Environment and Transport Inspectorate (IL&T), part of the Ministry of Social Affairs and Employment, carried out an audit of the Plant Sciences Group in May 2016. IL&T issued a warning regarding the absence of a notification or permit on the basis of a 2.8 order (1), the absence of complete and correctly filled-in reports on the risk assessment according to Article 18 of the Regeling ggo (2) and the absence of an adjoining autoclave for the GMO waste from the PKM-III greenhouses (3).
Annual Environmental Report 2016
Page 12 of 44
A second audit was carried out in November 2016. IL&T concluded that the Wageningen University department Plant Sciences and Wageningen Plant Research both implement the Regeling ggo 2013 at a satisfactory level. The warning was then revoked. Several bottlenecks relating to the Regeling ggo have been reported at a national level, in particular on how the regulations can be implemented clearly and efficiently. However, concrete contributions from steering committees and project groups by the Biological Safety Officers (BSO) at WUR and the BSO at other larger permit holders have solved a number of bottlenecks surrounding implementation. These solutions have already been implemented at WUR. We require immense man power to deal with the admin of bringing the ‘old’ licences (Regeling ggo 2003) in line with the Regeling ggo 2013 and carry out new risk assessments (previously done by Bureau GGO). In addition to this, the BSOs have noticed that it takes a lot of time to work according to the new system, to provide advice to researchers who are expanding their GMO activities, and to ensure that rules are enforced internally. At the end of 2016, PSG's management decided to expand its BSO capacity in mid-2017 by 0.5 FTE. As part of the Dutch regulations on animal products (Regeling dierlijke producten), the Netherlands Food and Consumer product Safety Authority granted ‘Animal By-Products authorisation’ to locations that perform activities involving animal by-products. Within WBVR, authorisation was granted to Houtribweg 39, Edelhertweg 15 and Runderweg 4 (Lelystad). Applications have been sent off for Wageningen Livestock Research, Swine Innovation Centre (VIC) Sterksel, and the Dairy Campus in Leeuwarden. An inspector from the Netherlands Food and Consumer Product Safety Authority performed audits as part of the application procedure for an authorisation. In 2016, the Netherlands Food and Consumer Product Safety Authority did not carry out any audits at PSG (Unifarm) and ESG (Nergena) relating to the permits for ‘contained usage’ (1), the import of plant-based materials (2) and the import and use of soil (3). The shortcomings revealed in 2015 were corrected in 2016. The changes in research activities were laid down in two new permits from the Netherlands Food and Consumer Product Safety Authority for PSG and ESG. We also rolled out an extensive information programme for researchers and greenhouse employees. Alongside this, we completed the admin that lays down each person's responsibilities and makes for clearer, shorter procedures and checks in the line and among staff, according to the requirements of the Netherlands Food and Consumer product Safety Authority and based on the ISO 9001 system. We also performed an entry check on organic material from Unifarm, in particular to prevent potato plants from becoming infected with the PSTVd virus. Over 2016, the BSOs primarily focused on giving instructions and following the import and export guidelines. Unifarm commissioned a new autoclave that removes waste material with quarantine status, GMO waste and plant pathogens in the validated manner. 3.9 External safety WUR has requested a complex permit under the Dutch Nuclear Energy Act (Kernenergiewet, Kew) for those organisational components that use sources of radioactivity. The general radiation expert submits an annual report on the implementation of the radiation hygiene policy to the WUR Executive Board and to those Dutch government bodies that are responsible for overseeing radiation safety. Under the Nuclear Energy Act complex permit, inspections were carried out at all locations. This involved checking whether radiation limits are being exceeded and whether permit regulations were being met. 3.10 Asbestos In 2015 a WUR-wide asbestos policy was established, with the following goals:
- Ensuring a safe environment for employees, students and third parties. - Compliance with legislation and regulations. - Assigning tasks and responsibilities when dealing with asbestos within WUR.
An inventory was made of all the buildings that were built before 1994 and whether or not asbestos is present. In 2015 an asbestos management plan was subsequently drawn up for the buildings that do have asbestos present. These asbestos management plans were completed in 2016. For each building that contained a risky asbestos situation, measures were immediately taken and remediation was carried out where necessary.

Annual Environmental Report 2016
Page 13 of 44
In accordance with the Dutch Asbestos Policy (Asbestbeleid), various asbestos-removal procedures were carried out during maintenance, demolition or renovation activities in 2016. Asbestos was removed from:
De Leeuwenborch De Valk Nergena Transitorium Biotechnion (part of it) WMR, IJmuiden Former staff residence at Houtribweg (Lelystad) Sterksel Wageningen Bioveterinary Research (Lelystad) De Eest test farm (Nagele)
3.11 Transport and traffic The high concentration of buildings and activities on Wageningen Campus means that traffic to, through and from Wageningen Campus has increased significantly. Annual measurements of our CO2 footprint have enabled WUR to assess the environmental impact of its transport. Aviation and commutes by car are by far the biggest contributors to the CO2 footprint. The use of public transport for business travel within the Netherlands is encouraged. Employees should use the NS Business Card for this. The basic principle of the policy for international business travel is that public transport is preferable for nearby destinations in Europe. The use of videoconferencing is also encouraged, which not only saves travel time and costs but also reduces CO2 emissions. A total of twelve charging stations for electric cars are located in two car parks on Wageningen Campus. Six additional charging stations will be installed at the RIKILT car park and commissioned at the beginning of 2017. We have also installed charging stations for e-bikes and scooters at bicycle-parking facilities in various buildings. Compared with previous years, we saw an increase in the use of these charging facilities. In 2016, owners of electric cars used the charging stations more than 1,500 times, charging a total of 12,000 kWh of electricity. The charging stations are public and can be used by staff, students and visitors to WUR. The charging stations are shown on the map of Wageningen Campus. We monitor the use of different transport options in order to gain information on our CO2 footprint. Each year, we collect data on commutes, business travel (by car, public transport and by aeroplane) and the use of private, lease and rental vehicles. In addition to this, we had a ‘mobility survey’ carried out by the external consultancy agency DTV Consultants in December 2015. The results from this survey were subject to further scrutiny at the beginning of 2016. The report from the survey indicated 1 that a large number of employees (52%) and students (72%) travel to work or their place of study by bicycle. Although our employees commute less often by car (39%) than the national average, there are still options to ‘travel smart’ or smarter. This applies in particular to employees who live slightly further away from their place of work and now commute by car: 22% of these employees could switch to another mode of transport. We could reap the benefits of promoting e-bikes or conventional bicycles and encouraging people to commute by public transport. WUR also introduced specific measures in 2016 to increase how often people commute by bike and public transport. These measures include: increasing the capacity of on-campus bicycle-parking facilities, including permanent facilities at Gaia/Lumen, Actio
and temporary facilities at Helix and Forum modernising and expanding the cycle paths and footpaths on Wageningen Campus and installing lamps in darker
areas (this could also be achieved by modifying the existing lamps). increasing the number of buses from Ede-Wageningen railway station to Wageningen Campus (in collaboration
with the transport operator and the provincial government).
1 Report from the ‘Mobility survey for Wageningen University & Research,’ DTV Consultants, 16 April 2016.

Annual Environmental Report 2016
Page 14 of 44
WUR is also involved in the development of a bicycle highway on the already very busy route from Ede, Ede-Wageningen railway station and Bennekom, to Wageningen Campus. A final project by a student from Van Hall Larenstein University of Applied Sciences contained a proposal for the ‘Mobility Plan’ for Wageningen Campus, which will be established. Thanks to the mobility survey, the proposal to establish a ‘Mobility Plan’ and the annual measurement of our CO2 footprint, we were able to make headway in 2016 on creating a ‘Mobility Vision’ for WUR as a whole and drawing up mobility plans (for each main location), containing the location-specific measures to encourage even more people to use sustainable transport to travel to WUR buildings. Sustainable construction In 2016, we implemented the following accommodation-related measures and achieved the following results:
commissioning of the new Helix building. This extremely sustainable building has a compact shape and excellent insulation. It also makes use of heat recovery and concrete core activation and is connected to the thermal storage system. In part because of these sustainability measures, the building has a GreenCalc score of 520. This is well above the target score of 215.
completion of the second sports hall at Sports Centre de Bongerd, with 459 solar panels on the roof decommissioning of four wings of the Chemistry Building at De Dreijen creation of a ‘living’ outdoor space by building a market square, amphitheatre and a large plank bridge in the
outdoor areas collaboration with Liander, Parenco, the Province of Gelderland and the municipalities of Wageningen,
Renkum and Ede on research into an ultra-deep geothermal water source feasibility study into expanding the thermal storage installation to serve existing buildings on the north-
eastern campus (‘Noordoostelijke Campus’) and preparations for installing this strengthening nature values by installing a ‘wet nature garden,’ returning a piece of earth dating back more
than 1,000 years to Wageningen Campus and creating ‘The Field’ and a small-scale trial field for experiments with natural agriculture.

Annual Environmental Report 2016
Page 15 of 44
4 Permits
4.1 Permit regulations The applicable regulations set out in the environmental permits apply to the activities carried out by different organisational components. An overview of this can be bound in tables 7a and 7b. Table 7a. Regulations which apply to the different organisational components
Organisational component
Environmental logbook1
Chemical registration2
Energy and water
registration3
Emergency plan4
Maintenance, inspections,
checks5 AFSG X X X X X ASG X X X X X ESG X X X X X E&EL X X X X X PSG X X X X X SSG X X X WMR X X X X RIKILT X X X X X FB X X X X X CS+ X X X X
1. The environmental logbook contains information about maintenance, measurements, tests, inspections and environmental studies. In recording this information,
the existing information sources are used as much as possible, such as GROS (Gevaarlijke stoffen Registratie- en Opsporingssysteem, 'hazardous substances registration and investigation system'), Erbis and Planon. As WMR is not included in the complex permit, it is not legally obliged to keep an environmental logbook. WMR follows a different method of registration.
2. Chemical registration is required at all locations where work involving hazardous substances is performed. At most of those locations, the GROS software package is used for this purpose.
3. Water, gas/heat and electricity use is registered in ERBIS. 4. Each year, the emergency plans of the buildings are assessed and adapted to the current situation where required. The emergency management team is involved
in the exercises on location. 5. Periodic checks and tests of the systems are carried out in order to determine environmental emissions and guarantee safe operation. Examples include waste
water checks, checks for odour emissions, fume cupboard checks, manure storage checks, Dutch Emission Guidelines for Air (NeR) checks and checks of building-related systems. Inspection reports are recorded in the environmental logbook.
All organisational components work according to the statutory guidelines. Tasks which are part of environmental-related processes are established and safeguarded by a certified quality system. The organisational components are nevertheless free to determine whether and to what extent they work with such a system. The specific culture, wishes or expectations of the organisational component's staff, local residents or clients may be decisive in choosing whether to introduce a certified quality system. Table 7b gives an overview of the systems used by different WUR organisational components. Table 7b. The quality systems used by the organisational components
Organisational component
Systems Explanation
ASG ISO 9001 ISO 17025 ISO 17043
For WBVR and Wageningen Livestock Research (WLR). For WBVR, 60 accredited (diagnostic) tests. For WBVR, circulation exercises.
ESG
ISO 9001 ISO 14001 ISO 17025 ISO 26000 ISO 17043
For WENR and the Statutory Research Tasks(WOT) For WENR For CBLB, Chemical Biological Laboratory Bodem (soil) and WEPAL, (an alliance between the Biochemical and Soil Chemical Quality research teams which are part of Wageningen University's Department of Environmental Sciences). For the total Sciences Group For Wageningen University’s Department of Environmental Sciences.
PSG ISO 9001 For the test farms (Unifarm and Bleiswijk). SSG ISO 9001 For the WECR component.
WMR ISO 9001 ISO 17025
RIKILT ISO 17025 ISO 17043

Annual Environmental Report 2016
Page 16 of 44
4.2 Changes to permits In the past year 68 permit procedures have been carried out (see Table 8). Table 8. Overview of WUR permit procedures in 2016
Location Project Permits1 Bleiswijk PPO New-build winter greenhouse Construction under Environmental
Permitting (General Provisions) Act (Wabo)
Bleiswijk PPO New-build winter greenhouse Report of environmentally neutral credentials
Bleiswijk PPO Fire-safe use of building Report of fire-safe use Goutum Dairy Campus Installation of helophyte filter Report under Activities Decree
(Activiteitenbesluit) Goutum Dairy Campus Expansion of dairy farm and
improvement of manure fermenter under Dutch Nature Conservation Act
IJmuiden WMR Asbestos removal Demolition under Wabo Lelystad, WBVR New-build wing Environmentally neutral and
construction under Wabo Lelystad (all location) Expansion of Opium Act authorisation Opium Act permit Houtribweg, Lelystad (next to WBVR) Demolition of four staff residences,
including garages Demolition under Wabo
Lelystad ID, Edelhertweg 15 Termination of private limited company (already included in DLO permit)
Exemption from excise duty revoked
Lelystad PPO, Edelhertweg 1 New-build shelters Construction under Wabo Lelystad, Runderweg 4 Construction of exit lane Report under Wabo Lelystad, Runderweg 4 Installation of fence Construction under Wabo Lelystad, Runderweg 6 Converting temporary permit into
permanent permit (for Accres algae greenhouse)
Construction under Wabo
Lelystad, Runderweg 6 Installation of helophyte filter for Accres
Report under Activities Decree (Activiteitenbesluit)
Lelystad, Runderweg 6 Installation of helophyte filter cancelled Report under Activities Decree replaced by application under Water Act (Waterwet)
Lelystad, Runderweg 6 Application for helophyte filter for Accres
Water Act permit
Lelystad, Runderweg 6 Draining of salt/brackish water for algae cultivation
Current permit covers activity
Lelystad, Runderweg 6 Installation of argon tank on-site Notification under Activities Decree (notification was rejected, but we are still obliged to have a permit)
Lelystad, Runderweg 6 Installation of argon tank on-site Construction under Wabo (change) Lelystad, Runderweg 6 Demolition of isotope laboratory Demolition under Wabo WBVR, Lelystad Felling of 71 trees to make room for
parking spaces Report under Forestry Act (Boswet)
WBVR, Lelystad Asbestos removal Demolition under Wabo Nagele Asbestos removal in De Eest Demolition under Wabo Oosterschelde Schelpenhoek Extension of test for seaweed
cultivation Water Act
Sterksel Swine Innovation Centre (VIC) Expansion of manure-processing unit Environmentally neutral under Wabo Veluwe (between Ede and Kootwijk) ‘Licht op natuur’ (‘Spotlight on nature’)
project Construction under Wabo and permit under Spatial Planning Decree (Besluit ruimtelijke ordening)
Wageningen Campus Demolition of Klimaatgebouw Qualitron 5
Demolition under Wabo
Wageningen Campus (near Futurum) Felling of three trees Felling under Wabo Wageningen Campus (Wageningen University + DLO)
Research Opium Act permit
Wageningen Campus, Actio, West/South
Modification to notification of occupancy due to expansion of Actio
Report of fire-safe use
Wageningen Campus Atlas Installation of LED information screens Construction under Wabo (other structures)
Wageningen Campus Events site AID 2016 APV Wageningen Campus Events site and Gaia
Wereld Water College APV + tent
Wageningen Campus Helix Change to locations and name change Exemption from excise authorisation Wageningen Campus Helix Extension of permit Opium Act permit Wageningen Campus Helix Change to location and location
manager Activity permit under Dutch Abuse of Chemical Substances (Prevention) Act (1) (WVMC)
Wageningen Campus Helix Change to location and location manager
Activity permit under Dutch Abuse of Chemical Substances (Prevention) Act (2) (WVMC)
Wageningen Campus Helix Extension of list of substances Activity permit under Dutch Abuse of Chemical Substances (Prevention) Act
Annual Environmental Report 2016
Page 17 of 44
Location Project Permits1 Wageningen Campus Orion Felling of one tree, for terrace Felling under Wabo (permit rejected) Wageningen Campus Orion Installation of windbreak on terrace Construction under Wabo (other
structures) Wageningen Campus Phenomea Felling of three trees for the new-build
Phenomea construction Construction and felling under Wabo
Wageningen Campus Radix Agros Construction of a bird-deterrent system
Construction under Wabo
Wageningen Campus Thymospad cycle path
Felling of one tree (temporary shelter) Felling under Wabo
Wageningen Campus Unileverterrein (Unilever site)
Felling of two trees to prepare site for construction
Felling under Wabo
Wageningen Campus Vitae Felling of three trees Felling under Wabo Wageningen Campus Vitae Research involving drugs precursors Activity permit under Dutch Abuse of
Chemical Substances (Prevention) Act (WVMC)
Wageningen Campus Vitae Research Import permit Wageningen De Dreijen Application to extend permit under
Environmental Management Act (Wet milieubeheer)
Permit under Environmental Management Act
Wageningen De Dreijen De Valk Asbestos removal Demolition under Wabo Wageningen De Dreijen (site) Felling of ten trees (replacement of
fence) Felling under Wabo
Wageningen De Dreijen Transitorium Asbestos removal Demolition under Wabo Wageningen De Kleine Born Demolition of whole structure Demolition under Wabo Wageningen Haarweg 333 E-F-G Temporary student residence Wabo, permit under Spatial Planning
Decree Wageningen Hal BSW (Construction Service)
Withdrawal of permit (sale) Municipal permits
Wageningen Hal BSW (Construction Service)
Withdrawal of permit (sale) Permit from environmental agency (Omgevingsdienst)
Wageningen Hal BSW (Construction Service)
Withdrawal of permit (sale) Permit from Water Board
Wageningen Leeuwenborch Felling of six trees Felling under Wabo Wageningen Mansholtlaan Temporary letting of staff residence Vacancy permit Wageningen University, Animal Sciences
Temporary export at Experimental Zoology
ATA Carnet from Chamber of Commerce
WUR (all locations) Change of name and authorised permit holder
Exemption from excise duty
WUR (all locations) Change of name and authorised permit holder
Permit for excise warehouse
WUR (all locations) Change of name and authorised permit holder
Declaration of registration under Dutch Abuse of Chemical Substances (Prevention) Act, 2a
WUR (all locations) Name change Opium Act permit for Farmatec WUR (all locations) Name change Opium Act permit for MBC Wageningen Leeuwenborch Asbestos removal Demolition under Wabo Yerseke, Wageningen Marine Research (WMR)
Extension to provide room for Portakabins
Construction under Wabo (temporary extension)
Yerseke, Wageningen Marine Research (WMR)
Change to address of goods delivery department
Exemption from excise duty
Note 1: Wabo: Dutch Environmental Permitting (General Provisions) Act
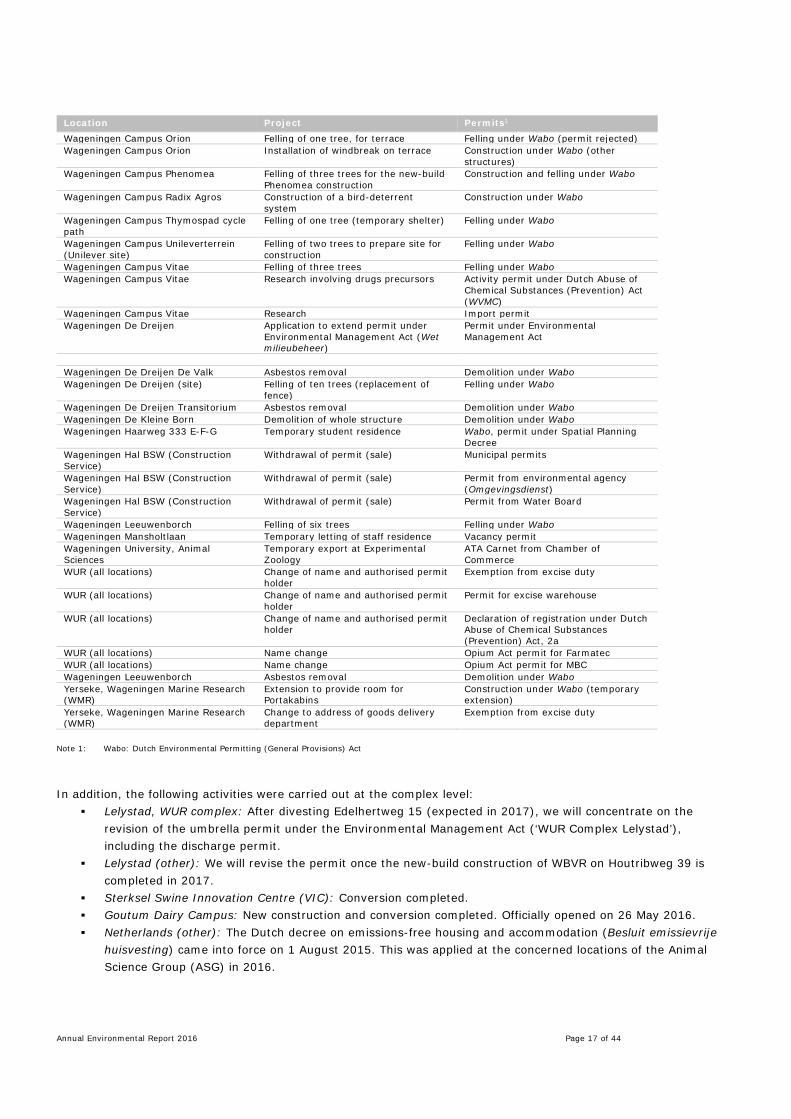
In addition, the following activities were carried out at the complex level:
Lelystad, WUR complex: After divesting Edelhertweg 15 (expected in 2017), we will concentrate on the revision of the umbrella permit under the Environmental Management Act (‘WUR Complex Lelystad’), including the discharge permit.
Lelystad (other): We will revise the permit once the new-build construction of WBVR on Houtribweg 39 is completed in 2017.
Sterksel Swine Innovation Centre (VIC): Conversion completed. Goutum Dairy Campus: New construction and conversion completed. Officially opened on 26 May 2016. Netherlands (other): The Dutch decree on emissions-free housing and accommodation (Besluit emissievrije
huisvesting) came into force on 1 August 2015. This was applied at the concerned locations of the Animal Science Group (ASG) in 2016.
Annual Environmental Report 2016
Page 18 of 44
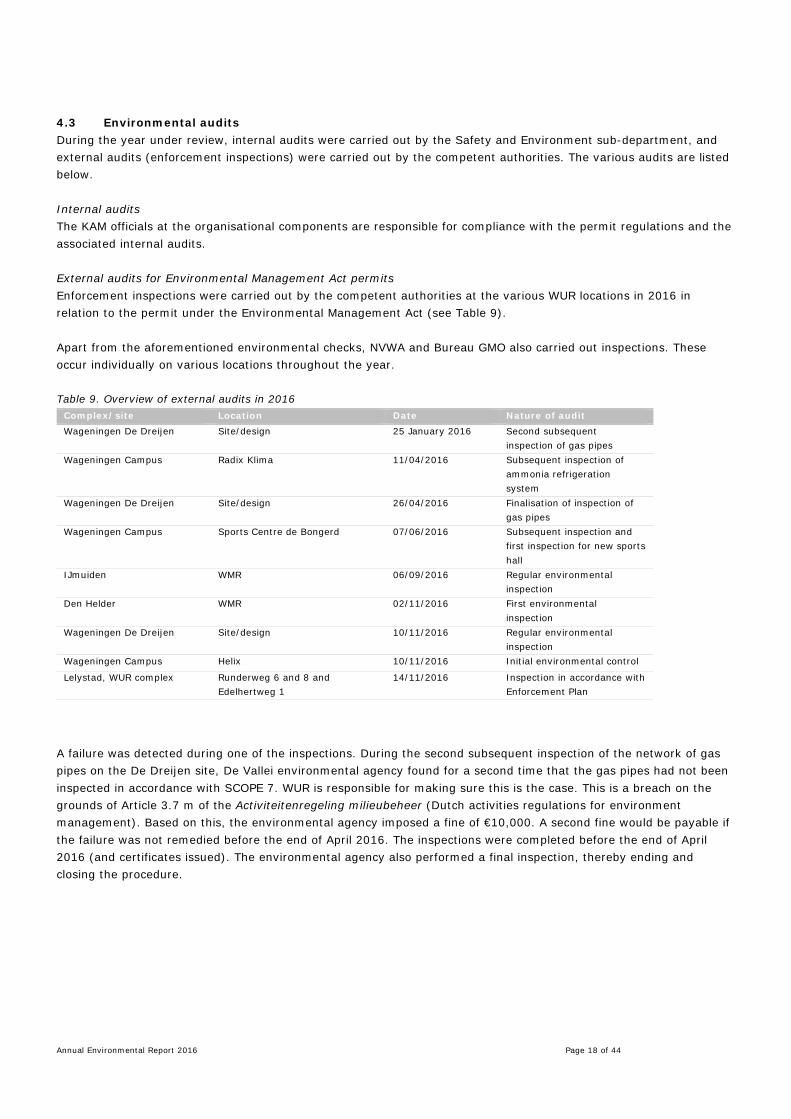
4.3 Environmental audits During the year under review, internal audits were carried out by the Safety and Environment sub-department, and external audits (enforcement inspections) were carried out by the competent authorities. The various audits are listed below. Internal audits The KAM officials at the organisational components are responsible for compliance with the permit regulations and the associated internal audits. External audits for Environmental Management Act permits Enforcement inspections were carried out by the competent authorities at the various WUR locations in 2016 in relation to the permit under the Environmental Management Act (see Table 9). Apart from the aforementioned environmental checks, NVWA and Bureau GMO also carried out inspections. These occur individually on various locations throughout the year. Table 9. Overview of external audits in 2016
Complex/site Location Date Nature of audit Wageningen De Dreijen Site/design 25 January 2016 Second subsequent
inspection of gas pipes Wageningen Campus Radix Klima 11/04/2016 Subsequent inspection of
ammonia refrigeration system
Wageningen De Dreijen Site/design 26/04/2016 Finalisation of inspection of gas pipes
Wageningen Campus Sports Centre de Bongerd 07/06/2016 Subsequent inspection and first inspection for new sports hall
IJmuiden WMR 06/09/2016 Regular environmental inspection
Den Helder WMR 02/11/2016 First environmental inspection
Wageningen De Dreijen Site/design 10/11/2016 Regular environmental inspection
Wageningen Campus Helix 10/11/2016 Initial environmental control
Lelystad, WUR complex Runderweg 6 and 8 and Edelhertweg 1
14/11/2016 Inspection in accordance with Enforcement Plan
A failure was detected during one of the inspections. During the second subsequent inspection of the network of gas pipes on the De Dreijen site, De Vallei environmental agency found for a second time that the gas pipes had not been inspected in accordance with SCOPE 7. WUR is responsible for making sure this is the case. This is a breach on the grounds of Article 3.7 m of the Activiteitenregeling milieubeheer (Dutch activities regulations for environment management). Based on this, the environmental agency imposed a fine of €10,000. A second fine would be payable if the failure was not remedied before the end of April 2016. The inspections were completed before the end of April 2016 (and certificates issued). The environmental agency also performed a final inspection, thereby ending and closing the procedure.

Annual Environmental Report 2016
Page 19 of 44
5 Complaints and incidents Complaints and incidents are registered centrally, including the problem analysis, follow-up and reduction/avoidance of direct consequences. This means WUR can:
- Formulate actions to prevent recurrence. - Carry out internal and external reporting. - Gain insight at the level of organisational components and at a corporate level. - Ensure archival accuracy. - Report to and gain information from the competent authority.
In the year 2016, 128 incidents were registered by means of the incident reporting form, three of which were classified as environmental incidents (see Table 10). Table 10. Reports submitted using the incident reporting form in 2016
What the report relates to
AFS
G
AID
AS
G
CS
ES
G
FB
WM
R
Ed
uca
tio
n
PS
G
RIK
ILT
-NV
WA
SS
G
Gro
un
ds
and
oth
er
To
tal
Accident involving minor injury 14 6 8 6 2 3 2 4 45 Accident involving some injury (doctor required) 2 3 4 2 3 5 1 20 Other 4 2 2 8 1 18 Unsafe situation or deficiency 8 7 2 17 Fire or fire alarm 1 5 5 11 Accident involving no injury 4 4 1 9 Accident involving serious injury 1 1 1 3 Environmental incident 1 1 2 Incident involving biological agents 1 1 Loss and theft 1 1 Near accident 1 1 Incident involving radioactivity Fatal accident Environmental incident involving GMOs Bomb alert Letters containing possible biological pathogens Total 35 0 28 0 21 10 0 15 11 3 1 4 128
Alongside two environmental incidents, there was one report of an accident involving biological agents. However, this did not lead to a contamination of the environment. There were also two complaints relating to excessive noise levels. The incidents and complaints are detailed below: Incident 1 : Unwanted discharge of rinse water into surface water (ditches) at Accres, Runderweg 6 in Lelystad. Nature of the incident While pumping out the grey water from the washing installation for sugar beets, the valve
stopped functioning properly. This caused around 5 m3 of grey water to become contaminated with clay and sand residue and enter the storm drain via the site. The open connection between the drain and the ditches cause the latter to become contaminated with this grey water.
Follow-up action The ditch was immediately sealed using boards and emptied. The contaminated water removed was then spread over the grounds. The Zuiderzeeland water board was immediately informed of this incident.
Environmental damage None. Follow-up Having visited the site and seen that WUR had taken adequate measures and cleared up the
situation in an exemplary fashion, the water board considered the case to be closed. Prevention As far as possible, the valve should be inspected before each use. Status Closed.

Annual Environmental Report 2016
Page 20 of 44
Incident 2 : Leakage of small volume of hydraulic oil from lorry at Lumen. Nature of the incident While unloading goods, a small volume of hydraulic oil leaked out of the lorry's loading and
unloading system (hydraulic tailgate). Follow-up action The driver of the lorry took appropriate action in the situation by clearing up the leakage
using an absorbent. Environmental damage None. Follow-up A closer inspection did not detect any further oil residue. Prevention None. Status Closed. Complaint 1 : Excessive noise levels on Wageningen Campus during the General Introduction Days in 2016. Nature of complaint Various residents (in Bennekom and at other locations) complained about the excessive noise
levels caused by live music in the marquees on Wageningen Campus. Follow-up action Data from interim and other measurements at fixed measurement points indicated that the
noise level was well below the permitted maximum level. Environmental damage None. Follow-up WUR informed the residents of its findings. The Municipality of Wageningen also confirmed
that the maximum noise levels were not exceeded in the evenings. The municipality also did not take the complaints further.
Prevention In the future, WUR is going to work more effectively with the municipality and inform residents of the planned activities or parties, especially those taking place in the evening.
Status Closed. Complaint 2 : Complaint from RIKILT/Vitae about excessive noise levels on Wageningen Campus Nature of the complaint A resident of Tarthorst complained about the excessive noise levels coming from the fans in
Vitae during the evening and at night. Follow-up action The fans and air-treatment units were inspected, to make sure they were functioning
properly. Environmental damage None. Follow-up It has not been possible to trace where the sound is coming from, given the difficulty of pin-pointing a
location. Prevention Further measures will be taken once the problem has become clear. Status Still being processed (to be closed in 2017).
Annual Environmental Report 2016
Page 21 of 44
6 Sustainability WUR wants to integrate sustainability as much as possible into teaching, research and operational management. WUR's website contains pages about our sustainable operational management, an explanation of major activities, as well as the results relating to energy, construction, waste, mobility, purchasing and catering. Chapter 3 offers a more detailed discussion of the topics of energy, waste, construction and mobility. Please read below for information on the activities and results from the CSR agenda in 2016, as well as on the activities and results in terms of purchasing, catering, Green Office Wageningen and our CO2 footprint. 6.1 CSR Agenda In 2016, WUR added elaborated on its CSR strategy. Three pillars are essential to this approach: do what you say and show what you do, create awareness within and outside the organisation and search for connections between research, education and operational management. Over 2016, the Sustainability group2 was tasked with formulating a CSR strategy for WUR based on the CSR ambition that was included in the Strategic Plan 2015-2018: ‘It is in line with our organisation and our domain to set high goals for Corporate Social Responsibility (CSR).’ In principle, each decision we make should take account of scientific, social and economic interests. How do the choices we make affect stakeholders? And can we justify these choices? Our responsibility goes above and beyond our own activities. In 2016, we added more shape to WUR's CSR strategy, further developing it within the context of the ‘CSR agenda’ that states the social themes we will focus on more in the coming years. The CSR agenda contains 21 major CSR topics both at WUR and outside our institution. Ten of those are so important for our organisation and stakeholders that they deserve extra attention. The CSR topics tie in as far as possible with the priority areas and KPIs in the Strategic Plan. In 2016, CSR was one of the priority areas in the Strategic Plan. It was necessary to develop CSR policy according to two action points: to improve environmental sustainability (energy and CO2 footprint) and inclusivity (encourage feedback, mobility, diversity and participation). In terms of environmental sustainability, we looked to further crystallise the environmental topics on the CSR agenda and the pan-WUR Energy Efficiency Plan (EEP) for 2017 to 2020. In terms of HR, CSR was interpreted as ‘Inclusivity’. This means that we take on people from various target groups and focus our attention on talent, mobility, equal opportunities and being representative of the population at large. Reports on the progress of these efforts are regularly sent to the Executive Board. 6.2 Procurement In relation to tendering, WUR follows the applicable legislation and regulations in the procurement field, as well as the principles of proportionality, objectivity, non-discrimination and transparency. In addition to the applicable legislation and regulations, WUR has its own purchasing policy. The relevant documents can be found on the internet under the Facilities and Services Purchases department (see link). The mode of operation within WUR is to make social responsible purchases and, where possible, apply at least the sustainability criteria published at Pianoo.nl (in Dutch). This applies to all products and services, from construction materials to coffee cups and services such as cleaning and security. Additional sustainability criteria for purchasing procedures can be presented to a sustainability panel consisting of approximately 63 WUR employees and students. In addition, WUR finds it desirable to express its social role by utilising regional suppliers, insofar as this is not contrary to legislation and regulations in this area. In reality this means that the buyers of WUR will point out to the internal clients the different possibilities available during procurement processes and contract period. To achieve this, the Responsible Innovation (MVI) growth model is put into action. The MVI growth model is a method to measure the efforts made relating to Responsible Innovation and to realise higher CSR awareness.
2 Please see Chapter 7 for more information on the Sustainability group.
Annual Environmental Report 2016
Page 22 of 44
A contract manager is assigned to each contract that involved the Purchasing department in the finalisation procedure. During the contract phase, the contract manager will consult with the supplier who must comply with the agreements relating to sustainability and CSR. If a supplier does not comply with the agreements, the contract manager must issue a warning to them. WUR has a complaints desk where interested parties can submit a complaint in writing about a specific tendering procedure. The way in which the complaint must be submitted and how it is evaluated and dealt with are formulated in the tendering documentation. WUR's purchasing procedures are carried out entirely digitally. The digital platform is used as a tool for tendering. The ordering process has also been digitalised, whereby the foundation for digital invoice processing has been laid. Suppliers are encouraged to send their invoices digitally. Because Wageningen deals in large numbers of orders and invoices, the use of paper, toner cartridges and postal services has been drastically reduced. Results achieved in 2016:
• In 2016, a total of 35 EU procurement projects were completed with a total value of €34 million. Following the Socially Responsible Purchasing (SRP) model, WUR reached a percentage of 94.3% for sustainability in procurement projects according to the Pianoo criteria (see pianoo.nl).
• We received six complaints. All complaints were processed and assessed, of which one was justified and the others unjustified.
• The Sustainability panel was asked twice in 2016 to provide its input. 6.3 Catering WUR has given itself the objective that products sold in the company canteens and vending machines must be sustainable and healthy. Each purchasing process must at least comply with the criteria from the Netherlands Enterprise Agency. All caterers at WUR buildings take sustainability very seriously, as evidenced by their sustainability policy and the yearly health & safety and environment audits and satisfaction surveys. They ensure that sustainability is ‘visible’ and that FairTrade products are marked with an extra logo. The caterers use local suppliers, and many products have a sustainability label. At least 40% of the products they purchase are from guaranteed non-GMO organic farmers that do not use chemical crop protection agents or artificial fertilisers and are conscious of animal welfare. The environmental impact of packaging material must be limited as far as possible, and caterers must separate waste at the source. Three quarters of the product range consists of preferred (healthy) and ‘neutral’ products according to the classification by the Dutch nutrition centre (‘Voedingscentrum’). In 2016, one of the caterers began using a bio-degradable and 100% organic cleaning agent. In 2016, caterers and Green Office Wageningen teamed up to create ‘Meatless Mondays’ – days on which warm meals and soups are vegetarian and there is a huge range of vegetarian snacks. However, if people still want to eat meat, there is a limited choice of meat croquettes and two sandwiches, one with fish and one with meat. During ‘Seriously Sustainable,’ the sustainability festival in October organised by Green Office Wageningen, caterers devoted extra attention to the sustainable range of products in the canteens. 6.4 Green Office Wageningen Green Office Wageningen takes a central role in the area of sustainability by supporting and connecting students, employees and projects. The responsibilities of Green Office Wageningen consist of:
- Connecting WUR Facilities and Services with the education and research departments. Green Office Wageningen promotes this cooperation on projects that focus on making operational management more environmentally friendly, for instance through an MSc thesis, trainee posts and Academic Consultancy Training assignments.
- Creating a platform for interested parties in the field of sustainability, where information can be exchanged and collaboration can take place.
- Providing support in the execution of ideas and initiatives focused on sustainability within WUR. - Strengthening WUR's sustainability strategy.

Annual Environmental Report 2016
Page 23 of 44
Green Office Wageningen organises different activities and meetings and writes about these on the Green Office website, the Green Office newsletter and its social media. The Green Office's motto over 2016 was ‘Linking-Learning-Innovating for a more sustainable WUR,’ focusing both on students and the new target group: WUR employees. It experimented with a ‘Sustainability Challenge,’ which was open to employees, and organised lunchtime lectures and debates. Green Office Wageningen also joined the Green Active Network. Established in 2016, the network provides a platform for companies to work together on ‘green goals’. Fifteen organisations are currently members of the network, and there will be greater efforts to organise joint activities in 2017. In 2016, Green Office has been working on:
- Roadmap for Sustainable IT: the starting point of the roadmap was the campaign ‘Use IT smartly,’ which aimed to raise awareness of sustainability and the use of IT. The Roadmap first assessed the sustainability of IT practice at WUR. The project focused on socially responsible procurement, sustainable use and sustainable transport of IT waste.
- Green Gifts: In 2016, as part of the Academic Consultancy Training (ACT), a group of students examined the sustainability of promotional gifts and gadgets at WUR. The report by the project group formed the basis of a discussion with concerned parties about our sustainability policy on promotional gifts.
- Meatless Monday: After the start of 2015, four large canteens on Wageningen Campus (Forum, Orion, Leeuwenborch and Impulse) joined forces to develop ‘Meatless Monday’ – the day on which their range of meals, sandwiches and snacks are almost exclusively vegetarian. Green Office continued to promote Meatless Monday in 2016 and organised a lunchtime debate on this theme during the ‘Seriously Sustainable’ event.
- Warm Sweater Week: The fourth edition of the ‘Warm Sweater Week’ was held in January, as part of which the temperature in the Forum and Zodiac buildings was lowered by 2°C to reduce energy consumption. Green Office organised different activities such as a Sustainability Tour of the campus, a knitting workshop and a fashion event.
- Student Cooking Corner: Each Wednesday, students are allowed to sell home-made vegetarian or vegan meals at Forum's canteen. This project is possible thanks to a collaboration with the caterer, Cormet.
- Collect, Fix, Share: In collaboration with Green Office and location managers, abandoned bicycles were collected from bicycle parking areas on Wageningen Campus and repaired by the second-hand shop Restore Kringloopwinkel in Ede. The restored bicycles were sold to students during the winter and summer editions of the Annual Introduction Days (AID).
- Green Match: Green Office is looking for subjects for students in order to create matches between education and sustainable operational management at WUR. This method enabled three students to find a work placement in 2016, and Green Office commissioned an ACT project for sustainable promotional gifts.
- Entrepreneurship for Sustainability: Green Office worked together with others to organise the second edition of a series of workshops and sessions in which students could gain support in setting up their own sustainable initiative or project. The sessions were held in StartHub Wageningen in collaboration with StartLife.
- Seriously Sustainable: Green Office organised a sustainability festival in the week of the ‘Sustainability Day’ (Dag van de Duurzaamheid), which took place on 10 October 2016. Working together with other student organisations, Green Office put on a varied range of lectures and activities including a sustainability market, the Sustainability Challenge, Sustainability Hour, a Fairphone workshop and a Clothes Swap.
The Green Office annual report 2016 provides full details on activities in 2016. 6.5 Carbon footprint and CO2 compensation footprint The carbon footprint and the CO2 compensation footprint give WUR insight into a number of factors, including the direct and indirect emissions of hazardous gases, coolant leakages, livestock numbers, land use and the environmental consequences of transport. The carbon footprints from recent years have alerted W UR to the size of its CO2 emissions and what it can do to reduce and compensate for them. The CO2 footprint provides a report at corporate WUR level. Alongside this, the different organisational components were asked to establish their individual CO2 footprints, so that they, coordinated by the QHSE sections, could specify priority areas and take measures to gain as much control as possible over their CO2 emissions and reduce these where possible.

Annual Environmental Report 2016
Page 24 of 44
The following aspects have been included in the calculation of the carbon footprint: Scope 1: (direct emissions)
Fuel consumption from heating offices, greenhouses and laboratories (natural gas). Emissions resulting from the leakage of coolants (F-gases). Fuel consumption of lease vehicles (diesel, petrol, LPG). Fuel consumption of WUR's own vehicle fleet (diesel, petrol, LPG). Fuel consumption of agricultural vehicles (diesel). Fuel consumption of rental cars and rented coaches (petrol). Emissions from agricultural land owned by WUR (nitrous oxide). Emissions from livestock (methane).
Scope 2: (indirect emissions)
Emissions from electricity purchased for offices, greenhouses and laboratories. Fuel use of electric lease vehicles. Emissions from business travel in private cars. Emissions from kilometres flown on business trips. Emissions from business travel using public transport (within the Netherlands and
international travel). Scope 3: (other indirect emissions)
Emissions caused by processing hazardous and animal waste. Emissions caused by processing of paper waste. Emissions from journeys to work by bus, train and metro. Emissions from air kilometres flown by students.
CO2 inventories 2016 The inventories of the carbon footprint and CO2 compensation were carried out in conformity with ISO 14064-1:2006 (E), 'Quantification and reporting of greenhouse gas emissions and removals,' which was based on the Greenhouse Gas Protocol. The CO2 performance ladder, version 3.0, was used as a starting point. The independent agency Royal HaskoningDHV verified the completeness of the data used for the carbon footprint and CO2 compensation footprint. The data collected over 2016 is comparable to the data collected in 2015. Nearly all energy, transport and waste data from all 26 locations in the Netherlands has been included. Supplementary notes:
- 2010 was taken as a reference year for our CO2 footprint. As more sources of emissions are added each year, and the calculation method was modified at the start of 2015 (changes to the CO2 emissions factors, etc.), it is almost impossible to compare the reference year with the current footprint. Part of the CO2 inventory in 2016 involved a recalculation of 2010 that took account of the changes and shifts in the CO2 in the emissions sources from 2010 to 2015, including changes to the CO2 emissions factors. The recalculation was based on the system used in the CO2 Performance Ladder (‘CO2-Prestatieladder’).
- As of 2015, we will calculate according to the CO2 emissions factors updated in 2014 (see www.co2emissiefactoren.nl).
- Residual waste is defined as 'the total amount of waste less animal and hazardous waste and less paper and cardboard waste'. Emissions from the processing of old paper and cardboard waste are allocated to the purchaser of recycled paper and cardboard; therefore WUR has a score of zero for these emissions.
- WUR rents locations and buildings to third parties. This means that third parties are engaged in their individual activities and, have their individual carbon footprints. For this reason, they have not been included in the WUR carbon footprint and CO2 compensation footprint.
CO2 emissions The CO2 emissions in 2016 have decreased by 46% in comparison to the reference year of 2010. There has been a slight reduction compared with the footprint in 2015 (-1%).

Annual Environmental Report 2016
Page 25 of 44
Figure 2. CO2 emissions in kilotonnes per scope in the period 2014-2016 Figure 2 indicates the scope distribution of the CO2 footprints from 2014 to 2016 inclusive. The distribution of the scopes over the past three years has remained virtually the same. The scope 1 emission in 2016 decreased by 3% compared with the previous year. As 2016 was a relatively warm year, we used less natural gas in the buildings (see paragraph 3.1: Energy). We also had less livestock in 2016 (-14%), and our vehicle fleet used less fuel (-1%). However, the various relocations (to the new Helix building) and the divestment of other buildings (in Lelystad and De Dreijen in Wageningen) led to a considerably higher use of coolants. As it happens, the CO2 emissions within scope 2 in 2016 were higher than previous years (+7% compared with 2015). Although less petrol was used for business travel undertaken with private vehicles (-2%), there was more business travel by aeroplane (+10%). The emissions from business travel by public transport decreased significantly (-65%), as the Dutch railways (‘Nederlandse Spoorwegen’) increasingly use green energy to power their trains, reducing the emissions factor for train journeys within the Netherlands. The CO2 emissions in scope 3 decreased by 3% compared with 2015. In 2016, WUR reserved fewer flights for students and course participants (-4%). The emissions from employees’ commutes were also lower (-6%), in line with the downwards trend of the number of employees who work at WUR. Emissions from waste processing increased significantly (+16%) as a result of building divestments, construction activities and increased research activities (see paragraph 3.2: Waste). The sources contributing the most to greenhouse gas emissions are the buildings (natural gas), the kilometres flown (jet fuel), commuter traffic (petrol) and agricultural land (nitrous oxide). See figures 3 and 4.
23.78 24.61 23.80
9.72 9.22 9.90
10.42 10.52 10.25
0
5
10
15
20
25
30
35
40
45
50
2014 2015 2016
kton
CO
2
Scope 3
Scope 2
Scope 1

Annual Environmental Report 2016
Page 26 of 44
Figure 3. Breakdown of CO2 emissions by operational activity, 2016
Figure 4. Distribution of CO2 emissions across the various emissions sources, 2016 CO2 compensation WUR compensates its energy use in the following ways:
- By generating wind energy (more than 58 million kWh in 2016). - Thermal storage systems on WUR's own grounds, to heat and cool various buildings on Wageningen Campus. - The operation of the biomass-fired combined heat and power plants 'Acrres' in Lelystad and 'VIC Sterkel' and
'De Marke' in Hengelo. - By generating solar energy. - The separation of the various types of waste to the maximum possible extent.
The total CO2 compensation footprint in 2016 was 35.2 kilotonnes of CO2. See figure 5 for the distribution of the compensation sources in 2016. This is a 35% increase in compensation as compared to the figures for the reference year 2010.
30%
25%
20%
12%
8%
2%2%<1% <1% <1%
0%Natural gas
Kerosene
Vehicle fuel
Nitrous oxide
Methane
Hazardous waste
Residual waste
Coolant
Electricity – train
Fuel, public transport by bus
Electricity – car
31%
25%14%
12%
8%
6%
4% <1%Buildings
Air travel
Commuting
Agricultural land
Livestock
Business travel by car
Waste
Business travel by public transport

Annual Environmental Report 2016
Page 27 of 44
Figure 5. Results of WUR's compensation measures in kilotonnes, 2016 Our CO2 compensation footprint in 2016 was lower than in 2015 (-28%). This difference is primarily due to the unfavourable wind conditions and disappointing energy yield from the wind farms in Lelystad (see paragraph 3.1: Energy). While we did not compensate for air kilometres in 2016, there has been an improvement in other compensation sources. For instance, the yield from thermal energy storage on Wageningen Campus was higher (as the installation now serves more buildings), and more energy was generated by biogas installations and solar panels. Climate neutrality Compared to the reference year of 2010, in 2016 the carbon footprint was reduced by 46% and the CO2 compensation footprint was 35% higher. The ratio of the carbon footprint to the CO2 compensation footprint in the period 2014-2016 is shown in figure 11 and table 6. In 2010 the CO2 compensation footprint was equivalent to 32% of the CO2 emissions. In 2015, our CO2 compensation was greater than the CO2 emissions, at 110% of the CO2 emissions. This figure was 80% in 2016. Table 11. WUR's carbon footprint and CO2 compensation footprint in 2010-20153
Year 2016 2015 2014 2010
CO2 emissions in kilotonnes 43.9 44.4 43.9 81.3
CO2 compensation 35.2 48.8 36.1 26
Climate neutrality (%) 80% 110% 72% 32%
Figure 6. Carbon footprint and CO2 compensation footprint in 2014-2016 compared to reference year 2010
3 This report differs from previous years due to recalculation of the baseline year in 2010 (see explanation on page 21). This report on our CO2 footprint n 2016 provides an explanation of how the recalculation was performed.
30.7
2.02.1
0.2 0.1
Wind turbines
CHP
Thermal storage
Compensation, waste
Compensation, solar
0
10
20
30
40
50
60
70
80
90
2010 2014 2015 2016
kto
n C
O2
CO2 emissions CO2 compensation

Annual Environmental Report 2016
Page 28 of 44
6.6 Overview of WUR overall sustainability figures The operational management at Wageningen University (WU) and Wageningen Research (WR) are intertwined with one another. This means that it is difficult to make a difference between the operational management at WU and the operational management at WR regarding the products and services. Therefore, this report discusses the operational management for WUR as a whole. The overall overview of WUR's sustainability figures is given in table 12. In order to compare the sustainability figures of WUR with those of other universities, the quantitative data has been divided into data per student, per employee and per square metre (see Table 13). Table 12. Overview of WUR overall sustainability figures
Component/topic Objective Achieved in 2016 CO2 footprint Reduction compared to reference year 2010 46% reduction
CO2 compensation footprint Increase compared to reference year 2010 35% increase
Climate neutrality Increase compared to reference year 2010 80%
Energy 2% reduction per year
Purchase of sustainable energy Production of sustainable energy
2.3 % reduction compared to 2015 (including climate correction)
100% purchase of wind energy (Certiq) 603,556 GJ
(of which 58 million kWh of wind energy)
Water Reduction in water use compared to 2015 11% reduction
Waste Reduction in waste produced compared to 2015 16% increase
Construction GreenCalc standard 215 Construction of new research building Helix 520
Procurement 50% sustainable purchases 94.3% sustainable purchases

Annual Environmental Report 2016
Page 29 of 44
Table 13. Overview of overall sustainability figures per m2 and per student and employee Benchmarks 2016 +/-* 2015 2014 2013 2012 m2 of floor surface 479,332 +3% 467,499 475,422 481,484 495,857 Number of students 11,278 +9% 10,380 9,544 8,825 8,248 FTE employees 4,912 -2% 4,995 5,106 5,190 5,275 Total number of students and employees (FTE + st)
16,190 +5% 15,375 14,650 14,015 13,523
Energy (quantitative) 2016 +/-* 2015 2014 2013 2012 Energy (GJ) 693,845 -2% 706,771 712,717 785,446 801,547 Electricity (kWh) 54,930,781 -1% 55,660,591 57,129,458 59,190,720 59,785,905 Natural gas (Nm3) 6,302,302 -3% 6,503,170 6,273,363 7,985,127 8,324,624 Energy (GJ/m2) 1.45 -4% 1.51 1.5 1.6 1.6 Electricity (kWh/m2) 114.6 -4% 119.1 120.2 122.9 120.6 Natural gas (Nm3/m2) 13.1 -5% 13.9 13.2 16.3 16.8 Energy (GJ/FTE + st) 42.9 -7% 46.0 48.6 56.0 59.3 Electricity (kWh/FTE + st) 3,392.9 -6% 3,620.2 3,899.6 4,223.4 4,421.1 Natural gas (Nm3/FTE + st) 389.3 -8% 423.0 428.2 569.8 617.7 Waste (quantitative) 2016 +/-* 2015 2014 2013 2012 Total waste (kg) 2,196,915 +16% 1,897,070 1,996,779 1,872,355 2,000,784
Hazardous waste (kg) 352,125 +14% 309,964 305,932 241,103 222,011 Industrial waste (kg) 1,548,002 +20% 1,291,922 1,361,400 1,261,475 1,494,851 Paper (kg) 296,788 +1% 295,184 329,447 369,777 283,922 Waste (kg/m2) 4.6 +13% 4.1 4.2 3.9 4.0 Hazardous waste (kg/m2) 0.7 +11% 0.7 0.6 0.5 0.4 Industrial waste (kg/m2) 3.2 +17% 2.8 2.9 2.6 3.0 Paper (kg/m2) 0.6 -2% 0.6 0.7 0.8 0.6 Waste (kg/FTE + st) 135.7 +10% 123.4 136.3 133.6 148.0 Hazardous waste (kg/FTE + st) 21.7 +8% 20.2 20.9 17.2 16.4 Industrial waste (kg/FTE + st) 95.6 +14% 84.0 92.9 90.0 110.5 Paper (kg/FTE + st) 18.3 -5% 19.2 22.5 26.4 21.0 Water (quantitative) 2016 +/-* 2015 2014 2013 2012 Total water (m3) 236,970 -11% 266,983 261,435 274,457 257,209 Mains water (m3) 209,058 -3% 214,549 205,258 215,055 199,622 Well water (m3) 27,912 -47% 52,434 56,177 59,402 57,587 Total water (m3/m2) 0.49 -13% 0.57 0.55 0.57 0.52 Mains water (m3/m2) 0.44 -5% 0.46 0.43 0.45 0.40 Well water (m3/m2) 0.06 -48% 0.11 0.12 0.12 0.12 Total water (m3/FTE + st) 14.6 -16% 17.4 17.8 19.6 19.0 Mains water (m3/FTE + st) 12.9 -7% 14.0 14.0 15.3 14.8 Well water (m3/FTE + st) 1.7 -49% 3.4 3.8 4.2 4.3 CO2 footprint (quantitative) 2016 +/-* 2015 2014 2013 2012 CO2 emissions (kg CO2 equivalents) 43,945 0% 43,817 41,987 47,102 41,700 CO2 compensation (kg CO2 equivalents)
35,156 -28% 48,873 31,705 36,655 36,114
CO2 emissions (kg CO2 equivalents/m2)
0.09 -2% 0.09 0.09 0.1 0.08
CO2 compensation (kg CO2 equivalents/m2)
0.07 -30% 0.1 0.07 0.08 0.07
CO2 emissions (kg CO2 equivalents/FTE + st)
2.7 -5% 2.9 2.9 3.3 3.1
CO2 compensation (kg CO2 equivalents/FTE + st)
2.2 -32% 3.2 2.2 2.5 2.7
* Difference between 2016 and preceding year.
Table 13 shows that in 2016, WUR had 3% more floor space compared to 2015. The total number of students and employees (FTE) has risen by 5%. This means that in 2016 as well, more intense use was made of buildings and amenities. An explanation of the differences between 2016 and previous years can be found in chapter 3. Finally, the carbon footprint per student and employee is 2.7 tonnes of CO2 and the carbon footprint per square metres is 0.09 tonnes of CO2. A total of 2.2 tonnes of CO2 was compensated for each student or employee and 0.07 tonnes of CO2 was compensated for each square metre.

Annual Environmental Report 2016
Page 30 of 44
7 Organisation WUR has embedded the goal ‘To promote a safe and environmentally friendly work/study environment and contribute to compliance with the health & safety and environmental regulations, to the quality of work and organisation and hence to a safe, environmentally safe and healthy working environment within the institution’ within the Quality, Health & Safety and Environment (QHSE) column. The QHSE column consists of a corporate Safety and Environment sub-department and various decentralised QHSE sub-departments within the Sciences Groups. The responsibilities within the QHSE column are assigned according to the mandates of WUR. This means that Safety and Environment is responsible for policy at a corporate level and the QHSE sub-departments of the Sciences Groups are responsible for implementation. In terms of the Deming cycle, this means that the QHSE sub-departments are responsible for the ‘DO’ activity and Safety and Environment is responsible for the ‘PLAN,’ ‘CHECK’ and ‘ACT’ activities. The QHSE sub-departments and the Safety and Environment sub-department work together closely. In terms of the permits, including environmental permits, this means that the corporate Safety and Environment sub-department is responsible for maintaining the legislative framework and making sure that the Permits Centre functions well. The Permits Centre provides a point of contact for all employees and students of WUR with regard to legislation and regulations as well as serving as a point of contact for various competent authorities. In this way, it is possible to gain an overview of all permits held by WUR, thereby providing insight into the risks and permit regulations. The QHSE sub-departments are responsible for keeping the permits up to date and complying with the permit regulations. In this regard, the organisational components are dependent on each other and need to be able to trust in one another because environmental permits are issued not per organisational component but at the complex level. Various internal and external audits were carried out in 2016 for purposes of ISO certification as well as for energy management, biological safety and radiation. In this way, WUR makes the CHECK phase of the Deming cycle concrete, and WUR gains more insight into compliance with legislation and regulation per organisational components and for WUR as a whole. In 2016, the Sustainability group specified the content of the ambitions for sustainability and CSR as laid down in the Strategic Plan for 2015-2018. The CSR group advises the Executive Board on matters relating to sustainability. The Sustainability group members are the director of Facilities and Services (chair); the director of Corporate Human Resources; the director of Corporate Communications & Marketing; a representative of the directors of operational management, the director of Education, Research & Innovation; representative(s) from the Student Council; and a sustainability policy officer (secretary). The chair of the Sustainability group is accountable to the Executive Board/Board of Directors. In 2016 the Sustainability group gave concrete shape to the sustainability and CSR ambitions as set out in the 2015-2018 Strategic Plan. As the CSR agenda encompasses sustainability in the broadest sense (people, plant, profit), this group will continue under the name ‘CSR group’ at the end of 2016. The CSR group advises the Executive Board about sustainability. The CSR group members are the director of Facilities and Services (chair); the director of Corporate Human Resources; the director of Corporate Communications & Marketing; a representative of the directors of operational management, the director of Education, Research & Innovation; representative(s) from the Student Council; and a sustainability policy officer (secretary). The chair of the Sustainability group is accountable to the Executive Board/Board of Directors. Legal entities The objectives and activities of the separate legal entities in the WUR alliance (Wageningen University and Wageningen Research) are coordinated substantively at strategic and tactical levels. Organisational components work together on operational management. The Safety & Environment sub-department head is designated to act as the authorised permit holder on behalf of Wageningen University and Wageningen Research and to perform legal and other acts with regard to those institutions' responsibility for the following Dutch legislation:

Annual Environmental Report 2016
Page 31 of 44
Environmental Permitting (General Provisions) Act Water Act Chemical Weapons Convention (Implementation) Act Nuclear Energy Act Excise Duty Act Opium Act Abuse of Chemical Substances (Prevention) Act GMO Decree
Accountability to competent authorities Within the framework of environmental legislation, the competent authorities are reported to through the annual environmental report, the electronic annual environmental report (for the Multi-Year Agreement for Energy 3) and the annual radiation hygiene report. One fine was issued in 2016, relating to the violation of environmental regulations. This sanction was described in chapter 4 (4.3 Environmental audits). The National Contact Point did not report that WU or WR violated the OECD guidelines. Communication A Safety and Environment team site has been set up in SharePoint for the experts within Wageningen University & Research (Quality, Health & Safety and Environment column and other involved parties). The most important function of this team site is to provide digital access to all the relevant documents and to inform experts in the relevant fields. The regulation matrix for the Dutch Environmental Management Act permit for Wageningen Campus and WUR complex Lelystad is also on the team site. This matrix describes which level within the organisation is responsible for compliance with each regulation. Employees and students of WUR are informed about environmental matters by means of intranet, the Permits Centre and the Sustainability pathway. Training programmes Within the Quality, Health & Safety and Environment column, employees participated in the following training programmes, courses and symposia:
- Advanced safety studies training programme. - In-house emergency and first aid service team leader training session and refreshment exercises. - In-house emergency and first aid service training sessions, including basic and refreshment exercises for
emergency and first aid services, supplementary respiration protection and fire-extinguishing drills. - Radiation hygiene courses. - GMO and new legislation and regulation workshop. - Biosafety symposium. - pre-Conference Course ‘They are trained, but are they competent?’ at the European BioSafety Association
(EBSA). - Symposium by the ‘BVF Platform’ (Dutch platform for biological safety officers) on Biological agents: ‘Genetic
manipulation – why not?’ (‘Genetische manipulatie, waarom niet?’). - Process and quality management course. - Audits and internal audits course. - Workplace research course. - Radio Protection Week, Oxford, September 2016. - Autumn symposium by ‘Vereniging voor Stralingshygiëne, NVS’ (the Dutch association for radiation
protection).

Annual Environmental Report 2016
Page 32 of 44
Appendix 1. Glossary of terms Organisation AFSG Agrotechnology & Food Sciences Group ASG Animal Sciences Group ATV AgroTechnology and Food Sciences CDI Centre for Development Innovation, component of SSG CS Corporate Staff CS+ Corporate Staff including Wageningen Academy DDW Department of Animal Sciences ESG Environmental Sciences Group E&EL Energy & Exploitation Lelystad ER&I Education, Research and Innovation FB Facilities and Services FBR Food & Biobased Research PPO Applied Plant Research PSG Plant Sciences Group QHSE (KAM in Dutch) Quality, Health & Safety and Environment RIKILT RIKILT-Institute for Food Safety SSG Social Sciences Group V&M Safety and Environment, Real Estate and Housing department, Facilities and Services WA Wageningen Academy WBVR Wageningen Bioveterinary Research (formerly Central Veterinary Institute, CVI) WECR Wageningen Economic Research (formerly LEI) WENR Wageningen Environmental Research (formerly Alterra) WMR Wageningen Marine Research (formerly IMARES) WUR Wageningen University & Research Terms BVF Biological Safety Officer DBP Animal by-products Erbis Energy registration, management and information system GMO Genetically Modified Organisms GROS Gevaarlijke stoffen Registratie- en Opsporingssysteem ('hazardous substances registration
and investigation system') ILT Human Environment and Transport Inspectorate ex-Kew Dutch Nuclear Energy Act KGA Hazardous Office Waste MJA3 Multi-Year Agreement for Energy 3 MJP Annual environmental plan MJV Annual environmental report CSR Corporate Social Responsibility NCP National Contact Point (OECD guidelines) NeR Dutch Emission Guidelines for Air NVWA Netherlands Food and Consumer Product Safety Authority OECD Organisation for Economic Cooperation and Development RVO Netherlands Enterprise Agency SZA Specific Hospital Waste Wabo Dutch Environmental Permitting (General Provisions) Act CHP Combined heat and power installation WKO Thermal storage system Wm Dutch Environmental Management Act

Annual Environmental Report 2016
Page 33 of 44
Appendix 2. Waste figures Wageningen University & Research (including third parties)
Appendix 2a. Total quantity and composition of waste (kg) per organisation component 2016
Waste flow AFSG ASG CS+ ESG FB WMR PSG RIKILT SSG Derden Totaal Verwerking (GRI)
Residual waste 264,586 264,636 38,032 39,207 99,503 20,643 318,861 20,780 30,706 68,366 1,165,320 Thermal recycling
Garden waste/green waste/swill 14,026 59,523 94,910 3,797 20,939 128,158 321,353 Recycling: fermentation
Rubble/construction & demolition waste
35,300 1,600 66,996 10,520 114,416 Recycling
Plastic wrap & plastics 6,126 3,097 24 14,276 40 16,300 2,088 1,194 43,145 Recycling
Soil 27,350 27,350 Other
Wood 2,880 2,140 520 21,080 26,620 Recycling
Glass 5,510 2,897 245 575 1,030 94 5,042 3,775 822 3,332 23,322 Recycling
Scrap 420 15,870 16,290 Recycling
Rock wool 9,680 9,680 Recycling
Oil/grease/fat/butter 285 0 285 Recycling
Data/confidential 47 30 77 Shredding & recycling
Paper 63,488 31,468 14,912 29,006 53,526 4,147 54,362 14,072 31,807 6,418 303,206 Shredding & recycling
Hazardous waste 51,820 181,190 15,425 10,901 20,602 31,184 40,817 186 50,622 402,747 See table 2b
Total 409,141 536,645 54,813 84,213 306,305 45,526 589,289 85,329 85,654 256,896 2,453,811
% waste separation 35.3% 50.7% 30.6% 53.4% 67.5% 54.7% 45.9% 75.6% 64.2% 73.4% 52.5%

Annual Environmental Report 2016
Page 34 of 44
Appendix 2b. Hazardous waste (kg) 2016 WUR (including third parties) per EWC code
EWC code Waste flow (description) 2016 Processing method 050108* Bitumen, tectyl, tar, grease 157 Other: unknown
060101*/060106* COD/CSZ waste 154 Other: DND 4
060102* Diluted hydrochloric acid 315 Other: DND
060105* Nitric acid 7,398 Other: DND
060106* Various inorganic acids / Fluoride / hydrogen fluoride 7,754 Other: DND
060203* Ammonium 26 Other: DND
060204* Inorganic lyes / Sodium hydroxide solution 88 Other: DND
060205*/200115* Inorganic lyes / Kjeldahl waste 9,296 Other: DND
060313*/160303* Silica gel 56 Energy recovery
060314* Ammonium sulfate 34 Other: DND
070103* Fluids with high halogen content 934 Incineration
070104* Fluids with low halogen content 3,967 Energy recovery
070704* Organic lyes / amines 94 Other: DND
080111*/200127* Paint 292 Energy recovery
080409* Glues, resins and putties 119 Energy recovery
090101* Developer, film 189 Recycling
090104* Fixative 251 Recycling
110106* Organic lyes / Acetic acid 592 Other: DND
130204* Waste oil 38 Recycling 130205*/130208* /200126* Used oil cat. II 1,262 Recycling
130204* Used oil cat. III 22 Recycling
130502*/130508* Oil/water/silt mixtures 23,010 Recycling
130899* Waste containing oil 262 Energy recovery
140602* Solvents with high halogen content 4,326 Incineration
140603*/160506* Solvents with low/no halogen content 8,312 Energy recovery
150110* Lab glass, thermal glass, empty packaging (unrinsed) 6,232 Incineration
150202* Lab waste - filters, pipettes with chemical residues 2,949 Energy recovery
160107* Oil filters 10 Recycling
160113* Brake fluid (clean) 134 Recycling
160114* Coolant (clean) 270 Recycling
160206* Lab chemicals, various 32 Incineration
160214* Electronics (scrap) 739 Recycling
160303*/160506* Inorganic salts 66 Other: DND
160504* Spray cans 41 Incineration
160506* Lab chemicals cat. I to IV 2,151 Incineration
160508* Organic acids in cans 103 Incineration
160601* Lead batteries 109 Recycling
161001* Waste water with pesticides, fluids/mixtures with low calorific value, contaminated water 7,753 Incineration
170503* Soil contaminated (PAHs) 731 Energy recovery
170605* Material containing asbestos 6 Disposal
170903* Small hazardous construction waste 710 Energy recovery
180103*/180202* Specific Hospital Waste and animal waste material / biologically contaminated material 155,922 Energy recovery
190809 Fat waste 1,680 Other: unknown
200113* Solvents 40 Incineration
4 DND: decontamination, neutralisation and dehydration

Annual Environmental Report 2016
Page 35 of 44
EWC code Waste flow (description) 2016 Processing method 200119* Pesticides 29,211 Incineration
200121* Various lamps, objects containing mercury 1,140 Recycling
200123* White & brown goods 4,377 Recycling
200127* Small hazardous waste / Toners 420 Energy recovery
200129* Cleaners 128 Other: DND
200132* Medicines and cosmetics 341 Energy recovery
200133* Batteries 967 Recycling
200135*/200136 White & brown goods / Electronics (scrap) 11,957 Recycling
200199 Small hazardous office waste 90 Energy recovery
- Animal waste 105,465 Other: sterilization and processing to animal meal for production biofuel
- Radioactive waste 25 Disposal (long term storage)
Total (kg) 402,747
Appendix 2c Total quantity of waste (kg) in 2016 per step in Lansink's Waste Hierarchy (according to GRI)
Waste flow Processing method : step in Lansink's Waste Hierarchy Total
Recycling Energy
recovery
Other: sterilization
and processing to animal meal for production
biofuel
Other: decontaminati
on, neutralisation
and dehydration
Other: unknown Incineration Disposal
Industrial waste 555,188 1,165,320 27,350 1,747,858
Paper 303,206 303,206
Hazardous waste 44,475 174,171 105,465 25,945 1,837 50,823 31 402,747
Total 902,869 1,339,491 105,465 25,945 29,187 50,823 31 2,453,811
Fraction 37% 55% 4% 1% 1% 2% 0%
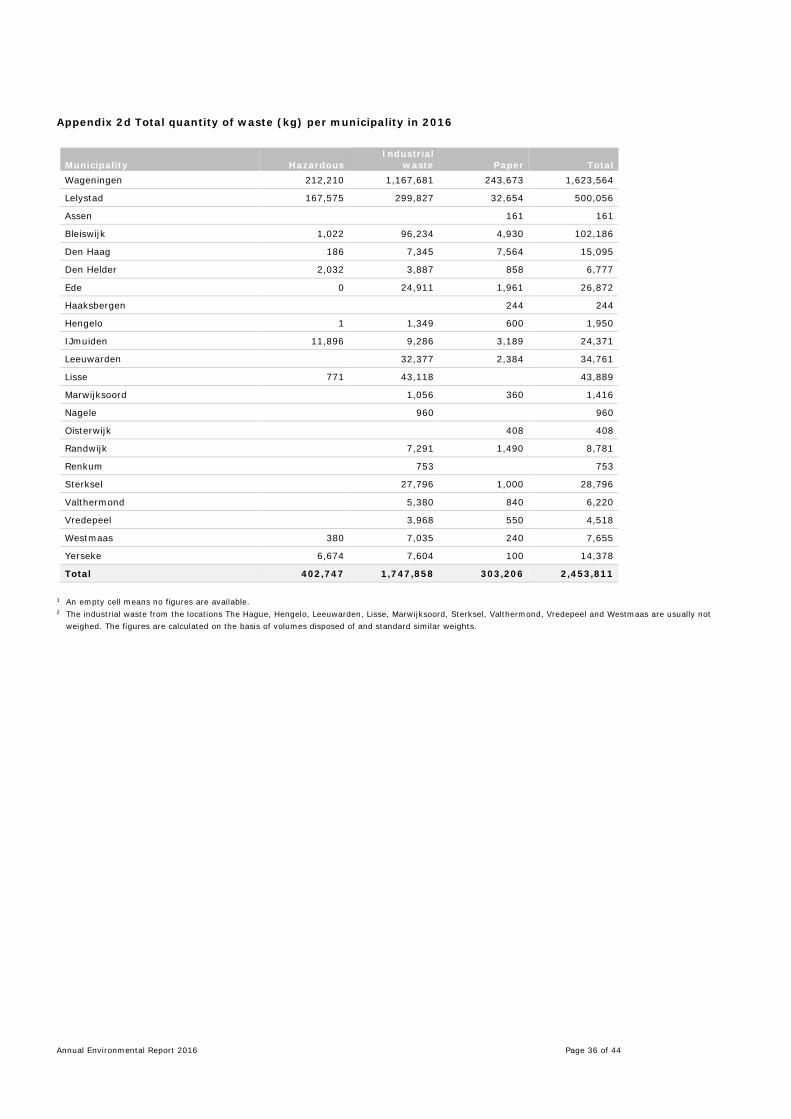
Annual Environmental Report 2016
Page 36 of 44
Appendix 2d Total quantity of waste (kg) per municipality in 2016
Municipality Hazardous Industrial
waste Paper Total Wageningen 212,210 1,167,681 243,673 1,623,564
Lelystad 167,575 299,827 32,654 500,056
Assen 161 161
Bleiswijk 1,022 96,234 4,930 102,186
Den Haag 186 7,345 7,564 15,095
Den Helder 2,032 3,887 858 6,777
Ede 0 24,911 1,961 26,872
Haaksbergen 244 244
Hengelo 1 1,349 600 1,950
IJmuiden 11,896 9,286 3,189 24,371
Leeuwarden 32,377 2,384 34,761
Lisse 771 43,118 43,889
Marwijksoord 1,056 360 1,416
Nagele 960 960
Oisterwijk 408 408
Randwijk 7,291 1,490 8,781
Renkum 753 753
Sterksel 27,796 1,000 28,796
Valthermond 5,380 840 6,220
Vredepeel 3,968 550 4,518
Westmaas 380 7,035 240 7,655
Yerseke 6,674 7,604 100 14,378
Total 402,747 1,747,858 303,206 2,453,811 1 An empty cell means no figures are available. 2 The industrial waste from the locations The Hague, Hengelo, Leeuwarden, Lisse, Marwijksoord, Sterksel, Valthermond, Vredepeel and Westmaas are usually not
weighed. The figures are calculated on the basis of volumes disposed of and standard similar weights.

Annual Environmental Report 2016
Page 37 of 44
Appendix 2e Waste quantity (kg) and composition 2015-2016 per Wm-complex
WUR-complex Lelystad Wageningen Campus Wageningen De Dreijen
Waste flow Sub waste flow 2016 2015 2016 2015 2016 2015 Industrial waste
Residual waste 162,913 137,420 589,757 520,113 164,828 89,318
Garden waste/green waste/swill 12,040 25,920 212,163 171,035 1,441
Rubble/construction & demolition waste
51,420 42,540 20,880
Foil/Plastic 40,516 32,131 46
Soil 17,560 25,334
Wood 6,460 5,220 16,320 10,390 1,700 1,440
Glass 757 445 17,355 9,494 3,900 1,020
Scrap 7,320 420
Oil/grease/fat/butter 980 1,368 285 38
Data/confidential 47 119 30 195
Paper Paper & cardboard 23,340 19,725 180,320 165,395 31,840 41,675
Cup2Paper 559 320 5,659 2,910 739 1,195
Hazardous waste Hazardous waste 62,423 65,965 162,377 153,484 16,674 16,037
Rendac 40,333 11,314 23,424 22,107
White & brown goods 1,277 2,400 5,266 7,001 3,759 2,636
Total 327,709 302,482 1,305,027 1,138,163 225,212 174,239
Waste separation % 50.3% 54.6% 54.8% 54.3% 26.8% 48.7%

Annual Environmental Report 2016
Page 38 of 44
Appendix 2f Waste (kg) in 2016, broken down by waste flow and Wageningen Campus location
Waste flow Gaia/
Lumen Atlas Radix Unifarm Axis Helix Futurum Forum Orion Actio/ Nexus
Residual waste 38,454 22,810 75,960 150,678 81,574 11,500 15,540 31,227 20,043 11,603
Garden waste/green waste/swill 8,100 8,758 3,842 0 31,663 21,900 5,791 Rubble/construction & demolition waste
1,600 2,080 1,180 46,560
Plastic wrap/plastic 0 15,820 3,600 2,500 10,909 2,987 384
Glass 575 50 432 4,560 760 175 675 254 552
Wood 14,620 1,180 520
Scrap 0 420
Data/confidential 0 0 30
Paper & cardboard 27,945 12,365 25,155 9,725 18,264 9,305 2,785 29,983 6,945 9,685
Cup2Paper 1,061 999 682 1,357 378
Hazardous waste 8,068 6,920 8,203 328 27,623 3,298 1,396 8,411
Rendac
White & brown goods 437 3,502 235 261 384
Total 76,540 44,744 113,934 205,911 143,771 30,881 19,000 106,996 61,358 74,431
Waste separation % 49.8% 49.0% 33.3% 26.8% 43.3% 62.8% 18.2% 70.8% 67.3% 84.4%
Waste flow Vitae Zodiac Carus Innovatron Triton Hoge Born Theia Wageningen Campus (total) Residual waste 49,440 28,100 29,880 0 11,138 11,683 127 589,757
Garden waste/green waste/swill 131,169 940 0 212,163 Rubble/construction & demolition waste 51,420
Plastic wrap/plastic 2,088 2,228 0 40,516
Glass 6,500 0 2,140 75 607 17,355
Wood 16,320
Scrap 420
Data/confidential 0 30
Paper & cardboard 13,225 8,690 1,145 1,835 1,265 1,748 255 180,320
Cup2Paper 847 335 5,659
Hazardous waste 90,962 7,168 162,377
Rendac 23,424 23,424
White & brown goods 447 5,266
Total 294,678 46,521 56,589 2,775 12,478 14,038 382 1,305,027
Waste separation % 83.2% 39.6% 47.2% 10.7% 16.8% 66.8% 54.8
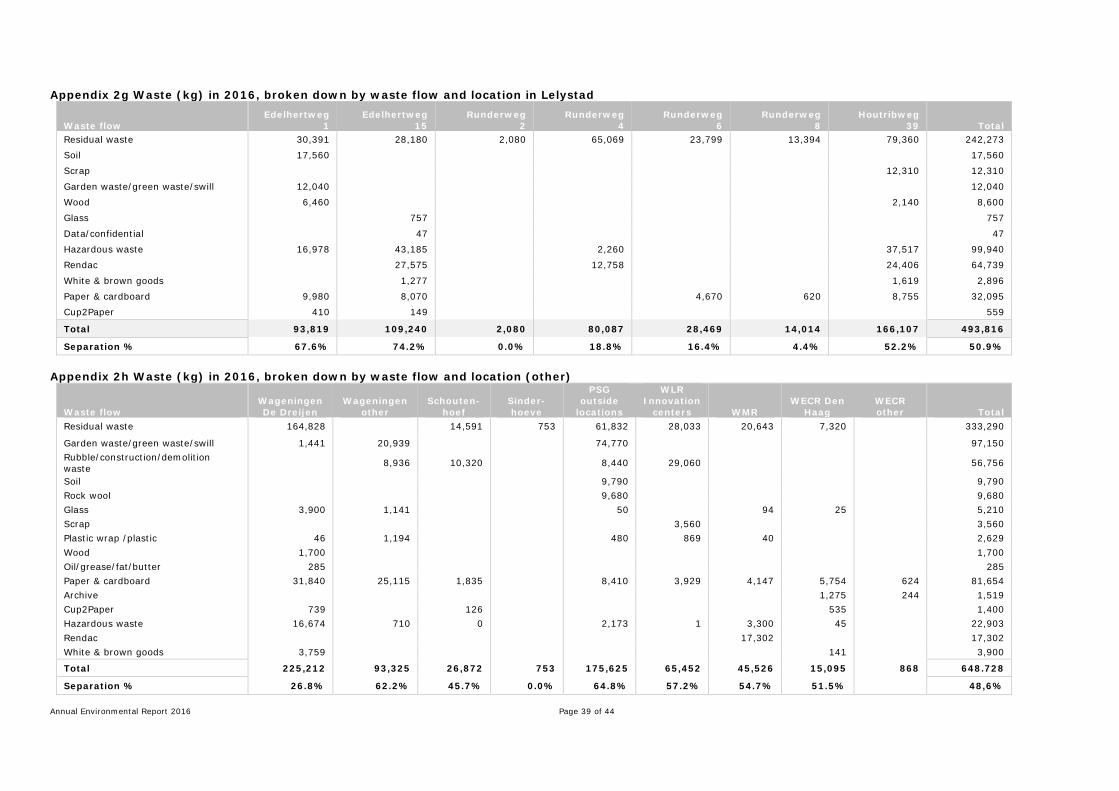
Annual Environmental Report 2016
Page 39 of 44
Appendix 2g Waste (kg) in 2016, broken down by waste flow and location in Lelystad
Waste flow Edelhertweg
1 Edelhertweg
15 Runderweg
2 Runderweg
4 Runderweg
6 Runderweg
8 Houtribweg
39 Total Residual waste 30,391 28,180 2,080 65,069 23,799 13,394 79,360 242,273 Soil 17,560 17,560 Scrap 12,310 12,310
Garden waste/green waste/swill 12,040 12,040 Wood 6,460 2,140 8,600 Glass 757 757
Data/confidential 47 47 Hazardous waste 16,978 43,185 2,260 37,517 99,940 Rendac 27,575 12,758 24,406 64,739
White & brown goods 1,277 1,619 2,896 Paper & cardboard 9,980 8,070 4,670 620 8,755 32,095 Cup2Paper 410 149 559
Total 93,819 109,240 2,080 80,087 28,469 14,014 166,107 493,816
Separation % 67.6% 74.2% 0.0% 18.8% 16.4% 4.4% 52.2% 50.9%
Appendix 2h Waste (kg) in 2016, broken down by waste flow and location (other)
Waste flow Wageningen De Dreijen
Wageningen other
Schouten-hoef
Sinder-hoeve
PSG outside
locations
WLR Innovation
centers WMR WECR Den
Haag WECR other Total
Residual waste 164,828 14,591 753 61,832 28,033 20,643 7,320 333,290
Garden waste/green waste/swill 1,441 20,939 74,770 97,150 Rubble/construction/demolition waste 8,936 10,320 8,440 29,060 56,756
Soil 9,790 9,790 Rock wool 9,680 9,680 Glass 3,900 1,141 50 94 25 5,210 Scrap 3,560 3,560 Plastic wrap /plastic 46 1,194 480 869 40 2,629 Wood 1,700 1,700 Oil/grease/fat/butter 285 285 Paper & cardboard 31,840 25,115 1,835 8,410 3,929 4,147 5,754 624 81,654 Archive 1,275 244 1,519 Cup2Paper 739 126 535 1,400 Hazardous waste 16,674 710 0 2,173 1 3,300 45 22,903 Rendac 17,302 17,302 White & brown goods 3,759 141 3,900
Total 225,212 93,325 26,872 753 175,625 65,452 45,526 15,095 868 648.728
Separation % 26.8% 62.2% 45.7% 0.0% 64.8% 57.2% 54.7% 51.5% 48,6%

Annual Environmental Report 2016
Page 40 of 44
Appendix 2i. Total quantity of waste in 2016 en 2015 (in kg), broken down by organisational component
Organisational component Hazardous waste
Industrial waste Paper waste Total
Waste separation
% 2016
AFSG 51,820 293,833 63,488 409,141 35%
ASG 181,190 323,987 31,468 536,645 51%
Corporate Staff 39,901 14,912 54,813 31%
ESG 15,425 39,782 29,006 84,213 53%
Facility Services 10,901 241,878 53,526 306,305 68%
PSG 31,184 503,743 54,362 589,289 46%
RIKILT + NVWA 40,817 30,440 14,072 85,329 76%
SSG 186 53,661 31,807 85,654 64%
Wageningen Marine Research 20,602 20,777 4,147 45,526 55%
Subtotal WUR 352,125 1,548,002 296,788 2,196,915 50%
Third parties on WUR grounds 50,622 199,856 6,418 256,896 66%
Total 402,747 1,747,858 303,206 2,453,811 53%
2015
AFSG 45,222 206,988 62,355 314,565 43%
ASG 129,138 246,204 47,611 422,953 48%
Corporate Staff 33,546 17,975 51,521 39%
ESG 13,876 39,718 27,835 81,429 58%
Facility Services 11,280 203,224 54,021 268,525 63%
Wageningen Marine Research 25,552 20,916 4,016 50,484 64%
PSG 49,132 463,875 36,410 549,417 51%
RIKILT + NVWA 35,706 24,444 13,695 73,845 75%
SSG 58 53,007 31,266 84,331 60%
Subtotal WUR 309,964 1,291,922 295,184 1,897,070 51%
Third parties on WUR grounds 47,390 180,848 4,064 232,302 76%
Total 357,354 1,472,770 299,248 2,129,372 55% Notes: 1. The household waste produced by the Netherlands Food and Consumer Product Safety Authority (NVWA) is removed through RIKILT. Hazardous waste and
specific operational waste flows are disposed of independently and are listed under ‘Third parties on WUR grounds’. 2. In cases where a building has more than one tenant, the waste is attributed to the main tenant. 3. Each year, PSG composts 600 tonnes of green waste from the greenhouses and garden waste on Wageningen Campus. PPO-Lelystad ferments approximately 81
tonnes of green waste in its own fermenter each year. Because this is a closed cycle, it is not counted as waste.
Appendix 2j. Hazardous waste (in kg) in 2012-2016, broken down by organisational component
Organisational component 2012 2013 2014 2015 2016 AFSG 54,549 42,794 44,610 45,222 51,820
ASG 75,162 124,289 141,762 129,138 181,190
Corporate Staff 4
ESG 14,162 7,437 18,412 13,876 15,425
Facility Services 8,448 2,091 7,985 11,280 10,901
Wageningen Marine Research 18,900 25,659 17,170 25,552 20,602
PSG 37,898 10,406 38,986 49,132 31,184
RIKILT 25,242 28,348 36,890 35,706 40,817
SSG 75 117 58 186
Subtotal WUR 234,361 241,103 305,932 309,964 352,125
Third parties on WUR grounds 26,865 49,729 52,503 47,390 50,622
Total 261,226 290,832 358,435 357,354 402,747

Annual Environmental Report 2016
Page 41 of 44
Appendix 3. Energy consumption WUR in 2005 and 2008-2016
Energy consumption Electricity (kWh) Gas (m3) Energy (GJ) Tonnes of CO2
2016 54,930,781 6,302,302 693,845 11,290 2015 55,660,591 6,503,170 706,771 11,650 2014 57,129,458 6,273,363 712,717 12,095 2013 59,167,202 7,864,487 781,416 14,976 2012 59,559,676 8,324,624 799,511 15,806 2011 58,986,867 8,103,014 788,522 15,400 2010 59,522,471 9,720,625 844,550 53,447 2009 62,844,056 9,133,439 855,927 53,762 2008 63,685,301 9,923,959 888,039 53,965 2005 59,581,768 11,031,812 886,033 53,598
Energy consumption compared to 2005
Electricity (kWh) Gas Energy (GJ) Tonnes of CO2
2016 92% 57% 78% 21% 2015 93% 59% 80% 22% 2014 96% 57% 80% 23% 2013 99% 71% 88% 28% 2012 100% 75% 90% 29% 2011 99% 73% 89% 29% 2010 100% 88% 95% 100% 2009 105% 83% 97% 100% 2008 107% 90% 100% 101% 2005 100% 100% 100% 100%
Energy consumption Complexes, 2014
Electricity (kWh) Gas Energy (GJ) Tonnes of CO2
Dreijen 10,692,898 2,006,693 159,748 3,755 Wageningen Campus 36,764,842 2,658,824 415,035 5,314 Kortenoord 0 0 0 0 Lelystad 7,429,469 1,265,561 106,920 2,379 Other 2,242,249 342,285 31,014 647 Total 57,129,458 6,273,363 712,717 12,095 Energy consumption Complexes, 2015
Electricity (kWh) Gas Energy (GJ) Tonnes of CO2
Dreijen 6,412,617 1,269,598 97,896 2,274 Wageningen Campus 36,931,506 2,764,842 419,891 4,953 Kortenoord 0 0 0 0 Lelystad 10,081,853 2,096,010 157,075 3,755 Other 2,234,615 372,720 31,908 668 Total 55,660,591 6,503,170 706,771 11,650
Energy consumption Complexes, 2016
Electricity (kWh) Gas Energy (GJ) Tonnes of CO2
Dreijen 3,671,806 853,963 60,074 1,530 Wageningen Campus 39,532,894 2,888,310 447,211 5,174 Kortenoord 0 0 0 0 Lelystad 9,384,781 2,135,210 152,042 3,825 Other 2,341,300 424,819 34,517 761 Total 54,930,781 6,302,302 693,845 11,290
Gross floor area in m2 2016 2015 2014 2008 De Dreijen 73,400 77,693 Wageningen Campus 257,813 243,208 Kortenoord 0 0 Lelystad 108,898 108.898 Other 39,221 37,700 Total 479,332 467,499 475,422 605,618 Specific energy use 2016 2015 2014 2008 Aardgas (GJ/m2) 0.416 0.433 0.418 0.654 Elektra (GJ/m2) 1.031 1.054 1.081 1.132 Total 1.448 1.487 1.499 1.785

Annual Environmental Report 2016
Page 42 of 44
Appendix 3. (continued) Energy consumption WUR in 2005, 2008-2016

Annual Environmental Report 2016
Page 43 of 44
Appendix 4. Water/waste water consumption WUR in 2005-2016
Water/waste water use Mains water (m3) Well water (m3) CO2 mains water (kg)
CO2 well water (kg)
2016 209,058 27,912 62,299 8,318 2015 214,549 52,434 63,936 15,625 2014 205,258 56,177 61,578 18,474 2013 215,055 59,402 64,517 17,821 2012 199,622 57,587 59,887 17,276 2011 211,265 66,524 63,380 19,957 2010 222,863 50,595 66,859 15,179 2009 248,477 103,720 74,543 31,116 2008 223,091 140,806 66,927 42,242 2005 223,091 140,806 66,927 42,242
Water/waste water use compared to 2005
Mains water Well water (m3) CO2 mains water CO2 well water
2016 89% 20% 89% 20% 2015 91% 38% 91% 38% 2014 88% 40% 88% 40% 2013 92% 43% 92% 43% 2012 85% 41% 85% 41% 2011 90% 48% 90% 48% 2010 95% 36% 95% 36% 2009 106% 74% 106% 74% 2008 95% 101% 95% 101%
Water/waste water consumption by complex 2014
Mains water (m3) Well water (m3) CO2 mains water (kg)
CO2 well water (kg)
Dreijen 25,246 19,000 7,523 5,662 Wageningen Campus 81,048 35,865 24,152 10,668 Kortenoord 0 0 0 0 Lelystad 87,363 0 26,034 0 Other 11,601 1,312 3,457 391 Total 205,258 56,177 61,167 16,741
Water/waste water consumption by complex 2015
Mains water (m3) Well water (m3) CO2 mains water (kg)
CO2 well water (kg)
Dreijen 25,815 22,615 7,693 6,739 Wageningen Campus 90,589 28,738 26,996 8,564 Kortenoord 0 0 0 0 Lelystad 82,762 0 24,663 0 Other 15,383 1,081 4,584 322 Total 214,549 52,434 63,936 15,625
Water/waste water consumption by complex 2016
Mains water (m3) Well water (m3) CO2 mains water (kg)
CO2 well water (kg)
Dreijen 39,825 666 11,868 198 Wageningen Campus 90,025 26,444 26,827 7,880 Kortenoord 0 0 0 0 Lelystad 64,829 0 19,319 0 Other 14,379 802 4,285 239 Total 209,058 27,912 62,299 8,318

Annual Environmental Report 2016
Page 44 of 44
Appendix 4. (continued) Water/waste water consumption WUR in 2005-2016
0
50,000
100,000
150,000
200,000
250,000
300,000
2005200820092010201120122013201420152016
mains
well
Consumtion of mains and well water (m3)
0%
20%
40%
60%
80%
100%
120%
2008 2009 2010 2011 2012 2013 2014 2015 2016
mains
well
Trend
0
10
20
30
40
50
60
70
80
2005 2008 2009 2010 2011 2012 2013 2014 2015 2016
Emissions of CO2 mains water (tonnes)
0
5
10
15
20
25
30
35
40
45
2005 2008 2009 2010 2011 2012 2013 2014 2015 2016
Emissions of CO2 well water (tonnes)
43%
31%19%
7%
Division of mains water in 2016
WageningenCampus
Lelystad
Dreijen
Other locations
95%
2%0%
3%
Division of well water in 2016
WageningenCampus
Dreijen
Lelystad
Other locations