Embed Size (px)
Citation preview

VERMEER’S MAPS REVISITED. A DIGITAL APPROACH
REFINEMENT1
A. Koussoulakou, E. Livieratos
Aristotle University of Thessaloniki, Greece
[email protected], [email protected]
Abstract
Cartography is often described as a combination of science and art and maps have
always been regarded as the fusion of scientific and artistic efforts. The links of cartography
and art are witnessed, among others, in maps depicted in paintings of great masters, such as
the Dutch painters of the 17th century, where both cartography and art were flourishing. A
representative example is Johannes Vermeer; in his painting “Officer and laughing girl”
(~1660) an officer and a young girl are placed in an interior, sitting at a table in front of a
window. On the wall behind the girl a large map is hanging, occupying a large part of the
painting. The map on the painting depicts part of the Netherlands; its remarkable similarity
with the original topographic map of its time (~1620) makes comparison a real challenge.
Such a comparison between the painted map and the original topographic map from
1620 is nowadays made much easier than in the past with the tools offered by the new digital
processing and visualization technologies. A typical example concerning the study of old
maps is the deformation analysis of those maps. Such an analysis was carried out, for the two
maps mentioned before (i.e. the map on the painting and its original -old- topographic
counterpart). In a previous original work, a number of transformations were performed for the
comparison of the two maps and the results of these transformations were visualized through
animations for a more effective presentation of the results. Apart from the analytical and
digital component of the process, an interesting result is this visual representation of the
transformation (dynamic morphing) from one map to the other. This revealed some
remarkable indications about the method followed by the artist (use of the camera obscura).
1 Proceedings of the XXIII International Cartographic Conference, Moscow, 4-10 August; http://icaci.org/files/documents/ICC_proceedings/ICC2007/html/Proceedings.htm

Since the initial set of transformations indicated the use of a projective device, the
continuation of the research presented here, concerns a further refinement of the process
attempting to interpret the presence of a number of remaining displacements (residuals) and
hence confirm in a more strict way the speculated use of the camera obscura. This is done by
applying different algorithms within the best fitting process, which account for the presence of
lenses in the camera obscura device. The results are again shown on both static and animated
comparisons of the respective maps.
Introduction
Maps have always been regarded not only as technical or utility tools, but also as
products of aesthetic and artistic efforts. This is in agreement with the fact that most of
Cartography’s definitions describe it as a science and an art at the same time. On the other
hand the definition of art, according to a great painter of the 20th century, Pablo Picasso, could
just as well be used for Cartography (“Art is a lie that makes us see the truth”)
Painting has always been present within maps (see e.g. Woodward, 1987). Some very
typical examples of harmonious co-existence of scientific and artistic skills in maps can be
witnessed in the Netherlands, especially during the 17th century (the so-called “Golden
century” of the region). Remarkable also is the influence of cartography in Dutch art, during
the same period (Alpers, 1987). At that time Netherlands is a world-leader in cartographic
production (maps, globes, nautical charts, atlases etc.), as a result of it being a great naval and
merchant marine power and center of world trade. Dutch cartographers are also surveyors,
mathematicians, engravers, painters. On the other hand, painters of that time were trained in
geometry by surveyors and cartographers, in order to use its principles in their work (e.g.
perspective, camera obscura). Many Dutch painters, such as Hals, De Hooch, Steen, Ter
Borch, Maes, Vermeer etc. depict maps and globes in their paintings, some of them with
remarkable detail. The most typical example among them is Johannes Vermeer, a painting of
whom is the subject of the present work.

The map in Vermeer’s painting
From the approximately thirty-five known paintings of Vermeer nine depict maps and
globes in them. All these maps and globes are copies of existing original ones, which have all
been identified (Welu, 1975 and 1977).
Among the first maps to be identified is the one in the painting “Officer and laughing
girl”. The painting (Fig. 1) was created around 1658-1660, while the original map was
compiled in 1620 by the Dutch cartographer Balthasar Floriszoon van Berckenrode and edited
by Willem Janszoon Blaeu. Only two copies of this map remain nowadays, both in the
Netherlands: one in the University Library of Leiden and the other in the municipal archives
of the city of Hoorn (Fig. 2.) In the painting an officer and a young girl are placed in a typical
Dutch interior, sitting at a table in front of a half-open window. On the wall behind the girl the
map is hanging, visually equally important with the rest of the painting. The map displays part
of what is nowadays the country of the Netherlands, with the west at its top.
Figure 1. Johannes Vermeer: Officer and laughing girl (1657-60),

Frick Collection, N.Y.
The comparison process
The striking similarity between the map on the painting and its original counterpart
(something typical of Vermeer in all of his map-depicting paintings) prompts for comparisons
in order to detect patterns of similarities or disagreements between the two.
Questions that can be asked are, for instance:
• What is the degree of similarity between the painted map by Vermeer and its
actual model?
• Did the painter follow a sort of free-hand method in painting the map or did he
follow a more attentive technique? (speculations about him using the camera obscura)
• How is it possible to ‘see’ the cartographic differences in an apprehensive way
accessible to the general public interested in Arts?
By the time the identification of the map was done (beginning of the 20th century) this
might have been not such an easy task; the digital technologies of nowadays, however, allow
Figure 2. The two copies of the van Berckenrode map: Leiden (left) and Hoorn (right)
for the quantitative description of the differences as well as for their comprehensive
visualization. A characteristic example with respect to historical maps is the deformation
analysis and presentation of distortions of these maps (Koussoulakou et al., 1983, Boutoura
and Livieratos, 2006). Such an investigation was carried out in previous works (Livieratos and
Koussoulakou, 2004 and 2006). A number of transformations were performed for the
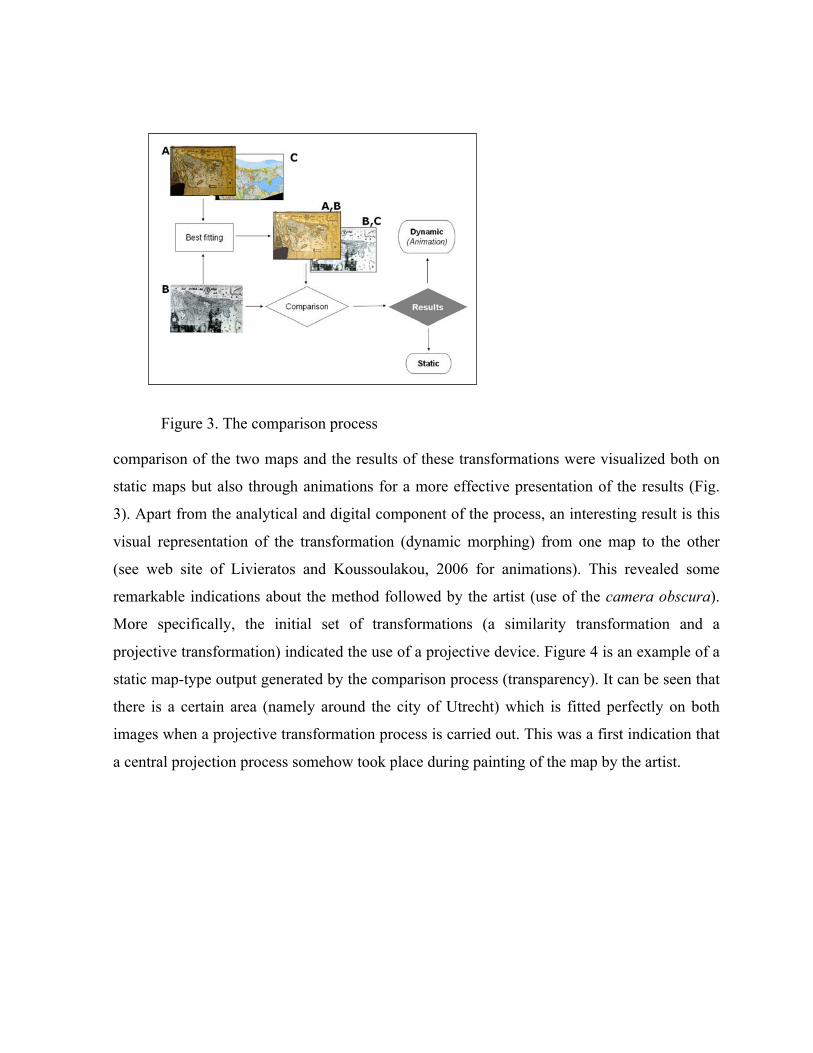
Figure 3. The comparison process
comparison of the two maps and the results of these transformations were visualized both on
static maps but also through animations for a more effective presentation of the results (Fig.
3). Apart from the analytical and digital component of the process, an interesting result is this
visual representation of the transformation (dynamic morphing) from one map to the other
(see web site of Livieratos and Koussoulakou, 2006 for animations). This revealed some
remarkable indications about the method followed by the artist (use of the camera obscura).
More specifically, the initial set of transformations (a similarity transformation and a
projective transformation) indicated the use of a projective device. Figure 4 is an example of a
static map-type output generated by the comparison process (transparency). It can be seen that
there is a certain area (namely around the city of Utrecht) which is fitted perfectly on both
images when a projective transformation process is carried out. This was a first indication that
a central projection process somehow took place during painting of the map by the artist.

Figure 4. The still image derived from the ‘projective’ best fitting of Vermeer’s
painted map (dark) on van Berckenrode’s model map (light). Utrecht is fitted perfectly in both
images.
This “area of agreement” on the two maps, when the projective transformation is
applied, is shown in Figure 5. It presumably constitutes the area where the axis of the camera
obscura was targeted.
Since the initial set of transformations indicated the use of a projective device, the
continuation of the research concerns a further refinement of the process. The next type of
transformations applied were polynomial transformations (of 3rd and 5th order), which, as
known from photogrammetry, account for distortions introduced by the lens of a camera. The
result of a 3rd order polynomial transformation is shown in Fig. 6, on another type of static
map generated by the comparison process (adjacent maps).

Figure 5. The red spot is centred on the city of Utrecht, the presumed axial targeting at
Vermeer’s painting by camera obscura. The blue orthogonal lines define the geometric centre
of the painting and the red the presumably ‘operational’ centre for the painting.
From the various types of map outputs generated by the comparison process it
becomes obvious that in the case of the 3rd order transformation the degree of similarity
between the two maps (i.e. the model map and the painted map) is quite high. This is
visualized in Fig. 7, where the large red spot indicates the area where the two maps fit almost
perfectly (or in other words where the residuals of the best fitting process are close to zero).
The difference between the rather limited circular spot of the projective case and the large
patch of the 3rd order case (see Fig. 7) is quite impressive.
The results are greatly enhanced by the animations generated from the comparison
process; although the static map-types allow for close-range and analytical examinations the
animated map-types (not possible here) offer more comprehensive visualizations of the
transitions between the two maps, as well as other various views such as e.g. the
metamorphosis of the map through the camera obscura or the visualization of the differences
between projective and 3rd order transformations etc.

Figure 6. Visualization of the displacements of respective points (residuals) on
adjacent maps: projective (above) and 3rd order polynomial (below) transformation
Some comments
This study is by no means complete. More points will have to be considered in the
future, such as e.g. comparisons for the second copy of the original map (although some initial
tests indicate similar results) or more types of transformations to be applied.
It has to be noted, however, that some alterations between the maps compared are
unavoidable. For instance, the image-sources used in the analysis, concerning the Vermeer’s
painting and the van Berckenrode’s model-map, are suffering alterations implied by the
copying procedures.
projective
3rd order

Nevertheless, a procedure has been established for further comparisons, analysis and various
visualizations. Apart from the analytical and digital treatment of deformations the comparison
process becomes more efficient through alternative types of maps, both static and dynamic
(animated) to represent the transition from the topographic (historical) map to the painter’s
map. This standard procedure is suitable for comparison between respective maps of more
paintings in order to test the camera obscura scenario.
Acknowledgements
Thanks are due to Dr. James Welu, Director, Worcester Art Museum, Worcester, MA,
USA, Dr. Charles van den Heuvel, Universiteits Bibliotheek, Bodel-Nijenhuis Collection,
Leiden, The Netherlands and Mr. Jan de Bruin, Archiefdienst Westfriese Gemeenten (Archive
Service of the Municipalities of West-Friesland), Hoorn, The Netherlands, for their kind
support in providing information and data.
Figure 7.The large red patch indicates the area where both maps fit almost perfectly, when a 3rd order polynomial transformation is applied (to account for lens distortions). Compare
with the circular red spot around Utrecht (=area of best fit for the projective transformation).

Bibliography
Alpers S. 1987. The mapping impulse in Dutch art. In D. Woodward (ed.) Art and
cartography. Six historical essays. Chicago: The University Press, 51-96.
Blonk-van der Wijst D. and J. 2000. Hollandia Comitatus – Een kartobibiliografie van
Holland. Hes & De Graaf Publishers BV, The Netherlands.
Boutoura C., E. Livieratos 2006. Some fundamentals for the study of the geometry of
early maps by comparative methods. e_Perimetron 1 (1): 60-70
Koussoulakou A., E. Livieratos, D. Rossikopoulos 1983. Deformation analysis of
historical maps, Quaterniones Geodaesiae, 4 (2), 127-148, (in Greek).
Livieratos E., A. Koussoulakou, 2004. ‘Maps in grand painting’ (in Greek), presented
at the 8th Hellenic Cartographic Conference, Thessaloniki, November 2004, pp.25-26.
Livieratos E., A. Koussoulakou, 2006. ‘Vermeer’s maps: a new digital look in an old
master’s mirror’. e_Perimetron,1 (2): 138-154, http://www.e-
perimetron.org/Vol_1_2/Vol1_2.htm
Livieratos, E. 2006a. The use of animation in visualizing deformations of a portolan-
type
map. e_Perimetron, 1 (1): 71-76.
Livieratos E. 2006b. On the study of the geometric properties of historical cartographic
representations. Cartographica, 41 (2), 165-175.
Welu J. A. 1975. Vermeer: His Cartographic Sources. Art Bulletin 57, 529-547.
Welu J. A. 1977. Vermeer and Cartography, PhD. dissertation, Boston University.
Woodward D. (ed.) 1987. Art and cartography. Six historical essays. Chicago: The
University Press, 51-96.