Embed Size (px)
Citation preview
Contact Investor [email protected]
Verisk Analytics
Eva Huston, CFO
Baird’s 2017 Global Consumer,
Technology & Services Conference

Forward-Looking Statements
This release contains forward-looking statements. These statements relate to future events or to future financial performance and involve known and unknown risks, uncertainties, and other factors that may cause our actual results, levels of activity, performance, or achievements to be materially different from any future results, levels of activity, performance, or achievements expressed or implied by these forward-looking statements. In some cases, you can identify forward-looking statements by the use of words such as “may,” “could,” “expect,” “intend,” “plan,” “target,” “seek,” “anticipate,” “believe,” “estimate,” “predict,” “potential,” or “continue” or the negative of these terms or other
comparable terminology. You should not place undue reliance on forward-looking statements because they involve known and unknown risks, uncertainties, and other factors that are, in some cases, beyond our control and that could materially affect actual results, levels of activity, performance, or achievements. Other factors that could materially affect actual results, levels of activity, performance, or achievements can be found in Verisk’s quarterly reports on Form 10-Q, annual reports on Form 10-K, and current reports on Form 8-K filed with the Securities and Exchange Commission. If any of these risks or uncertainties materialize or if our underlying assumptions prove to be incorrect, actual results may vary significantly from what we projected. Any forward-looking statement in this release reflects our current views with respect to future events and is subject to these and other risks, uncertainties, and assumptions relating to our operations, results of operations, growth strategy, and liquidity. We assume no obligation to publicly update or revise these forward-looking statements for any reason, whether as a result of new information, future events, or otherwise.
Notes Regarding the Use of Non-GAAP Financial Measures
The company has provided certain non-GAAP financial information as supplemental information regarding its operating results. These measures are not in accordance with, or an alternative for, U.S. GAAP and may be different from non-GAAP measures reported by other companies. The company believes that its presentation of non-GAAP measures, such as organic constant currency revenue, adjusted EBITDA, adjusted EBITDA margin, adjusted net income from continuing operations, adjusted EPS, and free cash flow, provides useful information to management and investors regarding certain financial and business trends relating to its financial condition and results of operations. In addition, the company’s management uses these measures for reviewing the financial results of the company and for budgeting and planning purposes.
2
Forward Looking Statements, Safe Harbor & Non-GAAP Financial
Measures
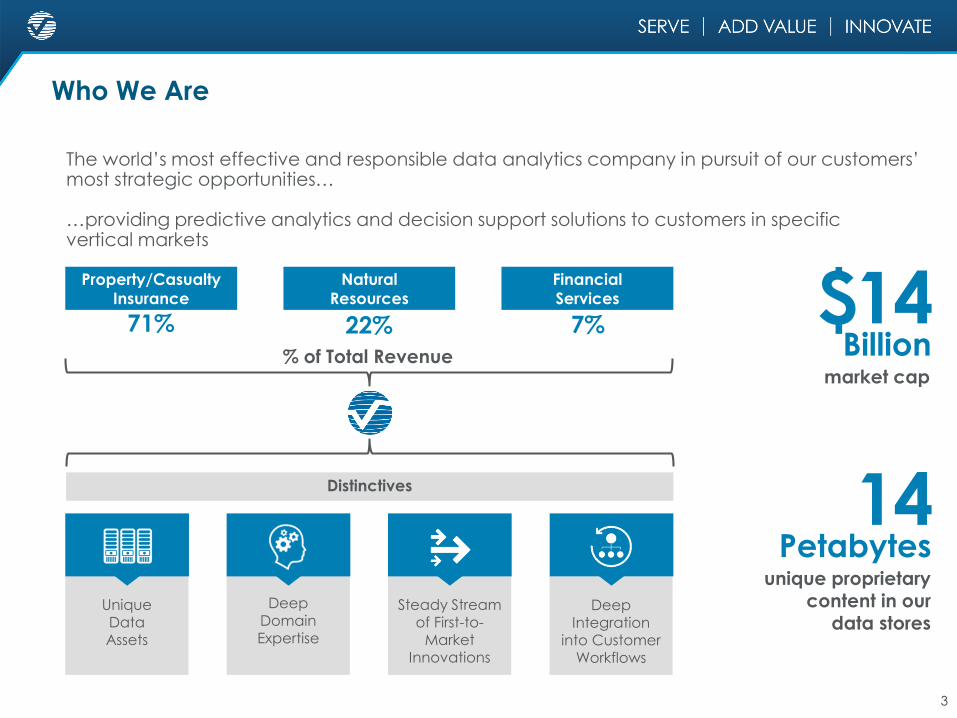
Who We Are
The world’s most effective and responsible data analytics company in pursuit of our customers’ most strategic opportunities…
…providing predictive analytics and decision support solutions to customers in specific vertical markets
2
Property/Casualty Insurance
Distinctives
Deep
Domain Expertise
Steady Stream of First-to-
Market Innovations
UniqueData Assets
Property/Casualty
Insurance
Natural
Resources
Financial
Services
market cap
14Petabytes
unique proprietary content in our
data stores
$14Billion
Deep
Integration into Customer
Workflows
% of Total Revenue
71% 22% 7%
3

4
Stronger and Larger Company
Steadily Growing Businesses Powered by Innovation, with Expanding Margins
and Low Capital Intensity
Newly Acquired Businesses at
Reasonable Prices with Similar
Characteristics
Increasing Financial Capacity
We can continue to drive leading organic growth
Strong capital structure
Balanced expectations for M&A spend
Return capital to shareholders
The Verisk Formula

Financial Highlights
Revenues2 Adjusted EBITDA2,3
1. As of April 1, 2017.
2. Excludes divested mortgage services and healthcare businesses.
3. Adjusted EBITDA is defined as net income from continuing operations before interest expense, provision for income taxes, depreciation and amortization expense, nonrecurring severance
charges, and gain on sale of equity investments. Adjusted EBITDA excludes second-quarter 2015 nonrecurring items related to the Wood Mackenzie acquisition and a fourth-quarter 2016
nonrecurring ESOP payment.
Track record of strong growth and cash flow generation
Investment-grade
debt ratings • Moody’s: Baa3 • S&P: BBB- • Fitch: BBB+
80%+ subscription revenue in 2016
$ Millions $ Millions
2016
2015
2014
2013
2012
2016
2015
2014
2013
2012
1,995
1,761
1,431
1,324
1,185
CAGR=13.9%
1,005
914
728
665
590
CAGR=14.2%
5
5

6
Disciplined Capital Allocation
$3.9B,
70%
$1.7B,
30%
Cumulative Capital Allocation, $ billions (2)
2012 2013 2014 2015 2016 1Q2017
Share Repurchase 163 279 778 20 327 104
Acquisitions and earn-outs 808 1 35 2,856 74 76
Acquisitions and earn-outs Share Repurchase
1. 2015 acquisition amount is net of currency hedges.
2. January 01, 2012 through March 31, 2017.
(1)
($ millions)

On average, outlook over time:
•Organic revenue growth consistent with historical performance
•Measured margin expansion
•Drive free cash-flow growth to increase shareholder value
• Long-term compounding of growth
7
Conclusion
“It’s more on [our]
racquet than on anyone else’s”

Additional Information

Not-for-profit advisory and rating organization
1971
Consolidation of major state, regional, and national rating and statistical organizations
1972–1979
Significantenhancementof insurancepolicy programs
Adoptionof advisoryprospectiveloss costs
Revised Board of Directors structure to include noninsurers
1980–1996
For-profit
corporation transition
Expansionof claimsmanagementsolutions
1997
Product expansion, internationalgrowth, andimprovedoperationalefficiency
NICB claims databaseacquired
Property-related products andservices created
1998–2001
Public Protection
Classifications database approved by insurance regulators in 44 states
Expansion of catastrophe models for new cat risks in countries around the world
Expansion of insurance market solutions, including property and replacement cost estimations
2002–2008
Verisk Analytics formed and IPO completed(Nasdaq:VRSK)
Expansion intofinancial services
Enhanced innovations for claims, GIS, and insurance coverages
2009–2012
The Verisk Way principles evolvedto serve, add value, and innovate
Corporate socialresponsibilityprogram formalized
Expansion intoglobal energy(including renewables), chemicals,and metals andmining industries
2013–2016
Scalable dataand analyticsolutions offered to vertical markets
Continuedglobal expansion
Long-termvalue creationwith scaledmargins andbetter returns on invested capital
Today
Not-for-Profit Privately Held Publicly Held
History of Growth and Innovation
9

10
Differentiated Financial Model
Strong, Stable Revenue Growth…($ millions),(organic revenue growth)
and Leading Margins Power EPS (1,2)
(% EBITDA/Revenue),($ Earnings per Share)
Low Capital Intensity…(CapEx as a % of Revenue)
1,4311,761
1,995
8.0% 7.7% 5.8%constant FX
1.0%
3.0%
5.0%
7.0%
9.0%
11.0%
13.0%
15.0%
17.0%
19.0%
100
300
500
700
900
1,100
1,300
1,500
1,700
1,900
2,100
2014 2015 2016
50.9% 51.0% 50.4%
$2.20
$2.87 $3.11
$1.80
$2.30
$2.80
$3.30
$3.80
15.0%
20.0%
25.0%
30.0%
35.0%
40.0%
45.0%
50.0%
2014 2015 2016
343412
479
2014 2015 2016
enables Strong Free Cash Flow(Cash from OPs less CapEx $ millions)
1. 2015 EBITDA/Adj. EPS exclude 2Q2015 one-time items related to the WoodMac acquisition.
2. 2016 EBITDA/Adj. EPS exclude severance, gain on equity investment, and ESOP charge. 2015 EBITDA excludes gain on sale of warrants.
3. Not presented on a continuing operations basis.
8.4%7.9%
7.3%
2014 2015 2016
(3)
(3)

P&C
Energy &
Specialized
Financial
11
Verisk Addressable Market: $16 billion

• Discrete programs, not built materially off of existing solutions
• Material incremental revenue streams
• Genuinely staffed with a 24/7 champion, i.e., someone whose success is directly tied to the success of the project
• Appropriate incentive programs
• May, though not necessarily, require incremental OpEx or CapEx
“Small i” innovation may be bundled into existing offerings
Price Innovationi
12
Innovation Opportunities

Our People
7
High performers characterized by:
Specialists in:
Predictive Analytics
EconomicsData
ScienceEngineering
Actuarial Science
MeteorologyGIS
MappingChemistry
and Physics
© 2017 Verisk Analytics, Inc. All rights reserved.
Respect for the Individual
Integrity Excellence Passion Teamwork PersistenceConfidence/
Humility
6,500+ employees holding more than 2,000advanced degrees and professional certifications
13

Multitier, Multispectral Data Capture
Large-Scale Data Integration
Visualization of Data and Analytics
Predictive Analytics
14
Core Capabilities

Insurance: Industry-Leading Analytics Solutions
15
Catastrophe Modeling
Claims Adjudication andFraud Detection Solutions
Decision Analytics
Risk Assessment
Property DamageClaims Estimating
Industry-Standard Insurance Programs
Property Information
Advanced science, advanced software platform covering 100 countries
Extensive time-series data and coverage language in >200M policies
Comprehensive database of 3.7M commercialbuildings & ratings on ~46,000 fire protection areas
Industry database totaling 1 billion claims
100M structural estimation price points and integrated network
Competitive AdvantagePrimary
Competitors
Certain competitors offer point solutions that compete with Verisk, but no other firm provides the same depth of solutions and analytics
Underwriting Solutions Comprehensive industry-standard information
Internal
Internal
Internal
Various

10.7
8.5
6.6
3.9
16.0
13.9
10.3
5.0
1-10 11-25 26-100 101-500
Average Number of Products
2013 2016
Ac
ross
27
Pro
du
ct
Ca
teg
orie
s
Top Customers Based on VRSK Revenue
16
Insurance: Growth Opportunities
Cross-Sell 2013 - 2016

Insurance: Building on Our Unique Heritage
Industrywide Focus New Solutions New Customer Sets
• Big Data & Predictive Analytics • Telematics / IoT • Global
• Automation: Flow Underwriting
& Claims Adjudication• Remote Imagery • Excess & Surplus Lines
• Digital Engagement • Cyber • Marketing Departments
• Claim Experience • Energy
Growth Opportunities
Product Development/Mgmt Actuarial Analysis Underwriting Claims Management Compliance Portfolio Analysis Risk Transfer
17

Energy: Large Addressable Market
Existing Wood Mackenzie Markets, Emerging Verticals and Adjacent Categories
RT
Da
ta
Technical
Sector Vertical
Pro
du
ct
Ca
teg
ory
Consulting2
Co
mm
erc
ial
En
erg
y &
Co
mm
od
itie
s In
form
atio
n
Real Time Data
Market Size: c.$0.8 – $1B
Market Size: c.$4B
Market Size: c.$0.9B
Market Size:
c.$0.3B
Oil Gas Coal UtilitiesIndustrial Markets
Chems Renewables
Market Size:
c.$0.2B
Tec
hn
ica
l
Wood
Mackenzie
Heartland
Nascent
Category
Potential Future
Category
Upstream Costs
Sub-surfaceChems
De-carb
Oil Price Tool
Addressing commercial requirements in the
technical arena has the largest scale
18

Energy: Simple Business Model Focused on Clients
New business ideas
ConsultingResearch
Access & feedback
Demonstration of value
Long-term relationships
Insight & information
Data & expertise
Expert network
Bespoke solutions
Strategic dialogue
Client
Integrated
Model
Consulting
Research Sales &
Marketing
19

Energy: Diverse Subscription Customer Set
Growing No. of Customers (1) End User Mix (2)
Low Customer Concentration (1)
1. Wood Mackenzie core only pre-2016, excludes Acquisitions, who add approx. 1,100 new subscription clients.
2. Represents figures for Nov 2016 for Wood Mackenzie core subscriptions only. NOC = National Oil Company; NGO =
Nongovernment Organization; E&P = Exploration & Production; Other includes Utilities, Manufacturing, Conglomerates, and
Professional Services.
24%Top 10 Client
Subscription Value
(Nov 2016)
<4%Maximum
Individual
Customer Value
642 722 735 772 822 913
>2000
2010 2011 2012 2013 2014 2015 2016
+7%
E&P and
Integrated
36%
NOCs,
Govts &
NGO, 17%
Financials,
27%
Other, 20%
20

Analytical Services
Strategic Insights, Planning & Execution Support
• Annual retainers or strategy engagements
• Pricing… annual (retainer) or monthly run-rates,
value/time-materials based
• Argus analysts mine its consortia data sets to build &
support bank strategies
• Users: business heads, product & portfolio
managers, risk officers & associations
Media Effectiveness
Measure Effectiveness & Optimize Targeting of Ads
• Custom installs or partner platforms
• Pricing… multiyear licenses, beta tests, rev-share
with partner
• Media & ad effectiveness insights & software
• Users: marketing heads, agencies, bank
partners/retailers, ad platforms
Benchmarking Studies
Help Understand the External Environment
• Customized… Ever-green subscriptions
• Pricing… annual with modest inflation-type cost
increases
• Based on wallet-level customer, account
& transaction data
• Users: business heads, product & portfolio
managers, risk officers a& regulators
Product Solutions
Make Proprietary Data Accessible & Actionable
• Customized… recurring licenses
• Pricing… installation fees & annual site
licensing/maintenance fees
• Data platforms, reg reporting, stress-testing,
wallet-based stochastic algorithms
• Users: IT, risk/compliance, decision management,
marketing
21
Financial: Our Solution Groups

22
Financial: Unique Data Enabling Valuable & Differentiated Solutions
DescriptionArgus-
Verisk (1)
Credit Bureaus
Payment Networks
PaymentProcessors
Daily POS Transactions
POS & online transaction detail (merchant, location, amount, date)
Payment Instruments
Credit card, deposits, checking, and money market account performance
Product Attributes
Features including pricing, value propositions, pricing, promo detail
Account-Level P&L
Revenue and cost details including finance charges, fees, losses, OpEx
Customer Behavior
Usage details including spend, fraud, channel, payment, etc.
Customer & Wallet Views
Complete consumer view (share of wallet) across issuers and instruments
Argus Partnerships
Complementary data assets on one common platform (including media)
Data on millions of merchants, billions of accounts, trillions of $’s in transactions… updated daily
1. Some Argus data assets have been developed in partnership with non-Verisk institutions.

For M&A
• Reasonable prices for good businesses
− Identify businesses that fit strategy and grow cash flow
−Seek sticky subscription revenue
• ROIC provides an additional measure with nearer-term horizon
For Buyback
• Remain disciplined
−Volume/price targets
−Share reduction secondary outcome
Balanced strategy creates flexibility
23
Guidelines for Capital Allocation Future Success
Appendix
Supplemental Slides andNon-GAAP Reconciliations

Risk
Assessment
38%DA
Insurance
35%
Financial
Services
6%
Energy &
Specialized
21%
1Q2017 Revenue Distribution
25
Diverse, Highly Recurring Revenue Sources
Decision Analytics62%
Transaction
Revenue
17%
Subscription
Revenue
83%
1Q2017 Subscription Base

26
Strong Capital Structure to Support Growth
1. Per bank covenant.
Note: 2. Steps down to 3.50x at the end of the fourth fiscal quarter following the acquisition of Wood Mackenzie.
250450 350
900
350
1,500
2015 2016 2017 2018 2019 2020 2021 2022 2025 2045
as of 3/31/2017
Public Bonds Revolver Drawn Undrawn Revolver
Debt / EBITDA (1) 2.2x
Covenant level 3.5x
($ millions)
Bonds $2,300
Revolver Drawn 0, 0
Total Debt $2,300
Revolver due
May 2022
Investment Grade Ratings
S&P: BBB-
Moody’s: Baa3
Fitch: BBB+

Property/Casualty Insurance
Industry-leading data analytics and insights
Industry-Standard
Insurance Programs
Property and Business
Information
Underwriting
Claims Adjudication
and Fraud Detection
Property Damage
Claims Estimating
Extreme Event
Modeling
Solutions Advantages
claims in the industry’s leading database
structural estimation price points and integrated network
5PB3.9M+
1B+100M
countries covered across property, casualty, life and health,
and marine lines in an advanced software platform
trip miles of analyzed driving data and 90M+ residential properties with
building information and risk data
commercial buildings and details on licensing, violations, sales volume, and employee count for 26M businesses;
~47K fire protection area gradings
100+7B
time-series data and coverage language in 200M+ policies
27

Natural Resources
Data analytics and commercial intelligence
Subscription Services
Research Reports
Consulting
Country Risk Data
Assessing and
Evaluating
Opportunities and Risks
Solutions Advantages
research professionals directly accessible around the world
reports and forecasts at the asset, company, and
market level for online purchase through
e-commerce service
professional industry consultants providing innovative advice
and bespoke solutions
monitored risks, including terrorism, conflict, civil unrest,
corruption, human rights violations, and natural hazards
data points describing global upstream oil and gas assets
500+
14,000+
100+
200+
55M+
28

Financial Services
Information, analytics, and data management
Syndicated
Benchmarking Studies
Predictive Algorithms,
Business Intelligence,
and Analytical Tools
Advisory Services
Risk and
Regulatory Practice
Media Effectiveness
Spend Analytics
Solutions Advantages
models of consumer behavior across the customer life cycle
for prospecting, acquisition, and customer management
worldwide clients given unique views into a customer’s actual
wallet that enhance relevance and wallet share
in assets analyzed for loss forecasting, capital modeling, and
regulatory submissions for global banks across 30+ countries
$6.7T
account-level records for consumer credit, debit, and savings
accounts covering 10+ years, with studies in 7 countries
total consumer spend tracked each year on 140B unique
transactions, along with innovative delivery mechanisms to
inform retail partners and merchants
1.5B
100+100+
125M consumers targeted with custom digital solutions
covering $2.0T of annualized spend
$5T
29

30
2016 Acquisitions
Date Nov 2016 Nov 2016 Oct 2016 Aug 2016 Jul 2016 Apr 2016
Description Provides
market
intelligence
data and
analytics to
the property &
casualty
insurance
market
Provides large-
scale
mapping
services and
geospatial
data and
analytic
solutions to a
wide array of
companies
and more
than 300
public sector
organizations
Provides
a software
analytics suite
designed for the
reinsurance and
insurance
industries
Provides
strategic market
intelligence to
the global oil
and gas
community
through
subscriptions to
their eight
proprietary
market-forecast
databases
Delivers
business-to-
business news,
market analysis,
and
conferences
that inform and
connect
players in the
global clean
energy market
Provides value-
added services
focused on
fraud
detection,
compliance,
risk control, and
process
automation
Vertical Insurance Insurance Insurance Natural
Resources
Natural
Resources
Insurance
Location Middletown,
Connecticut
Cambridge,
United
Kingdom
Halifax,
Nova Scotia
Sugar Land,
Texas
Boston,
Massachusetts
Dublin, Ireland
Quest
Offshore

31
2017 Acquisitions
Date May 2017 Mar 2017 Feb 2017 Feb 2017 Jan 2017
Description Provides
intelligence for
the renewable
energy
industry –
specializing in
onshore and
offshore wind.
Provides
analytics, risk,
and
compliance
solutions for
the banking
sector
enabling
agility in risk
and regulatory
reporting
practices.
Provides U.K.
domestic
insurers with
technological
innovations
that enable
them to
process claims
more
efficiently and
to detect
fraud.
Provides
automated
medical risk
assessment for
travel
insurance
industry
allowing
insurers to
identify and
assess risks at
point of sale.
Provides
liability risk
modeling and
decision
support,
primarily for
the
reinsurance
industry, using
a unique
methodology
based on
dependency
theory.
Vertical Natural
Resources
Financial Insurance Insurance Insurance
Location Aarhus,
Denmark
Bangalore,
India
Newcastle,
United
Kingdom
Surrey,
United
Kingdom
London,
United
Kingdom

32
Constant currency revenue growth
Our operating results reported in U.S. dollars are affected by foreign
currency exchange rate fluctuations because the underlying foreign
currencies in which we transact change in value over time compared
to the U.S. dollar; accordingly, we present certain constant currency
financial information to provide a framework to assess how our
businesses performed excluding the impact of foreign currency
exchange rate fluctuations. We use the term “constant currency” to
present results that have been adjusted to exclude foreign currency
impact. Foreign currency impact represents the difference in results
that are attributable to fluctuations in the currency exchange rates
used to convert the results for businesses where the functional currency
is not the U.S. dollar. This impact is calculated by translating
comparable prior period year results at the currency exchange rates
used in the current period, rather than the exchange rates in effect
during the prior period.
Non-GAAP Reconciliations

33
2016 2015 2014 2013 2012
Income from continuing operations 451.5 487.5 354.0 318.9 288.7
Interest expense 120.0 121.4 70.0 76.1 72.5
Provision for income taxes 202.2 196.6 208.5 184.8 162.7
Depreciation and amortization of fixed assets and intangible assets 211.6 167.0 95.5 85.3 65.8
Less: Nonrecurring items related to the Wood Mackenzie acquisition -- (58.6) -- -- --
Plus: Nonrecurring severance charges 2.1 -- -- -- --
Plus: Nonrecurring ESOP charge 18.8 -- -- -- --
Less: Gain on sale of equity investments (1.5) -- -- -- --
Adjusted EBITDA from continuing operations 1,004.7 913.9 728.0 665.2 589.7
Adjusted EBITDA (1)
($ millions)
1. Figures may not sum due to rounding.
Non-GAAP Reconciliations

34
Adjusted EPS (1)
($ millions, except shares and per share amounts)2016 2015 2014
Income from continuing operations 451.5 487.5 354.0
Plus: Amortization of intangibles 92.5 70.4 30.1
Less: Income tax effect on amortization of intangibles (24.1) (19.2) (11.4)
Plus: Nonrecurring items related to the Wood Mackenzie acquisition -- -45.2 --
Plus: Nonrecurring ESOP charges 18.8 -- --
Less: Income tax effect on one-time items related to the Wood Mackenzie
acquisition-- -10.7 --
Less: Income tax effect on nonrecurring ESOP charge (7.2) -- --
Adjusted net income from continuing operations 531.5 482.8 372.7
Basic adjusted EPS from continuing operations $3.16 $2.92 $2.25
Diluted adjusted EPS from continuing operations $3.11 $2.87 $2.20
Weighted average shares outstanding (in millions)
Basic 168.2 165.1 165.8
Diluted 171.2 168.5 169.1
1. Figures may not sum due to rounding.
Non-GAAP Reconciliations

35
Free Cash Flow (1)
($ millions)
2016 2015 2014
Net cash provided by operating activities 546.1 623.7 489.4
less: Net cash provided by operating activities from discontinued operations (21.4) (73.2) --
Capital expenditures (156.5) (166.1) (146.8)
less: Capital expenditures from discontinued operations 10.6 27.4 --
plus: taxes paid related to the sale of the healthcare business 100 -- --
Free Cash Flow 478.8 411.8 342.6
1. Figures may not sum due to rounding.
Non-GAAP Reconciliations