Embed Size (px)
Citation preview

AOAC Method Verification Workshop, 23 Sep 2008 1
Verification of performance
characteristics of standardised
methods
Franz Ulberth
European Commission
Joint Research Centre
Institute for Reference Materials and Measurements
http://www.irmm.jrc.be
http://ec.europa.eu/dgs/jrc/index.cfm

AOAC Method Verification Workshop, 23 Sep 2008 2
Where does the JRC fit
in the European Commission?
Commissioner Potočnik
Science and Research
Joint Research Centre (JRC)
President Barroso 27 Commission Members
Research DG (RTD)

AOAC Method Verification Workshop, 23 Sep 2008 3
The Joint Research Centre
Centre of scientific and
technical reference
for the conception,
development and
monitoring of EU policies

AOAC Method Verification Workshop, 23 Sep 2008 4
7 Institutes in 5 Member States 2800 staff
IE - Petten The Netherlands
-Institute for Energy
IRMM - Geel Belgium
- Institute for Reference Materials and
Measurements
ITU - Karlsruhe Germany
- Institute for Transuranium Elements
IPSC - IHCP - IES - Ispra Italy
- Institute for Environment and Sustainability
- Institute for Health and Consumer Protection
- Institute for the Protection and Security of the
Citizen
IPTS - Seville Spain
- Institute for Prospective Technological Studies

JRC-IRMM 2007
Mission of JRC Institute for Reference Materials
and Measurements
The mission of the IRMM is to promote a common
and reliable European measurement system
in support of EU policies
IRMM - CONFIDENCE IN MEASUREMENTS®

AOAC Method Verification Workshop, 23 Sep 2008 6
Mutual recognition of measurement data
• to avoid unnecessary duplication of efforts
• to foster confidence in certificates of analysis
• to promote international trade
– driven by ISO/IEC 17025 and accreditation bodies
– ISO/IEC 17025 requires uncertainty and traceability
statements
“confidence and acceptance of
accredited laboratory data”

AOAC Method Verification Workshop, 23 Sep 2008 7
Pillars of analytical quality control
Quality of analytical data
Measures to build trust
Re
fere
nce
ma
teri
als
Va
lida
ted
me
tho
ds
Pro
ficie
ncy te
stin
g

AOAC Method Verification Workshop, 23 Sep 2008 9
Standard
A document established
• by consensus, and
• approved by a recognized body, that provides, for
common and repeated use,
• guidelines or characteristics for activities or their
results, aimed at the
• achievement of the optimum degree of order in a
given context.
ISO/IEC Guide 2 (1996)

AOAC Method Verification Workshop, 23 Sep 2008 10
Standards as knowledge resource
• Easily available
• Complete documentation
• Proven performance
• Acceptance
• Consensus
• Market driven

AOAC Method Verification Workshop, 23 Sep 2008 11
Method performance criteria
• applicability (matrix and concentration range)
• calibration, linearity, working range, sensitivity
• limit of detection
• limit of quantification
• precision (repeatability, reproducibility)
• trueness (recovery)
• selectivity / specificity
• ruggedness
• (measurement uncertainty)

AOAC Method Verification Workshop, 23 Sep 2008 12
EURACHEM Guide: The Fitness for Purpose of Analytical
Methods: A Laboratory Guide to Method Validation and
Related Topics
• It is often assumed that standard methods can be used
straight off the shelf and the published performance data
achieved straight away by whoever uses the method. This is
not a safe assumption.
• Competence might be established in terms of the analyst’s
ability to achieve the levels of performance stated in the
method, such as repeatability, limit of detection, etc.
Performance verification of standardised methods (I)

AOAC Method Verification Workshop, 23 Sep 2008 13
Performance verification of standardised methods (II)
IUPAC Harmonized Guidelines for Single Laboratory
Validation of Methods of Analysis
• A laboratory using a collaboratively studied method,
which has been found to be fit for the intended purpose,
needs only to demonstrate that it can achieve the
performance characteristics stated in the method
• The laboratory should undertake precision studies, bias
studies (including matrix variation studies), and possibly
linearity studies
AOAC Method Verification Workshop, 23 Sep 2008 14
ALAAC Guide
The purpose of the guide is to
define the activities that are
required to fulfil method
verification based on
analytical method performance
characteristics

AOAC Method Verification Workshop, 23 Sep 2008 15
Exercise
• Design an experimental plan to demonstrate that your laboratory has
the competence to implement a standardised method for the analysis
of aflatoxin B1 in peanut butter and achieve equivalent performance
characteristics as given in AOAC 999.07
AOAC Official Method 999.07
Aflatoxin B1 and Total Aflatoxins in Peanut Butter, Pistachio Paste, Fig Paste, and
Paprika Powder
Immunoaffinity Column Liquid Chromatography with Post-Column Derivatization
First Action 1999, Final Action 2008
Test portion is either extracted with MeOH–H2O (8 + 2) or MeOH–H2O (8 + 2) plus hexane (or
cyclohexane). Ex tract is filtered, diluted with water to a specified solvent concentration, and
applied to an affinity column containing antibodies specific to aflatoxins B1, B2, G1, and G2.
Aflatoxins are removed from the affinity column with MeOH and are quantified by reversed-
phase liquid chromatography (LC) with post-column derivatization (PCD) involving bromination.
PCD is achieved with either electrochemically generated bromine (Kobra cell) or with
pyridinium hydrobromide perbromide (PBPB) and determined by fluorescence detection.

AOAC Method Verification Workshop, 23 Sep 2008 16
Considerations
• Selection of suitable test materials
• Selection of suitable reference standards
• Deviations from collaborative study testing conditions
with respect to sampling, sample pre-treatment, and
matrix effects
• Number of experiments to be carried out (e.g.
calibration, precision and bias study)
• Statistical data treatment
• Regulatory aspects

AOAC Method Verification Workshop, 23 Sep 2008 17
Work flow
Produce a list of potential
deviations from collab
study conditions
Are
conditions
equivalent?
Evaluate/take into
account/correct
influence of
deviating
conditions
Do test items vary
with respect to
composition and
analyte level(s)
Carry out precision and
study on a
representative test item
(matrix/analyte(s) at one
or several levels)
Carry out precision and
study on several
representative test items
(different
matrices/analyte(s) at
one or several levels)
NO
YES
YESNO

AOAC Method Verification Workshop, 23 Sep 2008 18
Work flow (cont’d)
Suitable
reference
material(s)
available?
Blank matrix(ces)
available for
spiking
Replicate analyses of
reference material(s)
Replicate analyses of
spiked blank matrix(ces)
Replicate analyses of
spiked sample(s)
NO
NO
YES
YES

AOAC Method Verification Workshop, 23 Sep 2008 19
Sources of suitable reference materials
Certified Reference Materials
• NIST http://ts.nist.gov/measurementservices/referencematerials/index.cfm
• IRMM http://irmm.jrc.ec.europa.eu/html/reference_materials_catalogue/catalogue/index.htm
• COMAR http://www.comar.bam.de/
Quality Control Materials
• FAPAS http://www.fapas.com/tmsales.cfm
AOAC Method Verification Workshop, 23 Sep 2008 20
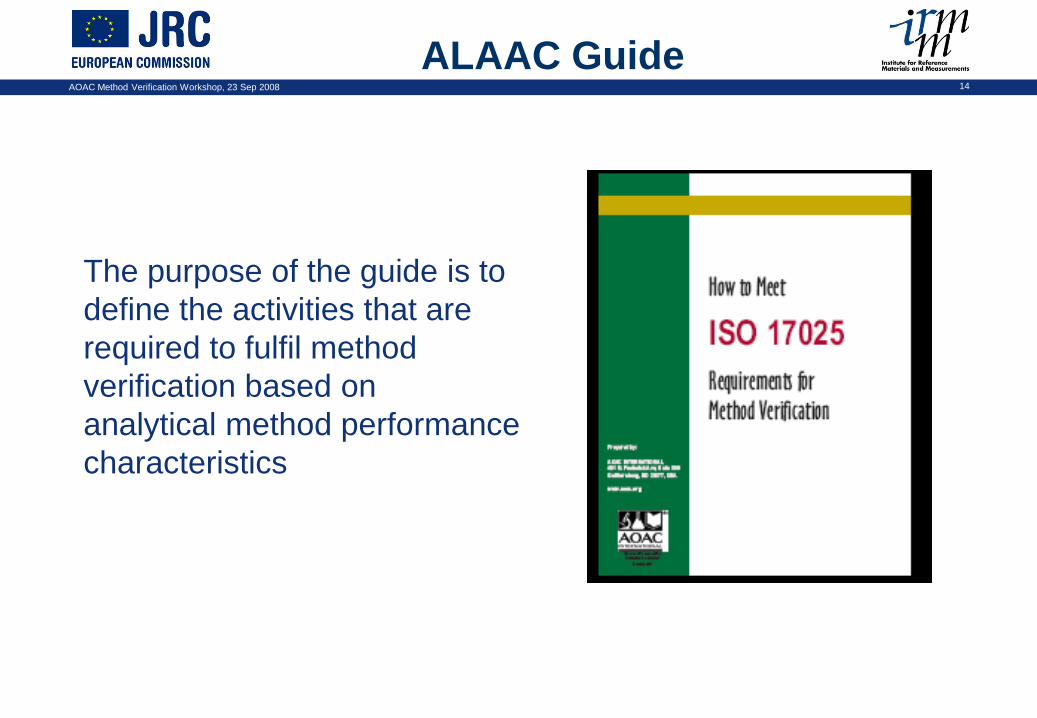
Boundary conditions
• Actual testing conditions do not differ to a large extent
from those during the collaborative study:
– Sample pre-treatment
– Instrumentation
– Immunoaffinity columns
• Peanut butter considered a uniform product
• Blank materials for recovery (spiking) experiments and
certified calibration materials available
• Well characterised quality control materials available (low
level and high level contamination)

AOAC Method Verification Workshop, 23 Sep 2008 21
Study design
Calibration using CRM solutions
Evaluation of calibration function
Precision study: analysis of blank and spiked
materials, and of naturally contaminated materials
Bias study: analysis of well characterised naturally
contaminated materials
Statistical evaluation

AOAC Method Verification Workshop, 23 Sep 2008 22
Selectivity/Specificity
Typical chromatogram of aflatoxins in pistachio paste after immunoaffinity clean-up
(contamination level 1 ng/g aflatoxin B1)
54.5
55
55.5
56
56.5
57
57.5
58
58.5
59
59.5
0 2 4 6 8 10 12 14 16
time in min
mV
B1
B2
G1
Operating conditions:
Injection volume: 200 µL
Column: LC-18 (25 cm and 4.6 mm inner diameter)
Flow rate: 1 mL/minute
Mobile phase: water-methanol-acetonitrile (6+3+2 [v/v/v]),
containing 120 mg KBr and 350 µL HNO3 of (c {HNO3}=4 Mol/L)
Derivatisation: electrochemical bromination (KOBRA-cell)
Detection: Fluorescence (Ex.:365 nm, Em.:435 nm)

AOAC Method Verification Workshop, 23 Sep 2008 23
Aflatoxin B1 in peanut butter by HPLC
Calibration
- 5 levels
- 2 dilutions per level
- 2 injections/dilution
Conc.
[ng/ml]Inject.
R. Time
[min]Peak Area Average RSD %
0.404 1 10.83 185287 187855 1.10
0.404 2 10.75 190367
0.404 1 10.88 187967
0.404 2 10.86 187797
1.212 1 10.79 576293 580462 1.23
1.212 2 10.81 576428
1.212 1 11.02 577982
1.212 2 10.97 591145
2.02 1 10.74 969239 980551 2.14
2.02 2 10.82 960628
2.02 1 11.05 1008660
2.02 2 10.98 983677
2.828 1 10.74 1346150 1364427 1.82
2.828 2 10.78 1339951
2.828 1 11.03 1387377
2.828 2 11.03 1384228
3.636 1 10.72 1714052 1749339 2.09
3.636 2 10.76 1722359
3.636 1 11.01 1788018
3.636 2 11.03 1772928
AOAC Method Verification Workshop, 23 Sep 2008 24
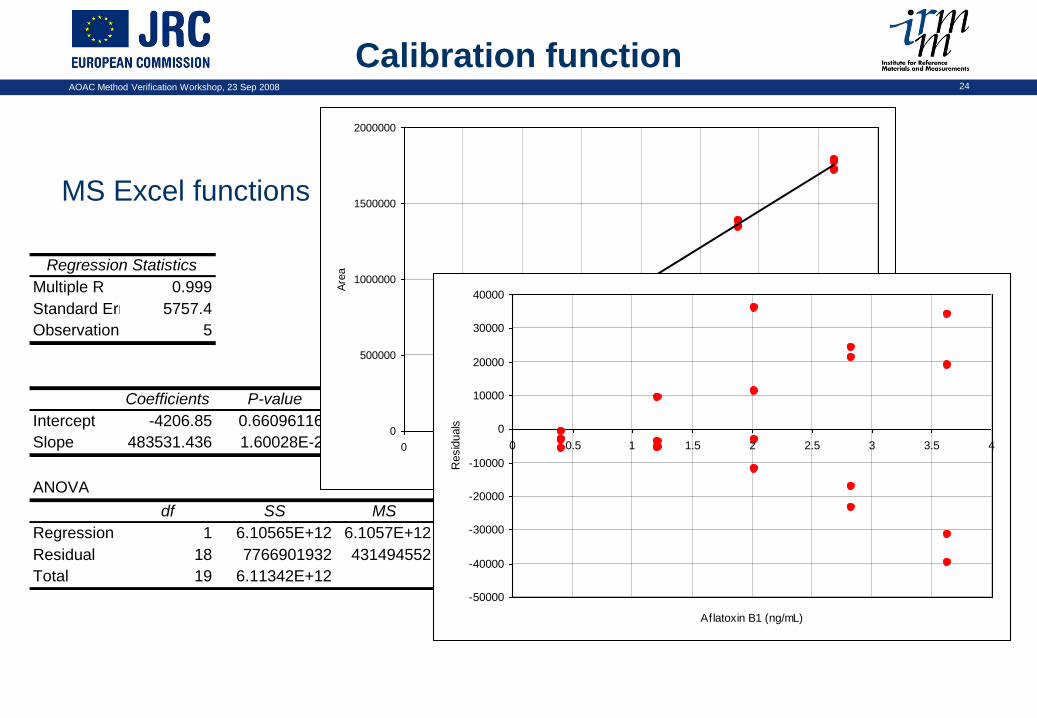
Calibration function
MS Excel functions
Regression Statistics
Multiple R 0.999
Standard Error 5757.4
Observations 5
Coefficients P-value Lower 95% Upper 95%
Intercept -4206.85 0.660961167 -24026.4358 15612.73576
Slope 483531.436 1.60028E-27 474991.468 492071.4035
ANOVA
df SS MS F Significance F
Regression 1 6.10565E+12 6.1057E+12 14150.01252 1.6003E-27
Residual 18 7766901932 431494552
Total 19 6.11342E+12
0
500000
1000000
1500000
2000000
0 0.5 1 1.5 2 2.5 3 3.5 4
Aflatoxin B1 (ng/mL)
Are
a
-50000
-40000
-30000
-20000
-10000
0
10000
20000
30000
40000
0 0.5 1 1.5 2 2.5 3 3.5 4
Aflatoxin B1 (ng/mL)
Resid
uals

AOAC Method Verification Workshop, 23 Sep 2008 25
Weighted regression
Weights=1/s2
Conc.
[ng/ml]Average Variance
w w*x w*y (x-xw) (y-yw) w(x-xw)^2 w(x-xw)(y-yw)
0.404 187855 4.31E+06 232.19 93.80 43617187.2 -0.100436 -48833.97382 2.342140852 1138797.74
1.212 580462 5.13E+07 19.49 23.62 11312799 0.707564 343773.5262 9.757262665 4740613.673
2.02 980551 4.42E+08 2.26 4.57 2220492.49 1.515564 743862.5262 5.201490452 2552972.543
2.828 1364427 6.17E+08 1.62 4.58 2210307.01 2.323564 1127738.026 8.746047147 4244879.432
3.636 1749339 1.34E+09 0.75 2.71 1303661.42 3.131564 1512650.776 7.308250341 3530130.565
Sum 256.31 129 60664447 33 16207394
Slope 485903.191
Intercept -8418.4836
sy.x.w 7929.92987

AOAC Method Verification Workshop, 23 Sep 2008 26
Comparison of calibration models
• Unweighted regression
• Weighted regression
Average
(area) Known Predicted U U% Lower Upper
187855 0.404 0.397 0.0350 8.81 0.362 0.432
580462 1.212 1.209 0.0281 2.33 1.181 1.237
980551 2.020 2.037 0.0254 1.25 2.011 2.062
1364427 2.828 2.830 0.0281 0.99 2.802 2.859
1749339 3.636 3.627 0.0348 0.96 3.592 3.661
Average
(area) Known Predicted U U% Lower Upper
187855 0.404 0.404 0.0350 8.66 0.369 0.439
580462 1.212 1.212 0.0354 2.92 1.177 1.247
980551 2.020 2.035 0.0375 1.84 1.998 2.073
1364427 2.828 2.825 0.0410 1.45 2.784 2.866
1749339 3.636 3.617 0.0450 1.24 3.572 3.662
2
2
0
11
)xx(
)xx(
np*
b
s)c(u
i
pred

AOAC Method Verification Workshop, 23 Sep 2008 27
Spiking (recovery) experiments
Design:
5 Sub-samples of blank material
5 Sub-samples spiked at 1.01 ng/g
(low spike)
5 Sub-samples spiked at 4.04 ng/g
(high spike)
Sample Inject.R. Time
[min]Peak Area
Conc.
[ng/g]
Recov
ery
[%]
Average
Recovery
[%]
SDRSD
[%]
Spike 1 1 10.88 185964 0.81 80 84 2.07 2.47
Spike 1 2 10.84 191822 0.83 82
Spike 2 1 10.84 195155 0.85 84
Spike 2 2 10.82 198041 0.86 85
Spike 3 1 10.83 194510 0.84 84
Spike 3 2 10.84 205081 0.89 88
Spike 4 1 10.84 195261 0.85 84
Spike 4 2 10.83 198270 0.86 85
Spike 5 1 10.77 192658 0.84 83
Spike 5 2 10.86 192735 0.84 83
Spike 6 1 10.88 781332 3.30 82 83 2.08 2.52
Spike 6 2 10.81 816842 3.45 85
Spike 7 1 10.78 803146 3.39 84
Spike 7 2 10.89 799423 3.37 83
Spike 8 1 10.83 758903 3.20 79
Spike 8 2 10.75 808367 3.41 84
Spike 9 1 10.86 782667 3.30 82
Spike 9 2 10.85 789750 3.33 82
Spike 10 1 10.85 760450 3.21 79
Spike 10 2 10.81 809207 3.41 85
Low spike High spike
Mean [ng/g] 0.85 3.34
SD 0.021 0.084
RSD 2.47 2.52
Recovery (%) 84 83

AOAC Method Verification Workshop, 23 Sep 2008 28
Naturally contaminated material
Design:
4 sub-samples of
well characterised
peanut butter
containing 0.8 and
3.4 ng/g Afla B1
Sample Inject.R. Time
[min]Peak Area
Conc.
[ng/g]
Recovery
[%]
Average
Recovery
[%]
SDRSD
[%]
nat. cont. 1 1 10.61 27535 0.76 95 103 5.39 5.24
nat. cont. 1 2 10.64 32152 0.88 110
nat. cont. 2 1 10.62 30517 0.84 104
nat. cont. 3 1 10.59 28790 0.79 99
nat. cont. 4 1 10.59 29247 0.80 100
nat. cont. 4 2 10.58 30867 0.84 106
nat. cont. 5 1 10.63 28643 0.79 98
nat. cont. 5 2 10.59 32044 0.88 109
nat. cont. 6 1 10.64 118451 3.09 91 93 3.80 4.09
nat. cont. 6 2 10.61 123997 3.23 95
nat. cont. 7 1 10.59 112742 2.94 87
nat. cont. 7 2 10.67 120109 3.13 92
nat. cont. 8 1 10.62 117933 3.08 91
nat. cont. 8 2 10.69 129078 3.36 99
nat. cont. 9 1 10.69 122073 3.18 94
nat. cont. 9 2 10.63 125263 3.27 96
Low High
Mean [ng/g] 0.82 3.16
SD 0.008 0.087
RSD 0.92 2.74
Recovery (%) 103 93

AOAC Method Verification Workshop, 23 Sep 2008 29
Verification of precision
To demonstrate that repeatability is consistent with the
repeatability standard deviation obtained in the course of the
collaborative exercise
Mean [ng/g] # Labs sr RSDr Mean [ng/g] # Repl. sr RSDr F Fcrit (95 %)
Spiked 0.9 15 0.09 10 0.85 5 0.02 2.5 0.233 4.56
Spiked 3.6 13 0.11 3 3.34 5 0.08 2.5 0.764 4.86
Contaminated 0.8 15 0.05 6 0.82 4 0.01 1.0 0.160 4.89
Contaminated 1.5 14 0.10 7
Contaminated 3.4 14 0.13 4 3.16 4 0.09 2.8 0.669 5.04
AOAC 999.07 Verification study

AOAC Method Verification Workshop, 23 Sep 2008 30
Demonstrating control of bias
To demonstrate that bias of the method is under control
Mean [ng/g] # Labs sr sR Mean [ng/g] # Repl. sr Δ 2σD
Contaminated 0.8 15 0.05 0.26 0.82 4 0.01 0.02 0.51
Contaminated 3.4 14 0.13 0.65 3.16 4 0.09 0.24 1.28
AOAC 999.07 Verification study
|Δ| < 2√ (sR2 - sr
2 + sw2/n)

AOAC Method Verification Workshop, 23 Sep 2008 31
Conclusions
• Verification gives objective proof that laboratory has
competence to carry out standardised procedure in
compliance with specified performance criteria
• Intended purpose of the method governs
performance criteria to be verified
• Verification results can be used to estimate
measurement uncertainty
AOAC Method Verification Workshop, 23 Sep 2008 32
www.jrc.cec.eu.int
www.jrc.irmm.be
Useful links and contacts