Embed Size (px)
Citation preview
Verification of
Efficiency Vermont's
Energy Efficiency Portfolio
for the ISO-NE
Forward Capacity Market
Final Report
Prepared for the
Vermont Department of
Public Service
July 12, 2012
Prepared by
West Hill Energy and Computing, Inc. 205 Main Street Brattleboro, VT
with Lexicon Energy Consulting,
Cx Associates, GDS Associates, Energy Resource Solutions and Carole Welch
i
Table of Contents 1 Introduction ............................................................................................................................. 1
2 Process .................................................................................................................................... 2
3 Methods................................................................................................................................... 3
3.1 Sampling........................................................................................................................... 3
3.1.2 Stratification .............................................................................................................. 4
3.2 Analysis and Calculation of Realization Rates ................................................................ 6
3.3 Attrition ............................................................................................................................ 7
4 Results ..................................................................................................................................... 9
4.1 Cross-Program Issue ....................................................... Error! Bookmark not defined. 4.2 Custom C&I Results ...................................................................................................... 13
4.3 C&I Stipulated Lighting ................................................................................................. 14
4.4 Residential Results ......................................................................................................... 15
4.5 Compliance with ISO-NE Standards ............................................................................. 16
5 Conclusions ........................................................................................................................... 18
6 References ............................................................................................................................. 19

ii
List of Appendices Appendix A: Table of Realization Rates by Project Appendix B: Sampling Plan Memo Appendix C: Blended C&I Prescriptive Coincidence Factors Appendix D: Cooling Bonus Memo Appendix E: Individual Project Reviews and Results: Retrofit Projects Appendix F: Individual Project Reviews and Results: New Construction and Market Opportunity
Introduction FCM Verification of EVT's Portfolio
July 12, 2012 1 West Hill Energy and Computing
1 Introduction In 2006, the Independent System Operator of the New England electric grid (ISO-NE) created a Forward Capacity Market (FCM) to ensure that the region has sufficient capacity to meet its peak demand needs. This market-based initiative allows for demand resources, including energy efficiency, to compete directly with generation resources to provide capacity. In order to participate in the market, providers of energy efficiency resources must demonstrate that their efficiency savings are verified in compliance with the ISO-NE standards established for this purpose.1 Efficiency Vermont (EVT) and Burlington Electric Department (BED) bid their respective efficiency program portfolios into the forward capacity market, and submitted detailed measurement and verification (M&V) plans that delineated how the evaluation process in Vermont will comply with ISO-NE standards. In both evaluation plans, the Vermont Department of Public Service (Department) was charged with conducting the independent evaluation required by the ISO-NE standards.
The methods available to the Department to evaluate EVT and BED’s FCM claims are circumscribed by both the ISO-NE standards and the EVT and BED M&V plans. These standards are designed to result in a high degree of reliability for the resources purchased through the forward capacity market and represent a far more rigorous type of evaluation than has previously been conducted on Vermont’s efficiency portfolios.
West Hill Energy and Computing was retained by the Department to provide independent verification of the custom commercial and industrial (C&I) efficiency initiatives for EVT and BED within the context of the FCM. With the assistance of four engineering firms, Cx Associates, GDS Associates, Lexicon Energy Consulting and Energy Resource Solutions, West Hill Energy implemented the M&V Plan, including providing statistical analysis, site-specific M&V and overall impact evaluation of EVT’s efficiency portfolio.
This report describes the evaluation of EVT's FCM bid and the results of this verification process. It also provides the documentation to support the Annual Certification of Accuracy of Measurement and Verification Documents, as specified Section 14.2 in the ISO Manual (M-MVDR, Revision 2, June 1, 2010) and in Section 12-B of EVT's M&V Plan (9106 ExCap M&V Plan Update Sept 15, 2010 and 2845_FCA5_M&VPlan, 10/15/2010 ).
The evaluation was designed to determine the appropriate realization rates to be applied to EVT's estimated savings. When applied, the resulting savings represent EVT’s verified savings. The realization rates given in this document will be used to adjust EVT's savings reported to NE-ISO for the FCM from July 1, 2012 until the completion of the next evaluation cycle.
The realization rates presented in this document were provided to Efficiency Vermont in May of 2012, and have been in use since that time. The remainder of this report is divided into the following sections: process, methods, results and conclusions. The components of EVT’s portfolio are described in EVT’s 2010 Annual Report.2
1 ISO New England Manual for Measurement and Verification of Demand Reduction Value from Demand Resources Manual M-MVDR, Revision: 2, Effective Date: June 1, 2010, pg. INT-3 2 Efficiency Vermont Annual Report 2010, February, 2012; available at www.efficiencyvermont.com.
Process FCM Verification of EVT's Portfolio
July 12, 2012 2 West Hill Energy and Computing
2 Process
As with the initial FCM evaluation completed in 2010, the Department had the primary responsibility the overall management of the verification process, including development and implementation of the sampling plan and final verification of each project in the sample. The C&I projects were stratified by project type (retrofit versus new construction/market opportunity) and by the size of the project in terms of the claimed kW peak reduction. For the projects that fell into the randomly selected strata, the Department's contracted engineers reviewed the project documentation, developed metering plans where appropriate, installed and retrieved the meters, analyzed the meter data, and calculated the verified savings.
EVT conducted metering of the very large projects in the census strata and provided the metered data to the Department for analysis. Each large project was also assigned to a review engineer on the Department's evaluation team. The process included a collaborative approach to the development of site-specific metering plans, with input from the Department's contracted engineers and from EVT. The engineer assigned by the Department reviewed EVT’s project documentation, analyzed any metering data that was collected by EVT, and independently calculated the verified savings for the project. Based on the study conducted by RLW Analytics3 regarding load shapes for commercial lighting, lighting applications that could use stipulated coincidence factors were identified and these projects did not need to be metered.
The verified savings were independently calculated for each project (large, medium and small) in the sample. Site-specific project reports were developed, and sent to EVT to provide an opportunity for clarification and a final check for errors and omissions. The project reports were then finalized and are included in Appendix E and Appendix F of this report. The project-specific realization rates are listed in Appendix A.
3 Coincidence Factor Study Residential and Commercial & Industrial Lighting Measures. Prepared for New England State Program Working Group (SPWG) by RLW Analytics, Middletown, CT. Spring, 2007
Methods FCM Verification of EVT's Portfolio
July 12, 2012 3 West Hill Energy and Computing
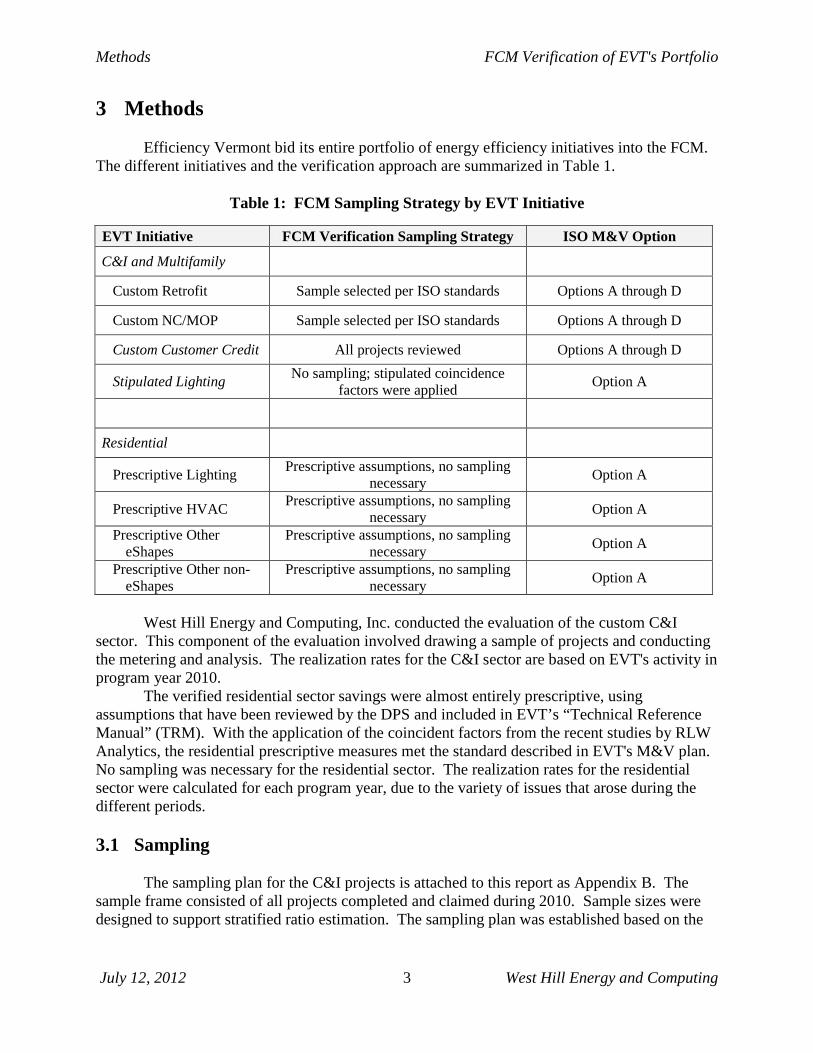
3 Methods Efficiency Vermont bid its entire portfolio of energy efficiency initiatives into the FCM. The different initiatives and the verification approach are summarized in Table 1.
Table 1: FCM Sampling Strategy by EVT Initiative
EVT Initiative FCM Verification Sampling Strategy ISO M&V Option C&I and Multifamily
Custom Retrofit Sample selected per ISO standards Options A through D
Custom NC/MOP Sample selected per ISO standards Options A through D
Custom Customer Credit All projects reviewed Options A through D
Stipulated Lighting No sampling; stipulated coincidence factors were applied Option A
Residential
Prescriptive Lighting Prescriptive assumptions, no sampling necessary Option A
Prescriptive HVAC Prescriptive assumptions, no sampling necessary Option A
Prescriptive Other eShapes
Prescriptive assumptions, no sampling necessary Option A
Prescriptive Other non-eShapes
Prescriptive assumptions, no sampling necessary Option A
West Hill Energy and Computing, Inc. conducted the evaluation of the custom C&I sector. This component of the evaluation involved drawing a sample of projects and conducting the metering and analysis. The realization rates for the C&I sector are based on EVT's activity in program year 2010. The verified residential sector savings were almost entirely prescriptive, using assumptions that have been reviewed by the DPS and included in EVT’s “Technical Reference Manual” (TRM). With the application of the coincident factors from the recent studies by RLW Analytics, the residential prescriptive measures met the standard described in EVT's M&V plan. No sampling was necessary for the residential sector. The realization rates for the residential sector were calculated for each program year, due to the variety of issues that arose during the different periods. 3.1 Sampling The sampling plan for the C&I projects is attached to this report as Appendix B. The sample frame consisted of all projects completed and claimed during 2010. Sample sizes were designed to support stratified ratio estimation. The sampling plan was established based on the
Methods FCM Verification of EVT's Portfolio
July 12, 2012 4 West Hill Energy and Computing
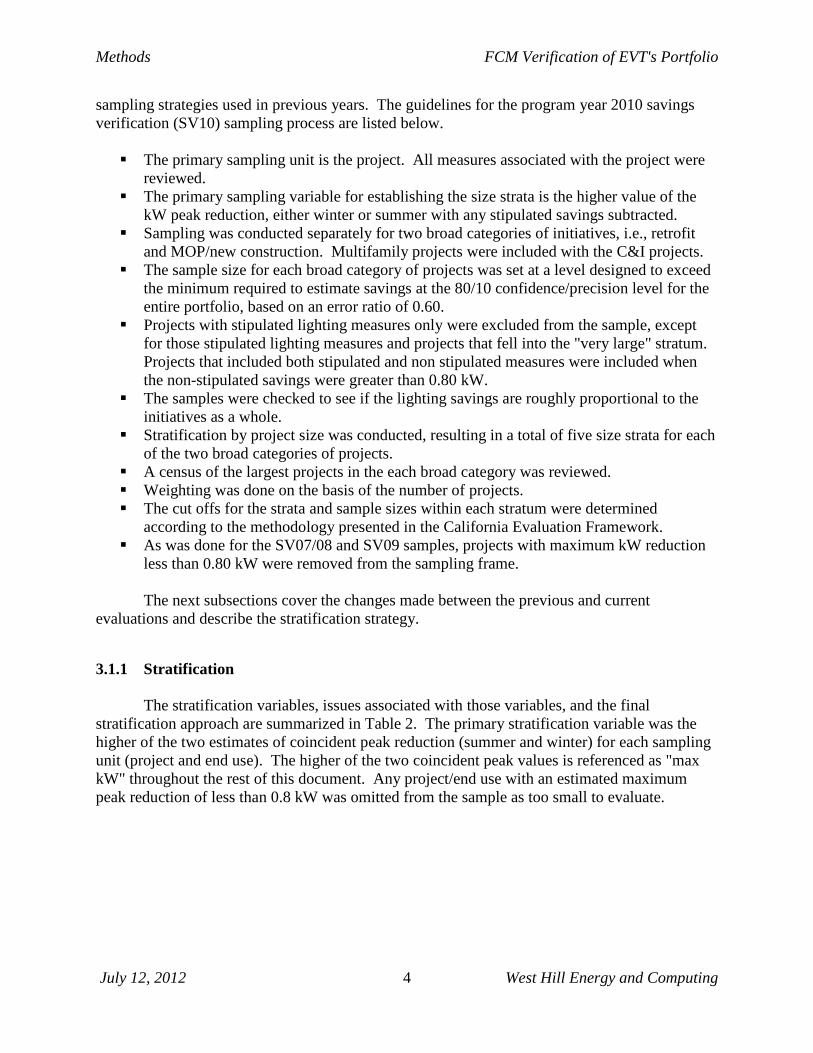
sampling strategies used in previous years. The guidelines for the program year 2010 savings verification (SV10) sampling process are listed below. The primary sampling unit is the project. All measures associated with the project were
reviewed. The primary sampling variable for establishing the size strata is the higher value of the
kW peak reduction, either winter or summer with any stipulated savings subtracted. Sampling was conducted separately for two broad categories of initiatives, i.e., retrofit
and MOP/new construction. Multifamily projects were included with the C&I projects. The sample size for each broad category of projects was set at a level designed to exceed
the minimum required to estimate savings at the 80/10 confidence/precision level for the entire portfolio, based on an error ratio of 0.60.
Projects with stipulated lighting measures only were excluded from the sample, except for those stipulated lighting measures and projects that fell into the "very large" stratum. Projects that included both stipulated and non stipulated measures were included when the non-stipulated savings were greater than 0.80 kW.
The samples were checked to see if the lighting savings are roughly proportional to the initiatives as a whole.
Stratification by project size was conducted, resulting in a total of five size strata for each of the two broad categories of projects.
A census of the largest projects in the each broad category was reviewed. Weighting was done on the basis of the number of projects. The cut offs for the strata and sample sizes within each stratum were determined
according to the methodology presented in the California Evaluation Framework. As was done for the SV07/08 and SV09 samples, projects with maximum kW reduction
less than 0.80 kW were removed from the sampling frame. The next subsections cover the changes made between the previous and current evaluations and describe the stratification strategy.
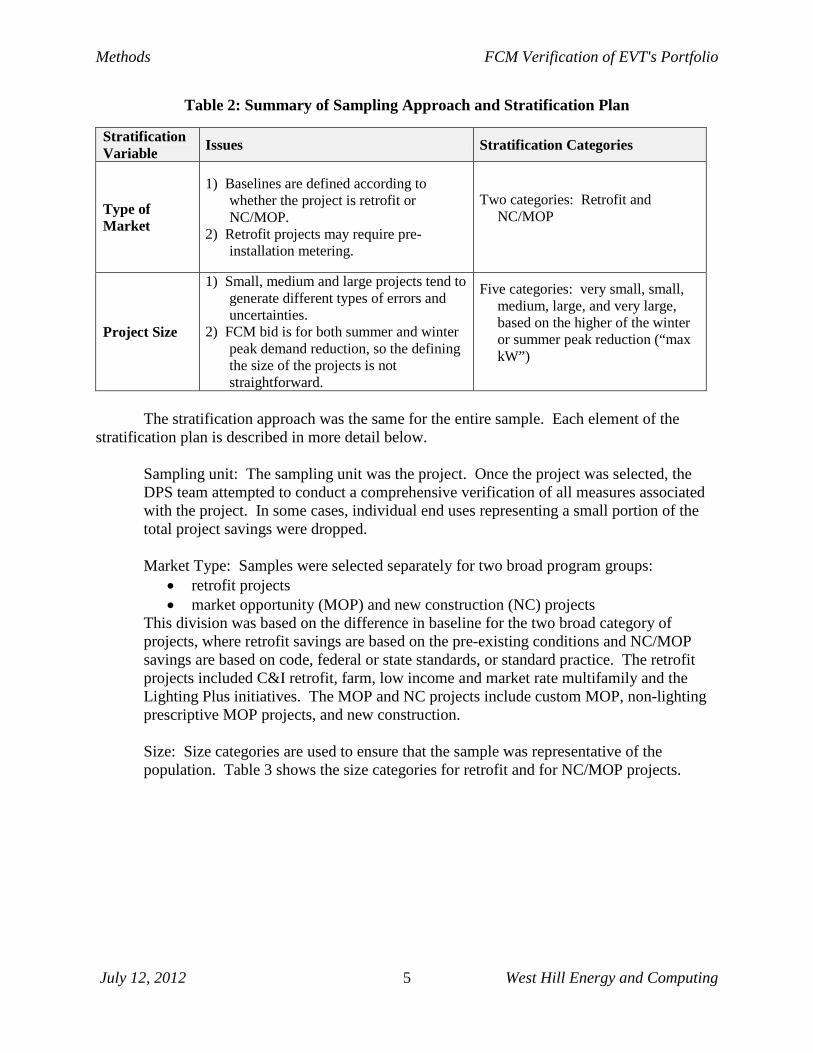
3.1.1 Stratification The stratification variables, issues associated with those variables, and the final stratification approach are summarized in Table 2. The primary stratification variable was the higher of the two estimates of coincident peak reduction (summer and winter) for each sampling unit (project and end use). The higher of the two coincident peak values is referenced as "max kW" throughout the rest of this document. Any project/end use with an estimated maximum peak reduction of less than 0.8 kW was omitted from the sample as too small to evaluate.
Methods FCM Verification of EVT's Portfolio
July 12, 2012 5 West Hill Energy and Computing
Table 2: Summary of Sampling Approach and Stratification Plan
Stratification Variable Issues Stratification Categories
Type of Market
1) Baselines are defined according to whether the project is retrofit or NC/MOP.
2) Retrofit projects may require pre-installation metering.
Two categories: Retrofit and NC/MOP
Project Size
1) Small, medium and large projects tend to generate different types of errors and uncertainties.
2) FCM bid is for both summer and winter peak demand reduction, so the defining the size of the projects is not straightforward.
Five categories: very small, small, medium, large, and very large, based on the higher of the winter or summer peak reduction (“max kW”)
The stratification approach was the same for the entire sample. Each element of the stratification plan is described in more detail below.
Sampling unit: The sampling unit was the project. Once the project was selected, the DPS team attempted to conduct a comprehensive verification of all measures associated with the project. In some cases, individual end uses representing a small portion of the total project savings were dropped. Market Type: Samples were selected separately for two broad program groups:
• retrofit projects • market opportunity (MOP) and new construction (NC) projects
This division was based on the difference in baseline for the two broad category of projects, where retrofit savings are based on the pre-existing conditions and NC/MOP savings are based on code, federal or state standards, or standard practice. The retrofit projects included C&I retrofit, farm, low income and market rate multifamily and the Lighting Plus initiatives. The MOP and NC projects include custom MOP, non-lighting prescriptive MOP projects, and new construction. Size: Size categories are used to ensure that the sample was representative of the population. Table 3 shows the size categories for retrofit and for NC/MOP projects.
Methods FCM Verification of EVT's Portfolio
July 12, 2012 6 West Hill Energy and Computing
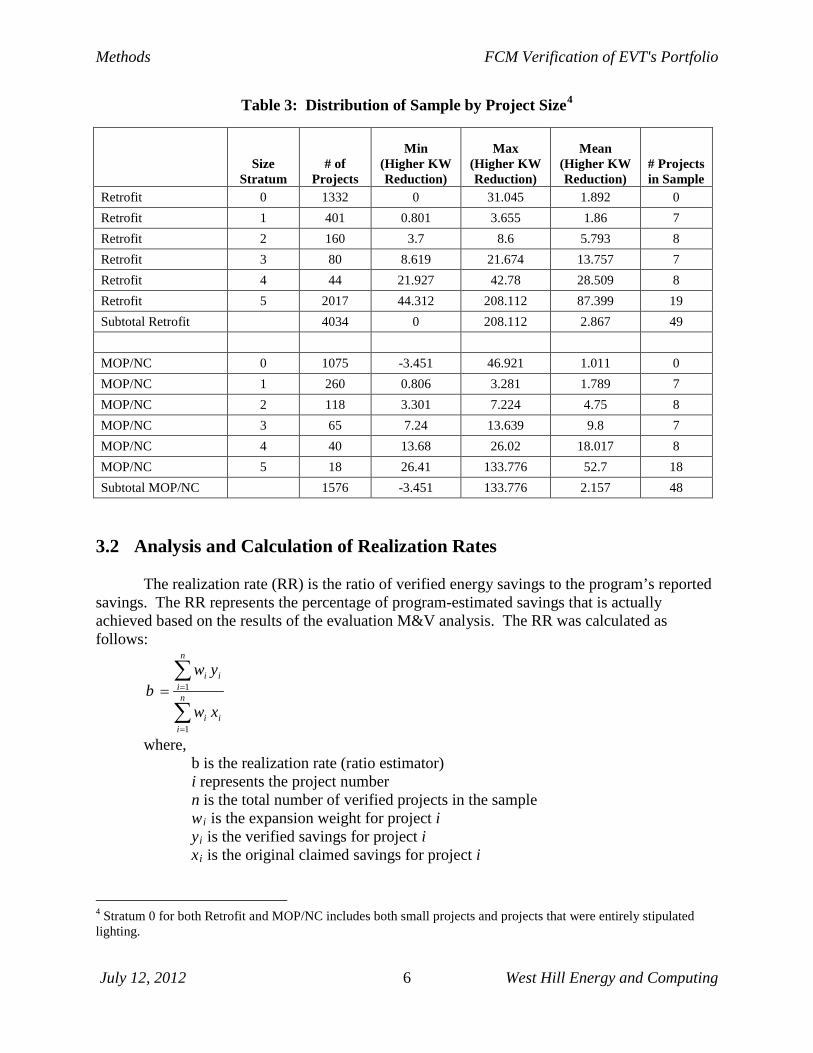
Table 3: Distribution of Sample by Project Size4
Size Stratum
# of Projects
Min (Higher KW Reduction)
Max (Higher KW Reduction)
Mean (Higher KW Reduction)
# Projects in Sample
Retrofit 0 1332 0 31.045 1.892 0 Retrofit 1 401 0.801 3.655 1.86 7 Retrofit 2 160 3.7 8.6 5.793 8 Retrofit 3 80 8.619 21.674 13.757 7 Retrofit 4 44 21.927 42.78 28.509 8 Retrofit 5 2017 44.312 208.112 87.399 19 Subtotal Retrofit 4034 0 208.112 2.867 49 MOP/NC 0 1075 -3.451 46.921 1.011 0 MOP/NC 1 260 0.806 3.281 1.789 7 MOP/NC 2 118 3.301 7.224 4.75 8 MOP/NC 3 65 7.24 13.639 9.8 7 MOP/NC 4 40 13.68 26.02 18.017 8 MOP/NC 5 18 26.41 133.776 52.7 18 Subtotal MOP/NC 1576 -3.451 133.776 2.157 48
3.2 Analysis and Calculation of Realization Rates The realization rate (RR) is the ratio of verified energy savings to the program’s reported savings. The RR represents the percentage of program-estimated savings that is actually achieved based on the results of the evaluation M&V analysis. The RR was calculated as follows:
∑
∑
=
== n
iii
n
iii
xw
ywb
1
1
where, b is the realization rate (ratio estimator) i represents the project number n is the total number of verified projects in the sample
wi is the expansion weight for project i yi is the verified savings for project i xi is the original claimed savings for project i
4 Stratum 0 for both Retrofit and MOP/NC includes both small projects and projects that were entirely stipulated lighting.
Methods FCM Verification of EVT's Portfolio
July 12, 2012 7 West Hill Energy and Computing
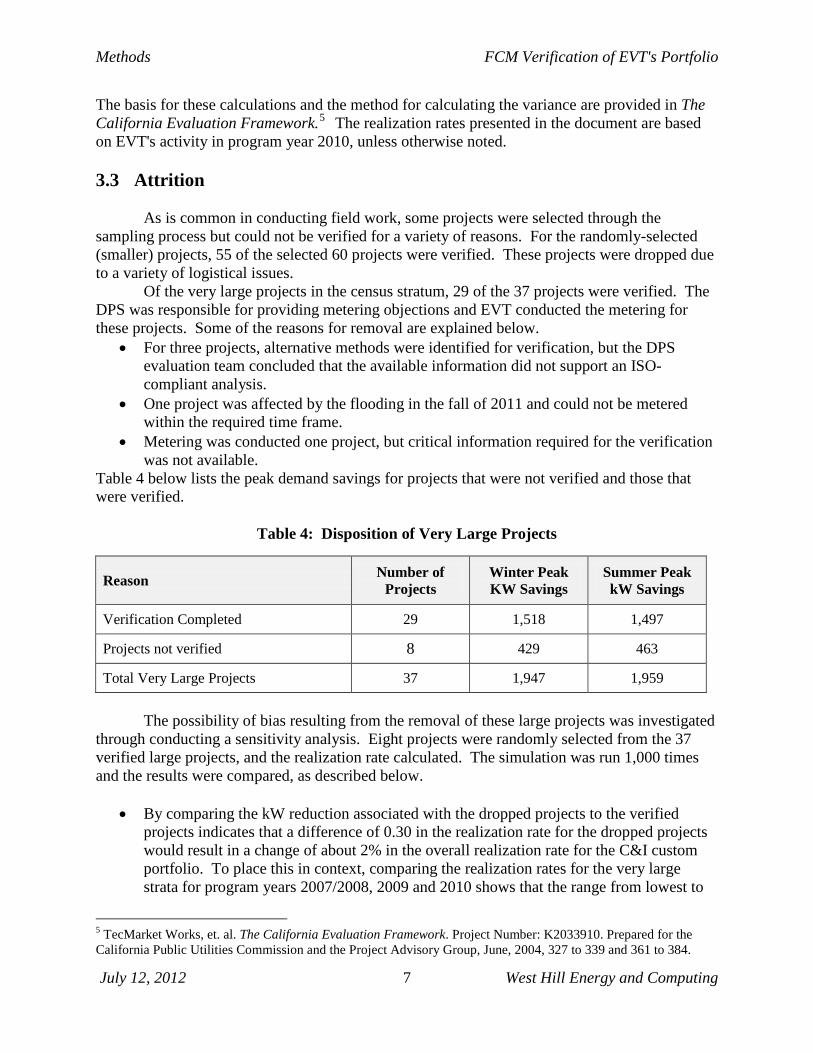
The basis for these calculations and the method for calculating the variance are provided in The California Evaluation Framework.5 The realization rates presented in the document are based on EVT's activity in program year 2010, unless otherwise noted. 3.3 Attrition As is common in conducting field work, some projects were selected through the sampling process but could not be verified for a variety of reasons. For the randomly-selected (smaller) projects, 55 of the selected 60 projects were verified. These projects were dropped due to a variety of logistical issues. Of the very large projects in the census stratum, 29 of the 37 projects were verified. The DPS was responsible for providing metering objections and EVT conducted the metering for these projects. Some of the reasons for removal are explained below.
• For three projects, alternative methods were identified for verification, but the DPS evaluation team concluded that the available information did not support an ISO-compliant analysis.
• One project was affected by the flooding in the fall of 2011 and could not be metered within the required time frame.
• Metering was conducted one project, but critical information required for the verification was not available.
Table 4 below lists the peak demand savings for projects that were not verified and those that were verified.
Table 4: Disposition of Very Large Projects
Reason Number of Projects
Winter Peak KW Savings
Summer Peak kW Savings
Verification Completed 29 1,518 1,497
Projects not verified 8 429 463
Total Very Large Projects 37 1,947 1,959 The possibility of bias resulting from the removal of these large projects was investigated through conducting a sensitivity analysis. Eight projects were randomly selected from the 37 verified large projects, and the realization rate calculated. The simulation was run 1,000 times and the results were compared, as described below.
• By comparing the kW reduction associated with the dropped projects to the verified projects indicates that a difference of 0.30 in the realization rate for the dropped projects would result in a change of about 2% in the overall realization rate for the C&I custom portfolio. To place this in context, comparing the realization rates for the very large strata for program years 2007/2008, 2009 and 2010 shows that the range from lowest to
5 TecMarket Works, et. al. The California Evaluation Framework. Project Number: K2033910. Prepared for the California Public Utilities Commission and the Project Advisory Group, June, 2004, 327 to 339 and 361 to 384.
Methods FCM Verification of EVT's Portfolio
July 12, 2012 8 West Hill Energy and Computing
highest is less than 0.17, suggesting that a variation in realization rate of 0.30 for the dropped projects in comparison to the verified projects would be highly unusual. For summer kW reduction, 100% of the simulations resulted in estimated realization rates for the dropped projects that were within 0.30 of the actual realization rate for the verified projects. Winter kW reduction was more variable, with 93% of the simulations meeting this criteria.
• The average realization rate for the simulation of the eight randomly-selected very large projects fell within 0.025 of the realization rate for the verified projects, suggesting that the realization rates for eight unverified projects would have to be radically different from the very large verified projects to achieve a difference of 0.30 or more.
Given the results of this sensitivity analysis and the fact that EVT used the same strategies and QC process for estimating savings from both the unverified and verified projects, it seems unlikely that the realization rate for the ten unverified projects would be more than 0.30 above or below the realization rate for the verified projects, suggesting that bias due to the removal of these projects from the calculation of the realization rate is quite small or nonexistent. The sampling weights were adjusted for non-response using post stratification to ensure that the results of the analysis were correctly applied to the population.6
6 Sampling: Design and Analysis. Lohr, Sharon L. Duxbury Press, 1999, pages 268-269.
Results FCM Verification of EVT's Portfolio
July 12, 2012 9 West Hill Energy and Computing
4 Results To determine the realization rates and calculating relative precision, EVT's portfolio was divided into components based on the verification strategy and source of the coincident peak factors. Each of these components is defined below.
Custom Retrofit: This category includes projects associated with EVT's retrofit initiatives in the business and multifamily sectors. Peak demand savings were determined through sampling and verified by the Department of Public Service as part of the C&I custom evaluation. Measures using stipulated coincidence factors from the RLW lighting study were removed from the sample frame. Custom NC/MOP: Projects associated with EVT's new construction and market opportunities initiatives in the business and multifamily sectors are covered in this component of EVT's portfolio. The same process for verification was used as described above for the C&I retrofit component of EVT's portfolio. Customer Credit: The Customer Credit program encompasses the efficiency improvements at a large industrial firm. The firm installs the efficiency measures and provides documentation to EVT. Customer credit projects were verified in the 2007/2008 evaluation cycle and the realization rates determined from that evaluation were applied to the 2010 project. The 2007/2008 evaluation was conducted in 2010 (within the last five years) and meets the rigorous ISO-NE standards for FCM. In addition, the process for implementing and claiming the Customer Credit projects remained consistent from 2007 through 2010. Stipulated Lighting: Custom and prescriptive lighting measures in business types covered by the RLW Lighting Study prepared for the NE utilities in accordance with ISO-NE FCM guidelines. C&I Measures Not Sampled: These are the very small C&I custom projects (winter and summer peak kW of less than 0.80 kW). Given that these projects in aggregate represented a small percentage of EVT's portfolio (less than 1%) and would be just as costly to verify as other projects, they were excluded from the C&I sample frame. The weighted average realization rate from the C&I Retrofit and NC/MOP components was applied these measures. Since EVT uses the same procedures for estimating savings and conducting QC for these projects as the sampled projects, it seems reasonable to apply the same realization rate. Residential Prescriptive Lighting: This component represents the lighting products sold through the Efficient Products Program. The source of the coincidence factors is the RLW Analytics lighting study (2007). Residential Prescriptive Lighting with Cooling Bonus: This component represents the percentage of lighting products sold through the Efficient Products Program that were purchased by commercial establishments, which are assumed to have air conditioning
Results FCM Verification of EVT's Portfolio
July 12, 2012 10 West Hill Energy and Computing
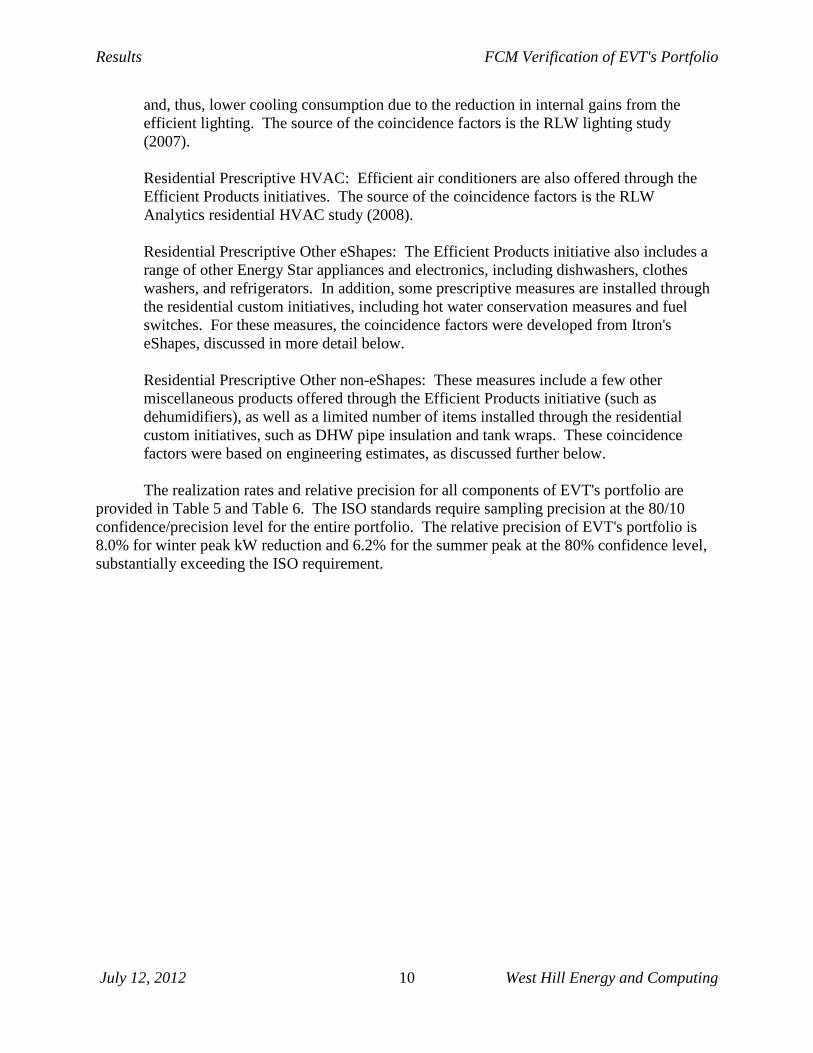
and, thus, lower cooling consumption due to the reduction in internal gains from the efficient lighting. The source of the coincidence factors is the RLW lighting study (2007). Residential Prescriptive HVAC: Efficient air conditioners are also offered through the Efficient Products initiatives. The source of the coincidence factors is the RLW Analytics residential HVAC study (2008). Residential Prescriptive Other eShapes: The Efficient Products initiative also includes a range of other Energy Star appliances and electronics, including dishwashers, clothes washers, and refrigerators. In addition, some prescriptive measures are installed through the residential custom initiatives, including hot water conservation measures and fuel switches. For these measures, the coincidence factors were developed from Itron's eShapes, discussed in more detail below. Residential Prescriptive Other non-eShapes: These measures include a few other miscellaneous products offered through the Efficient Products initiative (such as dehumidifiers), as well as a limited number of items installed through the residential custom initiatives, such as DHW pipe insulation and tank wraps. These coincidence factors were based on engineering estimates, as discussed further below.
The realization rates and relative precision for all components of EVT's portfolio are provided in Table 5 and Table 6. The ISO standards require sampling precision at the 80/10 confidence/precision level for the entire portfolio. The relative precision of EVT's portfolio is 8.0% for winter peak kW reduction and 6.2% for the summer peak at the 80% confidence level, substantially exceeding the ISO requirement.
Results FCM Verification of EVT's Portfolio
July 12, 2012 11 West Hill Energy and Computing
Table 5: Realization Rates and Sampling Precision for Winter Peak kW Reduction
Original EVT Claimed Peak kW Reduction
Realization Rate
Savings as % of Total Portfolio
Relative Precision
C&I and Multifamily
Retrofit 4,080 70.5% 20.5% 16.3% NC/MOP 2,214 51.6% 11.1% 17.6% Stipulated Lighting 3,038 100.0% 15.3% 9.3% Customer Credit 58 82.0% 0.0% Retrofit Not Verified 106 69.5% 0.5% 16.0% NC/MOP Not Verified -11 51.6% -0.1% 17.6% Residential Prescriptive Lighting 7,988 100.0% 40.1% 15.8% Prescriptive Lighting w/Cooling Bonus 1,426 100.0% 7.2% 15.8% Prescriptive HVAC 0 100.0% 0.0% 0.0% Prescriptive Other eShapes 795 100.0% 4.0% 50.0% Prescriptive Other non-eShapes 219 100.0% 1.1% 100.0% Other excluded measures 6 0.0% 0.0% 0.0% Totals 19,918 88.4% 8.0%
Table 6: Realization Rates and Sampling Precision for Summer Peak kW Reduction
Original EVT Claimed Peak kW Reduction
Realization Rate
Savings as % of Total Portfolio
Relative Precision
C&I and Multifamily Retrofit 4,701 68.6% 28.4% 15.0% NC/MOP 2,781 69.1% 16.8% 15.2% Stipulated Lighting 3,620 100.0% 21.9% 3.7% Customer Credit 58 83.1% 0.0% Retrofit Not Verified 140 68.4% 0.8% 15.0% NC/MOP Not Verified 46 69.1% 0.3% 15.2% Residential Prescriptive Lighting 2,193 100.0% 13.3% 17.6% Prescriptive Lighting w/Cooling Bonus 1,967 100.0% 11.9% 17.6% Prescriptive HVAC 130 40.8% 0.8% 10.4% Prescriptive Other eShapes 648 100.0% 3.9% 50.0% Prescriptive Other non-eShapes 252 100.0% 1.5% 0.0% Other excluded measures 2 0.0% 0.0% 0.0% Totals 16,538 85.0% 6.2%
Results FCM Verification of EVT's Portfolio
July 12, 2012 12 West Hill Energy and Computing
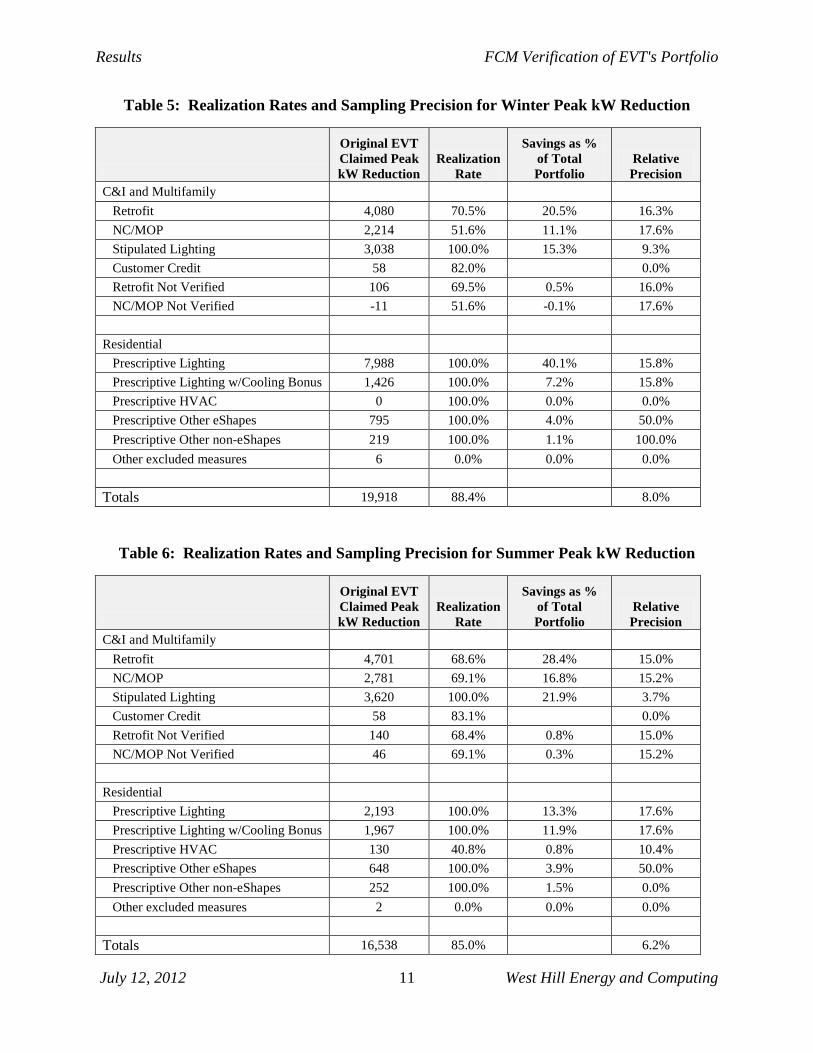
For the C&I custom sample, the relative precision was calculated from the sample. The two studies done by RLW Analytics (lighting and residential HVAC) specified the relative precision for the coincidence factors. In some cases, the relative precision was estimated based on the available information, as discussed below.
• The coincidence factors for the stipulated lighting were taken from the RLW study; the relative precision shown in the tables above was the highest value for the various business types.
• The coincident factors for a variety of small residential measures were based on Itron's eShapes 8760 load profile data, developed from audits of approximately 20,000 homes in the 1990's.7 While the load profiles are based on older data, the extensive nature of the data collection would be extremely costly to reproduce for measures that represent less than 3% of EVT's portfolio. The relative precision could not be determined, so a proxy value of 0.50 was used. Given the large sample size, this proxy value is assumed to be substantially larger than the actual relative precision.
• For a few other residential measures, the load profiles were based on engineering assumptions and the relative precision could not be determined. These coincident factors were reviewed and found to be within a reasonable range. Since no sampling was conducted, there is no sampling error associated with these measures. These measures constitute a very small percentage of EVT's overall portfolio (less than 1%).
The residential lighting savings are composed of three components with values derived from two different studies (NMR, 2004 and RLW, 2007). Each component has a relative precision associated with it. The overall precision was calculated using the method described in EVT's M&V Plan.8 The in-service rate (ISR) and delta Watts were estimated from the same sample, and thus the worst-case precision was estimated as if the factors were perfectly correlated, i.e., the combined precision was additive. The RLW and NMR studies were sampled independently, allowing the combined precision from the NRM and RLW studies to be calculated by the following formula:
The relative precision in the NMR study was report at the 90% confidence level. These values were assumed to be a worst case scenario for the FCM requirement of precision at the 80% confidence level. The NMR precision values are the same as used in EVT's M&V Plan submitted to ISO-NE.9
7 About half of the roughly 20,000 audits were conducted on site, with the remainder based on a mail survey. Building simulations were performed based on the data collected through the audits to determine the load profiles. Overall, the audits were distributed throughout the country, although some states and utilities had more audit activity than others. 8 Vermont Efficiency Portfolio: Plan for Measurement and Verification of Demand Reduction Value from Energy Efficiency Resources. Prepared by the Vermont Energy Investment Corporation for submission to ISO New England. June 15, 2007. Pages 7-4 to 7-5. 9 As noted in Efficiency Vermont's M&V Plan (page 7-4), in some cases a single value was selected where the NMR report had the results broken out into segments by technology. The selected value was chosen as a conservative estimate of the precision for the combined applications.
Results FCM Verification of EVT's Portfolio
July 12, 2012 13 West Hill Energy and Computing
The combined precision for the ISR and delta Watts from the NRM study was 10.8%. The precision for the RLW coincidence factors was reported to be 4.5% and 6.1% at the 80% confidence level for winter and summer, respectively.10 Thus, the combined relative precision for the prescriptive residential lighting was calculated to be 15.8% and 17.6% for winter and summer peak demand reductions. The remainder of this section covers one issue affecting multiple programs, custom C&I results, C&I stipulated lighting results, residential results and timing issues. 4.1 Custom C&I Results
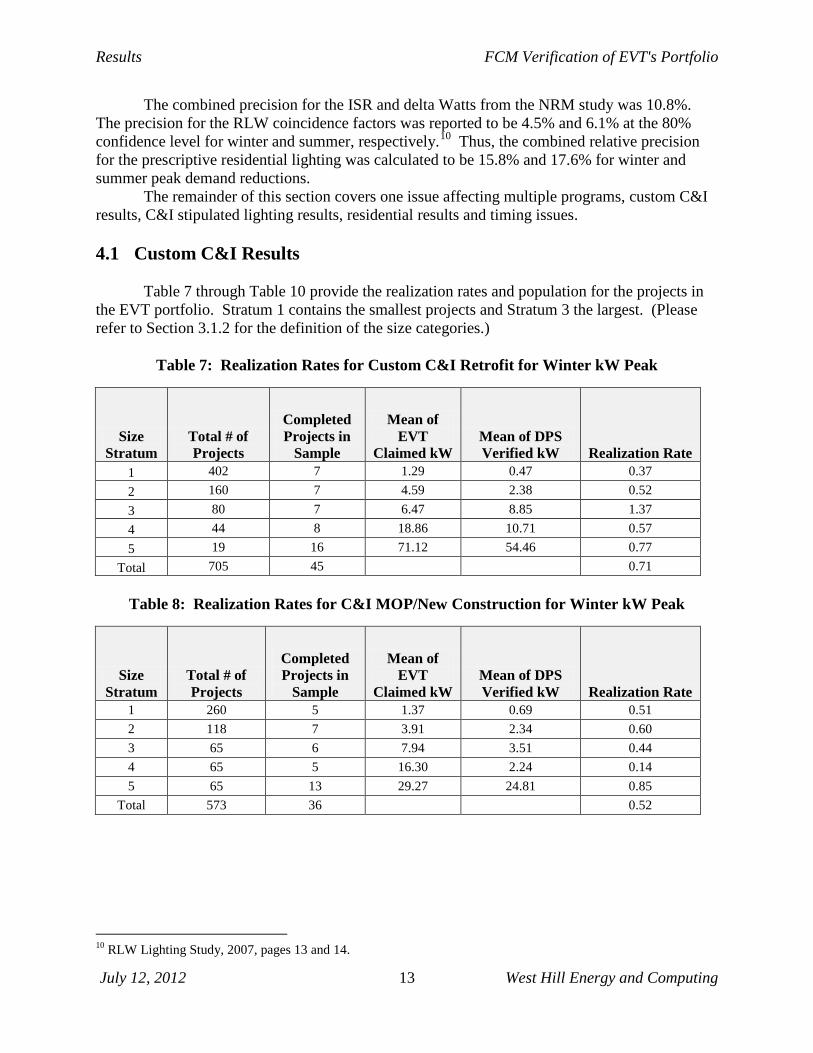
Table 7 through Table 10 provide the realization rates and population for the projects in the EVT portfolio. Stratum 1 contains the smallest projects and Stratum 3 the largest. (Please refer to Section 3.1.2 for the definition of the size categories.)
Table 7: Realization Rates for Custom C&I Retrofit for Winter kW Peak
Size Stratum
Total # of Projects
Completed Projects in
Sample
Mean of EVT
Claimed kW Mean of DPS Verified kW Realization Rate
1 402 7 1.29 0.47 0.37 2 160 7 4.59 2.38 0.52 3 80 7 6.47 8.85 1.37 4 44 8 18.86 10.71 0.57 5 19 16 71.12 54.46 0.77
Total 705 45 0.71
Table 8: Realization Rates for C&I MOP/New Construction for Winter kW Peak
Size Stratum
Total # of Projects
Completed Projects in
Sample
Mean of EVT
Claimed kW Mean of DPS Verified kW Realization Rate
1 260 5 1.37 0.69 0.51 2 118 7 3.91 2.34 0.60 3 65 6 7.94 3.51 0.44 4 65 5 16.30 2.24 0.14 5 65 13 29.27 24.81 0.85
Total 573 36 0.52
10 RLW Lighting Study, 2007, pages 13 and 14.
FCM Verification of EVT's Portfolio
July 12, 2012 14 West Hill Energy and Computing
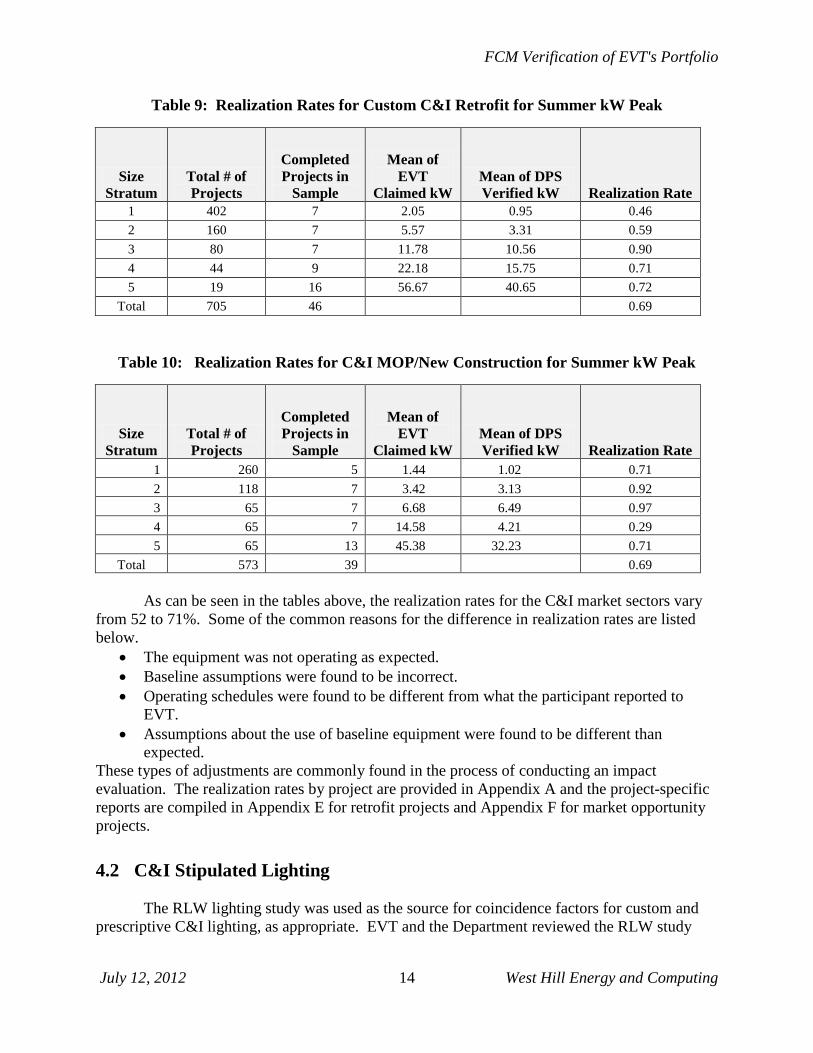
Table 9: Realization Rates for Custom C&I Retrofit for Summer kW Peak
Size Stratum
Total # of Projects
Completed Projects in
Sample
Mean of EVT
Claimed kW Mean of DPS Verified kW Realization Rate
1 402 7 2.05 0.95 0.46 2 160 7 5.57 3.31 0.59 3 80 7 11.78 10.56 0.90 4 44 9 22.18 15.75 0.71 5 19 16 56.67 40.65 0.72
Total 705 46 0.69
Table 10: Realization Rates for C&I MOP/New Construction for Summer kW Peak
Size Stratum
Total # of Projects
Completed Projects in
Sample
Mean of EVT
Claimed kW Mean of DPS Verified kW Realization Rate
1 260 5 1.44 1.02 0.71 2 118 7 3.42 3.13 0.92 3 65 7 6.68 6.49 0.97 4 65 7 14.58 4.21 0.29 5 65 13 45.38 32.23 0.71
Total 573 39 0.69 As can be seen in the tables above, the realization rates for the C&I market sectors vary from 52 to 71%. Some of the common reasons for the difference in realization rates are listed below.
• The equipment was not operating as expected. • Baseline assumptions were found to be incorrect. • Operating schedules were found to be different from what the participant reported to
EVT. • Assumptions about the use of baseline equipment were found to be different than
expected. These types of adjustments are commonly found in the process of conducting an impact evaluation. The realization rates by project are provided in Appendix A and the project-specific reports are compiled in Appendix E for retrofit projects and Appendix F for market opportunity projects.
4.2 C&I Stipulated Lighting The RLW lighting study was used as the source for coincidence factors for custom and prescriptive C&I lighting, as appropriate. EVT and the Department reviewed the RLW study
FCM Verification of EVT's Portfolio
July 12, 2012 15 West Hill Energy and Computing
and agreed to apply the findings to the following business types: • Grocery • Medical (Hospital) • Office (including medical office) • Restaurant • Retail • Warehouse (excepting 24 hour distribution centers) • Multifamily – residential spaces
EVT developed blended coincidence factors for C&I prescriptive lighting based on the historical distribution of business types that participated in the C&I prescriptive lighting initiative. This analysis was reviewed and approved by the Department and is described in Appendix C. For the 2010 installations, EVT reviewed the custom C&I projects and determined the business type. These designations were provided to the Department and the measures were removed from the Department's sample frame for the C&I custom verification, with the exception of large projects. Projects that fell into the large project stratum of Department's sample were reviewed on an individual basis. The other major inputs into the kW reduction are the connected load kW reduction and the fixture counts. EVT conducted QC on all C&I projects, including a peer review process for projects with substantial savings. In general, EVT used manufacturers' spec sheets or default assumptions to estimate the change in the kW. The default values have been reviewed by the Department and found to be reasonable and consistent with industry standards. As indicated in EVT's M&V plan, the fixture counts in EVT's central data tracking system are assumed to be correct and without bias. 4.3 Residential Results
The prescriptive residential measures in EVT’s portfolio are described in the TRM submitted as part of the EVT's M&V Plan. For the prescriptive lighting products, the reduction in Watts and in-service rates are based on the results of a market research conducted by Nexus Marketing Research.11 This was a regional study prepared for the New England Energy Efficiency Partnership (NEEP). Verified lighting coincidence factors were based on the recent RLW lighting study (2007) and A/C coincidence factors were based on the RLW study of residential room air conditions conducted in 2008.12 Errors in the application of the prescriptive assumptions were identified through the Department's annual savings verification process, and these corrections were incorporated into the realization rates. The only adjustment was to the summer peak kW reduction for air conditioners, which was changed to be consistent with the RLW study mentioned above.
11 Impact Evaluation of the Massachusetts, Rhode Island, and Vermont 2003 Residential Lighting Programs. Nexus Market Research and RLW Analytics, 2004 12 Coincidence Factor Study Residential Room Air Conditioners. Prepared for the Northeast Energy Efficiency Partnerships’ New England Evaluation and State Program Working Group by RLW Analytics, Middletown, CT. June 23, 2008
FCM Verification of EVT's Portfolio
July 12, 2012 16 West Hill Energy and Computing
4.4 Compliance with ISO-NE Standards This section covers the compliance of the verification results with the ISO-NE standards. For the residential prescriptive measures, the assumptions are supported by recent, statistically sound studies. For the custom C&I projects, an individual M&E plan was developed for each project that was consistent with the ISO requirements. Most of the ISO requirements are directly relevant to the C&I custom sample and are discussed in that context. The ISO requirements are listed in reference to the section in the manual.
Section 6, Establishing Baseline Conditions: As specified in the manual, the baseline conditions for retrofit projects are the pre-existing conditions. If the pre-existing conditions could not be determined, then the applicable state code, federal product efficiency standard or standard practice (if more stringent than the state or federal requirement) should be used. For market opportunity projects, the baseline is the applicable state code, federal product efficiency standard or standard practice (if more stringent than the state or federal requirement). These principles were consistently applied to the custom C&I projects and documented in the individual project reports. In a few cases, there was no clear code or standard. In these situations, the Department's evaluation team researched the standard practice and developed the baseline using the best available information. Section 7, Statistical Significance: For engineering-based, direct measurement, the ISO manual required strategies to control for bias, such as the accuracy and calibration of the measurement tools, sensor placement bias, and sample selection bias or non-random selection of equipment and/or circuits to monitor. The site-specific M&V plans described the relevant issues for each project and discussed the methods used to mitigate bias. Random sampling was conducted for all projects with too many circuits or measures to meter. These issues are described in more detail in the site-specific project reports. In Section 7.2, the manual requires that the overall portfolio meet the 80/10 confidence/precision standard. As discussed above, the verification of EVT's portfolio exceeds that standard with a precision of 7.1% and 6.3% for winter and summer peak reduction, respectively. This section also discussed the need to minimize bias. Bias relating to the three components of EVT's portfolio that make up 95% or more of the peak kW reduction is explored briefly below.
• For the C&I custom sample (Retrofit, NC/MOP and Customer Credit), a potential source of bias was the removal of some large projects that could not be verified to the ISO standard, as explained in more detail in Section 4.2 above. A sensitivity analysis indicated the inclusion of unverified large projects is unlikely to affect the results.
FCM Verification of EVT's Portfolio
July 12, 2012 17 West Hill Energy and Computing
• The estimated savings for residential prescriptive lighting are unlikely to be biased since the deemed savings are based on recent market studies.
• The use of the RLW coincidence factors for the stipulated C&I lighting is appropriate since there are many stipulated lighting projects covering a wide variety of applications and the RLW sample also included a broad range of applications. Thus, the application of the RLW coincidence factors to the stipulated C&I lighting projects would not be expected to introduce a bias.
Section 10, Measurement Equipment Specifications: The Department used RLW's Review of ISO New England Measurement and Verification Equipment Requirements (April 24, 2008) to identify the ISO-compliant metering equipment. In some cases, approved metering equipment was used at the lower boundary of the range of kW or current as there was no alternative equipment that met the ISO standard. In these cases, the Department's evaluation team carefully reviewed the results and assessed the validity of the data to decide whether or not the project could be verified. If the evaluator concluded that the data could be used to develop reliable estimates without introducing an unacceptable level of uncertainty to the results, the project was kept in the sample; otherwise it was dropped. A number of the large projects were determined to be unverifiable through this process. These situations are clearly discussed in the individual project reports. Section 5, Acceptable Measures and Verification Methodologies: This section describes the specific allowable methods, Options A through D. Engineering algorithms are permitted if supplemented with on-site data collection. Verifiable load shapes may be applied if based on "actual metering, load research, and/or simulation modeling" (Section 5.4.2). For the residential prescriptive measures, Option A was applied, using verifiable load shapes and assumptions based on recent, statistically sound studies as discussed above. The recent RLW studies for lighting and HVAC prepared for NEEP cover the vast majority of the residential prescriptive savings. The other measures used either Itron's eShapes or engineering estimates, as described in above in this section. While the Itron eShapes are based on data that is over five years old, they also represent a highly detailed survey of residential use that would be impossible to duplicate within a reasonable time frame and budget. The kW reduction estimated by the use of engineering algorithms account for about 1% of the total portfolio, and thus the greater uncertainty associated with the load profiles was considered to be acceptable.
Conclusions FCM Verification of EVT's Portfolio
July 12, 2012 18 West Hill Energy and Computing
5 Conclusions The Department completed its independent verification of EVT's peak demand reduction. EVT's M&V plan as submitted to ISO-NE was the foundation for the sampling plan and verification activities conducted by the Department. The realization rates are based on EVT's activity in program year 2010. The M&V plan was followed and the results of the evaluation are consistent with the ISO standards, as specifically discussed in this document.
References FCM Verification of EVT's Portfolio
July 12, 2012 19 West Hill Energy and Computing
6 References The California Evaluation Framework. TecMarket Works, et. al. Project Number: K2033910. Prepared for the California Public Utilities Commission and the Project Advisory Group. September, 2004 Coincidence Factor Study Residential and Commercial & Industrial Lighting Measures. Prepared for New England State Program Working Group (SPWG) by RLW Analytics, Middletown, CT. Spring, 2007 Coincidence Factor Study Residential Room Air Conditioners. Prepared for the Northeast Energy Efficiency Partnerships’ New England Evaluation and State Program Working Group by RLW Analytics, Middletown, CT. June 23, 2008 Efficiency Vermont: 2010 Annual Report, February, 2012, available at www.efficiencyvermont.org Final Report to the Energy Efficiency Utility Contract Administrator: Verification of EVT's 2009 Claimed Annual MWh Savings, Coincident Summer and Winter Peak Savings and Total Resource Benefit (TRB). Prepared by the Department of Public Service. August 13, 2010, revised August 26, 2010. Impact Evaluation of the Massachusetts, Rhode Island, and Vermont 2003 Residential Lighting Programs. Nexus Market Research and RLW Analytics, 2004 ISO New England Manual for Measurement and Verification of Demand Reduction Value from Demand Resources, Manual M-MVDR, Revision: 2 Effective Date: June 1, 2010 Review of ISO New England Measurement and Verification Equipment Requirements. Prepared for Prepared for the Northeast Energy Efficiency Partnerships’ Evaluation and State Program Working Group by RLW Analytics, April 24, 2008 Sampling: Design and Analysis. Lohr, Sharon L. Duxbury Press, 1999

![Loss Modelling and Experimental Verification of A 98.8% Efficiency Bidirectional … · 2018-09-09 · A 1 kW resonant bidirectional converter is presented in [6] with an efficiency](https://img.pdfslide.us/doc/110x75/5f7034406d30cb11127d99a5/loss-modelling-and-experimental-verification-of-a-988-efficiency-bidirectional.jpg)