Embed Size (px)
Citation preview
Verification and Validation of Selected Fire Models for Nuclear Power Plant Applications Volume 5: Consolidated Fire Growth and Smoke Transport Model (CFAST)
April 2007
U.S. Nuclear Regulatory Commission Electric Power Research Institute Office of Nuclear Regulatory Research 3412 Hillview Avenue Washington, DC 20555-0001 Palo Alto, CA 94303
NUREG-1824 EPRI 1011999 Final Report

Verification & Validation of Selected Fire Models for Nuclear Power Plant Applications Volume 5: Consolidated Fire Growth and Smoke Transport Model (CFAST) NUREG-1824 EPRI 1011999
Final Report
April 2007
U.S. Nuclear Regulatory Commission Electric Power Research Institute (EPRI) Office of Nuclear Regulatory Research (RES) 3412 Hillview Avenue Two White Flint North, 11545 Rockville Pike Palo Alto, CA 94303 Rockville, MD 20852-2738
U.S. NRC-RES Project Manager EPRI Project Manager M. H. Salley R.P. Kassawara
DISCLAIMER OF WARRANTIES AND LIMITATION OF LIABILITIES
THIS DOCUMENT WAS PREPARED BY THE ORGANIZATION(S) NAMED BELOW AS AN ACCOUNT OF WORK SPONSORED OR COSPONSORED BY THE ELECTRIC POWER RESEARCH INSTITUTE, INC. (EPRI). NEITHER EPRI NOR ANY MEMBER OF EPRI, ANY COSPONSOR, THE ORGANIZATION(S) BELOW, OR ANY PERSON ACTING ON BEHALF OF ANY OF THEM:
(A) MAKES ANY WARRANTY OR REPRESENTATION WHATSOEVER, EXPRESS OR IMPLIED, (I) WITH RESPECT TO THE USE OF ANY INFORMATION, APPARATUS, METHOD, PROCESS, OR SIMILAR ITEM DISCLOSED IN THIS DOCUMENT, INCLUDING MERCHANTABILITY AND FITNESS FOR A PARTICULAR PURPOSE, OR (II) THAT SUCH USE DOES NOT INFRINGE ON OR INTERFERE WITH PRIVATELY OWNED RIGHTS, INCLUDING ANY PARTY’S INTELLECTUAL PROPERTY, OR (III) THAT THIS DOCUMENT IS SUITABLE TO ANY PARTICULAR USER’S CIRCUMSTANCE; OR
(B) ASSUMES RESPONSIBILITY FOR ANY DAMAGES OR OTHER LIABILITY WHATSOEVER (INCLUDING ANY CONSEQUENTIAL DAMAGES, EVEN IF EPRI OR ANY EPRI REPRESENTATIVE HAS BEEN ADVISED OF THE POSSIBILITY OF SUCH DAMAGES) RESULTING FROM YOUR SELECTION OR USE OF THIS DOCUMENT OR ANY INFORMATION, APPARATUS, METHOD, PROCESS, OR SIMILAR ITEM DISCLOSED IN THIS DOCUMENT.
ORGANIZATION(S) THAT PREPARED THIS DOCUMENT:
U.S. Nuclear Regulatory Commission, Office of Nuclear Regulatory Research
Science Applications International Corporation
National Institute of Standards and Technology
ORDERING INFORMATION
Requests for copies of this report should be directed to EPRI Orders and Conferences, 1355 Willow Way, Suite 278, Concord, CA 94520, (800) 313-3774, press 2 or internally x5379, (925) 609-9169, (925) 609-1310 (fax).
Electric Power Research Institute and EPRI are registered service marks of the Electric Power Research Institute, Inc. (EPRI). ELECTRIFY THE WORLD is a service mark of the Electric Power Research Institute, Inc.
iii
CITATIONS
This report was prepared by
U.S. Nuclear Regulatory Commission, Office of Nuclear Regulatory Research (RES) Two White Flint North, 11545 Rockville Pike Rockville, MD 20852-2738
Principal Investigators: K. Hill J. Dreisbach
Electric Power Research Institute (EPRI) 3412 Hillview Avenue Palo Alto, CA 94303
Science Applications International Corp (SAIC)4920 El Camino Real Los Altos, CA 94022
Principal Investigators: F. Joglar B. Najafi
National Institute of Standards and TechnologyBuilding Fire Research Laboratory (BFRL) 100 Bureau Drive, Stop 8600 Gaithersburg, MD 20899-8600
Principal Investigators: K McGrattan R. Peacock A. Hamins
Volume 1, Main Report: B. Najafi, F. Joglar, J. Dreisbach Volume 2, Experimental Uncertainty: A. Hamins, K. McGrattan Volume 3, FDTS: J. Dreisbach, K. Hill Volume 4, FIVE-Rev1: F. Joglar Volume 5, CFAST: R. Peacock, P. Reneke (NIST) Volume 6, MAGIC: F. Joglar, B. Guatier (EdF), L. Gay (EdF), J. Texeraud (EdF) Volume 7, FDS: K. McGrattan
This report describes research sponsored jointly by U.S. Nuclear Regulatory Commission, Office of Nuclear Regulatory Research (RES) and Electric Power Research Institute (EPRI).
The report is a corporate document that should be cited in the literature in the following manner:
Verification and Validation of Selected Fire Models for Nuclear Power Plant Applications, Volume 5: Consolidated Fire and Smoke Transport Model (CFAST), U.S. Nuclear Regulatory Commission, Office of Nuclear Regulatory Research (RES), Rockville, MD, 2007, and Electric Power Research Institute (EPRI), Palo Alto, CA, NUREG-1824 and EPRI 1011999.

v
ABSTRACT
There is a movement to introduce risk-informed and performance-based analyses into fire protection engineering practice, both domestically and worldwide. This movement exists in the general fire protection community, as well as the nuclear power plant (NPP) fire protection community. The U.S. Nuclear Regulatory Commission (NRC) has used risk-informed insights as part of its regulatory decision-making since the 1990's.
In 2002, the National Fire Protection Association (NFPA) developed NFPA 805, Performance-Based Standard for Fire Protection for Light-Water Reactor Electric Generating Plants, 2001 Edition. In July 2004, the NRC amended its fire protection requirements in Title 10, Section 50.48, of the Code of Federal Regulations (10 CFR 50.48) to permit existing reactor licensees to voluntarily adopt fire protection requirements contained in NFPA 805 as an alternative to the existing deterministic fire protection requirements. In addition, the NPP fire protection community has been using risk-informed, performance-based (RI/PB) approaches and insights to support fire protection decision-making in general.
One key tool needed to further the use of RI/PB fire protection is the availability of verified and validated fire models that can reliably predict the consequences of fires. Section 2.4.1.2 of NFPA 805 requires that only fire models acceptable to the Authority Having Jurisdiction (AHJ) shall be used in fire modeling calculations. Furthermore, Sections 2.4.1.2.2 and 2.4.1.2.3 of NFPA 805 state that fire models shall only be applied within the limitations of the given model, and shall be verified and validated.
This report is the first effort to document the verification and validation (V&V) of five fire models that are commonly used in NPP applications. The project was performed in accordance with the guidelines that the American Society for Testing and Materials (ASTM) set forth in ASTM E 1355, Standard Guide for Evaluating the Predictive Capability of Deterministic Fire Models. The results of this V&V are reported in the form of ranges of accuracies for the fire model predictions.

vii
FOREWORD
Fire modeling and fire dynamics calculations are used in a number of fire hazards analysis (FHA) studies and documents, including fire risk analysis (FRA) calculations; compliance with and exemptions to the regulatory requirements for fire protection in 10 CFR Part 50; the Significance Determination Process (SDP) used in the inspection program conducted by the U.S. Nuclear Regulatory Commission (NRC); and, most recently, the risk-informed performance-based (RI/PB) voluntary fire protection licensing basis established under 10 CFR 50.48(c). The RI/PB method is based on the National Fire Protection Association (NFPA) Standard 805, Performance-Based Standard for Fire Protection for Light-Water Reactor Generating Plants. The seven volumes of this NUREG-series report provide technical documentation concerning the predictive capabilities of a specific set of fire dynamics calculation tools and fire models for the analysis of fire hazards in postulated nuclear power plant (NPP) scenarios. Under a joint memorandum of understanding (MOU), the NRC Office of Nuclear Regulatory Research (RES) and the Electric Power Research Institute (EPRI) agreed to develop this technical document for NPP application of these fire modeling tools. The objectives of this agreement include creating a library of typical NPP fire scenarios and providing information on the ability of specific fire models to predict the consequences of those typical NPP fire scenarios. To meet these objectives, RES and EPRI initiated this collaborative project to provide an evaluation, in the form of verification and validation (V&V), for a set of five commonly available fire modeling tools. The road map for this project was derived from NFPA 805 and the American Society for Testing and Materials (ASTM) Standard E 1355, Standard Guide for Evaluating the Predictive Capability of Deterministic Fire Models. These industry standards form the methodology and process used to perform this study. Technical review of fire models is also necessary to ensure that those using the models can accurately assess the adequacy of the scientific and technical bases for the models, select models that are appropriate for a desired use, and understand the levels of confidence that can be attributed to the results predicted by the models. This work was performed using state-of-the-art fire dynamics calculation methods/models and the most applicable fire test data. Future improvements in the fire dynamics calculation methods/models and additional fire test data may impact the results presented in the seven volumes of this report. This document does not constitute regulatory requirements, and NRC participation in this study neither constitutes nor implies regulatory approval of applications based on the analysis contained in this text. The analyses documented in this report represent the combined efforts of individuals from RES and EPRI. Both organizations provided specialists in the use of fire models and other FHA tools to support this work. The results from this combined effort do not constitute either a regulatory position or regulatory guidance. Rather, these results are intended to provide technical analysis of the predictive capabilities of five fire dynamic calculation tools, and they may also help to identify areas where further research and analysis are needed. _________________________________ Brian W. Sheron, Director Office of Nuclear Regulatory Research U.S. Nuclear Regulatory Commission

ix
CONTENTS
1 INTRODUCTION ....................................................................................................................1-1
2 MODEL DEFINITION..............................................................................................................2-1 2.1 Name and Version of the Model......................................................................................2-1 2.2 Type of Model..................................................................................................................2-1 2.3 Model Developers ...........................................................................................................2-1 2.4 Relevant Publications......................................................................................................2-1 2.5 Governing Equations and Assumptions ..........................................................................2-2 2.6 Input Data Required to Run the Model............................................................................2-2 2.7 Property Data ..................................................................................................................2-3 2.8 Model Results..................................................................................................................2-3 2.9 Uses and Limitations of the Model ..................................................................................2-3
3 THEORETICAL BASIS FOR CFAST.....................................................................................3-1 3.1 The Two-Layer Model .....................................................................................................3-1 3.2 Zone Model Assumptions................................................................................................3-3 3.3 Description of Sub-Models and Correlations...................................................................3-4
3.3.1 The Fire ...................................................................................................................3-4 3.3.2 Plumes.....................................................................................................................3-4 3.3.3 Ceiling Jet................................................................................................................3-5 3.3.4 Vent Flow.................................................................................................................3-5 3.3.5 Heat Transfer...........................................................................................................3-5 3.3.6 Targets ....................................................................................................................3-6 3.3.7 Heat Detectors.........................................................................................................3-6 3.3.8 Fire Suppression via Sprinklers...............................................................................3-7 3.3.9 Species Concentration and Deposition ...................................................................3-7
3.4 Review of the Theoretical Development of the Model.....................................................3-7 3.4.1 Assessment of the Completeness of Documentation..............................................3-8
x
3.4.2 Assessment of Justification of Approaches and Assumptions ................................3-8 3.4.3 Assessment of Constants and Default Values ........................................................3-8
4 MATHEMATICAL AND NUMERICAL ROBUSTNESS..........................................................4-1 4.1 Introduction .....................................................................................................................4-1 4.2 Comparison with Analytic Solutions ................................................................................4-1 4.3 Code Checking................................................................................................................4-2 4.4 Numerical Tests ..............................................................................................................4-2
5 MODEL SENSITIVITY ............................................................................................................5-1 5.1 Previous Sensitivity Studies ............................................................................................5-1 5.2 Sensitivity to Heat Release Rate.....................................................................................5-3
6 MODEL VALIDATION ............................................................................................................6-1 6.1 Hot Gas Layer (HGL) Temperature and Height ..............................................................6-4 6.2 Ceiling Jet Temperature ..................................................................................................6-6 6.3 Plume Temperature.........................................................................................................6-8 6.4 Flame Height ...................................................................................................................6-9 6.5 Oxygen and Carbon Dioxide Concentration....................................................................6-9 6.6 Smoke Concentration....................................................................................................6-11 6.7 Compartment Pressure .................................................................................................6-13 6.8 Radiation and Total Heat Flux to Targets and Target Temperature..............................6-14 6.9 Surface Heat Flux and Temperature .............................................................................6-17 6.10 Summary.....................................................................................................................6-19
7 REFERENCES .......................................................................................................................7-1
A TECHNICAL DETAILS OF CFAST VALIDATION STUDY .................................................. A-1 A.1 Hot Gas Layer Temperature and Height........................................................................ A-2
ICFMP BE #2................................................................................................................... A-3 ICFMP BE #3................................................................................................................... A-5 ICFMP BE #4................................................................................................................. A-10 ICFMP BE #5................................................................................................................. A-12 FM/SNL Test Series ...................................................................................................... A-14 NBS Multi-Room Test Series......................................................................................... A-16
A.2 Ceiling Jet Temperature............................................................................................... A-21

xi
ICFMP BE #3 Test Series ............................................................................................. A-21 FM / SNL Test Series .................................................................................................... A-24
A.3 Plume Temperature ..................................................................................................... A-25 A.4 Flame Height ............................................................................................................... A-26
ICFMP BE #2................................................................................................................. A-26 ICFMP BE #3................................................................................................................. A-28
A.5 Oxygen Concentration ................................................................................................. A-29 A.6 Smoke Concentration .................................................................................................. A-32 A.7 Compartment Pressure................................................................................................ A-35 A.8 Target Temperature and Heat Flux.............................................................................. A-39
ICFMP BE #3................................................................................................................. A-39 ICFMP BE #4................................................................................................................. A-68 ICFMP BE #5................................................................................................................. A-70
A.9 Heat Flux and Surface Temperature of Compartment Walls ....................................... A-74 ICFMP BE #3................................................................................................................. A-74 ICFMP BE #4................................................................................................................. A-91 ICFMP BE #5................................................................................................................. A-92
B CFAST INPUT FILES ........................................................................................................... B-1 B.1 ICFMP Benchmark Exercise #2..................................................................................... B-2 B.2 ICFMP Benchmark Exercise #3..................................................................................... B-5 B.3 ICFMP Benchmark Exercise #4................................................................................... B-35 B.4 ICFMP Benchmark Exercise #5................................................................................... B-37 B.5 FM / SNL Test Series................................................................................................... B-39 B.6 NBS Test Series .......................................................................................................... B-42

xiii
FIGURES
Figure 5-1. Sensitivity of Various Output Quantities to Changes in HRR. ................................5-4 Figure 6-1. Comparisons and Relative Differences for Hot Gas Layer (HGL)
Temperature and Height ....................................................................................................6-5 Figure 6-2. Comparisons and Relative Differences for Ceiling Jet Temperature......................6-8 Figure 6-3. Comparisons and Relative Differences for Oxygen Concentration and
Carbon Dioxide Concentration .........................................................................................6-10 Figure 6-4. Comparisons and Relative Differences for Smoke Concentration........................6-12 Figure 6-5. Comparisons and Relative Differences for Compartment Pressure .....................6-14 Figure 6-6. Comparisons and Relative Differences for Heat Flux to Targets and Target
Temperature.....................................................................................................................6-15 Figure 6-7. Comparisons and Relative Differences for Surface Heat Flux and
Temperature.....................................................................................................................6-18 Figure A-1. Cut-Away View of the Simulation of ICFMP BE #2, Case 2.................................. A-3 Figure A-2. Hot Gas Layer (HGL) Temperature and Height, ICFMP BE #2. ........................... A-4 Figure A-3. Snapshot of Simulation of ICFMP BE #3, Test 3. ................................................. A-5 Figure A-4. Hot Gas Layer (HGL) Temperature and Height, ICFMP BE #3, Closed-Door
Tests. ................................................................................................................................ A-6 Figure A-5. Hot Gas Layer (HGL) Temperature and Height, ICFMP BE #3, Closed-Door
Tests. ................................................................................................................................ A-7 Figure A-6. Hot Gas Layer (HGL) Temperature and Height, ICFMP BE #3, Open-Door
Tests. ................................................................................................................................ A-8 Figure A-7. Hot Gas Layer (HGL) Temperature and Height, ICFMP BE #3, Open-Door
Tests. ................................................................................................................................ A-9 Figure A-8. Snapshot of the Simulation of ICFMP BE #4, Test 1. ......................................... A-10 Figure A-9. Hot Gas Layer (HGL) Temperature and Height, ICFMP BE #4, Test 1. ............. A-11 Figure A-10. Snapshot of the Simulation of ICFMP BE #5, Test 4. ....................................... A-12 Figure A-11. Hot Gas Layer (HGL) Temperature and Height, ICFMP BE #5, Test 4. ........... A-13 Figure A-12. Snapshot from Simulation of FM/SNL Test 5. ................................................... A-14 Figure A-13. Hot Gas Layer (HGL) Temperature and Height, FM/SNL Series. ..................... A-15 Figure A-14. Snapshot from Simulation of NBS Multi-Room Test 100Z. ............................... A-16 Figure A-15. Hot Gas Layer (HGL) Temperature and Height, NBS Multiroom, Test
100A................................................................................................................................ A-17 Figure A-16. Hot Gas Layer (HGL) Temperature and Height, NBS Multiroom, Test
100O. .............................................................................................................................. A-18
xiv
Figure A-17. Hot Gas Layer (HGL) Temperature and Height, NBS Multiroom, Test 100Z. ... A-19 Figure A-18. Ceiling Jet Temperature, ICFMP BE #3, Closed-Door Tests. ........................... A-21 Figure A-19. Ceiling Jet Temperature, ICFMP BE #3, Closed-Door Tests. ........................... A-22 Figure A-20. Ceiling Jet Temperature, ICFMP BE #3, Open-Door Tests. ............................. A-23 Figure A-21. Ceiling Jet Temperature, FM/SNL tests. ........................................................... A-24 Figure A-22. Photographs of Heptane Pan Fires, ICFMP BE #2, Case 2 ............................. A-27 Figure A-23. Photograph from Simulation of ICFMP BE #3, Test 3, as seen through the
2 m x 2 m doorway.......................................................................................................... A-28 Figure A-24. O2 and CO2 Concentration, ICFMP BE #3, Closed-Door Tests. ....................... A-30 Figure A-25. O2 and CO2 Concentration, ICFMP BE #3, Open-Door Tests........................... A-31 Figure A-26. Smoke Concentration, ICFMP BE #3, Closed-Door Tests................................ A-33 Figure A-27. Smoke Concentration, ICFMP BE #3, Open-Door Tests. ................................. A-34 Figure A-28. Compartment Pressure, ICFMP BE #3, Closed-Door Tests. ............................ A-36 Figure A-29. Compartment Pressure, ICFMP BE #3, Open-Door Tests................................ A-37 Figure A-30. Thermal Environment near Cable B, ICFMP BE #3, Tests 1 and 7 .................. A-40 Figure A-31. Thermal Environment near Cable B, ICFMP BE #3, Tests 2 and 8 .................. A-41 Figure A-32. Thermal Environment near Cable B, ICFMP BE #3, Tests 4 and 10 ................ A-42 Figure A-33. Thermal Environment near Cable B, ICFMP BE #3, Tests 13 and 16 .............. A-43 Figure A-34. Thermal Environment near Cable B, ICFMP BE #3, Tests 3 and 9 .................. A-44 Figure A-35. Thermal Environment near Cable B, ICFMP BE #3, Tests 5 and 14 ................ A-45 Figure A-36. Thermal Environment near Cable B, ICFMP BE #3, Tests 15 and 18 .............. A-46 Figure A-37. Thermal Environment near Cable Tray D, ICFMP BE #3, Tests 1 and 7.......... A-47 Figure A-38. Thermal Environment near Cable Tray D, ICFMP BE #3, Tests 2 and 8.......... A-48 Figure A-39. Thermal Environment near Cable Tray D, ICFMP BE #3, Tests 4 and 10........ A-49 Figure A-40. Thermal Environment near Cable Tray D, ICFMP BE #3, Tests 13 and 16...... A-50 Figure A-41. Thermal Environment near Cable Tray D, ICFMP BE #3, Tests 3 and 9.......... A-51 Figure A-42. Thermal Environment near Cable Tray D, ICFMP BE #3, Tests 5 and 14........ A-52 Figure A-43. Thermal Environment near Cable Tray D, ICFMP BE #3, Tests 15 and 18...... A-53 Figure A-44. Thermal Environment near Power Cable F, ICFMP BE #3, Tests 1 and 7. ...... A-54 Figure A-45. Thermal Environment near Power Cable F, ICFMP BE #3, Tests 2 and 8. ...... A-55 Figure A-46. Thermal Environment near Power Cable F, ICFMP BE #3, Tests 4 and 10. .... A-56 Figure A-47. Thermal Environment near Power Cable F, ICFMP BE #3, Tests 13 and
16. ................................................................................................................................... A-57 Figure A-48. Thermal Environment near Power Cable F, ICFMP BE #3, Tests 3 and 9. ...... A-58 Figure A-49. Thermal Environment near Power Cable F, ICFMP BE #3, Tests 5 and 14. .... A-59 Figure A-50. Thermal Environment near Power Cable F, ICFMP BE #3, Tests 15 and
18. ................................................................................................................................... A-60 Figure A-51. Thermal Environment near Vertical Cable Tray G, ICFMP BE #3, Tests 1
and 7. .............................................................................................................................. A-61
xv
Figure A-52. Thermal Environment near Vertical Cable Tray G, ICFMP BE #3, Tests 2 and 8. .............................................................................................................................. A-62
Figure A-53. Thermal Environment near Vertical Cable Tray G, ICFMP BE #3, Tests 4 and 10. ............................................................................................................................ A-63
Figure A-54. Thermal Environment near Vertical Cable Tray G, ICFMP BE #3, Tests 13 and 16. ............................................................................................................................ A-64
Figure A-55. Thermal Environment near Vertical Cable Tray G, ICFMP BE #3, Tests 3 and 9. .............................................................................................................................. A-65
Figure A-56. Thermal Environment near Vertical Cable Tray G, ICFMP BE #3, Tests 5 and 14. ............................................................................................................................ A-66
Figure A-57. Thermal Environment near Vertical Cable Tray G, ICFMP BE #3, Tests 15 and 18. ............................................................................................................................ A-67
Figure A-58. Location of Three Slab Targets in ICFMP BE #4. ............................................. A-68 Figure A-59. Heat Flux and Surface Temperatures of Target Slabs, ICFMP BE #4,
Test 1. ............................................................................................................................. A-69 Figure A-60. Thermal Environment near Vertical Cable Tray, ICFMP BE #5, Test 4. ........... A-71 Figure A-61. Long Wall Heat Flux and Surface Temperature, ICFMP BE #3, Closed-
Door Tests....................................................................................................................... A-75 Figure A-62. Long Wall Heat Flux and Surface Temperature, ICFMP BE #3, Closed-
Door Tests....................................................................................................................... A-76 Figure A-63. Long Wall Heat Flux and Surface Temperature, ICFMP BE #3, Closed-
Door Tests....................................................................................................................... A-77 Figure A-64. Long Wall Heat Flux and Surface Temperature, ICFMP BE #3, Open-Door
Tests. .............................................................................................................................. A-78 Figure A-65. Short Wall Heat Flux and Surface Temperature, ICFMP BE #3, Closed-
Door Tests....................................................................................................................... A-79 Figure A-66. Short Wall Heat Flux and Surface Temperature, ICFMP BE #3, Closed-
Door Tests....................................................................................................................... A-80 Figure A-67. Short Wall Heat Flux and Surface Temperature, ICFMP BE #3, Open-Door
Tests. .............................................................................................................................. A-81 Figure A-68. Short Wall Heat Flux and Surface Temperature, ICFMP BE #3, Open-Door
Tests. .............................................................................................................................. A-82 Figure A-69. Ceiling Heat Flux and Surface Temperature, ICFMP BE #3, Closed-Door
Tests. .............................................................................................................................. A-83 Figure A-70. Ceiling Heat Flux and Surface Temperature, ICFMP BE #3, Closed-Door
Tests. .............................................................................................................................. A-84 Figure A-71. Ceiling Heat Flux and Surface Temperature, ICFMP BE #3, Open-Door
Tests. .............................................................................................................................. A-85 Figure A-72. Ceiling Heat Flux and Surface Temperature, ICFMP BE #3, Open-Door
Tests. .............................................................................................................................. A-86 Figure A-73. Floor Heat Flux and Surface Temperature, ICFMP BE #3, Closed-Door
Tests. .............................................................................................................................. A-87 Figure A-74. Floor Heat Flux and Surface Temperature, ICFMP BE #3, Closed-Door
Tests. .............................................................................................................................. A-88
xvi
Figure A-75. Floor Heat Flux and Surface Temperature, ICFMP BE #3, Open-Door Tests. .............................................................................................................................. A-89
Figure A-76. Floor Heat Flux and Surface Temperature, ICFMP BE #3, Open-Door Tests. .............................................................................................................................. A-90
Figure A-77. Back Wall Surface Temperature, ICFMP BE #4, Test 1. .................................. A-91 Figure A-78. Back and Side Wall Surface Temperatures, ICFMP BE #5, Test 1. ................. A-92
xvii
TABLES
Table 3-1. CFAST Capabilities Included in the V&V Study.......................................................3-2 Table A-1. Relative Differences for Hot Gas Layer (HGL) Temperature and Height ............. A-20 Table A-2. Relative Differences for Ceiling Jet Temperature................................................. A-25 Table A-3. Relative Differences for Oxygen and Carbon Dioxide Concentration .................. A-32 Table A-4. Relative Differences for Smoke Concentration .................................................... A-35 Table A-5. Relative Differences for Compartment Pressure.................................................. A-38 Table A-6. Relative Differences for Radiation and Total Heat Flux to Targets and Target
Temperature.................................................................................................................... A-72 Table A-7. Relative Differences for Surface Heat Flux and Temperature.............................. A-93

xix
REPORT SUMMARY
This report documents the verification and validation (V&V) of five selected fire models commonly used in support of risk-informed and performance-based (RI/PB) fire protection at nuclear power plants (NPPs).
Background Over the past decade, there has been a considerable movement in the nuclear power industry to transition from prescriptive rules and practices toward the use of risk information to supplement decision-making. [This move was initiated in the 1990's by the policy of the U.S. Nuclear RegulatoryCommission (NRC) to use risk-informed methods, where practicable, to make regulatory decisions.] In the area of fire protection, this movement is evidenced by numerous initiatives by the NRC and the nuclear power generation community worldwide. In 2001, the National Fire Protection Association (NFPA) completed the development of NFPA Standard 805, Performance-Based Standard for Fire Protection for Light-Water Reactor Electric Generating Plants, 2001 Edition. Effective July 16, 2004, the NRC amended its fire protection requirements in Title 10, Section 50.48(c), of the Code of Federal Regulations [10 CFR 50.48(c)] to permit existing reactor licensees to voluntarily adopt fire protection requirements contained in NFPA 805 as an alternative to the existing deterministic fire protection requirements. RI/PB fire protection often relies on fire modeling for determining the consequence of fires. NFPA 805 requires that the “fire models shall be verified and validated,” and “only fire models that are acceptable to the Authority Having Jurisdiction (AHJ) shall be used in fire modeling calculations.”
Objectives The objective of this project is to examine the predictive capabilities of selected fire models. These models may be used to demonstrate compliance with the requirements of 10 CFR 50.48(c) and the referenced NFPA 805, or support other performance-based evaluations in NPP fire protection applications. In addition to NFPA 805 requiring that only verified and validated fire models acceptable to the AHJ be used, the standard also requires that fire models only be applied within their limitations. The V&V of specific models is important in establishing acceptable uses and limitations of fire models. This project has the following specific objectives: • Perform V&V studies of selected fire models using a consistent methodology (ASTM E
1355) and issue a joint report to be prepared by the NRC Office of Nuclear Regulatory Research (RES) and the Electric Power Research Institute (EPRI).
• Investigate the specific fire modeling issues of interest to NPP fire protection applications.
xx
• Quantify fire model predictive capabilities to the extent that can be supported by comparison with selected and available experimental data.
The following fire models were selected for this evaluation: (1) NRC’s NUREG-1805 Fire Dynamics Tools (FDTs), (2) EPRI’s Fire-Induced Vulnerability Evaluation Revision 1 (FIVE-Rev1), (3) National Institute of Standards and Technology’s (NIST) Consolidated Model of Fire Growth and Smoke Transport (CFAST), (4) Electricité de France’s (EdF) MAGIC, and (5) NIST’s Fire Dynamics Simulator (FDS).
Approach This program is based on the guidelines of the ASTM E 1355, Standard Guide for Evaluating the Predictive Capability of Deterministic Fire Models, for V&V of the selected fire models. The guide provides four areas of evaluation:
• Define the model and scenarios for which the evaluation is to be conducted.
• Assess the appropriateness of the theoretical basis and assumptions used in the model.
• Assess the mathematical and numerical robustness of the model.
• Validate the model by quantifying the accuracy of the model results in predicting the course of events for specific fire scenarios.
Traditionally, a V&V study reports the comparison of model results with experimental data, and therefore, the V&V of the fire model is for the specific fire scenarios of the test series. While V&V studies for the selected fire models exist, it is necessary to ensure that technical issues specific to the use of these fire models in NPP applications are investigated. The approach below was followed to fulfill this objective:
1. A set of general fire scenarios were developed. These fire scenarios establish the “ranges of conditions” for which fire models will be applied in NPPs.
2. The next step summarizes the same attributes or “range of conditions” of the “fire scenarios” in test series available for fire model benchmarking and validation exercises.
3. Once the above two pieces of information were available, the validation test series (or tests within a series) that represents the “range of conditions” was mapped for the fire scenarios developed in Step 1. The range of uncertainties in the output variable of interest as predicted by the model for a specific “range of conditions” or “fire scenario” was calculated and reported.
The scope of this V&V study is limited to the capabilities of the selected fire models. There are potential fire scenarios in NPP fire modeling applications that do not fall within the capabilities of these fire models and, therefore, are not covered by this V&V study.
Results The results of this study are presented in the form of relative differences between fire model predictions and experimental data for fire modeling attributes important to NPP fire modeling applications (e.g., plume temperature). The relative differences sometimes show agreement, but
xxi
may also show both under-prediction and over-prediction. These relative differences are affected by the capabilities of the models, the availability of accurate applicable experimental data, and the experimental uncertainty of this data. The relative differences were used, in combination with some engineering judgment as to the appropriateness of the model and the agreement between model and experiment, to produce a graded characterization of the fire model’s capability to predict attributes important to NPP fire modeling applications.
This report does not provide relative differences for all known fire scenarios in NPP applications. This incompleteness is attributable to a combination of model capability and lack of relevant experimental data. The first can be addressed by improving the fire models, while the second needs more applicable fire experiments.
EPRI Perspective The use of fire models to support fire protection decision-making requires that their limitations and confidence in their predictive capability are well-understood. While this report makes considerable progress toward that goal, it also points to ranges of accuracies in the predictive capability of these fire models that could limit their use in fire modeling applications. Use of these fire models presents challenges that should be addressed if the fire protection community is to realize the full benefit of fire modeling and performance-based fire protection. This requires both short-term and long-term solutions. In the short-term, a methodology will be to educate users on how the results of this work may affect known applications of fire modeling. This may be accomplished through pilot application of the findings of this report and documentation of the insights as they may influence decision-making. Note that the intent is not to describe how a decision is to be made, but rather to offer insights as to where and how these results may, or may not be used as the technical basis for a decision. In the long-term, additional work on improving the models and performing additional experiments should be considered.
Keywords Fire Fire Modeling Verification and Validation (V&V) Performance-Based Risk-Informed Regulation Fire Hazard Analysis (FHA) Fire Safety Fire Protection Nuclear Power Plant Fire Probabilistic Risk Assessment (PRA) Fire Probabilistic Safety Assessment (PSA)

xxiii
PREFACE
This report is presented in seven volumes. Volume 1, the Main Report, provides general background information, programmatic and technical overviews, and project insights and conclusions. Volume 2 quantifies the uncertainty of the experiments used in the V&V study of these five fire models. Volumes 3 through 6 provide detailed discussions of the verification and validation (V&V) of the following five fire models:
Volume 3 Fire Dynamics Tools (FDTs)
Volume 4 Fire-Induced Vulnerability Evaluation, Revision 1 (FIVE-Rev1)
Volume 5 Consolidated Model of Fire Growth and Smoke Transport (CFAST)
Volume 6 MAGIC
Volume 7 Fire Dynamics Simulator (FDS)

xxv
ACKNOWLEDGMENTS
The work documented in this report benefited from contributions and considerable technical support from several organizations.
The verification and validation (V&V) studies for FDTs (Volume 3), CFAST (Volume 5), and FDS (Volume 7) were conducted in collaboration with the U.S. Department of Commerce, National Institute of Standards and Technology (NIST), Building and Fire Research Laboratory (BFRL). Since the inception of this project in 1999, the NRC has collaborated with NIST through an interagency memorandum of understanding (MOU) and conducted research to provide the necessary technical data and tools to support the use of fire models in nuclear power plant fire hazard analysis (FHA).
We appreciate the efforts of Doug Carpenter and Rob Schmidt of Combustion Science Engineers, Inc. for their comments and contributions to Volume 3.
In addition, we acknowledge and appreciate the extensive contributions of Electricité de France (EdF) in preparing Volume 6 for MAGIC.
We thank Drs. Charles Hagwood and Matthew Bundy of NIST for the many helpful discussions regarding Volume 2.
We also appreciate the efforts of organizations participating in the International Collaborative Fire Model Project (ICFMP) to Evaluate Fire Models for Nuclear Power Plant Applications, which provided experimental data, problem specifications, and insights and peer comment for the international fire model benchmarking and validation exercises, and jointly prepared the panel reports used and referred to in this study. We specifically appreciate the efforts of the Building Research Establishment (BRE) and the Nuclear Installations Inspectorate in the United Kingdom, which provided leadership for ICFMP Benchmark Exercise (BE) #2, as well as Gesellschaft für Anlagen-und Reaktorsicherheit (GRS) and Institut für Baustoffe, Massivbau und Brandschutz (iBMB) in Germany, which provided leadership and valuable experimental data for ICFMP BE #4 and BE #5. In particular, ICFMP BE #2 was led by Stewart Miles at BRE; ICFMP BE #4 was led by Walter Klein-Hessling and Marina Rowekamp at GRS, and R. Dobbernack and Olaf Riese at iBMB; and ICFMP BE #5 was led by Olaf Riese and D. Hosser at iBMB, and Marina Rowekamp at GRS. Simo Hostikka of VTT, Finland also assisted with ICFMP BE#2 by providing pictures, tests reports, and answered various technical questions of those experiments. We acknowledge and sincerely appreciate all of their efforts.
xxvi
We greatly appreciate Paula Garrity, Technical Editor for the Office of Nuclear Regulatory Research, and Linda Stevenson, agency Publications Specialist, for providing editorial and publishing support for this report. Lionel Watkins and Felix Gonzalez developed the graphics for Volume 1. We also greatly appreciate Dariusz Szwarc and Alan Kouchinsky for their assistance finalizing this report.
We wish to acknowledge the team of peer reviewers who reviewed the initial draft of this report and provided valuable comments. The peer reviewers were Dr. Craig Beyler and Mr. Phil DiNenno of Hughes Associates, Inc., and Dr. James Quintiere of the University of Maryland.
Finally, we would like to thank the internal and external stakeholders who took the time to provide comments and suggestions on the initial draft of this report when it was published in the Federal Register (71 FR 5088) on January 31, 2006. Those stakeholders who commented are listed and acknowledged below.
Janice Bardi, ASTM International
Moonhak Jee, Korea Electric Power Research Institute
U. S. Nuclear Regulatory Commission, Office of Nuclear Reactor Regulation Fire Protection Branch
J. Greg Sanchez, New York City Transit
David Showalter, Fluent, Inc.
Douglas Carpenter, Combustion Science & Engineering, Inc.
Nathan Siu, U.S. Nuclear Regulatory Commission, Office of Nuclear Regulatory Research
Clarence Worrell, Pacific Gas & Electric
xxvii
LIST OF ACRONYMS
AGA American Gas Association
AHJ Authority Having Jurisdiction
ASME American Society of Mechanical Engineers
ASTM American Society for Testing and Materials
BE Benchmark Exercise
BFRL Building and Fire Research Laboratory
BRE Building Research Establishment
BWR Boiling-Water Reactor
CDF Core Damage Frequency
CFAST Consolidated Fire Growth and Smoke Transport Model
CFD Computational Fluid Dynamics
CFR Code of Federal Regulations
CSR Cable Spreading Room
EdF Electricité de France
EPRI Electric Power Research Institute
FDS Fire Dynamics Simulator
FDTs Fire Dynamics Tools (NUREG-1805)
FHA Fire Hazard Analysis
FIVE-Rev1 Fire-Induced Vulnerability Evaluation, Revision 1
xxviii
FM/SNL Factory Mutual & Sandia National Laboratories
FPA Foote, Pagni, and Alvares
FRA Fire Risk Analysis
GRS Gesellschaft für Anlagen-und Reaktorsicherheit (Germany)
HGL Hot Gas Layer
HRR Heat Release Rate
IAFSS International Association of Fire Safety Science
iBMB Institut für Baustoffe, Massivbau und Brandschutz
ICFMP International Collaborative Fire Model Project
IEEE Institute of Electrical and Electronics Engineers
IPEEE Individual Plant Examination of External Events
MCC Motor Control Center
MCR Main Control Room
MQH McCaffrey, Quintiere, and Harkleroad
MOU Memorandum of Understanding
NBS National Bureau of Standards (now NIST)
NFPA National Fire Protection Association
NIST National Institute of Standards and Technology
NPP Nuclear Power Plant
NRC U.S. Nuclear Regulatory Commission
NRR Office of Nuclear Reactor Regulation (NRC)
PMMA Polymethyl-methacrylate
PWR Pressurized Water Reactor
xxix
RCP Reactor Coolant Pump
RES Office of Nuclear Regulatory Research (NRC)
RI/PB Risk-Informed, Performance-Based
SBDG Stand-By Diesel Generator
SDP Significance Determination Process
SFPE Society of Fire Protection Engineers
SWGR Switchgear Room
V&V Verification & Validation

1-1
1 INTRODUCTION
As the use of fire modeling tools increases in support of day-to-day nuclear power plant (NPP) applications including fire risk studies, the importance of verification and validation (V&V) studies for these tools also increases. V&V studies provide the fire modeling analysts increased confidence in applying analytical tools by quantifying and discussing the performance of the given model in predicting the fire conditions measured in a particular experiment. The underlying assumptions, capabilities, and limitations of the model are discussed and evaluated as part of the V&V study.
The main objective of this volume is to document a V&V study for the Consolidated Fire Growth and Smoke Transport (CFAST) zone model. As such, this report describes the equations that constitute the model, the physical bases for those equations, and an evaluation of the sensitivity and predictive capability of the model.
CFAST is a two-zone fire model capable of predicting the fire-induced environmental conditions as a function of time for single- or multi-compartment scenarios. Toward that end, the CFAST software calculates the temperature and evolving distribution of smoke and fire gases throughout a building during a user-prescribed fire. The model was developed, and is maintained, by the Fire Research Division of the National Institute of Standards and Technology (NIST), which officially released the latest version of the CFAST model in 2004.
CFAST is a zone model, in that it subdivides each compartment into two zones, or control volumes, in order to numerically solve differential equations, and the two volumes are assumed to be homogeneous within each zone. This two-zone approach has evolved from observations of layering in actual fires and real-scale fire experiments. The approximate solution of the mass and energy balances of each zone, together with the ideal gas law and the equation of heat conduction into the walls, attempts to simulate the environmental conditions generated by a fire.
To accompany the model and simplify its use, NIST has developed a Technical Reference Guide [Ref. 1] that provides a detailed description of the models and numerical solutions in CFAST. That guide also documents a V&V study for the broad applications of CFAST (without specific reference to NPPs). That study was conducted at the request of the U.S. Nuclear Regulatory Commission (NRC), in accordance with ASTM E 1355, Standard Guide for Evaluating the Predictive Capability of Deterministic Fire Models [Ref. 2], issued by the American Society for Testing and Materials (ASTM). As such, this report extensively references both the CFAST Technical Reference Guide and ASTM E 1355.
Introduction
1-2
Consistent with the CFAST Technical Reference Guide and ASTM E 1355, this report is structured as follows:
• Chapter 2 provides qualitative background information about CFAST and the V&V process.
• Chapter 3 presents a brief technical description of CFAST, including a review of the underlying physics and chemistry.
• Chapter 4 documents the mathematical and numerical robustness of CFAST, which involves verifying that the implementation of the model matches the stated documentation.
• Chapter 5 presents a sensitivity analysis, for which the researchers defined a base case scenario and varied selected input parameters in order to explore CFAST capabilities for modeling typical characteristics of NPP fire scenarios.
• Chapter 6 presents the results of the validation study in the form of percent differences between CFAST simulations and experimental data for relevant attributes of enclosure fires in NPPs.
• Appendix A presents the technical details supporting the calculated accuracies discussed in Chapter 6.
• Appendix B presents all of the CFAST input files for the simulations in this V&V study.
2-1
2 MODEL DEFINITION
This chapter provides qualitative background information about CFAST and the V&V process, as outlined by ASTM E 1355 [Ref. 2]. The definitive description of the CFAST model, including its developers, equations, assumptions, inputs, and outputs can be found in the CFAST Technical Reference Guide [Ref. 1], which also follows the guidelines for ASTM E 1355.
2.1 Name and Version of the Model
This V&V study focused on Version 6.0.10 of the Consolidated Fire Growth and Smoke Transport (CFAST) Model. Most of the code is written in FORTRAN 90. Chapter 2 of the CFAST Technical Reference Guide [Ref. 1] provides a more detailed description of the evolution of the model.
2.2 Type of Model
CFAST is a two-zone fire model that predicts the fire-induced environment as a function of time for single- or multi-compartment scenarios. CFAST subdivides each compartment into two zones (or volumes) in order to numerically solve differential equations, and the two volumes are assumed to be uniform in temperature and species concentration. The approximate solution of the conservation equations for each zone, together with the ideal gas law and the equation of heat conduction into the walls, attempts to simulate the environmental conditions generated by a fire.
2.3 Model Developers
The CFAST model was developed, and is maintained, by the Fire Research Division of NIST. The developers include Walter Jones, Richard Peacock, Glenn Forney, Rebecca Portier, Paul Reneke, John Hoover, and John Klote.
2.4 Relevant Publications
Relevant publications concerning CFAST include the CFAST Technical Reference Guide [Ref. 1] and User’s Guide [Ref. 3]. The Technical Reference Guide describes the underlying physical principles, provides a comparison with experimental data, and describes the limitations of the model. The User’s Guide describes how to use the model. In addition, numerous related documents available at http://cfast.nist.gov provide a wealth of information concerning Versions 2, 3, 4 and 5 of both the model and its user interface.
Model Definition
2-2
2.5 Governing Equations and Assumptions
Section 2.1.5 and Chapter 3 of the CFAST Technical Reference Guide [Ref. 1] fully describe the equations and assumptions associated with the CFAST model. The general equations solved by the CFAST model include conservation of mass and energy. The model does not explicitly solve the momentum equation, except for use of the Bernoulli equation for the flow velocity at vents. These equations are solved as ordinary differential equations.
The CFAST model is implemented based on two general assumptions: (1) two zones per compartment provide a reasonable approximation of the scenario being evaluated, and (2) the complete momentum equation is not needed to solve the set of equations associated with the model. Consequently, the two zones have uniform properties. That is, the temperature and gas concentrations are assumed to be constant throughout the zone; the properties only change as a function of time.
2.6 Input Data Required to Run the Model
All of the data required to run the CFAST model reside in a primary data file, which the user creates. Some instances may require databases of information on objects, thermophysical properties of boundaries, and sample prescribed fire descriptions. In general, the data files contain the following information:
• compartment dimensions (height, width, length)
• construction materials of the compartment (e.g., concrete, gypsum)
• material properties (e.g., thermal conductivity, specific heat, density, thickness, heat of combustion)
• dimensions and positions of horizontal and vertical flow openings such as doors, windows, and vents
• mechanical ventilation specifications
• fire properties (e.g., heat release rate, lower oxygen limit, and species production rates as a function of time)
• sprinkler and detector specifications
• positions, sizes, and characteristics of targets
The CFAST User’s Guide [Ref. 3] provides a complete description of the required input parameters. Some of these parameters have default values included in the model, which are intended to be representative for a range of fire scenarios. Unless explicitly noted, default values were used for parameters not specifically included in this validation study.
Model Definition
2-3
2.7 Property Data
Required inputs for CFAST include a number of material properties related to compartment bounding surfaces, objects (called targets) placed in compartments for calculation of object surface temperature and heat flux to the objects, or fire sources. For compartment surfaces and targets, CFAST needs the density, thermal conductivity, specific heat, and emissivity.
For fire sources, CFAST needs to know the pyrolysis rate of fuel, the heat of combustion, stochiometric fuel-oxygen ratio, yields of important combustion products in a simplified combustion reaction (carbon monoxide, carbon dioxide, soot, and others), and the fraction of energy released in the form of thermal radiation.
These properties are commonly available in fire protection engineering and materials handbooks. Experimentally determined property data may also be available for certain scenarios. However, depending on the application, properties for specific materials may not be readily available. A small file distributed with the CFAST software contains a database with thermal properties of common materials. These data are given as examples, and users should verify the accuracy and appropriateness of the data.
2.8 Model Results
Once the simulation is complete, CFAST produces an output file containing all of the solution variables. Typical outputs include (but are not limited to) the following:
• environmental conditions in the room (such as hot gas layer temperature; oxygen and smoke concentration; and ceiling, wall, and floor temperatures)
• heat transfer-related outputs to walls and targets (such as incident convective, radiated, and total heat fluxes)
• fire intensity and flame height
• flow velocities through vents and openings
• sprinkler activation time
2.9 Uses and Limitations of the Model
CFAST has been developed for use in solving practical fire problems in fire protection engineering, while also providing a tool to study fundamental fire dynamics and smoke spread. It is intended for use in system modeling of building and building components. It is not intended for detailed study of flow within a compartment, such as is needed for smoke detector siting. It includes the activation of sprinklers and fire suppression by water droplets.
Model Definition
2-4
The most extensive use of the model is in fire and smoke spread in complex buildings. The efficiency and computational speed are inherent in the few computation cells needed for a zone model implementation. The use is for design and reconstruction of time-lines for fire and smoke spread in residential, commercial, and industrial fire applications. Some applications of the model have been for design of smoke control systems.
• Compartments: CFAST is generally limited to situations where the compartment volumes are strongly stratified. However, in order to facilitate the use of the model for preliminary estimates when a more sophisticated calculation is ultimately needed, there are algorithms for corridor flow, smoke detector activation, and detailed heat conduction through solid boundaries. This model does provide for non-rectangular compartments, although the application is intended to be limited to relatively simple spaces. There is no intent to include complex geometries where a complex flow field is a driving force. For these applications, computational fluid dynamics (CFD) models are appropriate.
• Gas Layers: There are also limitations inherent in the assumption of stratification of the gas layers. The zone model concept, by definition, implies a sharp boundary between the upper and lower layers, whereas in reality, the transition is typically over about 10% of the height of the compartment and can be larger in weakly stratified flow. For example, a burning cigarette in a normal room is not within the purview of a zone model. While it is possible to make predictions within 5% of the actual temperatures of the gas layers, this is not the optimum use of the model. It is more properly used to make estimates of fire spread (not flame spread), smoke detection and contamination, and life safety calculations.
• Heat Release Rate: There are limitations inherent in the assumptions used in application of the empirical models. As a general guideline, the heat release should not exceed about 1 MW/m3. This is a limitation on the numerical routines attributable to the coupling between gas flow and heat transfer through boundaries (conduction, convection, and radiation). The inherent two-layer assumption is likely to break down well before this limit is reached.
• Radiation: Because the model includes a sophisticated radiation model and ventilation algorithms, it has further use for studying building contamination through the ventilation system, as well as the stack effect and the effect of wind on air circulation in buildings.
• Ventilation and Leakage: In a single compartment, the ratio of the area of vents connecting one compartment to another to the volume of the compartment should not exceed roughly 2 m-1. This is a limitation on the plug flow assumption for vents. An important limitation arises from the uncertainty in the scenario specification. For example, leakage in buildings is significant, and this affects flow calculations especially when wind is present and for tall buildings. These effects can overwhelm limitations on accuracy of the implementation of the model. The overall accuracy of the model is closely tied to the specificity, care, and completeness with which the data are provided.
Model Definition
2-5
• Thermal Properties: The accuracy of the model predictions is limited by how well the user can specify the thermophysical properties. For example, the fraction of fuel which ends up as soot has an important effect on the radiation absorption of the gas layer and, therefore, the relative convective versus radiative heating of the layers and walls, which in turn affects the buoyancy and flow. There is a higher level of uncertainty of the predictions if the properties of real materials and real fuels are unknown or difficult to obtain, or the physical processes of combustion, radiation, and heat transfer are more complicated than their mathematical representations in CFAST.
In addition, there are specific limitations and assumptions made in the development of the algorithms. These are detailed in the discussion of each of these sub-models in the NIST Technical Reference Guide [Ref. 1].

3-1
3 THEORETICAL BASIS FOR CFAST
This chapter presents a technical description of the CFAST model, including its theoretical background and the underlying physics and chemistry inherent in the model. The description includes assumptions and approximations, an assessment of whether the open literature provides sufficient scientific evidence to justify the approaches and assumptions used, and an assessment of empirical or reference data used for constant or default values in the context of the model. In so doing, this chapter addresses the ASTM E 1355 guidance to “verify the appropriateness of the theoretical basis and assumptions used in the model.”
Chapter 3 of the CFAST Technical Reference Guide [Ref. 1] presents a comprehensive discussion concerning the theoretical basis for CFAST, including the theory underlying the implementation of the model. In so doing, it enables the user to assess the appropriateness of the model for specific problems. In addition, Chapter 3 of Reference 1 derives the predictive equations for zone fire models and presents a detailed explanation of those used in CFAST [Refs. 4 and 5].
3.1 The Two-Layer Model
CFAST is a classic two-zone fire model. For a given fire scenario, the model subdivides a compartment into two control volumes, which include a relatively hot upper layer and a relatively cool lower layer. In addition, mass and energy are transported between the layers via the fire plume. The lower layer is primarily fresh air. By contrast, the hot upper layer (which is also known as the hot gas layer) is where combustion products accumulate via the plume. Each layer has its own energy and mass balances.
The most important assumption for the model is that each zone has uniform properties. That is, the temperature and gas concentrations are assumed to be constant throughout the zone; the properties only change as a function of time. The CFAST model describes the conditions in each zone by solving equations for conservation of mass, species, and energy, along with the ideal gas law. The Technical Reference Guide for CFAST [Ref. 1] provides a detailed discussion concerning the specific derivation of these conservation laws.
For some applications, including long hallways or tall shafts, the two-zone assumption may not be appropriate. CFAST includes empirical algorithms to simulate smoke flow and filling in long corridors and for a single well-mixed volume in tall shafts.
Theoretical Basis for CFAST
3-2
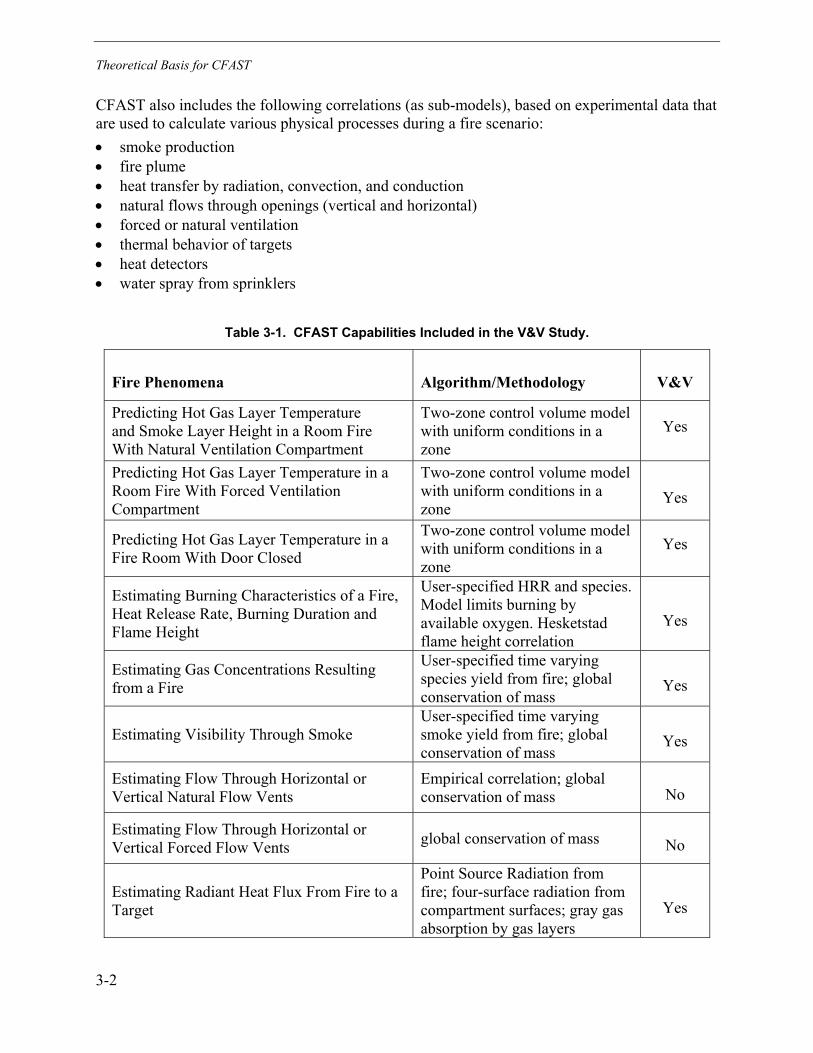
CFAST also includes the following correlations (as sub-models), based on experimental data that are used to calculate various physical processes during a fire scenario: • smoke production • fire plume • heat transfer by radiation, convection, and conduction • natural flows through openings (vertical and horizontal) • forced or natural ventilation • thermal behavior of targets • heat detectors • water spray from sprinklers
Table 3-1. CFAST Capabilities Included in the V&V Study.
Fire Phenomena Algorithm/Methodology V&V
Predicting Hot Gas Layer Temperature and Smoke Layer Height in a Room Fire With Natural Ventilation Compartment
Two-zone control volume model with uniform conditions in a zone
Yes
Predicting Hot Gas Layer Temperature in a Room Fire With Forced Ventilation Compartment
Two-zone control volume model with uniform conditions in a zone
Yes
Predicting Hot Gas Layer Temperature in a Fire Room With Door Closed
Two-zone control volume model with uniform conditions in a zone
Yes
Estimating Burning Characteristics of a Fire, Heat Release Rate, Burning Duration and Flame Height
User-specified HRR and species. Model limits burning by available oxygen. Hesketstad flame height correlation
Yes
Estimating Gas Concentrations Resulting from a Fire
User-specified time varying species yield from fire; global conservation of mass
Yes
Estimating Visibility Through Smoke User-specified time varying smoke yield from fire; global conservation of mass
Yes
Estimating Flow Through Horizontal or Vertical Natural Flow Vents
Empirical correlation; global conservation of mass No
Estimating Flow Through Horizontal or Vertical Forced Flow Vents global conservation of mass No
Estimating Radiant Heat Flux From Fire to a Target
Point Source Radiation from fire; four-surface radiation from compartment surfaces; gray gas absorption by gas layers
Yes
Theoretical Basis for CFAST
3-3
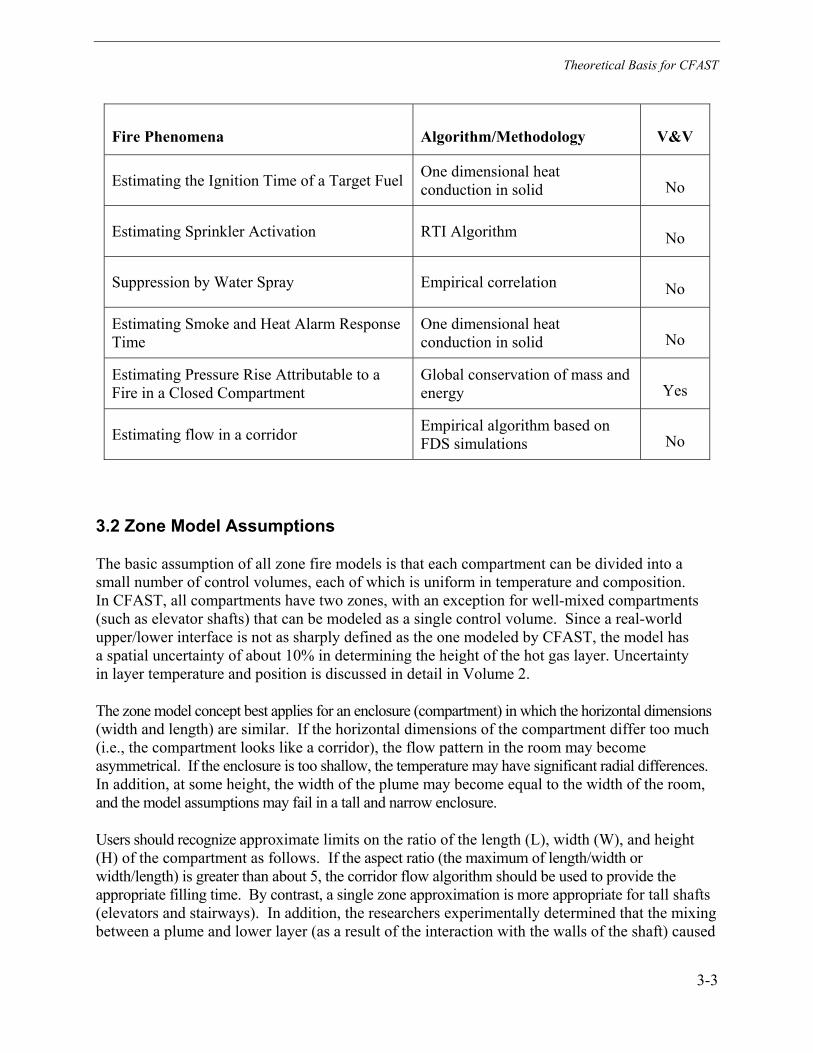
Fire Phenomena Algorithm/Methodology V&V
Estimating the Ignition Time of a Target Fuel One dimensional heat conduction in solid No
Estimating Sprinkler Activation RTI Algorithm No
Suppression by Water Spray Empirical correlation No
Estimating Smoke and Heat Alarm Response Time
One dimensional heat conduction in solid No
Estimating Pressure Rise Attributable to a Fire in a Closed Compartment
Global conservation of mass and energy Yes
Estimating flow in a corridor Empirical algorithm based on FDS simulations No
3.2 Zone Model Assumptions
The basic assumption of all zone fire models is that each compartment can be divided into a small number of control volumes, each of which is uniform in temperature and composition. In CFAST, all compartments have two zones, with an exception for well-mixed compartments (such as elevator shafts) that can be modeled as a single control volume. Since a real-world upper/lower interface is not as sharply defined as the one modeled by CFAST, the model has a spatial uncertainty of about 10% in determining the height of the hot gas layer. Uncertainty in layer temperature and position is discussed in detail in Volume 2.
The zone model concept best applies for an enclosure (compartment) in which the horizontal dimensions (width and length) are similar. If the horizontal dimensions of the compartment differ too much (i.e., the compartment looks like a corridor), the flow pattern in the room may become asymmetrical. If the enclosure is too shallow, the temperature may have significant radial differences. In addition, at some height, the width of the plume may become equal to the width of the room, and the model assumptions may fail in a tall and narrow enclosure.
Users should recognize approximate limits on the ratio of the length (L), width (W), and height (H) of the compartment as follows. If the aspect ratio (the maximum of length/width or width/length) is greater than about 5, the corridor flow algorithm should be used to provide the appropriate filling time. By contrast, a single zone approximation is more appropriate for tall shafts (elevators and stairways). In addition, the researchers experimentally determined that the mixing between a plume and lower layer (as a result of the interaction with the walls of the shaft) caused
Theoretical Basis for CFAST
3-4
complete mixing. This is the inverse of the corridor problem, and occurs at an aspect ratio (the maximum of height/width or height/length) of about 5. A recommended rule is as follows. If the width-to-length aspect ratio (the maximum of length/width or width/length) is greater than 5, use of the corridor flow algorithm is appropriate. If the width-to-length aspect ratio is greater than 3 but less than 5, the corridor flow algorithm may or may not be appropriate; consider the results from a simulation with and without the algorithm to assess its appropriateness. If the room is not a corridor and the height aspect ratio (the maximum height/width or height/length) is greater than 5, the single zone approximation is appropriate.
3.3 Description of Sub-Models and Correlations
This section discusses each of the sub-models incorporated in CFAST. In general, Sections 3.3.1 through 3.3.11 are organized in a manner similar to the structure of the model itself.
3.3.1 The Fire
CFAST simulates a fire as a mass of fuel that burns at a prescribed “pyrolysis” rate and releases both energy and combustion products. The model also has the capability to simulate both unconstrained and constrained fires. For an unconstrained fire, CFAST simulates a fire that simply releases mass and energy at the pyrolysis rate prescribed by the user; the model neither calculates nor tracks the products of combustion. By contrast, for a constrained fire, CFAST calculates species production based on user-defined production yields, and both the pyrolysis rate and the resulting energy and species generation may be limited by the oxygen available for combustion. When sufficient oxygen is available for combustion, the heat release rate (HRR) for a constrained fire is the same as for an unconstrained fire. Fire height is also calculated by the model based on an available experimental correlation [Ref. 6].
CFAST also has the capability to simulate multiple fires in multiple compartments. In such instances, CFAST treats each individual fire as an entirely separate entity, with no interaction with other fire plumes.
The user must define fire growth because CFAST does not include a model to predict fire growth. While this approach does not directly account for increased pyrolysis attributable to radiative feedback from the flame or compartment, the user could prescribe such effects though multiple simulations.
3.3.2 Plumes
CFAST models the flame and plume regions around a fuel source using McCaffrey’s correlation, which divides the flame/plume into three regions [Ref. 7]. McCaffrey estimated temperature, velocity, and the mass entrained by the fire/plume from the lower layer into the upper layer. McCaffrey’s correlation is an extension of the common point source plume model, with a different set of coefficients for each region. These coefficients are experimental correlations. However, the model does not output plume temperatures. For a detailed description of
Theoretical Basis for CFAST
3-5
constraints CFAST puts on air entrained into the plume, please refer to the CFAST Technical Reference Guide [Ref. 1].
3.3.3 Ceiling Jet
CFAST uses Cooper’s correlation [Ref. 8] to simulate the ceiling jet flows and convective heat transfer from fire plume gases to the overhead ceiling surface in the room of fire origin. In so doing, the model accounts for the effect on heat transfer as a result of the fire’s location within the room. Complete details are available in Reference 8.
3.3.4 Vent Flow
CFAST models both horizontal flow through vertical vents (doors, windows, wall vents, etc.) and vertical flow through horizontal vents (ceiling holes, hatches, roof vents, etc.). Horizontal flow is normally thought of when discussing fires.
Horizontal vent flow through vertical vents is determined using the pressure difference across a vent. Flow at a given elevation may be computed using Bernoulli’s law by computing the pressure difference at that elevation and then the pressure on each side of the vent. This solution is augmented for restricted openings by using flow coefficients from Quintiere et al. [Ref. 9] to allow for constriction from finite door sizes. The flow (or orifice) coefficient is an empirical term, which addresses the problem of constriction of velocity streamlines at an orifice.
Cooper’s algorithm [Ref. 10] is used for computing vertical mass flow through horizontal vents. The algorithm is based on correlations to model the two components of the flow, including a net flow dictated by a pressure difference, and the exchange flow based on the relative densities of the gases.
There is a special case of horizontal flow in long corridors. Specifically, CFAST incorporates a corridor flow algorithm to calculate the ceiling jet temperature and depth as a function of time until it reaches the end of the corridor. A computational fluid dynamics model was used to develop the correlations that CFAST uses to compute flows between corridors and compartments. A more detailed description of this work is found in the CFAST Technical Reference Guide [Ref. 1].
The model for mechanical ventilation used in CFAST is based on the model developed by Klote [Ref. 11]. Flow in ductwork is calculated with a mass and energy balance based on an analogy to electrical current flow in series and parallel based on Kirchoff’s law. The CFAST Technical Reference Guide [Ref. 1] describes the modeling of ducts and fans in CFAST.
3.3.5 Heat Transfer
This section discusses radiation, convection, and conduction — the three mechanisms by which heat is transferred between the gas layers and objects and enclosing compartment walls. The CFAST Technical Reference Guide [Ref. 1] provides a more complete description of the algorithms used in CFAST.
Theoretical Basis for CFAST
3-6
3.3.5.1 Radiation
Radiative transfer occurs among the fire(s), gas layers, and compartment surfaces (ceiling, walls, and floor). This transfer is a function of the temperature differences and emissivity of the gas layers, as well as the compartment surfaces. The radiation model in CFAST assumes that (1) all zones and surfaces radiate and absorb like a gray body, (2) the fires radiate as point sources, and (3) the plume above the fire does not radiate at all. Radiative heat transfer is approximated using a limited number of radiating wall surfaces (four in the fire room and two everywhere else). The use of these and other approximations allows CFAST to perform the radiation computation in a reasonably efficient manner [Ref. 12].
3.3.5.2 Convection
The typical correlations that CFAST uses for convective heat transfer are available in the literature. Specifically, Atreya summarizes convective heat flux calculation methods in the SFPE handbook
[Ref. 13].
3.3.5.3 Conduction
CFAST uses a finite difference scheme from Moss and Forney [Ref. 14], which utilizes a non-uniform spatial mesh to advance the wall temperature solution. The heat equation is discretized using a second-order central difference for the spatial derivative and a backward difference for the time derivative. This process is repeated until the heat flux striking the wall (calculated from the convection and radiation algorithms) is consistent with the flux conducted into the wall (calculated using Fourier’s law). Heat transfer between compartments can be modeled by merging the connected surfaces for the ceiling and floor compartments or for the connected horizontal compartments.
3.3.6 Targets
The calculation of the radiative heat flux to a target is similar to the radiative heat transfer calculation discussed in Section 3.3.5.1. The main difference is that CFAST does not compute feedback from the target to the wall surfaces or gas layers. The target is simply a probe or sensor that does not interact with the modeled environment. The net flux striking a target can be used as a boundary condition in order to compute the temperature of the target. The four sources of heat flux to a target are fire radiation, radiation from walls (including the ceiling and floor), gas layer radiation, and gas layer convection.
3.3.7 Heat Detectors
CFAST models heat detector (including sprinkler head) activation using Heskestad’s method [Ref. 15] with temperatures obtained from the ceiling jet calculation [Ref. 8]. Rooms without fires do not have ceiling jets; therefore, detectors in such rooms use gas layer temperatures instead of ceiling jet temperatures.
Theoretical Basis for CFAST
3-7
3.3.8 Fire Suppression via Sprinklers
For sprinkler suppression, CFAST uses the simple model by Madrzykowski and Vettori [Ref. 16], which is generalized for varying sprinkler spray densities according to Evans [Ref. 17]. The suppression correlation was developed by modifying the heat release rate of a fire. The CFAST Technical Reference Manual [Ref. 1] outlines the assumptions and limitations of this approach.
3.3.9 Species Concentration and Deposition
The combustion chemistry scheme used in CFAST is documented in the CFAST Technical Reference Guide [Ref. 1]. The scheme is based on a carbon-hydrogen-oxygen balance applied in three locations. The first is in the fire and plume in the lower layer of the compartment, the second is in the upper layer, and the third is in the vent flow between adjacent compartments. This scheme basically solves the conservation equations for each species independently.
CFAST tracks the masses of an individual species as they are generated, transported, or mixed. As fuel is combusted, the user-prescribed species yield defines the mass of the species to be tracked. Each unit mass of a species produced is carried in the flow to the various rooms and accumulates in the layers. The model keeps track of the mass of each species in each layer, and records the volume of each layer as a function of time. The mass divided by the volume is the mass concentration, which along with the molecular weight provides the concentration in volume percent or parts per million (ppm) as appropriate. For hydrogen chloride, CFAST includes an empirical correlation that allows for deposition on and absorption by material surfaces.
3.4 Review of the Theoretical Development of the Model
The current version of ASTM E 1355 includes provisions to guide assessment of the model’s theoretical basis. Those provisions include a review of the model “by one or more recognized experts fully conversant with the chemistry and physics of fire phenomenon, but not involved with the production of the model. Publication of the theoretical basis of the model in a peer-reviewed journal article may be sufficient to fulfill this review” [Ref. 2]. NIST’s Technical Reference Guide for CFAST [Ref. 1] addresses the necessary elements of a review of the model’s technical bases.
CFAST has been subjected to independent review both internally (at NIST) and externally. NIST documents and products receive extensive reviews by NIST experts not associated with development. The same reviews have been conducted on all previous versions of the model and Technical Reference Guide over the last decade. Externally, the model’s theoretical basis has been published in peer reviewed journals [Refs. 18, 19, and 20], and conference proceedings [Ref. 21]. In addition, CFAST is used worldwide by fire protection engineering firms that review the technical details of the model related to their particular application. Some of these firms also publish (in the open literature) reports documenting internal efforts to validate the model for a particular use. Finally, CFAST has been reviewed and included in industry-standard handbooks such as the Society of Fire Protection Engineers (SFPE) Handbook [Ref. 22], and referenced in specific standards including NFPA 805 [Ref. 23] and NFPA 551 [Ref. 24].
Theoretical Basis for CFAST
3-8
3.4.1 Assessment of the Completeness of Documentation
The two primary documents on CFAST are the Technical Reference Guide [Ref. 1] and Model User’s Guide [Ref. 3]. The Technical Reference Guide documents the governing equations, assumptions, and approximations of the various sub models, and it includes a summary description of the model structure and numerics. In addition, the Technical Reference Guide documents a V&V study for the broad applications of CFAST (without specific reference to NPPs). That study was conducted at the request of the U.S. Nuclear Regulatory Commission (NRC), in accordance with ASTM E 1355 [Ref. 2]. The model User’s Guide includes a description of the model input data requirements and model results.
3.4.2 Assessment of Justification of Approaches and Assumptions
The technical approach and assumptions associated with the CFAST model have been presented in peer-reviewed scientific literature and at technical conferences. Also, all documents released by NIST are required to undergo an internal editorial review and approval process. In addition to formal internal and peer review, CFAST is subjected to ongoing scrutiny because it is available to the general public and is used internationally by those involved in technical areas such as fire safety design and post-fire reconstruction. The source code for CFAST is also released publicly, and has been used at various universities worldwide, both in the classroom (as a teaching tool) and for research. As a result, flaws in the model’s theoretical development and the computer program itself have been identified and rectified. The user base continues to serve as a means to evaluate the model, and this is as important to development of CFAST as formal internal and external peer review processes.
3.4.3 Assessment of Constants and Default Values
No single document provides a comprehensive assessment of the numerical parameters (such as default time step or solution convergence criteria) and physical parameters (such as empirical constants for convective heat transfer or plume entrainment) used in CFAST. Instead, specific parameters have been tested in various V&V studies performed at NIST and elsewhere. Numerical parameters are extracted from the literature and do not undergo a formal review. Model users are expected to assess the appropriateness of default values provided by CFAST and make changes to those values if needed.
4-1
4 MATHEMATICAL AND NUMERICAL ROBUSTNESS
4.1 Introduction
This chapter documents the mathematical and numerical robustness of CFAST, which involves verifying that the implementation of the model matches the stated documentation. Specifically, ASTM E 1355 suggests the following analyses to address the mathematical and numerical robustness of models:
• Analytical tests involve testing the correct functioning of the model. In other words, these tests use the code to solve a problem with a known mathematical solution. However, there are relatively few situations for which analytical solutions are known.
• Code checking refers to verifying the computer code on a structural basis. This verification can be achieved manually or by using a code-checking program to detect irregularities and inconsistencies within the computer code.
• Numerical tests investigate the magnitude of the residuals from the solution of a numerically solved system of equations (as an indicator of numerical accuracy) and the reduction in residuals (as an indicator of numerical convergence).
4.2 Comparison with Analytic Solutions
Certain CFAST sub-models address phenomena that have analytical solutions, for example, one-dimensional heat conduction through a solid or pressure increase in a sealed or slightly leaky compartment as a result of a fire or fan. The developers of CFAST routinely use analytical solutions to test sub-models to verify the correctness of the coding of the model as part of the development. Such routine verification efforts are relatively simple and the results may not always be published or included in the documentation. Two additional types of verification are possible. The first type, discussed in Section 3, “Theoretical Basis,” involves validating individual algorithms against experimental work. The second involves simple experiments, especially for conduction and radiation, for which the results are asymptotic (e.g., for a simple single-compartment test case with no fire, all temperatures should equilibrate asymptotically to a single value). Such comparisons are common and not usually published.
Mathematical and Numerical Robustness
4-2
4.3 Code Checking
Two standard programs have been used to check the CFAST model structure and language. Specifically, FLINT and LINT have been applied to the entire model to verify the correctness of the interface, undefined or incorrectly defined (or used) variables and constants, and completeness of loops and threads.
The CFAST code has also been checked by compiling and running the model on a variety of computer platforms. Because FORTRAN and C are implemented differently for various computers, this represents both a numerical check as well as a syntactic check. CFAST has been compiled for Sun (Solaris), SGI (Irix), Microsoft® Windows®-based PCs (Lahey, Digital, and Intel FORTRAN), and Concurrent computer platforms. Within the precision afforded by the various hardware implementations, the answers are identical.1
The CFAST Technical Reference Guide [Ref. 1] contains a detailed description of the CFAST subroutine structure and interactions between the subroutines. A complete physical description of the code can be found in Reference 25.
This V&V project began using version 6.0.3 of CFAST. As part of the V&V process, several minor bugs have been corrected in this version. These include fixes to the graphical user interface to improve object plotting, the target flux calculation, burning outside the room of fire origin, and error checking for elements located outside a compartment. The updated version of CFAST used in this study (6.0.10) included these fixes.
4.4 Numerical Tests
Two components of the numerical solutions of CFAST must be verified. The first is the DAE solver (called DASSL), which has been tested for a variety of differential equations and is widely used and accepted [Ref. 26]. The radiation and conduction routines have also been tested against known solutions for asymptotic results.
The second component is the coupling between algorithms and the general solver. The structure of CFAST provides close coupling that avoids most errors. The error attributable to numerical solution is far less than that associated with the model assumptions. Also, CFAST is designed to use 64-bit precision for real number calculations to minimize the effects of numerical error.
1 Typically, an error limit of one part in 106.
5-1
5 MODEL SENSITIVITY
This chapter discusses the CFAST sensitivity analysis, which ASTM E 1355 defines as a study of how changes in model parameters affect the results. In other words, sensitivity refers to the rate of change of the model output with respect to input variations. The standard also indicates that model predictions may be sensitive to (1) uncertainties in input data, (2) the level of rigor employed in modeling the relevant physics and chemistry, and (3) the accuracy of numerical treatments. Thus, the purpose of a sensitivity analysis is to assess the extent to which uncertainty in the model inputs is manifested as uncertainty in the model results of interest.
Conducting a sensitivity analysis of a complex model is not a simple task. A sensitivity analysis involves defining a base case scenario, and varying selected input parameters. The resultant variations in the model output are then measured with respect to the base case scenario, in order to consider the extent to which uncertainty in model inputs influences model output. Therefore, a sensitivity analysis of CFAST should account for variations in the extensive number of input parameters that describe the building geometry, compartment connections, construction materials, and description of one or more fires.
ASTM E 1355 [Ref. 2] provides overall guidance on typical areas of evaluation of the sensitivity of deterministic fire models. Chapter 5 of the CFAST Technical Reference Guide [Ref. 1] provides a review of the sensitivity analyses that have been conducted using CFAST, with an emphasis on uncertainty in the input. Other sensitivity investigations of CFAST are also available in References 27, 28, and 29.
5.1 Previous Sensitivity Studies
Khoudja studied the sensitivity of an early version of the FAST model [Ref. 30] (predecessor to CFAST) with a fractional factorial design involving 2 levels of 16 different input parameters. The choice of values for each input parameter represented a range for each parameter. The analysis of the FAST model showed sensitivity to heat loss to the compartment walls and to the number of compartments in the simulation. Without the inclusion of surface thermophysical properties, this model treats surfaces as adiabatic for conductive heat transfer. Thus, consistent sensitivity should be expected. Sensitivity to changes in thermal properties of the surfaces was not explored.
Model Sensitivity
5-2
Walker [Ref. 31] discussed the uncertainties in components of zone models and showed how uncertainty within user-supplied data affects the results of calculations using CFAST as an example. The study systematically varied inputs related to the fire (heat release rate, heat of combustion, mass loss rate, radiative fraction, and species yields) and compartment geometry (vent size and ceiling height) ranging from ±1% to ±20% of base values for a one-compartment scenario. Heat release rate and ceiling height are seen to be the dominant input variables in the simulations. Upper-layer temperature changed ±10% for a ±10% change in heat release rate. Typical variation of ±10 seconds in time to untenable conditions for a 20% variation was noted in the inputs for the scenarios studied.
In addition, the CFAST Technical Reference Guide demonstrates a partial sensitivity analysis for a few CFAST input parameters. For somewhat complex fire scenarios involving four interconnected rooms, the analysis found that upper-layer temperature and pressure are insensitive to small (10%) variations in fire room volume, while the upper-layer volume is neutrally sensitive. NIST’s analysis also varied heat release rates to determine sensitivity to large changes in inputs. In so doing, the analysis determined that the upper-layer temperature is equally sensitive to heat release rate as to compartment volume. A second-level analysis indicated a strong functional upper-layer temperature dependence on heat release rate, but the sensitivity is less than 1 K/kW in the example case for HRRs greater than 100 kW. The third-level analysis indicated that HRRs have more of an effect on upper-layer temperatures than do vent areas.
Notarianni [Ref. 29] developed an iterative methodology for the treatment of uncertainty in fire-safety engineering calculations to identify important model parameters for detailed study of uncertainty. She defined a nine-step process to identify crucial model inputs and parameters, select sampling methods appropriate for the important parameters, and evaluate the sensitivity of the model to chosen outcomes. Both factorial designs and Latin hypercube sampling are included in a case study involving the CFAST model. In a performance-based design of a 16-story residential structure, the impact of model uncertainty on a chosen design and inclusion of residential sprinklers in the design would effect the resulting safety of the design. For a seven-compartment scenario representing one living unit in the structure, distributions of input variables based on Latin hypercube sampling of selected ranges of the inputs were developed and used as input for a series of 500 CFAST simulations for the scenario. The results of the calculations are presented in a series of cumulative distribution functions, which show the probability that a chosen criterion of the design is exceeded within a given time. Depending on the evaluation criterion chosen, times to unacceptable designs varied by as little as 10 seconds to as much as 470 seconds. To determine important input variables, Notarianni used a multivariate correlation of the input and output variables to determine statistical significance at a 95% confidence level. Input variables deemed important in the analysis included fire-related inputs (growth rate, heat of combustion, position of the base of the fire, and generation rates of products of combustion) and door opening sizes. Other inputs were determined to be less important.
Technical Details of CFAST Validation Study
5-3
Many of the outputs of the CFAST model are quite insensitive to uncertainty in the input parameters for a broad range of scenarios. Not surprisingly, heat release rate was consistently seen as the most important variable in a range of simulations. Heat release rate and related variables such as heat of combustion or generation rates of products of combustion provide the driving force for fire-driven flows. For CFAST, all of these are user inputs. Thus, careful selection of these fire-related variables are necessary for accurate predictions. Other variables related to compartment geometry such as compartment height or vent sizes, while deemed important for the model outputs, are typically more easily defined for specific design scenarios than fire related inputs. For some scenarios, such as typical building performance design, these vents may need to include the effects of leakage to ensure accurate predictions. For other scenarios, such as shipboard use or nuclear power facilities, leakage (or lack thereof) may be more easily defined and may not be an issue in the calculations.
5.2 Sensitivity to Heat Release Rate
Of all the physical input parameters, the simulation results are most sensitive to the heat release rate. In this section, one of the validation experiments (ICFMP Benchmark Exercise #3, Test 3) is used to demonstrate the result of increasing and decreasing the heat release rate by 15%. Figure 5-1 shows plots of various output quantities demonstrating their sensitivity to the change in heat release rate. Gas and surfaces temperatures, oxygen concentration, and compartment pressure show roughly 10% diversions from baseline, whereas the heat fluxes show roughly 20% diversions. The height of the hot gas layer is relatively insensitive to changes in the heat release rate. These results are expected and consistent with the analysis described in Volume 2 to assess the sensitivity of the quantities of interest to the uncertainty in the measured heat release rate.
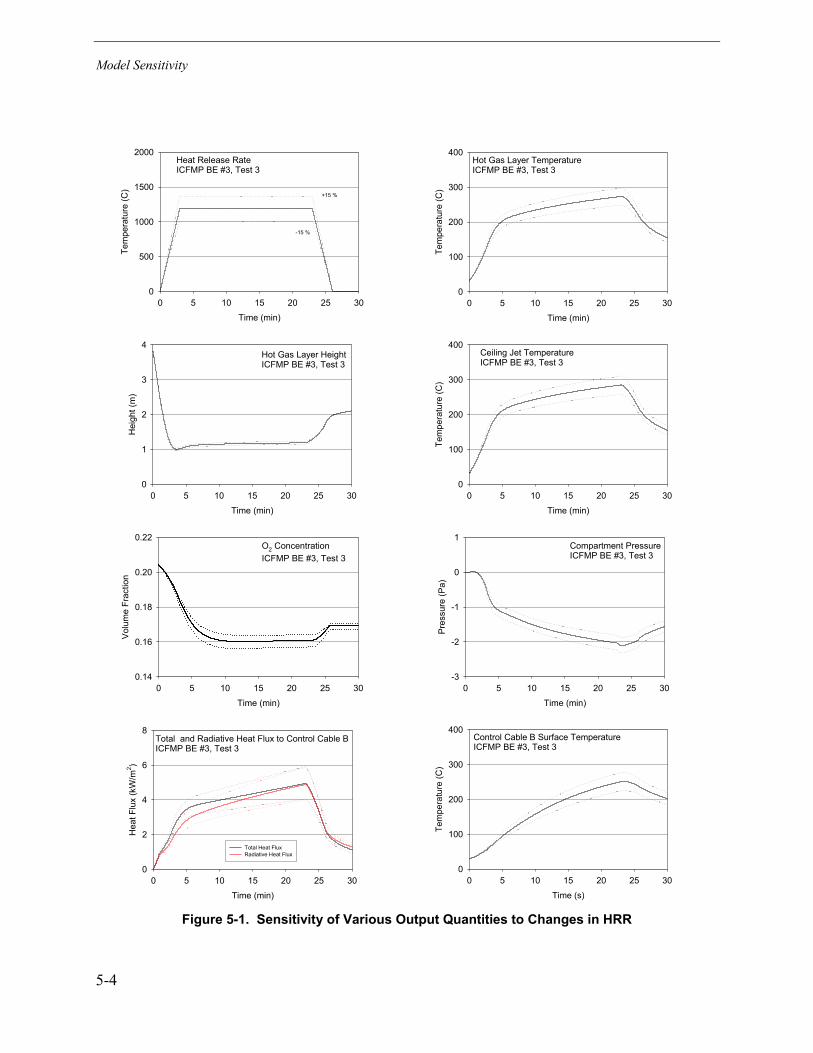
Model Sensitivity
5-4
Heat Release RateICFMP BE #3, Test 3
Time (min)
0 5 10 15 20 25 30
Tem
pera
ture
(C)
0
500
1000
1500
2000
+15 %
-15 %
Hot Gas Layer TemperatureICFMP BE #3, Test 3
Time (min)
0 5 10 15 20 25 30
Tem
pera
ture
(C)
0
100
200
300
400
Hot Gas Layer HeightICFMP BE #3, Test 3
Time (min)
0 5 10 15 20 25 30
Hei
ght (
m)
0
1
2
3
4Ceiling Jet TemperatureICFMP BE #3, Test 3
Time (min)
0 5 10 15 20 25 30
Tem
pera
ture
(C)
0
100
200
300
400
O2 ConcentrationICFMP BE #3, Test 3
Time (min)
0 5 10 15 20 25 30
Vol
ume
Frac
tion
0.14
0.16
0.18
0.20
0.22Compartment PressureICFMP BE #3, Test 3
Time (min)
0 5 10 15 20 25 30
Pre
ssur
e (P
a)
-3
-2
-1
0
1
Total and Radiative Heat Flux to Control Cable BICFMP BE #3, Test 3
Time (min)
0 5 10 15 20 25 30
Hea
t Flu
x (k
W/m
2 )
0
2
4
6
8
Total Heat FluxRadiative Heat Flux
Control Cable B Surface TemperatureICFMP BE #3, Test 3
Time (s)
0 5 10 15 20 25 30
Tem
pera
ture
(C)
0
100
200
300
400
Figure 5-1. Sensitivity of Various Output Quantities to Changes in HRR
6-1
6 MODEL VALIDATION
CFAST has been subjected to extensive validation studies by NIST and others. Although some differences between the model and the experiments were evident in these studies, they are typically explained by limitations of the model and uncertainty of the experiments. Most prominent in the studies reviewed was the over-prediction of gas temperature often attributed to uncertainty in soot production and radiative fraction. Still, studies typically show predictions accurate within 10% to 25% of measurements for a range of scenarios. Like all predictive models, the best predictions come with a clear understanding of the limitations of the model and the inputs provided to the calculations. The CFAST Technical Reference Guide [Ref. 1] includes a detailed discussion of these previous validation efforts.
This chapter summarizes the results of the current validation study conducted for the CFAST model. This study focused on the predicted results of the CFAST fire model and did not include an assessment of the user interface for the model. However, all input files used for the simulations were prepared using the GUI and reviewed for correctness prior to the simulations. Six experimental test series have been used in the present model evaluation. A brief description of each is given here. Further details can be found in Volume 2 and in the individual test reports.
ICFMP BE #2: Benchmark Exercise #2 consists of eight experiments, representing three sets of conditions, to study the movement of smoke in a large hall with a sloped ceiling. The results of the experiments were contributed to the International Collaborative Fire Model Project (ICFMP) for use in evaluating model predictions of fires in larger volumes representative of turbine halls in NPPs. The tests were conducted inside the VTT Fire Test Hall, which has dimensions of 19 m high x 27 m long x 14 m wide (62 ft x 88.5 ft x 46 ft). Each case involved a single heptane pool fire, ranging from 2 MW to 4 MW. All three cases, representing averaged results from the eight tests, have been used in the current V&V effort.
ICFMP BE #3: Benchmark Exercise #3, conducted as part of the ICFMP and sponsored by the NRC, consists of 15 large-scale tests performed at NIST in June 2003. The fire sizes range from 350 kW to 2.2 MW in a compartment with dimensions 21.7 m high x 7.1 m long x 3.8 m wide, designed to represent a variety of spaces in a NPP containing power and control cables. The walls and ceiling were covered with two layers of marinate boards, each layer 0.0125 m (0.5 in) thick. The floor was covered with one layer of 0.0125-m (0.5-in) thick gypsum board on top of a 0.0183-m (23/32-in) layer of plywood. The room has one door with dimensions of 2 m x 2 m (6.6 ft x 6.6 ft), and a mechanical air injection and extraction system. Ventilation conditions and fire size and location are varied, and the numerous experimental measurements include gas and surface temperatures, heat fluxes, and gas velocities.
Model Validation
6-2
ICFMP BE #4: Benchmark Exercise #4 consists of kerosene pool fire experiments conducted at the Institut für Baustoffe, Massivbau und Brandschutz (iBMB) of the Braunschweig University of Technology in Germany. The results of two experiments were contributed to the ICFMP. These fire experiments involve relatively large fires in a relatively small [3.6 m x 3.6 m x 5.7 m (12 ft x 12 ft x 19 ft)] concrete enclosure. Only one of the two experiments was selected for the present V&V study (Test 1).
ICFMP BE #5: Benchmark Exercise #5 consists of fire experiments conducted with realistically routed cable trays in the same test compartment as BE #4. The compartment was configured slightly differently, and the height was 5.6 m (18.4 ft) in BE #5. Only Test 4 was selected for the present evaluation, and only the first 20 minutes, during which an ethanol pool fire pre-heated the compartment.
FM/SNL Series: The Factory Mutual & Sandia National Laboratories (FM/SNL) Test Series is a series of 25 fire tests conducted for the NRC by Factory Mutual Research Corporation (FMRC), under the direction of Sandia National Laboratories (SNL). The primary purpose of these tests was to provide data with which to validate computer models for various types of NPP compartments. The experiments were conducted in an enclosure measuring 18 m long x 12 m wide x 6 m high (60 ft x 40 ft x 20 ft), constructed at the FMRC fire test facility in Rhode Island. All of the tests involved forced ventilation to simulate typical NPP installation practices. The fires consist of a simple gas burner, a heptane pool, a methanol pool, or a polymethyl-methacrylate (PMMA) solid fire. Four of these tests were conducted with a full-scale control room mockup in place. Parameters varied during testing were fire intensity, enclosure ventilation rate, and fire location. Only Tests 4, 5 and 21 were used in the present evaluation. Test 21 involved the full-scale mockup. All were gas burner fires.
NBS Multi-Room Series: The National Bureau of Standards (NBS, now the National Institute of Standards and Technology, NIST) Multi-Compartment Test Series consists of 45 fire tests representing 9 different sets of conditions, with multiple replicates of each set, which were conducted in a three-room suite. The suite consists of two relatively small rooms, connected via a relatively long corridor. The fire source, a gas burner, is located against the rear wall of one of the small compartments. Fire tests of 100, 300, and 500 kW were conducted, but only three 100-kW fire experiments (Test 100A, 100O, and 100Z) were used for the current V&V study.
CFAST simulated all of the chosen experiments. Technical details of the calculations, including output of the model and comparison with experimental data, are provided in Appendix A. The results are organized by quantity as follows:
• hot gas layer (HGL) temperature and height • ceiling jet temperature • plume temperature • flame height • oxygen and carbon dioxide concentration • smoke concentration • compartment pressure • radiation heat flux, total heat flux, and target temperature
Model Validation
6-3
• wall heat flux and surface temperature
Comparisons of the model predictions with experimental measurements are presented as relative differences. The relative differences are calculated as follows:
( ) ( )( )op
opop
EEEEMM
EEM
−
−−−=
∆∆−∆
=ε
where ∆M is the difference between the peak value (Mp) of the evaluated parameter and its original value (Mo), and ∆E is the difference between the experimental observation (Ep) and its original value (Eo). Appendix A lists the calculated relative differences for all the fire modeling parameters listed above.
The measure of model “accuracy” used throughout this study is related to experimental uncertainty. Volume 2 discusses this issue in detail. In brief, the accuracy of a measurement (e.g., the gas temperature) is related to the measurement device (e.g., a thermocouple). In addition, the accuracy of the model prediction of the gas temperature is related to the simplified physical description of the fire and to the accuracy of the input parameters (e.g., the specified heat release rate), which in turn are based on experimental measurements. Ideally, the purpose of a validation study is to determine the accuracy of the model in the absence of any errors related to the measurement of both its inputs and outputs. Because it is impossible to eliminate experimental uncertainty, at the very least, a combination of the uncertainty in the measurement of model inputs and output can be used as a yardstick. If the numerical prediction falls within the range of uncertainty attributable to both the measurement of the input parameters and the output quantities, it is not possible to quantify its accuracy further. At this stage, it is said that the prediction is within experimental uncertainty.
Each section in this chapter contains a scatter plot that summarizes the relative difference results for all of the predictions and measurements of the quantity under consideration. Details of the calculations, the input assumptions, and the time histories of the predicted and measured output are included in Appendix A. Only a brief discussion of the results is included in this chapter. Included in the scatter plots are an estimate of the combined uncertainty for the experimental measurements and uncertainty in the model inputs. It is important to understand that these are simply estimates of random uncertainty and do not include systematic uncertainty in either the experimental measurements or model predictions. Thus, these uncertainty bounds are only guidelines to judge the predictive capability of the model along with expert engineering judgment of the project team.
At the end of each section, a color rating is assigned to each of the output categories, indicating, in a very broad sense, how well the model treats that particular quantity. A detailed discussion of this rating system is included in Volume 1. For CFAST, only the Green and Yellow ratings have been assigned to 11 of the 13 quantities of interest because these quantities fall within the capability of the CFAST model. The color Green indicates that the research team concluded the physics of the model accurately represent the experimental conditions, and the calculated relative differences comparing the model and the experimental are consistent with the combined experimental and input uncertainty. The color Yellow suggests that one exercise caution when
Model Validation
6-4
using the model to evaluate this quantity — consider carefully the assumptions made by the model, how the model has been applied, and the accuracy of its results. There is specific discussion of model limitations for the quantities assigned a Yellow rating. Two of the quantities, plume temperature and ceiling jet temperature, are used internally by the model for its calculations, but are not reported as output. These were not assigned a color rating. Parameters that are not given a color rating indicate that the model does not include output to be able to evaluate that parameter in its as-tested version.
6.1 Hot Gas Layer (HGL) Temperature and Height
The single most important prediction a fire model can make is the temperature of the hot gas layer (HGL). The impact of the fire is not so much a function of the heat release rate, but rather the temperature of the compartment. A good prediction of the HGL height is largely a consequence of a good prediction of its temperature because smoke and heat are largely transported together and most numerical models describe the transport of both with the same type of algorithm. Typically, CFAST slightly over-predicts the HGL temperature, most often within experimental uncertainty. Hot gas layer height is typically within experimental uncertainty for well-ventilated tests and near floor level for under-ventilated tests where compartments are closed to the outside. Figure 6-1 shows a comparison of predicted and measured values for HGL temperature and depth along with a summary of the relative difference for all of the test series. For HGL height, only values from open-door tests are included in Figure 6-1 and Appendix A. For closed-door tests, visual observations typically show that the HGL fills the entire compartment volume from floor to ceiling, inconsistent with the calculated results for the experimental data. Thus, the calculated experimental values of HGL height for closed-door tests are not seen as appropriate for comparison to model results.
Following is a summary of the accuracy assessment for the HGL predictions of the six test series:
ICFMP BE #2: CFAST predicts the HGL temperature and height near experimental uncertainty for all three tests.
ICFMP BE #3: CFAST predicts the HGL temperature to within experimental uncertainty for all of the closed-door tests except Test 17. Test 17 was a rapidly growing toluene pool fire, which was stopped for safety reasons after 273 seconds. CFAST predicts an initial temperature rise starting somewhat earlier and peaking somewhat higher than the experimental values, but curve shapes match in all tests. Relative difference for the open-door tests is somewhat higher, ranging from 13 % for Test 5 to 26 % for Test 18 (Figure 6-1 and Table A-1). CFAST predicts HGL height to within experimental uncertainty for the open-door tests. For the closed-door tests, calculated CFAST values are consistent with visual observations of smoke filling in the compartment.
ICFMP BE #4: CFAST predicts the HGL temperature and height to within experimental uncertainty for the single test (Test 1), but there is some discrepancy in the shapes of the curves. It is not clear whether this is related to the measurement or the model.
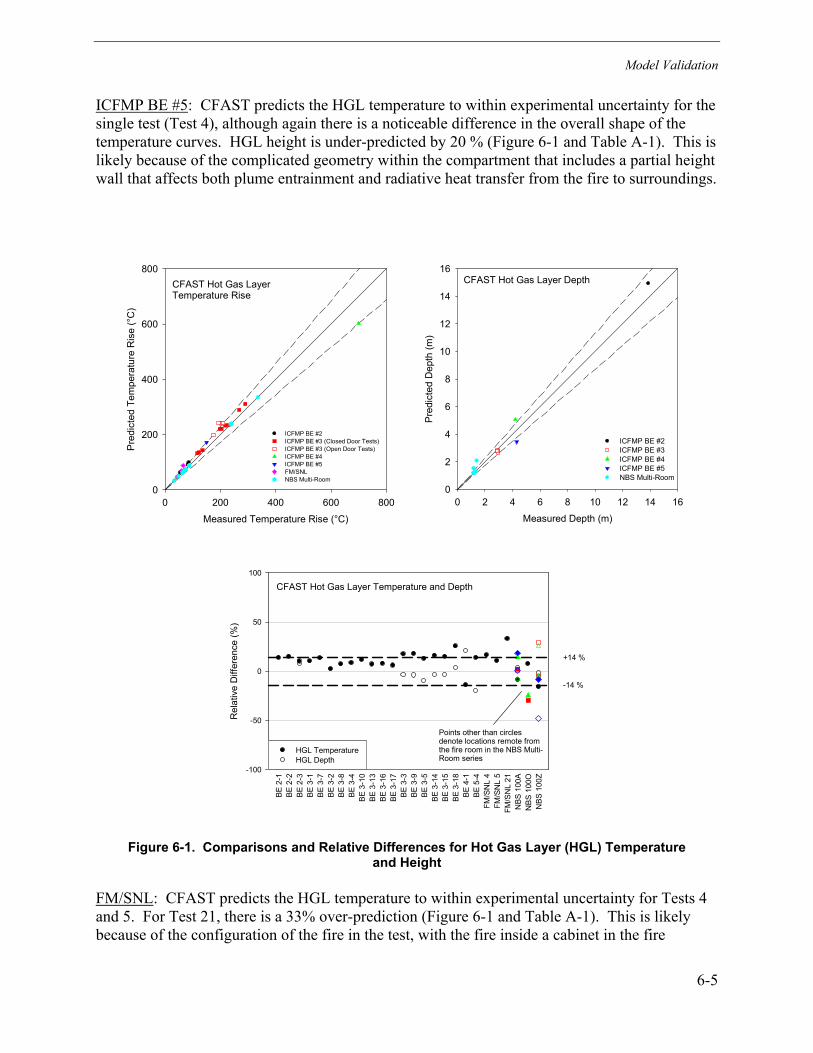
Model Validation
6-5
ICFMP BE #5: CFAST predicts the HGL temperature to within experimental uncertainty for the single test (Test 4), although again there is a noticeable difference in the overall shape of the temperature curves. HGL height is under-predicted by 20 % (Figure 6-1 and Table A-1). This is likely because of the complicated geometry within the compartment that includes a partial height wall that affects both plume entrainment and radiative heat transfer from the fire to surroundings.
CFAST Hot Gas LayerTemperature Rise
Measured Temperature Rise (°C)
0 200 400 600 800
Pre
dict
ed T
empe
ratu
re R
ise
(°C
)
0
200
400
600
800
ICFMP BE #2ICFMP BE #3 (Closed Door Tests)ICFMP BE #3 (Open Door Tests)ICFMP BE #4ICFMP BE #5FM/SNLNBS Multi-Room
CFAST Hot Gas Layer Depth
Measured Depth (m)
0 2 4 6 8 10 12 14 16
Pred
icte
d D
epth
(m)
0
2
4
6
8
10
12
14
16
ICFMP BE #2ICFMP BE #3ICFMP BE #4ICFMP BE #5NBS Multi-Room
CFAST Hot Gas Layer Temperature and Depth
BE 2
-1BE
2-2
BE 2
-3BE
3-1
BE 3
-7BE
3-2
BE 3
-8BE
3-4
BE 3
-10
BE 3
-13
BE 3
-16
BE 3
-17
BE 3
-3BE
3-9
BE 3
-5BE
3-1
4BE
3-1
5BE
3-1
8BE
4-1
BE 5
-4FM
/SN
L 4
FM/S
NL
5FM
/SN
L 21
NBS
100
AN
BS 1
00O
NBS
100
Z
Rel
ativ
e D
iffer
ence
(%)
-100
-50
0
50
100
+14 %
-14 %
HGL Temperature HGL Depth
Points other than circlesdenote locations remote fromthe fire room in the NBS Multi-Room series
Figure 6-1. Comparisons and Relative Differences for Hot Gas Layer (HGL) Temperature and Height
FM/SNL: CFAST predicts the HGL temperature to within experimental uncertainty for Tests 4 and 5. For Test 21, there is a 33% over-prediction (Figure 6-1 and Table A-1). This is likely because of the configuration of the fire in the test, with the fire inside a cabinet in the fire
Model Validation
6-6
compartment. This complex geometry leads to an interaction between the fire and the confining cabinet that a zone model cannot simulate.
NBS Multi-Room: CFAST predicts the HGL temperature and height to within experimental uncertainty for many of the measurement locations in the three tests considered. The discrepancies in various locations appear to be attributable to experimental, rather than model, error. In particular, the calculation of HGL temperature and height are quite sensitive to the measured temperature profile, which in these tests was determined with bare-bead thermocouples that are subject to quite high uncertainties. Wide spacing of the thermocouples also leads to higher uncertainty in HGL height.
Calculations of HGL temperature and height in the room remote from the fire have higher relative differences than those closer to the fire. This is likely a combination of the simplified single representative layer temperature inherent in zone models (temperature in the long corridor of this test series varied from one end of the compartment to the other) and the calculation of flow though doorways based on a correlation based on the pressure difference between the connected compartments.
Summary: HGL Temperature and Height (Green for fire compartment and Yellow for compartments remote from the fire)
Based on the model physics and comparisons of model predictions with experimental measurements, CFAST calculations of HGL temperature and height are characterized in the Green category within the fire compartment and Yellow in compartments remote from the fire for the following reasons:
• The two-zone assumption inherent in CFAST, modeled as a series of ordinary differential equations that describe mass and energy conservation of flows in a multiple-compartment structure are appropriate for the applications studied.
• The CFAST predictions of the HGL temperature and height are, with a few exceptions, within or close to experimental uncertainty. The CFAST predictions are typical of those found in other studies where the HGL temperature is typically somewhat over-predicted and HGL height somewhat lower (HGL depth somewhat thicker) than experimental measurements. These differences are likely attributable to simplifications in the model dealing with mixing between the layers, entrainment in the fire plume, and flow through vents. Still, predictions are mostly within 10% to 20% of experimental measurements.
• Calculation of HGL temperature and height has higher uncertainty in rooms remote from the fire compared to those in the fire compartment. However, this is based on the results of a single test series.
6.2 Ceiling Jet Temperature
CFAST includes an algorithm to account for the presence of the higher gas temperatures near the ceiling surfaces in compartments involved in a fire. In the model, this increased temperature
Model Validation
6-7
has the effect of increasing the convective heat transfer to ceiling surfaces. The temperature and velocity of the ceiling jet are available from the model by placing a heat detector at the specified location. The ceiling jet algorithm is based on the model by Cooper [Ref. 8], with details described in the CFAST Technical Reference Guide [Ref. 1]. The algorithm predicts gas temperature and velocity under a flat, unconstrained ceiling above a fire source. Only two of the six test series (ICFMP BE #3 and FM/SNL) involved relatively large flat ceilings. Figure 6-2 shows a comparison of predicted and measured values for ceiling jet temperature along with a summary of the relative difference for the tests.
ICFMP BE #3: CFAST predicts ceiling jet temperature well within experimental uncertainty for all of the tests in the series, with an average relative difference of 5%. For these tests, the fire source was sufficiently large (relative to the compartment size) such that a well-defined ceiling jet was evident in temperature measurements near ceiling level.
FM/SNL: With fire sizes comparable to the smaller fire sizes used in the tests in ICFMP BE #3 and compartment volumes significantly larger, measured temperature rise near the ceiling in the FM/SNL tests was below 100 °C (212 °F) in all three tests. Hot gas layer temperatures for these tests were below 70 °C (158 °F). CFAST consistently predicts higher ceiling jet temperatures in the FM/SNL tests compared to experimental measurements. With a larger compartment relative to the fire size, the ceiling jet for the FM/SNL tests is not nearly as well-developed as those in the ICFMP BE #3. The difference between the experimental ceiling jet temperature and HGL temperature for the FM/SNL tests is less than half that observed in the ICFMP BE #3 tests. While the over-prediction of ceiling jet temperature could be considered conservative for some applications, for scenarios involving sprinkler or heat detector activation, the increased temperature in the ceiling jet would lead to shorter estimates of activation times for the simulated sprinkler or heat detector.
Summary: Ceiling Jet Temperature (Yellow+)
Based on the model physics and comparisons of model predictions with experimental measurements, CFAST calculations of ceiling jet temperature are characterized in the Yellow+ category for the following reasons:
• For tests with a well-defined ceiling jet layer, CFAST predicts ceiling jet temperatures well-within experimental uncertainty.
• For tests with a less well-defined ceiling jet layer, CFAST over-predicts the ceiling jet temperature. For the tests studies, over-predictions were noted when the HGL temperature was below 70 °C (158 °F).
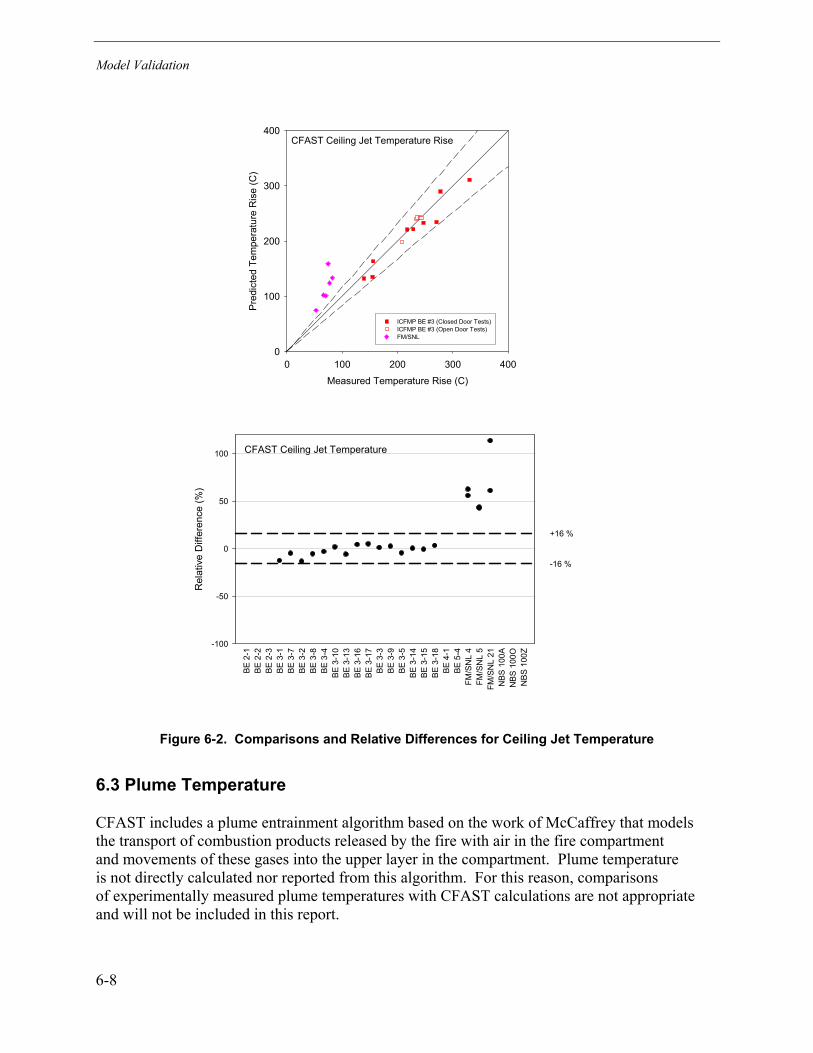
Model Validation
6-8
CFAST Ceiling Jet Temperature Rise
Measured Temperature Rise (C)
0 100 200 300 400
Pred
icte
d Te
mpe
ratu
re R
ise
(C)
0
100
200
300
400
ICFMP BE #3 (Closed Door Tests)ICFMP BE #3 (Open Door Tests)FM/SNL
CFAST Ceiling Jet Temperature
BE 2
-1BE
2-2
BE 2
-3BE
3-1
BE 3
-7BE
3-2
BE 3
-8BE
3-4
BE 3
-10
BE 3
-13
BE 3
-16
BE 3
-17
BE 3
-3BE
3-9
BE 3
-5BE
3-1
4BE
3-1
5BE
3-1
8BE
4-1
BE 5
-4FM
/SN
L 4
FM/S
NL
5FM
/SN
L 21
NBS
100
AN
BS 1
00O
NBS
100
Z
Rel
ativ
e D
iffer
ence
(%)
-100
-50
0
50
100
+16 %
-16 %
Figure 6-2. Comparisons and Relative Differences for Ceiling Jet Temperature
6.3 Plume Temperature
CFAST includes a plume entrainment algorithm based on the work of McCaffrey that models the transport of combustion products released by the fire with air in the fire compartment and movements of these gases into the upper layer in the compartment. Plume temperature is not directly calculated nor reported from this algorithm. For this reason, comparisons of experimentally measured plume temperatures with CFAST calculations are not appropriate and will not be included in this report.
Model Validation
6-9
6.4 Flame Height
Flame height is recorded by visual observations, photographs, or video footage. Videos from the ICFMP BE #3 test series and photographs from BE #2 are available. It is difficult to precisely measure the flame height, but the photos and videos allow one to make estimates accurate to within a pan diameter.
ICFMP BE #2: The height of the visible flame in the photographs has been estimated to be between 2.4 and 3 pan diameters [3.8 m to 4.8 m (12.5 ft to 15.7 ft)]. From the CFAST calculations, the estimated flame height is 4.3 m (14.1 ft).
ICFMP BE #3: CFAST estimates the peak flame height to be 2.8 m (9.2 ft), roughly consistent with the view through the doorway during the test. The test series was not designed to record accurate measurements of flame height.
Summary: Flame Height (Green)
Based on the model physics and comparisons of model predictions with experimental measurements, CFAST calculations of flame height are characterized in the Green category because the model predicts the flame height consistent with visual observations of flame height for the experiments. This is not surprising, given that CFAST simply uses a well-characterized experimental correlation to calculate flame height.
6.5 Oxygen and Carbon Dioxide Concentration
CFAST simulates a fire as a mass of fuel that burns at a prescribed pyrolysis rate and releases both energy and combustion products. CFAST calculates species production based on user-defined production yields, and both the pyrolysis rate and the resulting energy and species generation may be limited by the oxygen available for combustion. When sufficient oxygen is available for combustion, the heat release rate for a constrained fire is the same as for an unconstrained fire. Mass and species concentrations are tracked by the model as gases flow through openings in a structure to other compartments in the structure or to the outdoors.
Gas sampling data are available from ICFMP BE #3 and BE #5 (one test only). Figure 6-3 shows a comparison of predicted and measured values for oxygen and carbon dioxide concentrations, along with a summary of the relative difference for the tests.
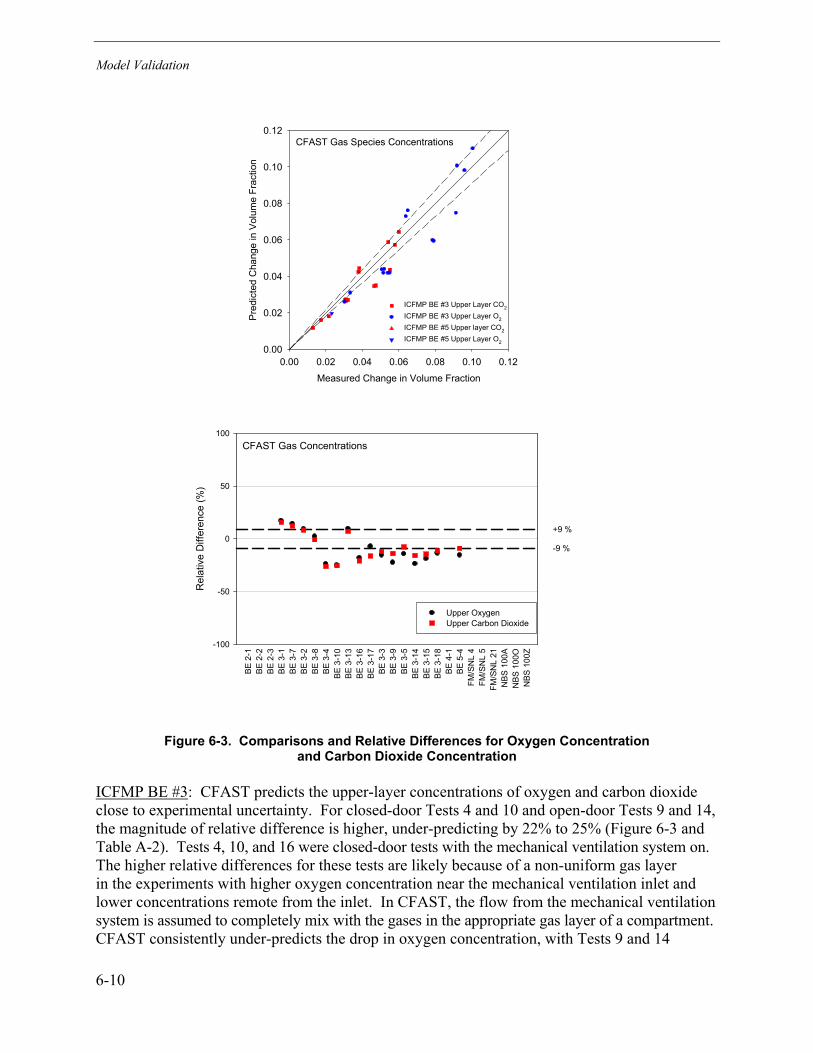
Model Validation
6-10
CFAST Gas Species Concentrations
Measured Change in Volume Fraction
0.00 0.02 0.04 0.06 0.08 0.10 0.12
Pre
dict
ed C
hang
e in
Vol
ume
Frac
tion
0.00
0.02
0.04
0.06
0.08
0.10
0.12
ICFMP BE #3 Upper Layer CO2
ICFMP BE #3 Upper Layer O2
ICFMP BE #5 Upper layer CO2
ICFMP BE #5 Upper Layer O2
CFAST Gas Concentrations
BE 2
-1BE
2-2
BE 2
-3BE
3-1
BE 3
-7BE
3-2
BE 3
-8BE
3-4
BE 3
-10
BE 3
-13
BE 3
-16
BE 3
-17
BE 3
-3BE
3-9
BE 3
-5BE
3-1
4BE
3-1
5BE
3-1
8BE
4-1
BE 5
-4FM
/SN
L 4
FM/S
NL
5FM
/SN
L 21
NBS
100
AN
BS 1
00O
NBS
100
Z
Rel
ativ
e D
iffer
ence
(%)
-100
-50
0
50
100
+9 %
-9 %
Upper Oxygen Upper Carbon Dioxide
Figure 6-3. Comparisons and Relative Differences for Oxygen Concentration and Carbon Dioxide Concentration
ICFMP BE #3: CFAST predicts the upper-layer concentrations of oxygen and carbon dioxide close to experimental uncertainty. For closed-door Tests 4 and 10 and open-door Tests 9 and 14, the magnitude of relative difference is higher, under-predicting by 22% to 25% (Figure 6-3 and Table A-2). Tests 4, 10, and 16 were closed-door tests with the mechanical ventilation system on. The higher relative differences for these tests are likely because of a non-uniform gas layer in the experiments with higher oxygen concentration near the mechanical ventilation inlet and lower concentrations remote from the inlet. In CFAST, the flow from the mechanical ventilation system is assumed to completely mix with the gases in the appropriate gas layer of a compartment. CFAST consistently under-predicts the drop in oxygen concentration, with Tests 9 and 14
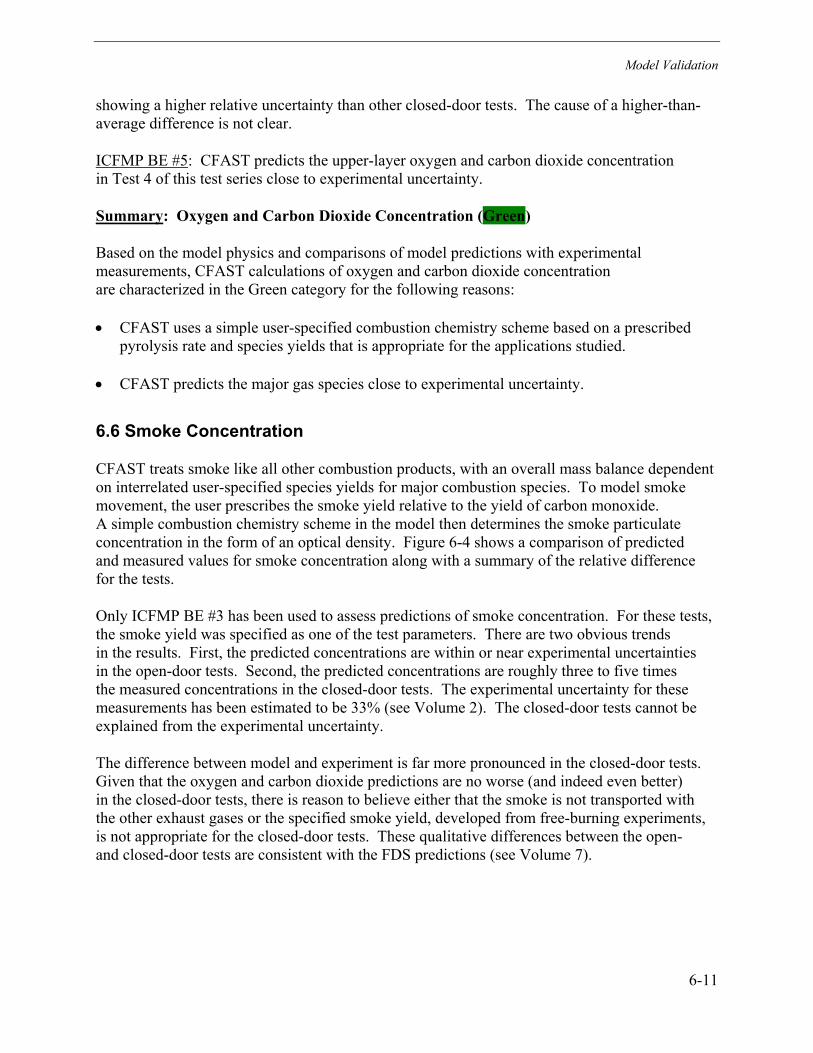
Model Validation
6-11
showing a higher relative uncertainty than other closed-door tests. The cause of a higher-than-average difference is not clear.
ICFMP BE #5: CFAST predicts the upper-layer oxygen and carbon dioxide concentration in Test 4 of this test series close to experimental uncertainty.
Summary: Oxygen and Carbon Dioxide Concentration (Green)
Based on the model physics and comparisons of model predictions with experimental measurements, CFAST calculations of oxygen and carbon dioxide concentration are characterized in the Green category for the following reasons:
• CFAST uses a simple user-specified combustion chemistry scheme based on a prescribed pyrolysis rate and species yields that is appropriate for the applications studied.
• CFAST predicts the major gas species close to experimental uncertainty.
6.6 Smoke Concentration
CFAST treats smoke like all other combustion products, with an overall mass balance dependent on interrelated user-specified species yields for major combustion species. To model smoke movement, the user prescribes the smoke yield relative to the yield of carbon monoxide. A simple combustion chemistry scheme in the model then determines the smoke particulate concentration in the form of an optical density. Figure 6-4 shows a comparison of predicted and measured values for smoke concentration along with a summary of the relative difference for the tests.
Only ICFMP BE #3 has been used to assess predictions of smoke concentration. For these tests, the smoke yield was specified as one of the test parameters. There are two obvious trends in the results. First, the predicted concentrations are within or near experimental uncertainties in the open-door tests. Second, the predicted concentrations are roughly three to five times the measured concentrations in the closed-door tests. The experimental uncertainty for these measurements has been estimated to be 33% (see Volume 2). The closed-door tests cannot be explained from the experimental uncertainty.
The difference between model and experiment is far more pronounced in the closed-door tests. Given that the oxygen and carbon dioxide predictions are no worse (and indeed even better) in the closed-door tests, there is reason to believe either that the smoke is not transported with the other exhaust gases or the specified smoke yield, developed from free-burning experiments, is not appropriate for the closed-door tests. These qualitative differences between the open- and closed-door tests are consistent with the FDS predictions (see Volume 7).
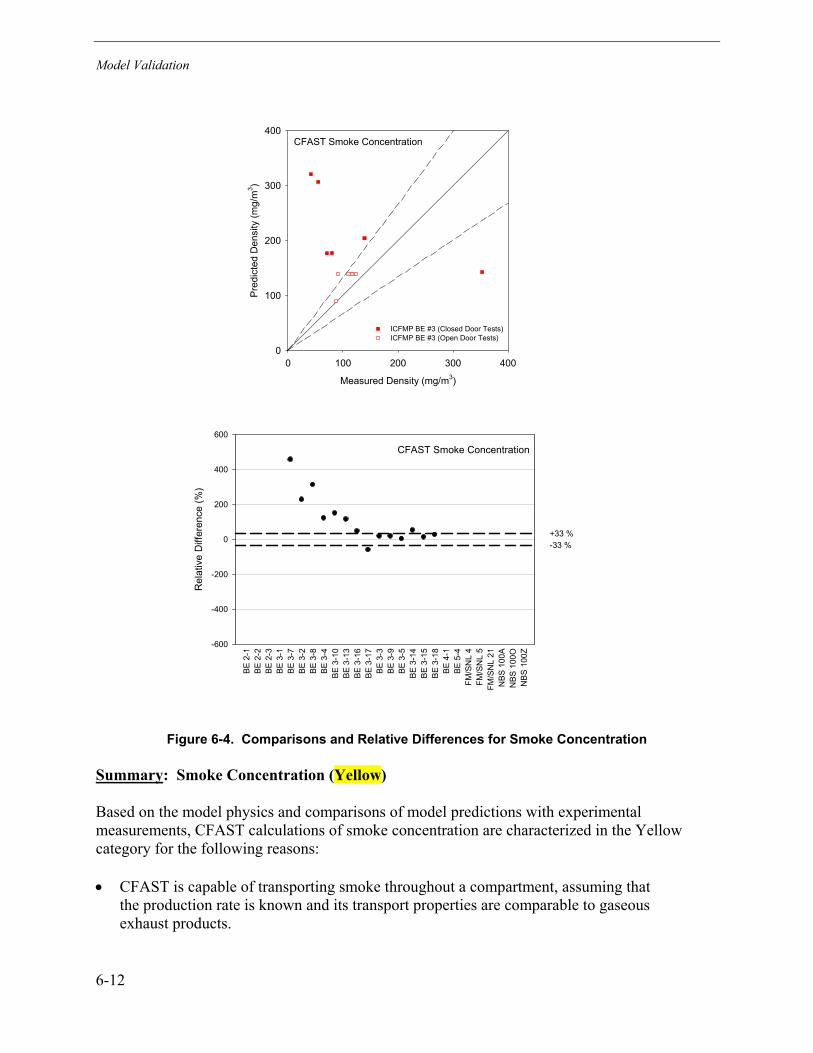
Model Validation
6-12
CFAST Smoke Concentration
Measured Density (mg/m3)
0 100 200 300 400
Pre
dict
ed D
ensi
ty (m
g/m
3 )
0
100
200
300
400
ICFMP BE #3 (Closed Door Tests)ICFMP BE #3 (Open Door Tests)
CFAST Smoke Concentration
BE 2
-1BE
2-2
BE 2
-3BE
3-1
BE 3
-7BE
3-2
BE 3
-8BE
3-4
BE 3
-10
BE 3
-13
BE 3
-16
BE 3
-17
BE 3
-3BE
3-9
BE 3
-5BE
3-1
4BE
3-1
5BE
3-1
8BE
4-1
BE 5
-4FM
/SN
L 4
FM/S
NL
5FM
/SN
L 21
NBS
100
AN
BS 1
00O
NBS
100
Z
Rel
ativ
e D
iffer
ence
(%)
-600
-400
-200
0
200
400
600
+33 %-33 %
Figure 6-4. Comparisons and Relative Differences for Smoke Concentration
Summary: Smoke Concentration (Yellow)
Based on the model physics and comparisons of model predictions with experimental measurements, CFAST calculations of smoke concentration are characterized in the Yellow category for the following reasons:
• CFAST is capable of transporting smoke throughout a compartment, assuming that the production rate is known and its transport properties are comparable to gaseous exhaust products.
Model Validation
6-13
• CFAST typically over-predicts the smoke concentration in all of the BE #3 tests, with the exception of Test 17. Predicted concentrations for open-door tests are within experimental uncertainties, but those for closed-door tests are far higher. No firm conclusions can be drawn from this single data set. The measurements in the closed-door experiments are inconsistent with basic conservation of mass arguments, or there is a fundamental change in the combustion process as the fire becomes oxygen-starved.
6.7 Compartment Pressure
Comparisons between measurement and prediction of compartment pressure for BE #3 are shown in Section A.7 of Appendix A to this volume. Figure 6-5 shows a comparison of predicted and measured values for compartment pressure, along with a summary of the relative difference for the tests.
For those tests in which the door to the compartment is open, the over-pressures are only a few Pascals; however, when the door is closed, the over-pressures are several hundred Pascals. For both the open- and closed-door tests, CFAST predicts the pressure to within experimental uncertainty. The one notable exception is Test 16 (Figure 6-4 and Table A-3), which involved a large (2.3 MW) fire with the door closed and the ventilation on. By contrast, Test 10 involved a 1.2 MW fire with comparable geometry and ventilation. There is considerable uncertainty in the magnitude of both the supply and return mass flow rates for Test 16. Compared to Test 16, Test 10 involves a greater measured supply velocity and a lesser measured exhaust velocity. This is probably the result of the higher pressure caused by the larger fire in Test 16. CFAST does not adjust the ventilation rate based on the compartment pressure until a specified cutoff pressure is reached. This is also the most likely explanation for the over-prediction of compartment pressure in Test 16.
In general, prediction of pressure in CFAST in closed compartments is critically dependent on correct specification of the leakage from the compartment. Compartments are rarely entirely sealed, and small changes in the leakage area can produce significant changes in the predicted over-pressure.
Summary: Compartment Pressure (Green)
Based on the model physics and comparisons of model predictions with experimental measurements, CFAST calculations of pressure are characterized in the Green category for the following reasons:
• With one exception, CFAST predicts compartment pressures within experimental uncertainty.
• Prediction of compartment pressure for closed-door tests is critically dependent on correct specification of the leakage from the compartment.
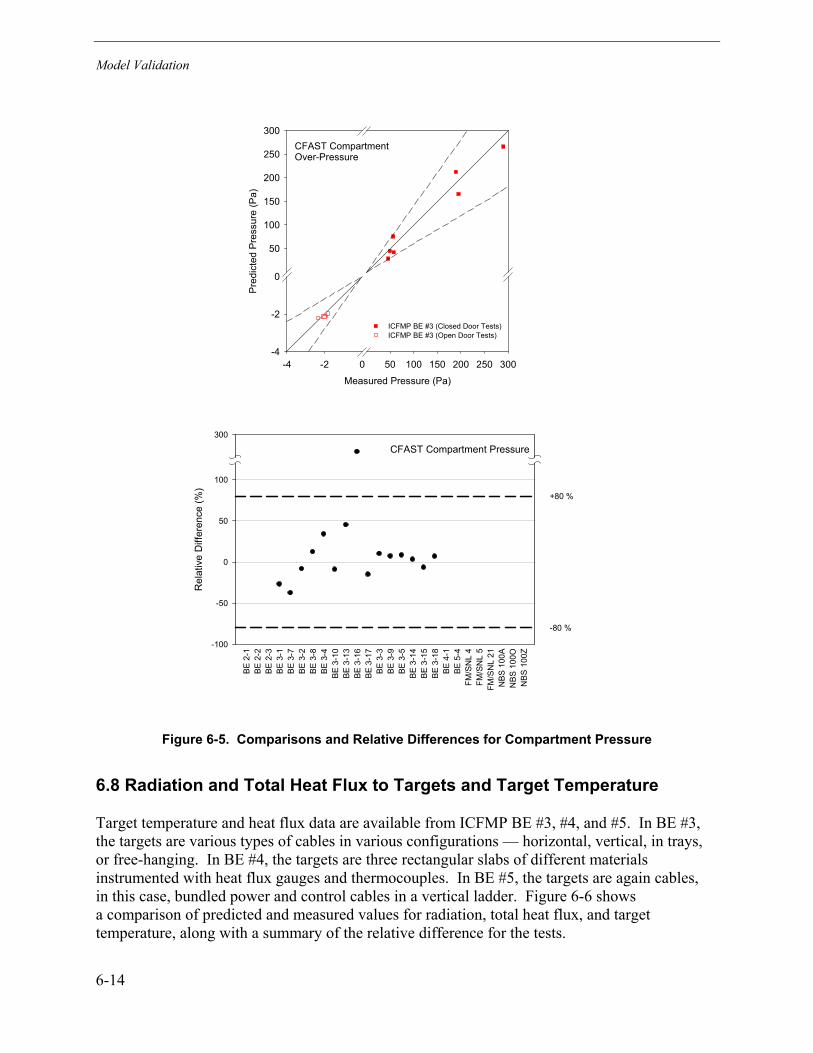
Model Validation
6-14
CFAST CompartmentOver-Pressure
Measured Pressure (Pa)
-4 -2 0 50 100 150 200 250 300
Pre
dict
ed P
ress
ure
(Pa)
-4
-2
0
50
100
150
200
250
300
ICFMP BE #3 (Closed Door Tests)ICFMP BE #3 (Open Door Tests)
CFAST Compartment Pressure
BE 2
-1BE
2-2
BE 2
-3BE
3-1
BE 3
-7BE
3-2
BE 3
-8BE
3-4
BE 3
-10
BE 3
-13
BE 3
-16
BE 3
-17
BE 3
-3BE
3-9
BE 3
-5BE
3-1
4BE
3-1
5BE
3-1
8BE
4-1
BE 5
-4FM
/SN
L 4
FM/S
NL
5FM
/SN
L 21
NBS
100
AN
BS 1
00O
NBS
100
Z
Rel
ativ
e D
iffer
ence
(%)
-100
-50
0
50
100
300
+80 %
-80 %
Figure 6-5. Comparisons and Relative Differences for Compartment Pressure
6.8 Radiation and Total Heat Flux to Targets and Target Temperature
Target temperature and heat flux data are available from ICFMP BE #3, #4, and #5. In BE #3, the targets are various types of cables in various configurations — horizontal, vertical, in trays, or free-hanging. In BE #4, the targets are three rectangular slabs of different materials instrumented with heat flux gauges and thermocouples. In BE #5, the targets are again cables, in this case, bundled power and control cables in a vertical ladder. Figure 6-6 shows a comparison of predicted and measured values for radiation, total heat flux, and target temperature, along with a summary of the relative difference for the tests.
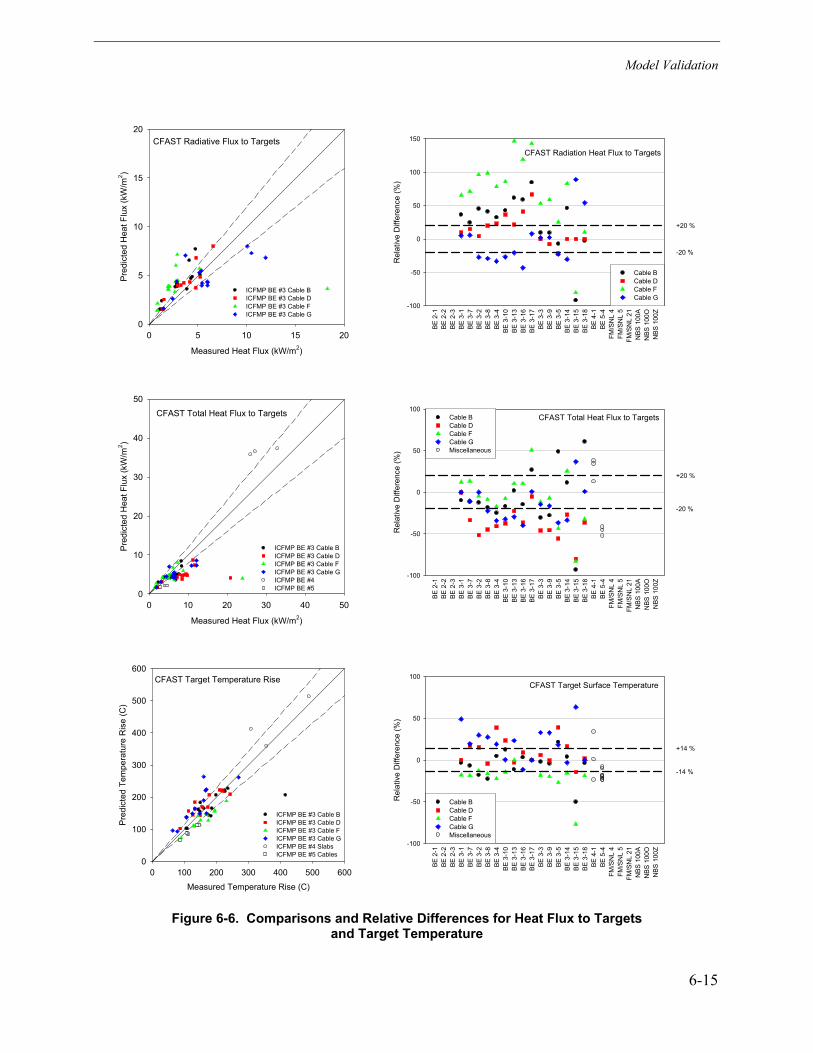
Model Validation
6-15
CFAST Radiative Flux to Targets
Measured Heat Flux (kW/m2)
0 5 10 15 20
Pre
dict
ed H
eat F
lux
(kW
/m2 )
0
5
10
15
20
ICFMP BE #3 Cable BICFMP BE #3 Cable DICFMP BE #3 Cable FICFMP BE #3 Cable G
CFAST Radiation Heat Flux to Targets
BE 2
-1BE
2-2
BE 2
-3BE
3-1
BE 3
-7BE
3-2
BE 3
-8BE
3-4
BE 3
-10
BE 3
-13
BE 3
-16
BE 3
-17
BE 3
-3BE
3-9
BE 3
-5BE
3-1
4BE
3-1
5BE
3-1
8BE
4-1
BE 5
-4FM
/SN
L 4
FM/S
NL
5FM
/SN
L 21
NBS
100
AN
BS 1
00O
NBS
100
Z
Rel
ativ
e D
iffer
ence
(%)
-100
-50
0
50
100
150
+20 %
-20 %
Cable BCable D Cable FCable G
CFAST Total Heat Flux to Targets
Measured Heat Flux (kW/m2)
0 10 20 30 40 50
Pre
dict
ed H
eat F
lux
(kW
/m2 )
0
10
20
30
40
50
ICFMP BE #3 Cable BICFMP BE #3 Cable DICFMP BE #3 Cable FICFMP BE #3 Cable GICFMP BE #4ICFMP BE #5
CFAST Total Heat Flux to Targets
BE 2
-1BE
2-2
BE 2
-3BE
3-1
BE 3
-7BE
3-2
BE 3
-8BE
3-4
BE
3-10
BE
3-13
BE
3-16
BE
3-17
BE 3
-3BE
3-9
BE 3
-5B
E 3-
14B
E 3-
15B
E 3-
18BE
4-1
BE 5
-4FM
/SN
L 4
FM/S
NL
5FM
/SN
L 21
NB
S 1
00A
NB
S 1
00O
NB
S 1
00Z
Rel
ativ
e D
iffer
ence
(%)
-100
-50
0
50
100
+20 %
-20 %
Cable BCable DCable FCable GMiscellaneous
CFAST Target Temperature Rise
Measured Temperature Rise (C)
0 100 200 300 400 500 600
Pre
dict
ed T
empe
ratu
re R
ise
(C)
0
100
200
300
400
500
600
ICFMP BE #3 Cable BICFMP BE #3 Cable DICFMP BE #3 Cable FICFMP BE #3 Cable GICFMP BE #4 SlabsICFMP BE #5 Cables
CFAST Target Surface Temperature
BE 2
-1BE
2-2
BE 2
-3BE
3-1
BE 3
-7BE
3-2
BE 3
-8BE
3-4
BE 3
-10
BE 3
-13
BE 3
-16
BE 3
-17
BE 3
-3BE
3-9
BE 3
-5BE
3-1
4BE
3-1
5BE
3-1
8BE
4-1
BE 5
-4FM
/SN
L 4
FM/S
NL
5FM
/SN
L 21
NBS
100
AN
BS 1
00O
NBS
100
Z
Rel
ativ
e D
iffer
ence
(%)
-100
-50
0
50
100
+14 %
-14 %
Cable BCable DCable FCable GMiscellaneous
Figure 6-6. Comparisons and Relative Differences for Heat Flux to Targets and Target Temperature
Model Validation
6-16
ICFMP BE #3: Appendix A provides nearly 200 comparisons of heat flux and surface temperature on four different cables. It is difficult to make sweeping generalizations about the accuracy of CFAST. At best, one can scan the figures and associated tables to get a sense of the overall performance, which includes the following notable trends:
• The difference between predicted and measured cable surface temperatures is often within experimental uncertainty, with exceptions most often in the values for Cable G. Accurate prediction of the surface temperature of the cable should indicate that the flux to the target (a combination of radiation from the fire, surrounding surfaces, and the gas layers, along with convection from the surrounding gas) should be correspondingly accurate. For ICFMP BE #3, the cable surface predictions show lower relative difference overall compared to the total heat flux and (particularly) the radiative heat flux.
• Total heat flux to targets is typically predicted to within an average difference of 28% and often under-predicted. Predictions for Cables D and G are notable exceptions, with higher uncertainties.
• Radiative heat flux to targets is typically over-predicted compared to experimental measurements, with higher values for closed-door tests. For the closed-door tests, this may be a function of the over-prediction of the smoke concentration, which leads to the radiation contribution from the hot gas layer being a larger fraction of the total heat flux compared to the experimental values.
• For many of the experiments, the convective heat flux component, taken to be the difference between the total heat flux and the radiative heat flux is seen to be higher than the values typically measured in fire experiments.
ICFMP BE #4: CFAST over-predicts both the heat flux and surface temperature of three “slab” targets located about 1 m (3.3 ft) from the fire. The trend is consistent, but it cannot be explained solely in terms of experimental uncertainty. Again, the differences for surface temperature are smaller than those for total heat flux.
ICFMP BE #5: Predictions and measurements of gas temperature, total heat flux, and cable surface temperature are available at four vertical locations along a cable tray. CFAST under-predicts heat flux by about 50%, and under-predicts the cable surface temperature by about 20%. Although the surface temperature predictions are within experimental uncertainty, the heat flux predictions are not. Only one test from this series has been used in the evaluation; thus, it is difficult to draw any firm conclusions.
Summary: Radiation and Total Heat Flux to Targets and Target Temperature (Yellow)
Based on the model physics and comparisons of model predictions with experimental measurements, CFAST calculations of target heat flux and temperature are characterized in the Yellow category for the following reasons:
Model Validation
6-17
• Prediction of heat flux to targets and target surface temperature is largely dependent on local conditions surrounding the target. Like any two-zone model, CFAST predicts an average representative value of gas temperature in the upper and lower regions of a compartment. In addition, CFAST does not directly predict plume temperature or its effects on targets that may be within a fire plume. Thus, CFAST can be expected to under-predict values near a fire source, and over-predict values for targets remote from a fire.
• Cable target surface temperature predictions are often within experimental uncertainty, with exceptions, particularly for Cables F and G.
• Total heat flux to targets is typically predicted to within about 30%, and often under-predicted.
• Radiative heat flux to targets is typically over-predicted compared to experimental measurements, with higher relative difference values for closed-door tests.
6.9 Surface Heat Flux and Temperature
Heat flux and wall surface temperature measurements are available from ICFMP BE #3, and additional wall surface temperature measurements are available from BE #4 and BE #5. As with target heat flux and surface temperature (discussed above), there are numerous comparisons. Figure 6-7 shows a comparison of predicted and measured values for surface heat flux and temperature, along with a summary of the relative difference for the tests.
ICFMP BE #3: CFAST generally predicts the heat flux and surface temperature of the compartment walls to within 10% to 30%. Typically, CFAST over-predicts the far-field fluxes and temperatures and under-predicts the near-field measurements. This is understandable, given that any two-zone model predicts an average representative value of gas temperature in the upper and lower regions of a compartment. Thus, the values predicted by CFAST should be an average of values near the fire and those farther away.
However, differences for the ceiling and (particularly) floor fluxes and temperatures are higher, with a more pronounced difference between the near-field and far-field comparisons. In addition to the limitations of the two-zone assumption, calculations of the flux to ceiling and floor surfaces are further confounded by the simple point-source calculation of radiation exchange in CFAST for the fire source. In CFAST, the fire is assumed to be a point source of energy located at the base of the fire rather than a three-dimensional flame surface radiating to surroundings. With the fire typically at the floor surface, this makes the calculation of flux to the floor surface inherently less accurate than for other surfaces.
ICFMP BE #4: CFAST predicts one of the wall surface temperatures to within 8% of the measured values, while the other is under-predicted by nearly 70% (Figure 6-7 and Table A-6). The two points are presumably very close to the fire because the temperatures are 600 to 700 °C (1100 to 1300 °F) above ambient. For points very close to the fire, a significant under-prediction can be expected. The reason for the difference in the predictions is not clear.
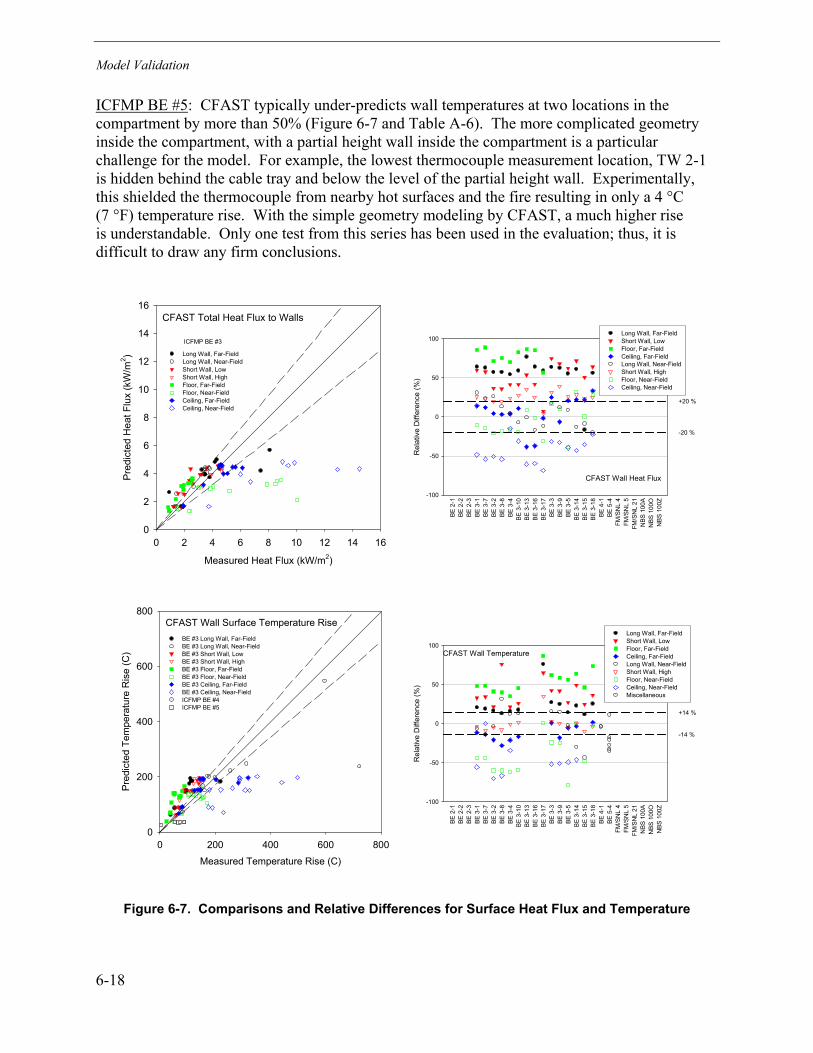
Model Validation
6-18
ICFMP BE #5: CFAST typically under-predicts wall temperatures at two locations in the compartment by more than 50% (Figure 6-7 and Table A-6). The more complicated geometry inside the compartment, with a partial height wall inside the compartment is a particular challenge for the model. For example, the lowest thermocouple measurement location, TW 2-1 is hidden behind the cable tray and below the level of the partial height wall. Experimentally, this shielded the thermocouple from nearby hot surfaces and the fire resulting in only a 4 °C (7 °F) temperature rise. With the simple geometry modeling by CFAST, a much higher rise is understandable. Only one test from this series has been used in the evaluation; thus, it is difficult to draw any firm conclusions.
CFAST Total Heat Flux to Walls
Measured Heat Flux (kW/m2)
0 2 4 6 8 10 12 14 16
Pred
icte
d H
eat F
lux
(kW
/m2 )
0
2
4
6
8
10
12
14
16
Long Wall, Far-FieldLong Wall, Near-FieldShort Wall, LowShort Wall, HighFloor, Far-FieldFloor, Near-FieldCeiling, Far-FieldCeiling, Near-Field
ICFMP BE #3
CFAST Wall Heat Flux
BE 2
-1BE
2-2
BE 2
-3BE
3-1
BE 3
-7BE
3-2
BE 3
-8BE
3-4
BE 3
-10
BE 3
-13
BE 3
-16
BE 3
-17
BE 3
-3BE
3-9
BE 3
-5BE
3-1
4BE
3-1
5BE
3-1
8BE
4-1
BE 5
-4FM
/SN
L 4
FM/S
NL
5FM
/SN
L 21
NBS
100
AN
BS 1
00O
NBS
100
Z
Rel
ativ
e D
iffer
ence
(%)
-100
-50
0
50
100
+20 %
-20 %
Long Wall, Far-FieldShort Wall, LowFloor, Far-FieldCeiling, Far-FieldLong Wall, Near-FieldShort Wall, HighFloor, Near-FieldCeiling, Near-Field
CFAST Wall Surface Temperature Rise
Measured Temperature Rise (C)
0 200 400 600 800
Pred
icte
d Te
mpe
ratu
re R
ise
(C)
0
200
400
600
800
BE #3 Long Wall, Far-FieldBE #3 Long Wall, Near-FieldBE #3 Short Wall, LowBE #3 Short Wall, HighBE #3 Floor, Far-FieldBE #3 Floor, Near-FieldBE #3 Ceiling, Far-FieldBE #3 Ceiling, Near-FieldICFMP BE #4ICFMP BE #5
CFAST Wall Temperature
BE 2
-1BE
2-2
BE 2
-3BE
3-1
BE 3
-7BE
3-2
BE 3
-8BE
3-4
BE 3
-10
BE 3
-13
BE 3
-16
BE 3
-17
BE 3
-3BE
3-9
BE 3
-5BE
3-1
4BE
3-1
5BE
3-1
8BE
4-1
BE 5
-4FM
/SN
L 4
FM/S
NL
5FM
/SN
L 21
NBS
100
AN
BS 1
00O
NBS
100
Z
Rel
ativ
e D
iffer
ence
(%)
-100
-50
0
50
100
+14 %
-14 %
Long Wall, Far-FieldShort Wall, LowFloor, Far-FieldCeiling, Far-FieldLong Wall, Near-FieldShort Wall, HighFloor, Near-FieldCeiling, Near-FieldMiscellaneous
Figure 6-7. Comparisons and Relative Differences for Surface Heat Flux and Temperature
Model Validation
6-19
Summary: Surface Heat Flux and Temperature (Yellow)
Based on the model physics and comparisons of model predictions with experimental measurements, CFAST calculations of flame height are characterized in the Yellow category for the following reasons:
• CFAST is capable of predicting the surface temperature of a wall, assuming that its composition is fairly uniform and its thermal properties are well-characterized. Predictions are typically within 10% to 30%. Generally, CFAST over-predicts the far-field fluxes and temperatures, and under-predicts the near-field measurements. This is consistent with the single representative layer temperature assumed by zone fire models.
• CFAST predictions of floor heat flux and temperature are particularly problematic because of the simple point-source calculation of radiative exchange between the fire and compartment surfaces.
6.10 Summary
This chapter presents a summary of numerous comparisons of the CFAST model with a range of experimental results conducted as part of this V&V effort. Thirteen quantities were selected for comparison and a color rating assigned to each of the output categories, indicating, in a very broad sense, how well the model treats that particular quantity:
• Hot Gas Layer (HGL) Temperature and Height: Green
• Ceiling Jet Temperature: Yellow+
• Plume Temperature: No color assigned
• Flame Height: Green
• Oxygen and Carbon Dioxide Concentration: Green
• Smoke Concentration: Yellow
• Compartment Pressure: Green
• Radiation Heat Flux, Total Heat Flux, and Target Temperature: Yellow
• Wall Heat Flux and Surface Temperature: Yellow
Four of the quantities were assigned a Green rating, indicating that the research team concluded that the physics of the model accurately represent the experimental conditions, and the calculated relative differences comparing the model and the experimental values are consistent with the combined experimental and input uncertainty. A few notes on the comparisons are appropriate:
• The CFAST predictions of the HGL temperature and height are, with a few exceptions, within or close to experimental uncertainty. The CFAST predictions are typical of those found in other studies where the HGL temperature is typically somewhat over-predicted and HGL height somewhat lower (HGL depth somewhat thicker) than experimental
Model Validation
6-20
measurements. Still, predictions are mostly within 10% to 20% of experimental measurements. Calculation of HGL temperature and height has higher uncertainty in rooms remote from the fire (compared to those in the fire compartment).
• For most of the comparisons, CFAST predicts ceiling jet temperature well within experimental uncertainty. For cases where the HGL temperature is below 70 °C (160 °F), significant and consistent over-prediction was observed.
• CFAST predicts the flame height consistent with visual observations of flame height for the experiments. This is not surprising, given that CFAST simply uses a well-characterized experimental correlation to calculate flame height.
• Gas concentrations and compartment pressure predicted by CFAST are within or close to experimental uncertainty.
Three of the quantities were assigned a Yellow rating, indicating that users should take caution when using the model to evaluate the given quantity. This typically indicates limitations in the use of the model. A few notes on the comparisons are appropriate:
• CFAST typically over-predicts smoke concentration. Predicted concentrations for open-door tests are within experimental uncertainties, but those for closed-door tests are far higher.
• With exceptions, CFAST predicts cable surface temperatures within experimental uncertainties. Total heat flux to targets is typically predicted to within about 30%, and often under-predicted. Radiative heat flux to targets is typically over-predicted compared to experimental measurements, with higher relative difference values for closed-door tests. Care should be taken in predicting localized conditions (such as target temperature and heat flux) because of inherent limitations in all zone fire models.
• Predictions of compartment surface temperature and heat flux are typically within 10% to 30%. Generally, CFAST over-predicts the far-field fluxes and temperatures and under-predicts the near-field measurements. This is consistent with the single representative layer temperature assumed by zone fire models.
Plume temperature is not directly calculated nor reported in a CFAST calculation. This was not assigned a color rating. Parameters that are not given a color rating indicate that the model does not include output to permit evaluation of the given parameter in its as-tested version.
CFAST predictions in this validation study were consistent with numerous earlier studies, which show that the use of the model is appropriate in a wide range of fire scenarios. The CFAST model has been subjected to extensive evaluation studies by NIST and others. Although differences between the model and the experiments were evident in these studies, most differences can be explained by limitations of the model as well as of the experiments. Like all predictive models, the best predictions come with a clear understanding of the limitations of the model and the inputs provided to perform the calculations.
7-1
7 REFERENCES
1. Jones, W.W., R.D. Peacock, G.P. Forney, and P.A. Reneke, “Consolidated Model of Fire Growth and Smoke Transport (Version 6): Technical Reference Guide,” NIST SP 1026, National Institute of Standards and Technology, Gaithersburg, MD, 2005.
2. Standard Guide for Evaluating the Predictive Capability of Deterministic Fire Models, ASTM E1355-05a, American Society for Testing and Materials, West Conshohocken, PA, 2005.
3. Peacock, R.D., W.W. Jones, P.A. Reneke, and G.P. Forney, “Consolidated Model of Fire Growth and Smoke Transport (Version 6), User’s Guide,” SP 1041, National Institute of Standards and Technology, Gaithersburg, MD, 2005.
4. Incorpera, F.P., and D.P. DeWitt, Fundamentals of Heat Transfer, John Wiley & Sons, New York, NY, 1981.
5. Rehm, R., and G. Forney, “A Note on the Pressure Equations Used in Zone Fire Modeling,” NISTIR 4906, National Institute of Standards and Technology, Gaithersburg, MD, 1992.
6. Heskestad, G., “Fire Plumes, Flame Height, and Air Entrainment” in The SFPE Handbook of Fire Protection Engineering, 3rd Ed., National Fire Protection Association, Quincy, MA, 2002.
7. McCaffrey, B.J., “Momentum Implications for Buoyant Diffusion Flames,” Combustion and Flame, 52:149, Oxford, UK, 1983.
8. Cooper, L.Y., “Fire-Plume-Generated Ceiling Jet Characteristics and Convective Heat Transfer to Ceiling and Wall Surfaces in a Two-Layer Zone-Type Fire Environment,” NISTIR 4705, National Institute of Standards and Technology, Gaithersburg, MD, 1991.
9. Quintiere, J.G., K. Steckler, and D. Corley, “An Assessment of Fire-Induced Flows in Compartments,” Fire Science and Technology, 4:1, Tokyo, Japan, 1984.
10. Cooper, L.Y., “Calculation of the Flow Through a Horizontal Ceiling/Floor Vent,” NISTIR 89-4052, National Institute of Standards and Technology, Gaithersburg, MD, 1989.
11. Klote, J.H., “A Computer Model of Smoke Movement by Air Conditioning Systems,” NBS IR 87-3657, National Bureau of Standards, Gaithersburg, MD, 1987.
12. Forney, G.P., “Computing Radiative Heat Transfer Occurring in a Zone Fire Model,” NISTIR 4709, National Institute of Standards and Technology, Gaithersburg, MD, 1991.
13. Atreya, A., “Convection Heat Transfer,” SFPE Handbook of Fire Protection Engineering, 3rd Edition, National Fire Protection Association, Quincy, MA, 2002.
14. Moss, W.F., and G.P. Forney, “Implicitly Coupling Heat Conduction Into a Zone Fire Model,” NISTIR 4886, National Institute of Standards and Technology, Gaithersburg, MD, 1992.
References
7-2
15. Heskestad, G., and H.F. Smith, “Investigation of a New Sprinkler Sensitivity Approval Test: The Plunge Test,” Technical Report Serial No. 22485 2937, RC 76-T-50, Factory Mutual Research Corporation, Norwood, MA, 1976.
16. Madrzykowski, D., and R.L. Vettori, “A Sprinkler Fire Suppression Algorithm for the GSA Engineering Fire Assessment System,” Technical Report 4833, National Institute of Standards and Technology, Gaithersburg, MD, 1992.
17. Evans, D.D., “Sprinkler Fire Suppression for Hazard,” Technical Report 5254, National Institute of Standards and Technology, Gaithersburg, MD, 1993.
18. Jones, W.W., “Modeling Smoke Movement through Compartmented Structures,” Journal of Fire Sciences, 11(2):172, Thousand Oaks, CA, 1993.
19. Jones, W.W., “Multicompartment Model for the Spread of Fire, Smoke, and Toxic Gases,” Fire Safety Journal, 9(1):55, Okford, UK, 1985.
20. Jones, W.W., and J.G. Quintiere, “Prediction of Corridor Smoke Filling by Zone Models,” Combustion Science and Technology, 35:239, Oxfordshire, UK, 1984.
21. Jones, W.W., and G.P. Forney, “Modeling Smoke Movement through Compartmented Structures,” Proceedings of the Fall Technical Meeting of Combustion Institute/Eastern States Section, Ithaca, NY, 1991.
22. Walton, W.D., “Zone Fire Models for Enclosures,” SFPE Handbook of Fire Protection Engineering, 3rd Edition (P.J. DiNenno, C.L. Beyler, R.L.P. Custer, W.D. Walton, and J.M. Watts, Editors), National Fire Protection Association, Quincy, MA, 2002.
23. NFPA 805, Performance-Based Standard for Fire Protection for Light-Water Reactor Electric Generating Plants, 2001 Edition, 2004/2005 National Fire Codes, National Fire Protection Association, Quincy, MA, 2004.
24. NFPA 551, Guide for the Evaluation of Fire Risk Assessment, 2004 Edition, 2004/2005 National Fire Code, National Fire Protection Association, Quincy, MA, 2004.
25. Peacock, R.D., G.P. Forney, and P.A. Reneke, R.M. Portier, and W.W. Jones, “Consolidated Model of Fire Growth and Smoke Transport” NIST TN 1299, National Institute of Standards and Technology, Gaithersburg, MD, 1993.
26. Barnett, J.R., and C.L. Beyler, “Development of an Instructional Program for Practicing Engineers HAZARD I Users,” GCR 90-580, National Institute of Standards and Technology, Gaithersburg, MD, 1990.
27. Peacock, R.D., P.A. Reneke, C.L. Forney, and M.M. Kostreva, “Issues in Evaluation of Complex Fire Models,” Fire Safety Journal, 30:103–136, Okford, UK, 1998.
28. Beard, A., “Evaluation of Fire Models: Part I – Introduction,” Fire Safety Journal, 19:295–306, Oxford, UK, 1992.
29. Notarianni, K.A., “The Role of Uncertainty in Improving Fire Protection Regulation,” PhD Thesis, Carnegie Mellon University, Pittsburgh, PA, 2000.
30. Khoudja, N., “Procedures for Quantitative Sensitivity and Performance Validation of a Deterministic Fire Safety Model,” Ph.D. Dissertation, Texas A&M University, GCR-88-544, National Bureau of Standards, Gaithersburg, MD, 1988.
References
7-3
31. Walker, A.M., “Uncertainty Analysis of Zone Fire Models,” Fire Engineering Research Report 97/8, University of Canterbury, New Zealand, 1997.
32. Peacock, R.D., S. Davis, and B.T. Lee, Experimental Data Set for the Accuracy Assessment of Room Fire Model, Report NBSIR 88-3752, National Bureau of Standards, Gaithersburg, MD, April 1988.

A-1
A TECHNICAL DETAILS OF CFAST VALIDATION STUDY
This appendix provides comparisons of CFAST predictions and experimental measurements for the six series of fire experiments under consideration. Each section to follow contains an assessment of the model predictions for the following quantities:
A.1 Hot Gas Layer Temperature and Height
A.2 Ceiling Jet Temperature
A.3 Plume Temperature
A.4 Flame Height
A.5 Oxygen and Carbon Dioxide Concentration
A.6 Smoke Concentration
A.7 Compartment Pressure
A.8 Target Heat Flux and Surface Temperature
A.9 Wall Heat Flux and Surface Temperature
Volume 2 includes a detailed discussion of the uncertainties associated with both the experimental data and model predictions presented in this appendix.
Technical Details of CFAST Validation Study
A-2
A.1 Hot Gas Layer Temperature and Height
CFAST is a classic two-zone fire model. For a given fire scenario, the model subdivides a compartment into two control volumes, which include a relatively hot upper layer and a relatively cool lower layer. In addition, CFAST adds a zone for the fire plume. The lower layer is primarily fresh air. By contrast, the hot upper layer (which is also known as the hot gas layer) is where combustion products accumulate via the plume. Each layer has its own energy and mass balances.
Within a compartment, each zone has homogeneous properties. That is, the temperature and gas concentrations are assumed to be constant throughout the zone; the properties only change as a function of time. The CFAST model describes the conditions in each zone by solving equations for conservation of mass, species, and energy, along with the ideal gas law.
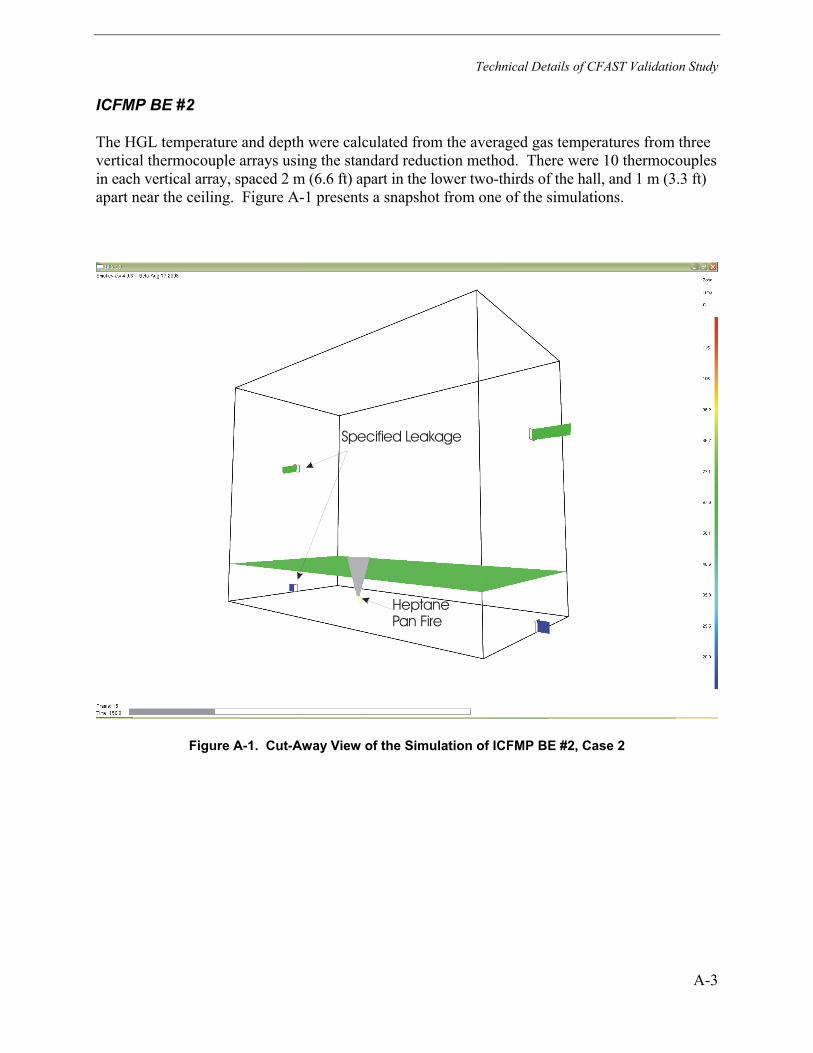
Technical Details of CFAST Validation Study
A-3
ICFMP BE #2
The HGL temperature and depth were calculated from the averaged gas temperatures from three vertical thermocouple arrays using the standard reduction method. There were 10 thermocouples in each vertical array, spaced 2 m (6.6 ft) apart in the lower two-thirds of the hall, and 1 m (3.3 ft) apart near the ceiling. Figure A-1 presents a snapshot from one of the simulations.
Specified Leakage
HeptanePan Fire
Figure A-1. Cut-Away View of the Simulation of ICFMP BE #2, Case 2
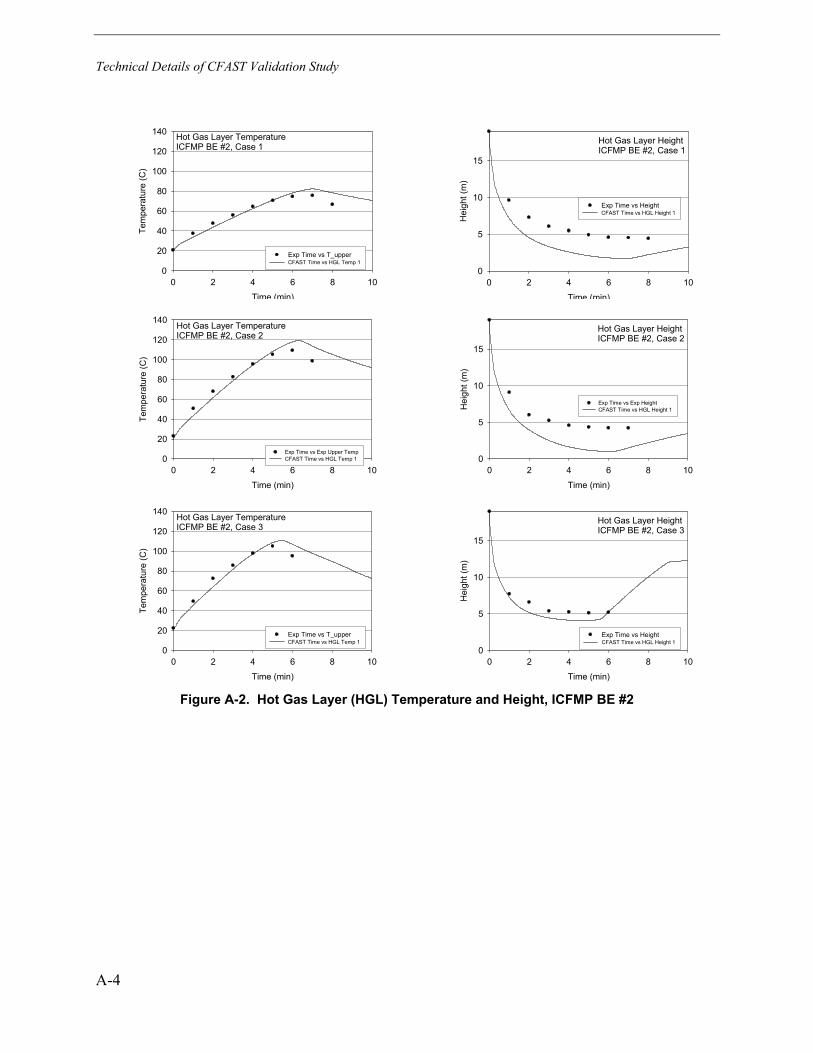
Technical Details of CFAST Validation Study
A-4
Hot Gas Layer TemperatureICFMP BE #2, Case 1
Time (min)
0 2 4 6 8 10
Tem
pera
ture
(C)
0
20
40
60
80
100
120
140
Exp Time vs T_upper CFAST Time vs HGL Temp 1
Hot Gas Layer HeightICFMP BE #2, Case 1
Time (min)
0 2 4 6 8 10
Hei
ght (
m)
0
5
10
15
Exp Time vs Height CFAST Time vs HGL Height 1
Hot Gas Layer TemperatureICFMP BE #2, Case 2
Time (min)
0 2 4 6 8 10
Tem
pera
ture
(C)
0
20
40
60
80
100
120
140
Exp Time vs Exp Upper Temp CFAST Time vs HGL Temp 1
Hot Gas Layer HeightICFMP BE #2, Case 2
Time (min)
0 2 4 6 8 10H
eigh
t (m
)0
5
10
15
Exp Time vs Exp Height CFAST Time vs HGL Height 1
Hot Gas Layer TemperatureICFMP BE #2, Case 3
Time (min)
0 2 4 6 8 10
Tem
pera
ture
(C)
0
20
40
60
80
100
120
140
Exp Time vs T_upper CFAST Time vs HGL Temp 1
Hot Gas Layer HeightICFMP BE #2, Case 3
Time (min)
0 2 4 6 8 10
Hei
ght (
m)
0
5
10
15
Exp Time vs Height CFAST Time vs HGL Height 1
Figure A-2. Hot Gas Layer (HGL) Temperature and Height, ICFMP BE #2
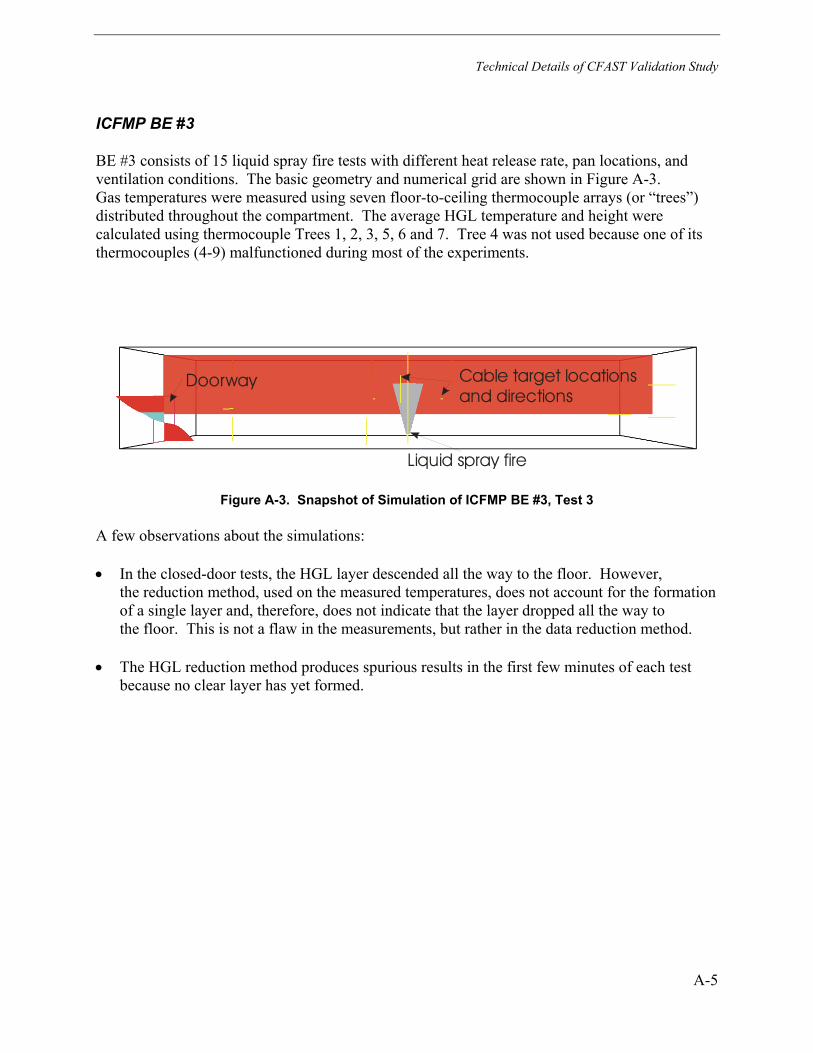
Technical Details of CFAST Validation Study
A-5
ICFMP BE #3
BE #3 consists of 15 liquid spray fire tests with different heat release rate, pan locations, and ventilation conditions. The basic geometry and numerical grid are shown in Figure A-3. Gas temperatures were measured using seven floor-to-ceiling thermocouple arrays (or “trees”) distributed throughout the compartment. The average HGL temperature and height were calculated using thermocouple Trees 1, 2, 3, 5, 6 and 7. Tree 4 was not used because one of its thermocouples (4-9) malfunctioned during most of the experiments.
Liquid spray fire
Doorway Cable target locationsand directions
Figure A-3. Snapshot of Simulation of ICFMP BE #3, Test 3
A few observations about the simulations:
• In the closed-door tests, the HGL layer descended all the way to the floor. However, the reduction method, used on the measured temperatures, does not account for the formation of a single layer and, therefore, does not indicate that the layer dropped all the way to the floor. This is not a flaw in the measurements, but rather in the data reduction method.
• The HGL reduction method produces spurious results in the first few minutes of each test because no clear layer has yet formed.
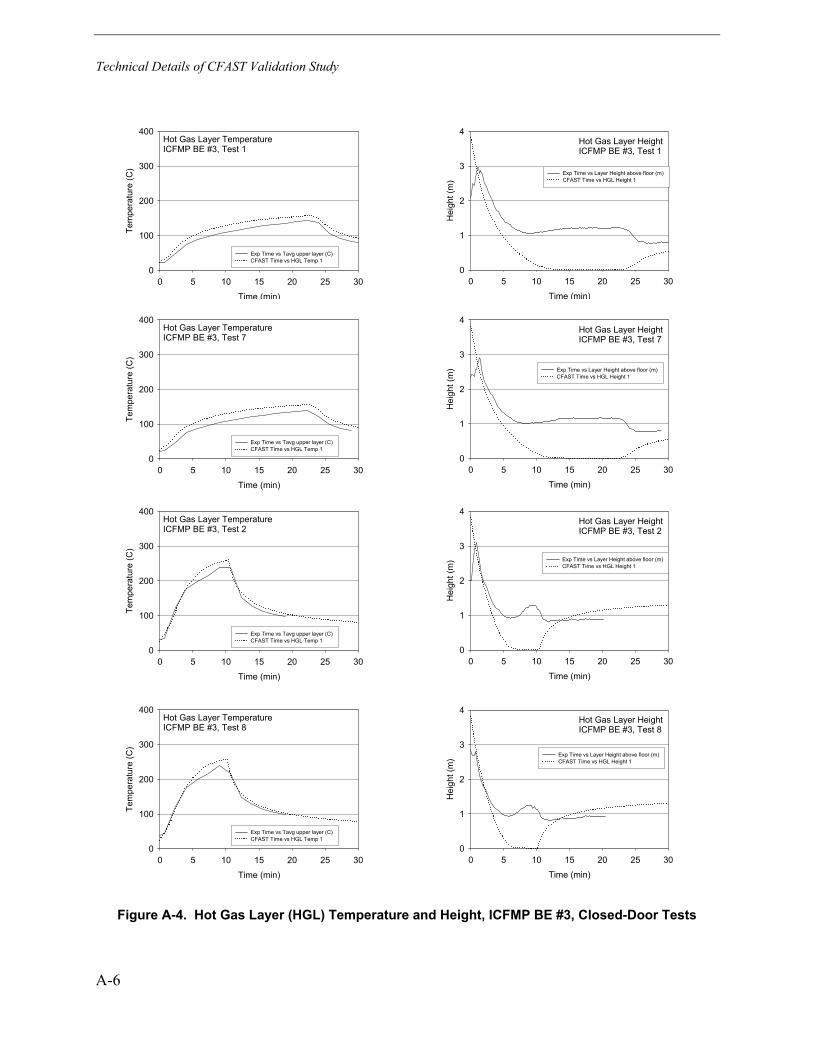
Technical Details of CFAST Validation Study
A-6
Hot Gas Layer TemperatureICFMP BE #3, Test 1
Time (min)
0 5 10 15 20 25 30
Tem
pera
ture
(C)
0
100
200
300
400
Exp Time vs Tavg upper layer (C) CFAST Time vs HGL Temp 1
Hot Gas Layer HeightICFMP BE #3, Test 1
Time (min)
0 5 10 15 20 25 30
Hei
ght (
m)
0
1
2
3
4
Exp Time vs Layer Height above floor (m) CFAST Time vs HGL Height 1
Hot Gas Layer TemperatureICFMP BE #3, Test 7
Time (min)
0 5 10 15 20 25 30
Tem
pera
ture
(C)
0
100
200
300
400
Exp Time vs Tavg upper layer (C) CFAST Time vs HGL Temp 1
Hot Gas Layer HeightICFMP BE #3, Test 7
Time (min)
0 5 10 15 20 25 30
Hei
ght (
m)
0
1
2
3
4
Exp Time vs Layer Height above floor (m) CFAST Time vs HGL Height 1
Hot Gas Layer TemperatureICFMP BE #3, Test 2
Time (min)
0 5 10 15 20 25 30
Tem
pera
ture
(C)
0
100
200
300
400
Exp Time vs Tavg upper layer (C) CFAST Time vs HGL Temp 1
Hot Gas Layer HeightICFMP BE #3, Test 2
Time (min)
0 5 10 15 20 25 30
Hei
ght (
m)
0
1
2
3
4
Exp Time vs Layer Height above floor (m) CFAST Time vs HGL Height 1
Hot Gas Layer TemperatureICFMP BE #3, Test 8
Time (min)
0 5 10 15 20 25 30
Tem
pera
ture
(C)
0
100
200
300
400
Exp Time vs Tavg upper layer (C) CFAST Time vs HGL Temp 1
Hot Gas Layer HeightICFMP BE #3, Test 8
Time (min)
0 5 10 15 20 25 30
Hei
ght (
m)
0
1
2
3
4
Exp Time vs Layer Height above floor (m) CFAST Time vs HGL Height 1
Figure A-4. Hot Gas Layer (HGL) Temperature and Height, ICFMP BE #3, Closed-Door Tests
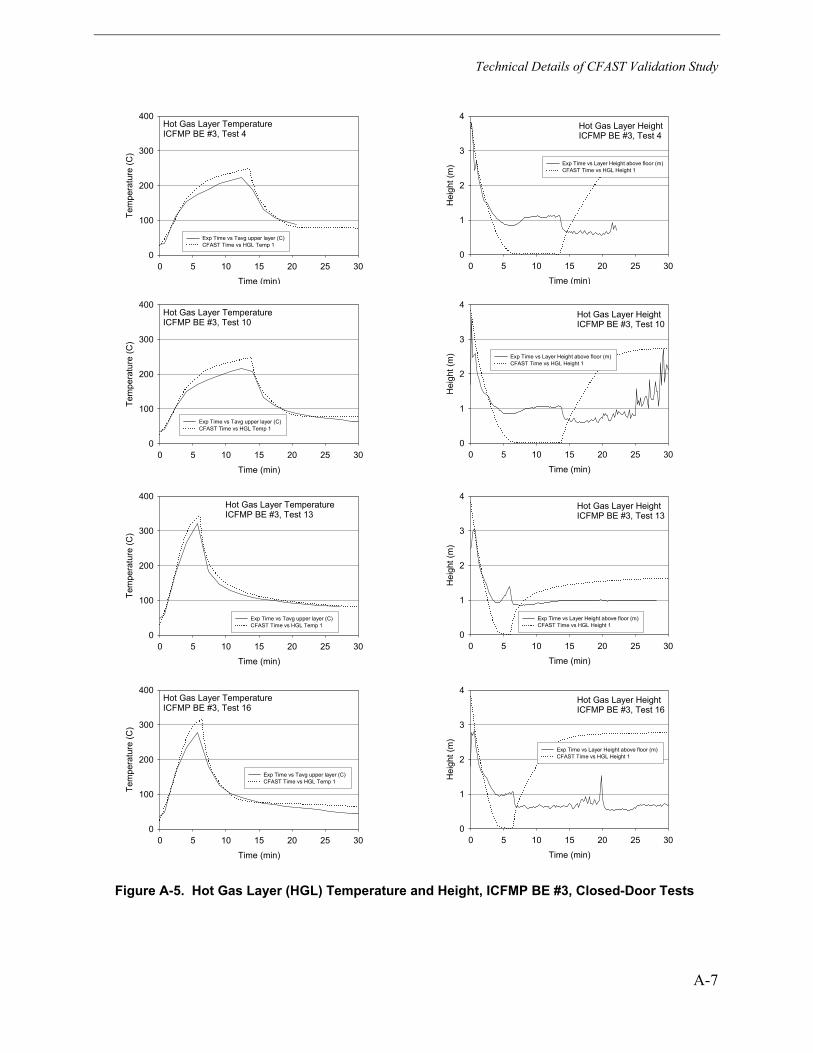
Technical Details of CFAST Validation Study
A-7
Hot Gas Layer TemperatureICFMP BE #3, Test 4
Time (min)
0 5 10 15 20 25 30
Tem
pera
ture
(C)
0
100
200
300
400
Exp Time vs Tavg upper layer (C) CFAST Time vs HGL Temp 1
Hot Gas Layer HeightICFMP BE #3, Test 4
Time (min)
0 5 10 15 20 25 30
Hei
ght (
m)
0
1
2
3
4
Exp Time vs Layer Height above floor (m) CFAST Time vs HGL Height 1
Hot Gas Layer TemperatureICFMP BE #3, Test 10
Time (min)
0 5 10 15 20 25 30
Tem
pera
ture
(C)
0
100
200
300
400
Exp Time vs Tavg upper layer (C) CFAST Time vs HGL Temp 1
Hot Gas Layer HeightICFMP BE #3, Test 10
Time (min)
0 5 10 15 20 25 30H
eigh
t (m
)0
1
2
3
4
Exp Time vs Layer Height above floor (m) CFAST Time vs HGL Height 1
Hot Gas Layer TemperatureICFMP BE #3, Test 13
Time (min)
0 5 10 15 20 25 30
Tem
pera
ture
(C)
0
100
200
300
400
Exp Time vs Tavg upper layer (C) CFAST Time vs HGL Temp 1
Hot Gas Layer HeightICFMP BE #3, Test 13
Time (min)
0 5 10 15 20 25 30
Hei
ght (
m)
0
1
2
3
4
Exp Time vs Layer Height above floor (m) CFAST Time vs HGL Height 1
Hot Gas Layer TemperatureICFMP BE #3, Test 16
Time (min)
0 5 10 15 20 25 30
Tem
pera
ture
(C)
0
100
200
300
400
Exp Time vs Tavg upper layer (C) CFAST Time vs HGL Temp 1
Hot Gas Layer HeightICFMP BE #3, Test 16
Time (min)
0 5 10 15 20 25 30
Hei
ght (
m)
0
1
2
3
4
Exp Time vs Layer Height above floor (m) CFAST Time vs HGL Height 1
Figure A-5. Hot Gas Layer (HGL) Temperature and Height, ICFMP BE #3, Closed-Door Tests
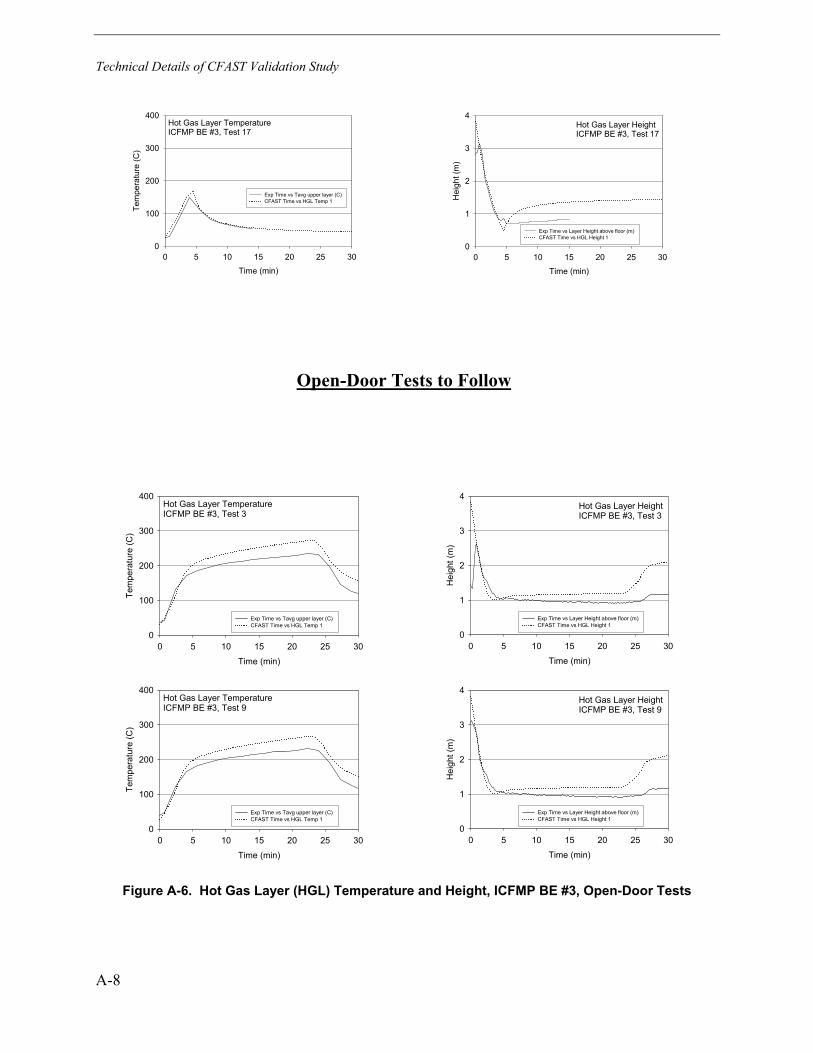
Technical Details of CFAST Validation Study
A-8
Hot Gas Layer TemperatureICFMP BE #3, Test 17
Time (min)
0 5 10 15 20 25 30
Tem
pera
ture
(C)
0
100
200
300
400
Exp Time vs Tavg upper layer (C) CFAST Time vs HGL Temp 1
Hot Gas Layer HeightICFMP BE #3, Test 17
Time (min)
0 5 10 15 20 25 30
Hei
ght (
m)
0
1
2
3
4
Exp Time vs Layer Height above floor (m) CFAST Time vs HGL Height 1
Open-Door Tests to Follow
Hot Gas Layer TemperatureICFMP BE #3, Test 3
Time (min)
0 5 10 15 20 25 30
Tem
pera
ture
(C)
0
100
200
300
400
Exp Time vs Tavg upper layer (C) CFAST Time vs HGL Temp 1
Hot Gas Layer HeightICFMP BE #3, Test 3
Time (min)
0 5 10 15 20 25 30
Hei
ght (
m)
0
1
2
3
4
Exp Time vs Layer Height above floor (m) CFAST Time vs HGL Height 1
Hot Gas Layer TemperatureICFMP BE #3, Test 9
Time (min)
0 5 10 15 20 25 30
Tem
pera
ture
(C)
0
100
200
300
400
Exp Time vs Tavg upper layer (C) CFAST Time vs HGL Temp 1
Hot Gas Layer HeightICFMP BE #3, Test 9
Time (min)
0 5 10 15 20 25 30
Hei
ght (
m)
0
1
2
3
4
Exp Time vs Layer Height above floor (m) CFAST Time vs HGL Height 1
Figure A-6. Hot Gas Layer (HGL) Temperature and Height, ICFMP BE #3, Open-Door Tests
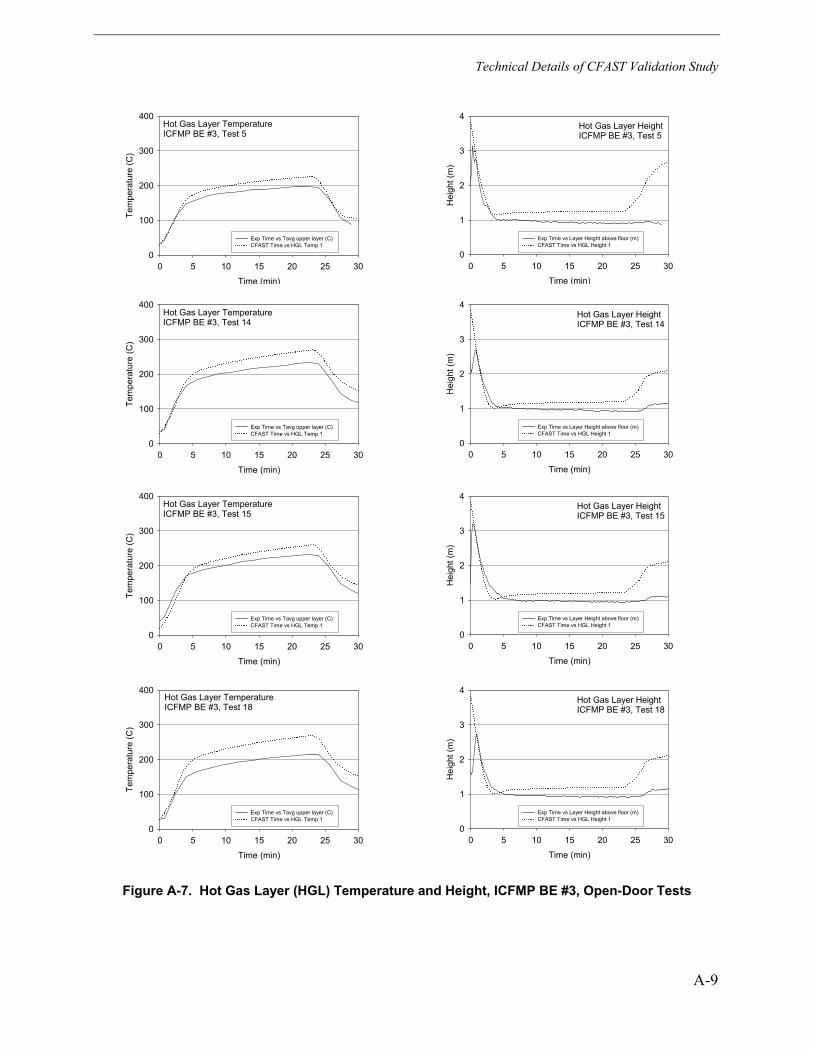
Technical Details of CFAST Validation Study
A-9
Hot Gas Layer TemperatureICFMP BE #3, Test 5
Time (min)
0 5 10 15 20 25 30
Tem
pera
ture
(C)
0
100
200
300
400
Exp Time vs Tavg upper layer (C) CFAST Time vs HGL Temp 1
Hot Gas Layer HeightICFMP BE #3, Test 5
Time (min)
0 5 10 15 20 25 30
Hei
ght (
m)
0
1
2
3
4
Exp Time vs Layer Height above floor (m) CFAST Time vs HGL Height 1
Hot Gas Layer TemperatureICFMP BE #3, Test 14
Time (min)
0 5 10 15 20 25 30
Tem
pera
ture
(C)
0
100
200
300
400
Exp Time vs Tavg upper layer (C) CFAST Time vs HGL Temp 1
Hot Gas Layer HeightICFMP BE #3, Test 14
Time (min)
0 5 10 15 20 25 30H
eigh
t (m
)0
1
2
3
4
Exp Time vs Layer Height above floor (m) CFAST Time vs HGL Height 1
Hot Gas Layer TemperatureICFMP BE #3, Test 15
Time (min)
0 5 10 15 20 25 30
Tem
pera
ture
(C)
0
100
200
300
400
Exp Time vs Tavg upper layer (C) CFAST Time vs HGL Temp 1
Hot Gas Layer HeightICFMP BE #3, Test 15
Time (min)
0 5 10 15 20 25 30
Hei
ght (
m)
0
1
2
3
4
Exp Time vs Layer Height above floor (m) CFAST Time vs HGL Height 1
Hot Gas Layer TemperatureICFMP BE #3, Test 18
Time (min)
0 5 10 15 20 25 30
Tem
pera
ture
(C)
0
100
200
300
400
Exp Time vs Tavg upper layer (C) CFAST Time vs HGL Temp 1
Hot Gas Layer HeightICFMP BE #3, Test 18
Time (min)
0 5 10 15 20 25 30
Hei
ght (
m)
0
1
2
3
4
Exp Time vs Layer Height above floor (m) CFAST Time vs HGL Height 1
Figure A-7. Hot Gas Layer (HGL) Temperature and Height, ICFMP BE #3, Open-Door Tests
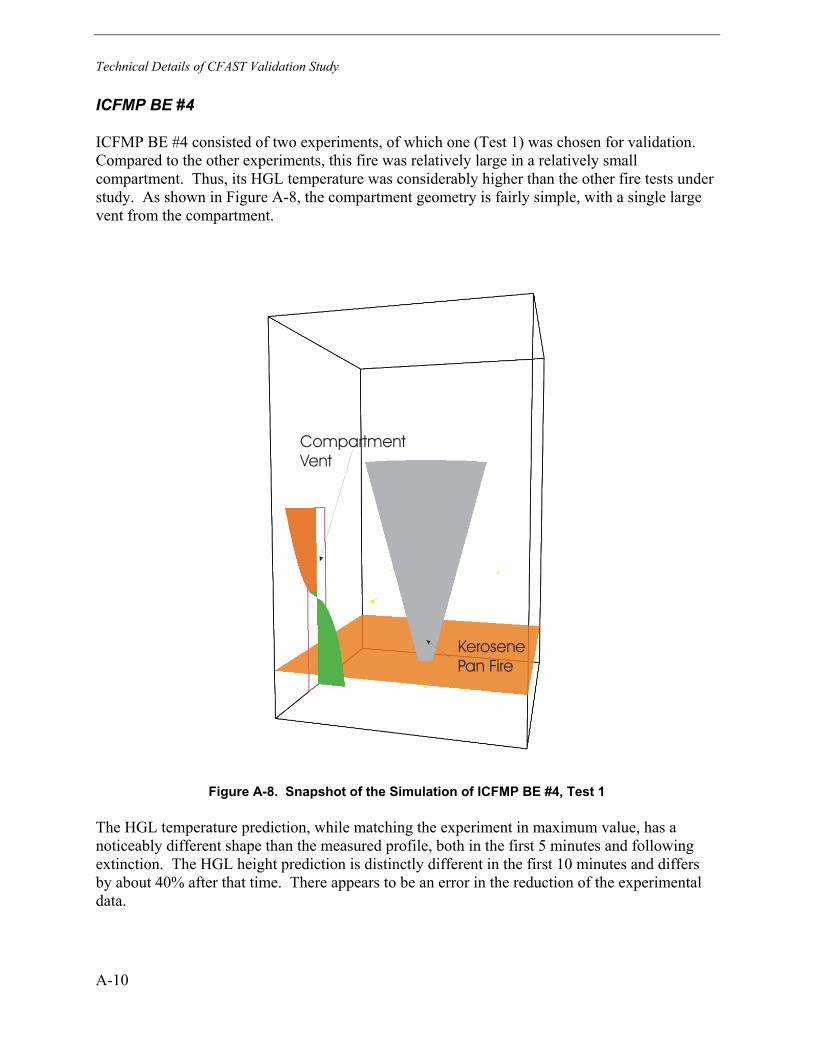
Technical Details of CFAST Validation Study
A-10
ICFMP BE #4
ICFMP BE #4 consisted of two experiments, of which one (Test 1) was chosen for validation. Compared to the other experiments, this fire was relatively large in a relatively small compartment. Thus, its HGL temperature was considerably higher than the other fire tests under study. As shown in Figure A-8, the compartment geometry is fairly simple, with a single large vent from the compartment.
KerosenePan Fire
CompartmentVent
Figure A-8. Snapshot of the Simulation of ICFMP BE #4, Test 1
The HGL temperature prediction, while matching the experiment in maximum value, has a noticeably different shape than the measured profile, both in the first 5 minutes and following extinction. The HGL height prediction is distinctly different in the first 10 minutes and differs by about 40% after that time. There appears to be an error in the reduction of the experimental data.
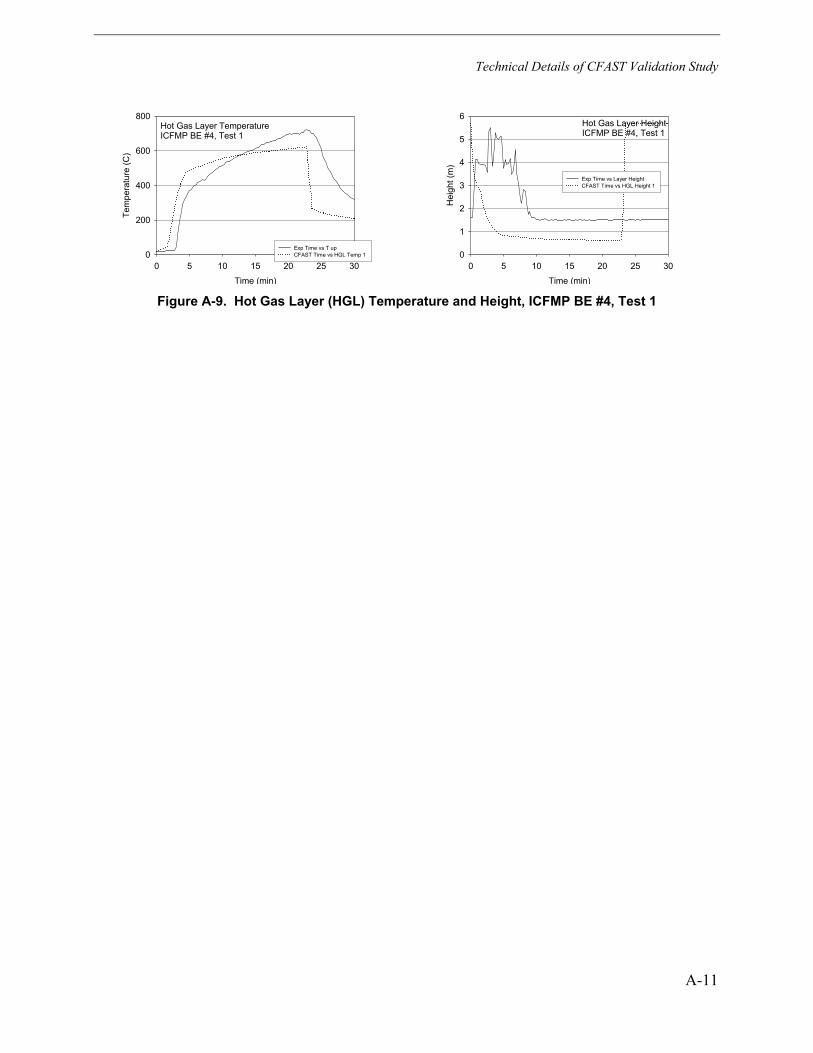
Technical Details of CFAST Validation Study
A-11
Hot Gas Layer TemperatureICFMP BE #4, Test 1
Time (min)
0 5 10 15 20 25 30
Tem
pera
ture
(C)
0
200
400
600
800
Exp Time vs T up CFAST Time vs HGL Temp 1
Hot Gas Layer HeightICFMP BE #4, Test 1
Time (min)
0 5 10 15 20 25 30
Hei
ght (
m)
0
1
2
3
4
5
6
Exp Time vs Layer Height CFAST Time vs HGL Height 1
Figure A-9. Hot Gas Layer (HGL) Temperature and Height, ICFMP BE #4, Test 1
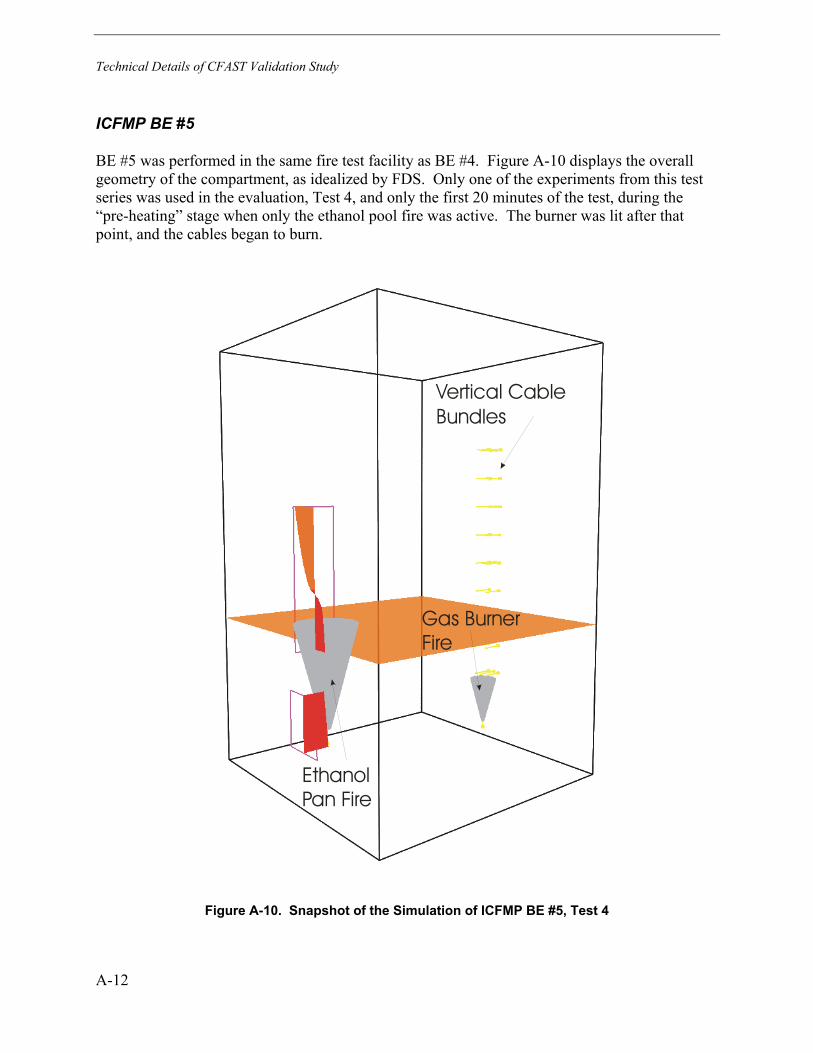
Technical Details of CFAST Validation Study
A-12
ICFMP BE #5
BE #5 was performed in the same fire test facility as BE #4. Figure A-10 displays the overall geometry of the compartment, as idealized by FDS. Only one of the experiments from this test series was used in the evaluation, Test 4, and only the first 20 minutes of the test, during the “pre-heating” stage when only the ethanol pool fire was active. The burner was lit after that point, and the cables began to burn.
EthanolPan Fire
Gas BurnerFire
Vertical CableBundles
Figure A-10. Snapshot of the Simulation of ICFMP BE #5, Test 4
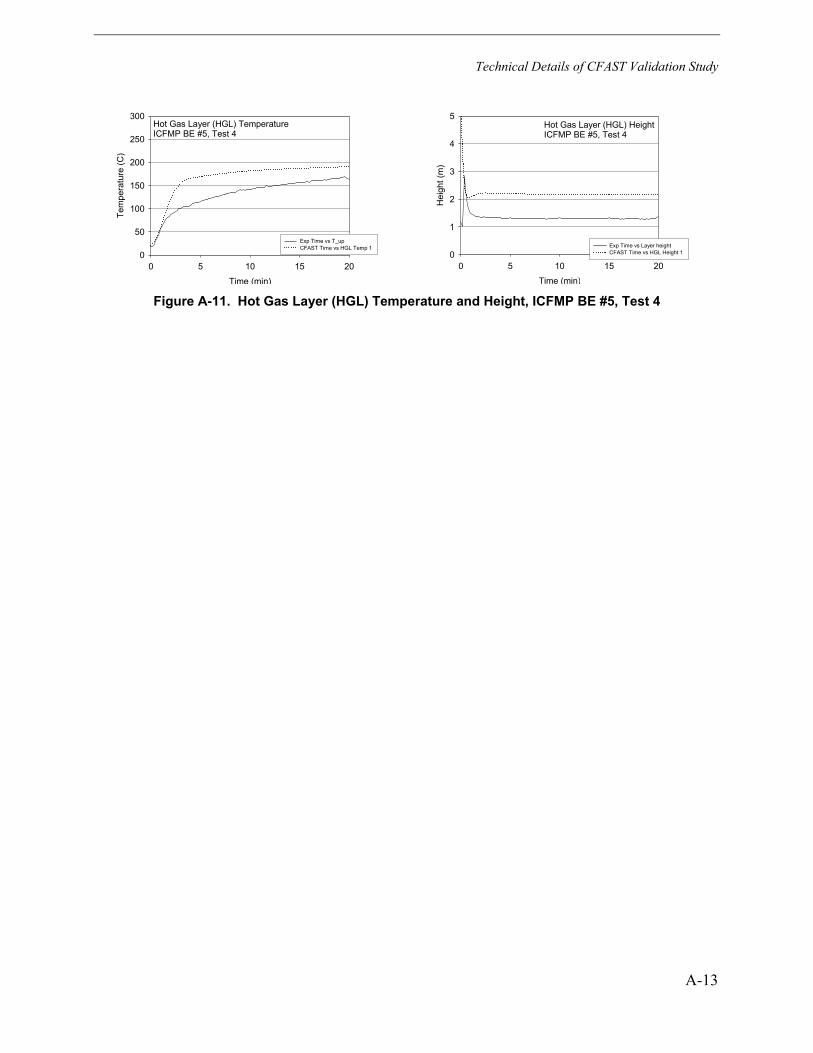
Technical Details of CFAST Validation Study
A-13
Hot Gas Layer (HGL) TemperatureICFMP BE #5, Test 4
Time (min)
0 5 10 15 20
Tem
pera
ture
(C)
0
50
100
150
200
250
300
Exp Time vs T_up CFAST Time vs HGL Temp 1
Hot Gas Layer (HGL) HeightICFMP BE #5, Test 4
Time (min)
0 5 10 15 20
Hei
ght (
m)
0
1
2
3
4
5
Exp Time vs Layer height CFAST Time vs HGL Height 1
Figure A-11. Hot Gas Layer (HGL) Temperature and Height, ICFMP BE #5, Test 4
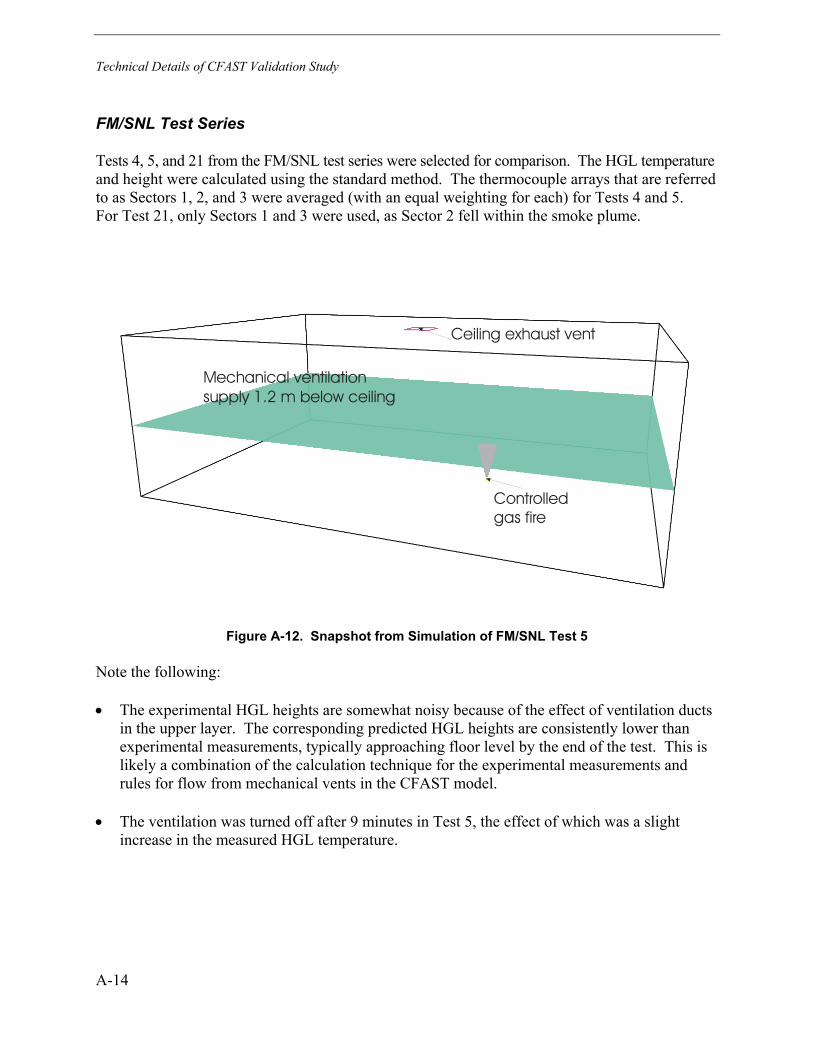
Technical Details of CFAST Validation Study
A-14
FM/SNL Test Series
Tests 4, 5, and 21 from the FM/SNL test series were selected for comparison. The HGL temperature and height were calculated using the standard method. The thermocouple arrays that are referred to as Sectors 1, 2, and 3 were averaged (with an equal weighting for each) for Tests 4 and 5. For Test 21, only Sectors 1 and 3 were used, as Sector 2 fell within the smoke plume.
Controlledgas fire
Ceiling exhaust vent
Mechanical ventilationsupply 1.2 m below ceiling
Figure A-12. Snapshot from Simulation of FM/SNL Test 5
Note the following:
• The experimental HGL heights are somewhat noisy because of the effect of ventilation ducts in the upper layer. The corresponding predicted HGL heights are consistently lower than experimental measurements, typically approaching floor level by the end of the test. This is likely a combination of the calculation technique for the experimental measurements and rules for flow from mechanical vents in the CFAST model.
• The ventilation was turned off after 9 minutes in Test 5, the effect of which was a slight increase in the measured HGL temperature.
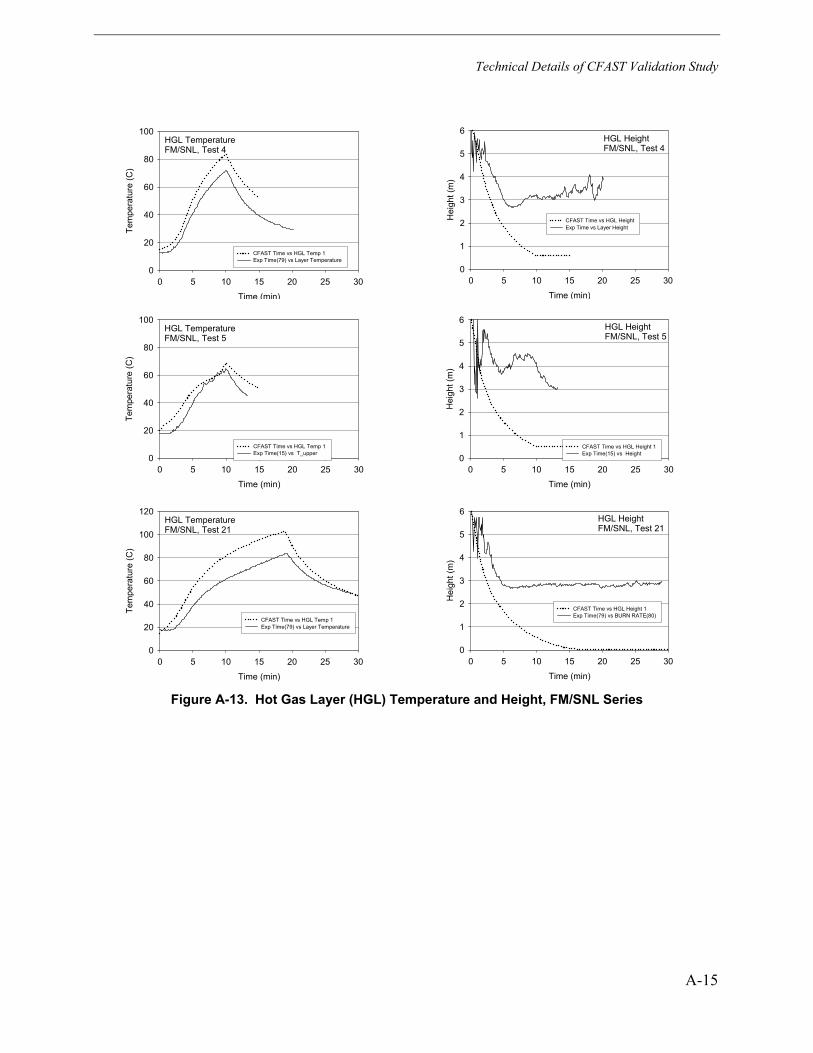
Technical Details of CFAST Validation Study
A-15
HGL TemperatureFM/SNL, Test 4
Time (min)
0 5 10 15 20 25 30
Tem
pera
ture
(C)
0
20
40
60
80
100
CFAST Time vs HGL Temp 1 Exp Time(79) vs Layer Temperature
HGL HeightFM/SNL, Test 4
Time (min)
0 5 10 15 20 25 30
Hei
ght (
m)
0
1
2
3
4
5
6
CFAST Time vs HGL Height Exp Time vs Layer Height
HGL TemperatureFM/SNL, Test 5
Time (min)
0 5 10 15 20 25 30
Tem
pera
ture
(C)
0
20
40
60
80
100
CFAST Time vs HGL Temp 1 Exp Time(15) vs T_upper
HGL HeightFM/SNL, Test 5
Time (min)
0 5 10 15 20 25 30
Hei
ght (
m)
0
1
2
3
4
5
6
CFAST Time vs HGL Height 1 Exp Time(15) vs Height
HGL TemperatureFM/SNL, Test 21
Time (min)
0 5 10 15 20 25 30
Tem
pera
ture
(C)
0
20
40
60
80
100
120
CFAST Time vs HGL Temp 1 Exp Time(79) vs Layer Temperature
HGL HeightFM/SNL, Test 21
Time (min)
0 5 10 15 20 25 30
Hei
ght (
m)
0
1
2
3
4
5
6
CFAST Time vs HGL Height 1 Exp Time(79) vs BURN RATE(80)
Figure A-13. Hot Gas Layer (HGL) Temperature and Height, FM/SNL Series
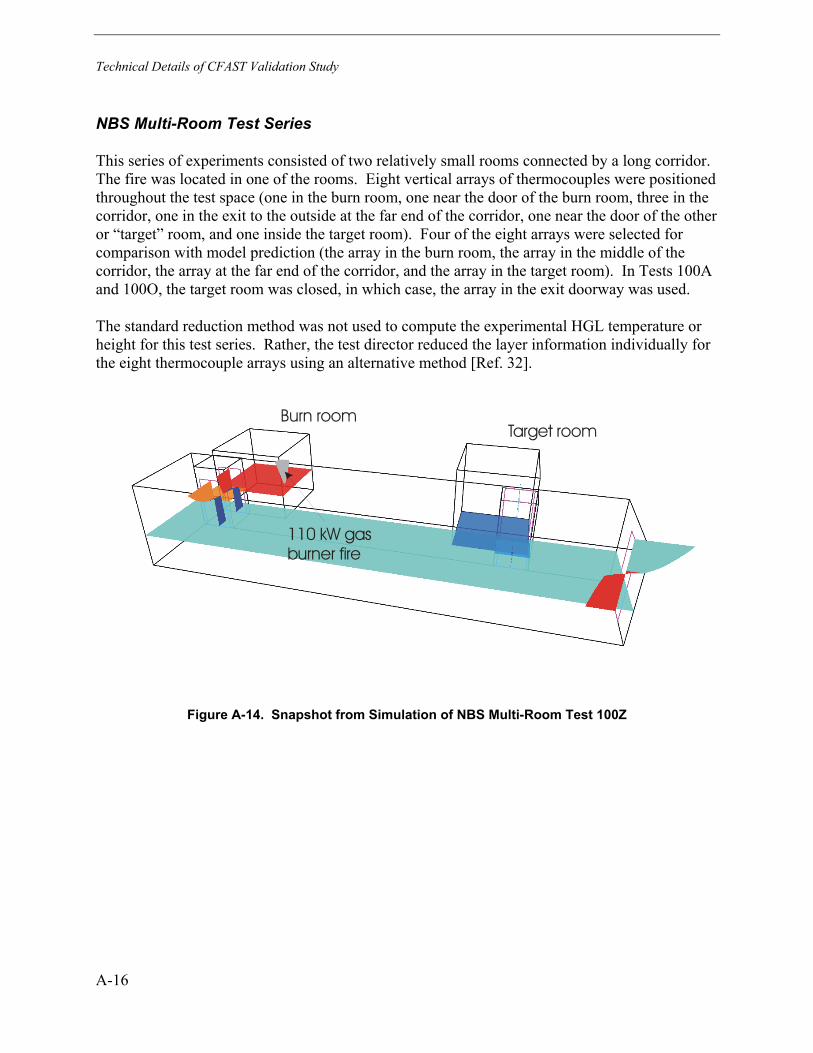
Technical Details of CFAST Validation Study
A-16
NBS Multi-Room Test Series
This series of experiments consisted of two relatively small rooms connected by a long corridor. The fire was located in one of the rooms. Eight vertical arrays of thermocouples were positioned throughout the test space (one in the burn room, one near the door of the burn room, three in the corridor, one in the exit to the outside at the far end of the corridor, one near the door of the other or “target” room, and one inside the target room). Four of the eight arrays were selected for comparison with model prediction (the array in the burn room, the array in the middle of the corridor, the array at the far end of the corridor, and the array in the target room). In Tests 100A and 100O, the target room was closed, in which case, the array in the exit doorway was used.
The standard reduction method was not used to compute the experimental HGL temperature or height for this test series. Rather, the test director reduced the layer information individually for the eight thermocouple arrays using an alternative method [Ref. 32].
Burn room
110 kW gasburner fire
Target room
Figure A-14. Snapshot from Simulation of NBS Multi-Room Test 100Z
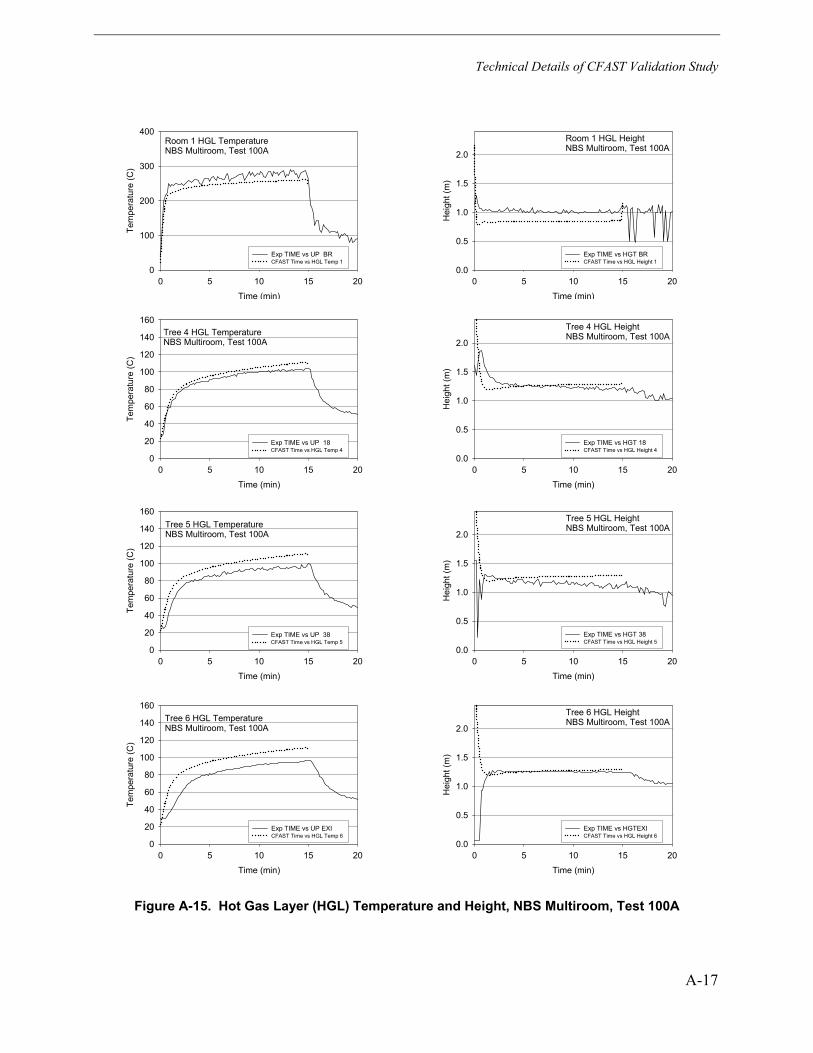
Technical Details of CFAST Validation Study
A-17
Room 1 HGL TemperatureNBS Multiroom, Test 100A
Time (min)
0 5 10 15 20
Tem
pera
ture
(C)
0
100
200
300
400
Exp TIME vs UP BR CFAST Time vs HGL Temp 1
Room 1 HGL HeightNBS Multiroom, Test 100A
Time (min)
0 5 10 15 20
Hei
ght (
m)
0.0
0.5
1.0
1.5
2.0
Exp TIME vs HGT BR CFAST Time vs HGL Height 1
Tree 4 HGL TemperatureNBS Multiroom, Test 100A
Time (min)
0 5 10 15 20
Tem
pera
ture
(C)
0
20
40
60
80
100
120
140
160
Exp TIME vs UP 18 CFAST Time vs HGL Temp 4
Tree 4 HGL HeightNBS Multiroom, Test 100A
Time (min)
0 5 10 15 20
Hei
ght (
m)
0.0
0.5
1.0
1.5
2.0
Exp TIME vs HGT 18 CFAST Time vs HGL Height 4
Tree 5 HGL TemperatureNBS Multiroom, Test 100A
Time (min)
0 5 10 15 20
Tem
pera
ture
(C)
0
20
40
60
80
100
120
140
160
Exp TIME vs UP 38 CFAST Time vs HGL Temp 5
Tree 5 HGL HeightNBS Multiroom, Test 100A
Time (min)
0 5 10 15 20
Hei
ght (
m)
0.0
0.5
1.0
1.5
2.0
Exp TIME vs HGT 38 CFAST Time vs HGL Height 5
Tree 6 HGL TemperatureNBS Multiroom, Test 100A
Time (min)
0 5 10 15 20
Tem
pera
ture
(C)
0
20
40
60
80
100
120
140
160
Exp TIME vs UP EXI CFAST Time vs HGL Temp 6
Tree 6 HGL HeightNBS Multiroom, Test 100A
Time (min)
0 5 10 15 20
Hei
ght (
m)
0.0
0.5
1.0
1.5
2.0
Exp TIME vs HGTEXI CFAST Time vs HGL Height 6
Figure A-15. Hot Gas Layer (HGL) Temperature and Height, NBS Multiroom, Test 100A
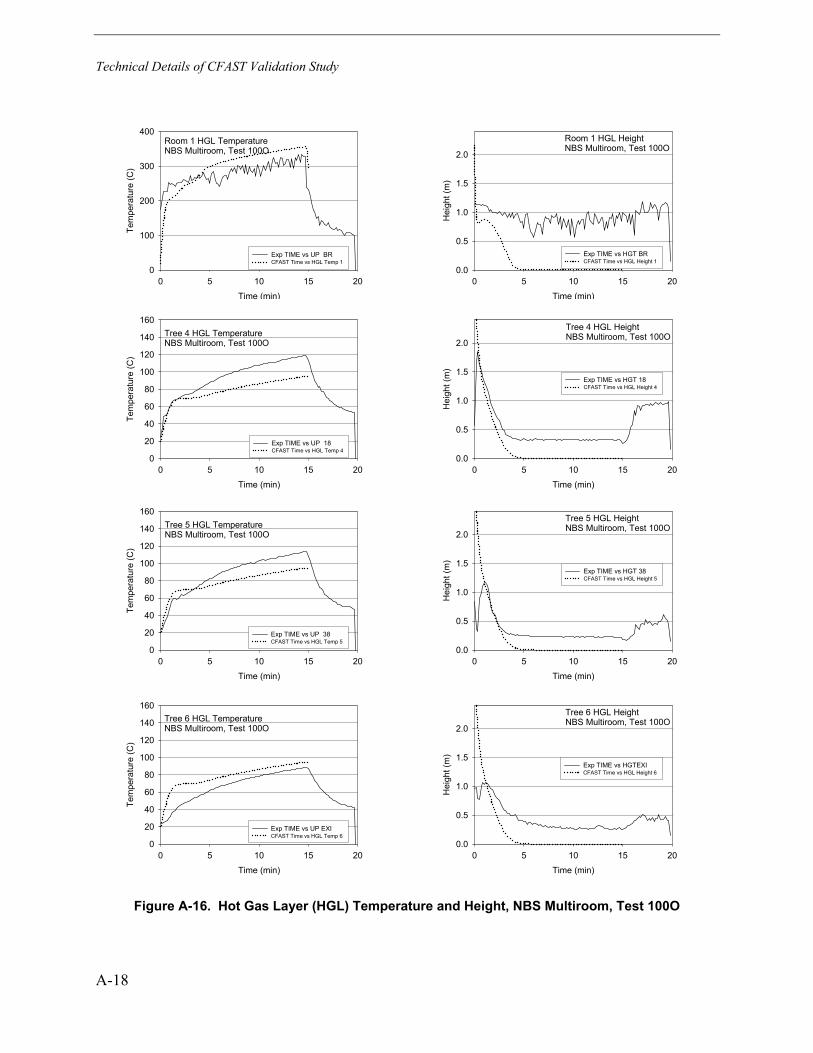
Technical Details of CFAST Validation Study
A-18
Room 1 HGL TemperatureNBS Multiroom, Test 100O
Time (min)
0 5 10 15 20
Tem
pera
ture
(C)
0
100
200
300
400
Exp TIME vs UP BR CFAST Time vs HGL Temp 1
Room 1 HGL HeightNBS Multiroom, Test 100O
Time (min)
0 5 10 15 20
Hei
ght (
m)
0.0
0.5
1.0
1.5
2.0
Exp TIME vs HGT BR CFAST Time vs HGL Height 1
Tree 4 HGL TemperatureNBS Multiroom, Test 100O
Time (min)
0 5 10 15 20
Tem
pera
ture
(C)
0
20
40
60
80
100
120
140
160
Exp TIME vs UP 18 CFAST Time vs HGL Temp 4
Tree 4 HGL HeightNBS Multiroom, Test 100O
Time (min)
0 5 10 15 20
Hei
ght (
m)
0.0
0.5
1.0
1.5
2.0
Exp TIME vs HGT 18 CFAST Time vs HGL Height 4
Tree 5 HGL TemperatureNBS Multiroom, Test 100O
Time (min)
0 5 10 15 20
Tem
pera
ture
(C)
0
20
40
60
80
100
120
140
160
Exp TIME vs UP 38 CFAST Time vs HGL Temp 5
Tree 5 HGL HeightNBS Multiroom, Test 100O
Time (min)
0 5 10 15 20
Hei
ght (
m)
0.0
0.5
1.0
1.5
2.0
Exp TIME vs HGT 38 CFAST Time vs HGL Height 5
Tree 6 HGL TemperatureNBS Multiroom, Test 100O
Time (min)
0 5 10 15 20
Tem
pera
ture
(C)
0
20
40
60
80
100
120
140
160
Exp TIME vs UP EXI CFAST Time vs HGL Temp 6
Tree 6 HGL HeightNBS Multiroom, Test 100O
Time (min)
0 5 10 15 20
Hei
ght (
m)
0.0
0.5
1.0
1.5
2.0
Exp TIME vs HGTEXI CFAST Time vs HGL Height 6
Figure A-16. Hot Gas Layer (HGL) Temperature and Height, NBS Multiroom, Test 100O
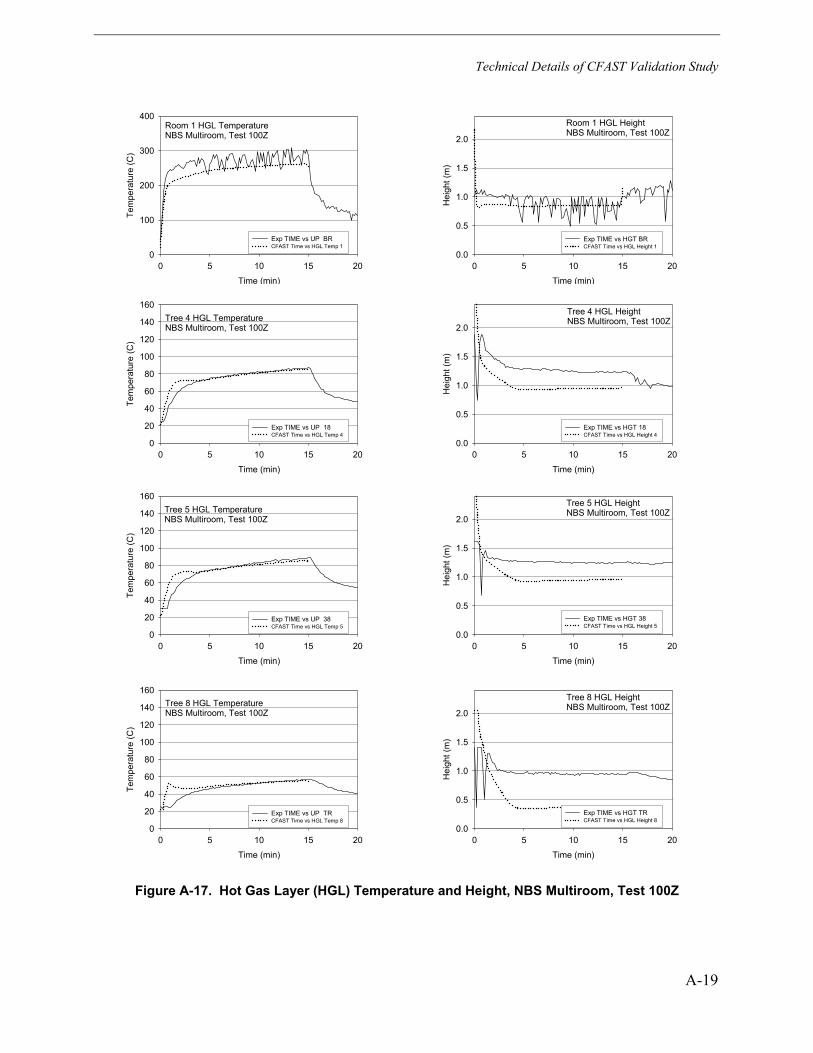
Technical Details of CFAST Validation Study
A-19
Room 1 HGL TemperatureNBS Multiroom, Test 100Z
Time (min)
0 5 10 15 20
Tem
pera
ture
(C)
0
100
200
300
400
Exp TIME vs UP BR CFAST Time vs HGL Temp 1
Room 1 HGL HeightNBS Multiroom, Test 100Z
Time (min)
0 5 10 15 20
Hei
ght (
m)
0.0
0.5
1.0
1.5
2.0
Exp TIME vs HGT BR CFAST Time vs HGL Height 1
Tree 4 HGL TemperatureNBS Multiroom, Test 100Z
Time (min)
0 5 10 15 20
Tem
pera
ture
(C)
0
20
40
60
80
100
120
140
160
Exp TIME vs UP 18 CFAST Time vs HGL Temp 4
Tree 4 HGL HeightNBS Multiroom, Test 100Z
Time (min)
0 5 10 15 20H
eigh
t (m
)0.0
0.5
1.0
1.5
2.0
Exp TIME vs HGT 18 CFAST Time vs HGL Height 4
Tree 5 HGL TemperatureNBS Multiroom, Test 100Z
Time (min)
0 5 10 15 20
Tem
pera
ture
(C)
0
20
40
60
80
100
120
140
160
Exp TIME vs UP 38 CFAST Time vs HGL Temp 5
Tree 5 HGL HeightNBS Multiroom, Test 100Z
Time (min)
0 5 10 15 20
Hei
ght (
m)
0.0
0.5
1.0
1.5
2.0
Exp TIME vs HGT 38 CFAST Time vs HGL Height 5
Tree 8 HGL TemperatureNBS Multiroom, Test 100Z
Time (min)
0 5 10 15 20
Tem
pera
ture
(C)
0
20
40
60
80
100
120
140
160
Exp TIME vs UP TR CFAST Time vs HGL Temp 8
Tree 8 HGL HeightNBS Multiroom, Test 100Z
Time (min)
0 5 10 15 20
Hei
ght (
m)
0.0
0.5
1.0
1.5
2.0
Exp TIME vs HGT TR CFAST Time vs HGL Height 8
Figure A-17. Hot Gas Layer (HGL) Temperature and Height, NBS Multiroom, Test 100Z
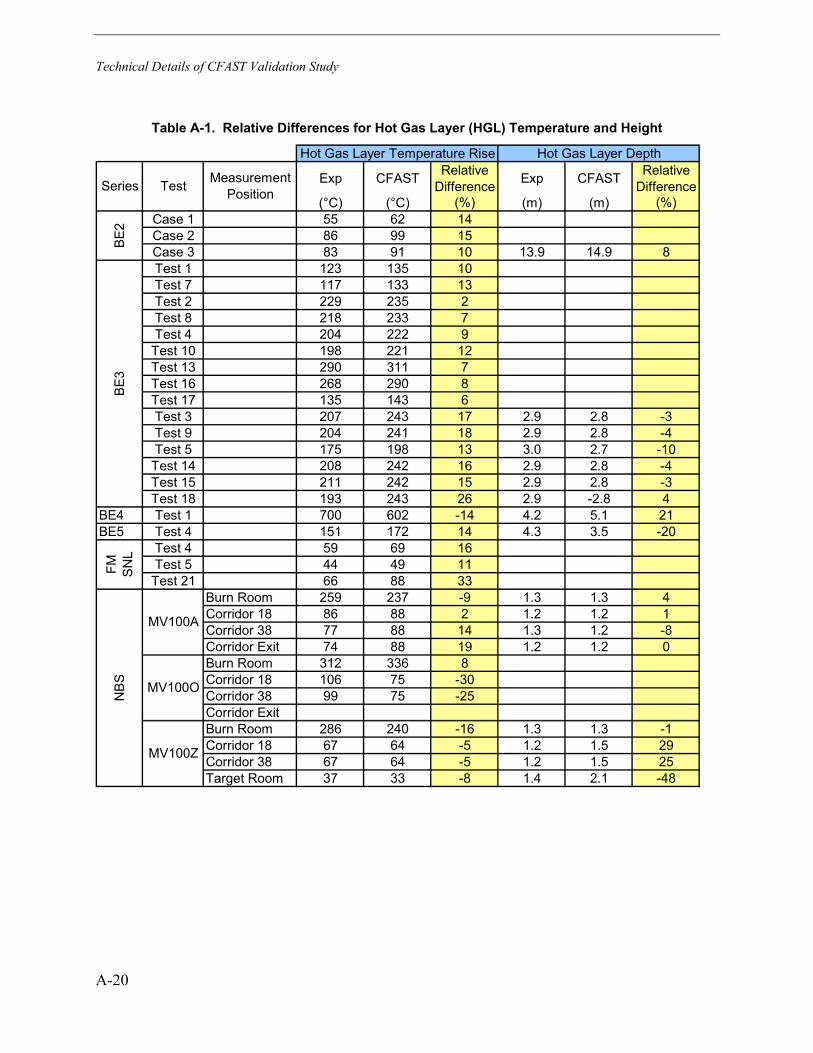
Technical Details of CFAST Validation Study
A-20
Table A-1. Relative Differences for Hot Gas Layer (HGL) Temperature and Height
Exp CFAST Relative Difference Exp CFAST Relative
Difference(°C) (°C) (%) (m) (m) (%)
Case 1 55 62 14Case 2 86 99 15Case 3 83 91 10 13.9 14.9 8Test 1 123 135 10Test 7 117 133 13Test 2 229 235 2Test 8 218 233 7Test 4 204 222 9Test 10 198 221 12Test 13 290 311 7Test 16 268 290 8Test 17 135 143 6Test 3 207 243 17 2.9 2.8 -3Test 9 204 241 18 2.9 2.8 -4Test 5 175 198 13 3.0 2.7 -10Test 14 208 242 16 2.9 2.8 -4Test 15 211 242 15 2.9 2.8 -3Test 18 193 243 26 2.9 -2.8 4
BE4 Test 1 700 602 -14 4.2 5.1 21BE5 Test 4 151 172 14 4.3 3.5 -20
Test 4 59 69 16Test 5 44 49 11Test 21 66 88 33
Burn Room 259 237 -9 1.3 1.3 4Corridor 18 86 88 2 1.2 1.2 1Corridor 38 77 88 14 1.3 1.2 -8Corridor Exit 74 88 19 1.2 1.2 0Burn Room 312 336 8Corridor 18 106 75 -30Corridor 38 99 75 -25Corridor ExitBurn Room 286 240 -16 1.3 1.3 -1Corridor 18 67 64 -5 1.2 1.5 29Corridor 38 67 64 -5 1.2 1.5 25Target Room 37 33 -8 1.4 2.1 -48
Hot Gas Layer Temperature Rise Hot Gas Layer Depth
BE2
BE3
Series Test Measurement Position
FM
SNL
NBS
MV100A
MV100O
MV100Z
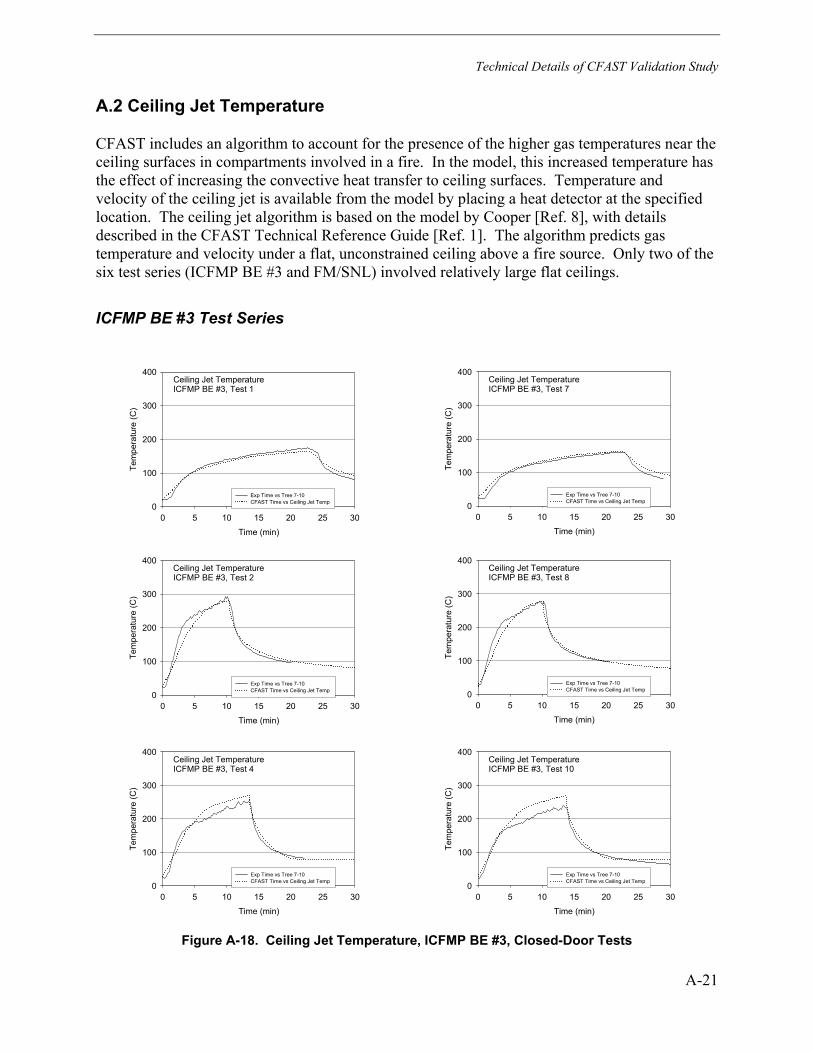
Technical Details of CFAST Validation Study
A-21
A.2 Ceiling Jet Temperature
CFAST includes an algorithm to account for the presence of the higher gas temperatures near the ceiling surfaces in compartments involved in a fire. In the model, this increased temperature has the effect of increasing the convective heat transfer to ceiling surfaces. Temperature and velocity of the ceiling jet is available from the model by placing a heat detector at the specified location. The ceiling jet algorithm is based on the model by Cooper [Ref. 8], with details described in the CFAST Technical Reference Guide [Ref. 1]. The algorithm predicts gas temperature and velocity under a flat, unconstrained ceiling above a fire source. Only two of the six test series (ICFMP BE #3 and FM/SNL) involved relatively large flat ceilings.
ICFMP BE #3 Test Series
Ceiling Jet TemperatureICFMP BE #3, Test 1
Time (min)
0 5 10 15 20 25 30
Tem
pera
ture
(C)
0
100
200
300
400
Exp Time vs Tree 7-10 CFAST Time vs Ceiling Jet Temp
Ceiling Jet TemperatureICFMP BE #3, Test 7
Time (min)
0 5 10 15 20 25 30
Tem
pera
ture
(C)
0
100
200
300
400
Exp Time vs Tree 7-10 CFAST Time vs Ceiling Jet Temp
Ceiling Jet TemperatureICFMP BE #3, Test 2
Time (min)
0 5 10 15 20 25 30
Tem
pera
ture
(C)
0
100
200
300
400
Exp Time vs Tree 7-10 CFAST Time vs Ceiling Jet Temp
Ceiling Jet TemperatureICFMP BE #3, Test 8
Time (min)
0 5 10 15 20 25 30
Tem
pera
ture
(C)
0
100
200
300
400
Exp Time vs Tree 7-10 CFAST Time vs Ceiling Jet Temp
Ceiling Jet TemperatureICFMP BE #3, Test 4
Time (min)
0 5 10 15 20 25 30
Tem
pera
ture
(C)
0
100
200
300
400
Exp Time vs Tree 7-10 CFAST Time vs Ceiling Jet Temp
Ceiling Jet TemperatureICFMP BE #3, Test 10
Time (min)
0 5 10 15 20 25 30
Tem
pera
ture
(C)
0
100
200
300
400
Exp Time vs Tree 7-10 CFAST Time vs Ceiling Jet Temp
Figure A-18. Ceiling Jet Temperature, ICFMP BE #3, Closed-Door Tests
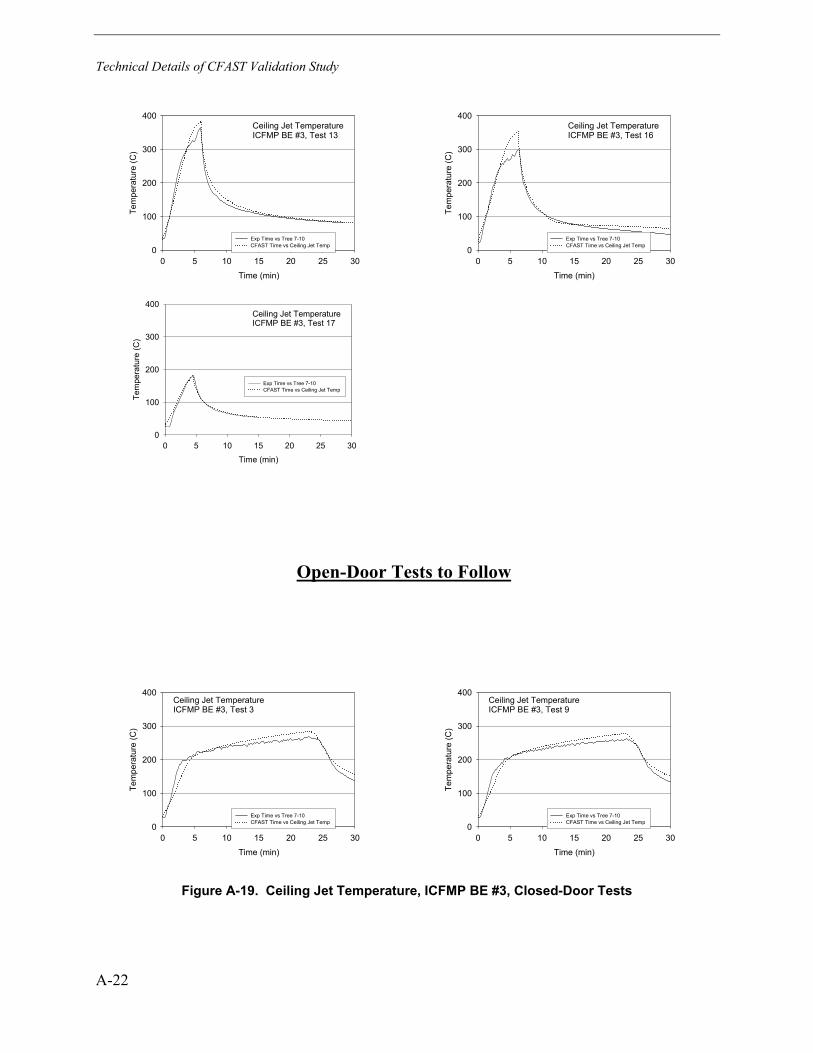
Technical Details of CFAST Validation Study
A-22
Ceiling Jet TemperatureICFMP BE #3, Test 13
Time (min)
0 5 10 15 20 25 30
Tem
pera
ture
(C)
0
100
200
300
400
Exp Time vs Tree 7-10 CFAST Time vs Ceiling Jet Temp
Ceiling Jet TemperatureICFMP BE #3, Test 16
Time (min)
0 5 10 15 20 25 30
Tem
pera
ture
(C)
0
100
200
300
400
Exp Time vs Tree 7-10 CFAST Time vs Ceiling Jet Temp
Ceiling Jet TemperatureICFMP BE #3, Test 17
Time (min)
0 5 10 15 20 25 30
Tem
pera
ture
(C)
0
100
200
300
400
Exp Time vs Tree 7-10 CFAST Time vs Ceiling Jet Temp
Open-Door Tests to Follow
Ceiling Jet TemperatureICFMP BE #3, Test 3
Time (min)
0 5 10 15 20 25 30
Tem
pera
ture
(C)
0
100
200
300
400
Exp Time vs Tree 7-10 CFAST Time vs Ceiling Jet Temp
Ceiling Jet TemperatureICFMP BE #3, Test 9
Time (min)
0 5 10 15 20 25 30
Tem
pera
ture
(C)
0
100
200
300
400
Exp Time vs Tree 7-10 CFAST Time vs Ceiling Jet Temp
Figure A-19. Ceiling Jet Temperature, ICFMP BE #3, Closed-Door Tests
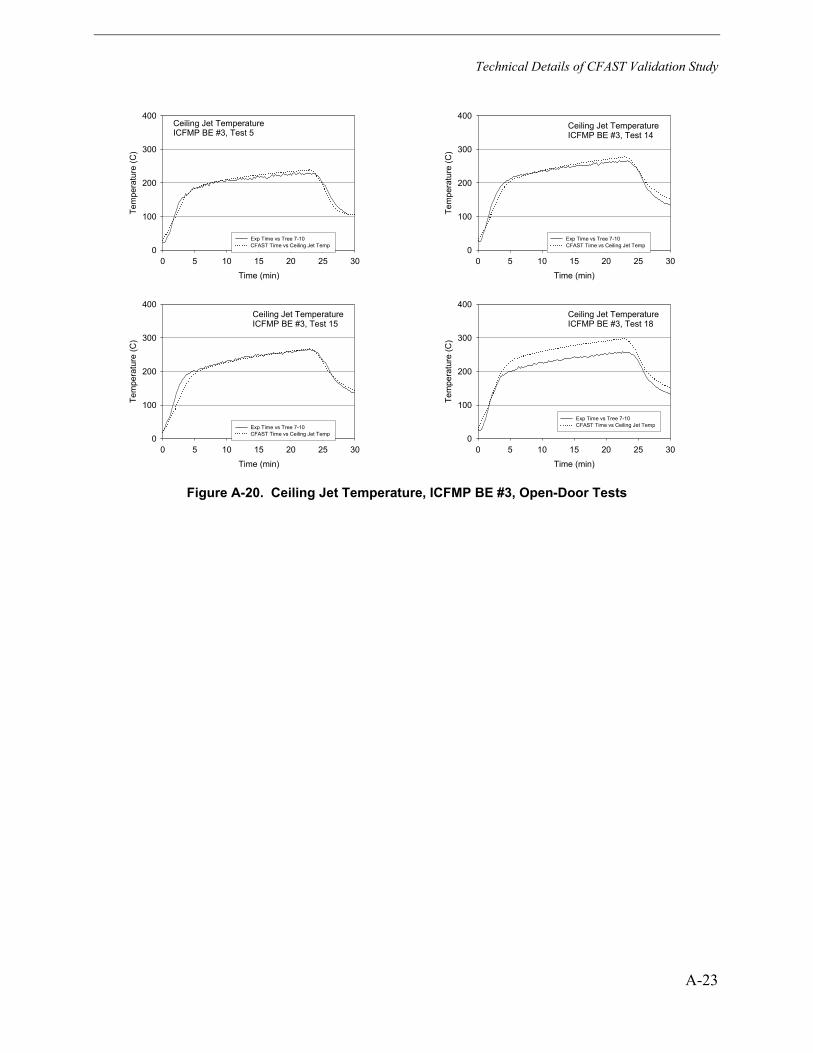
Technical Details of CFAST Validation Study
A-23
Ceiling Jet TemperatureICFMP BE #3, Test 5
Time (min)
0 5 10 15 20 25 30
Tem
pera
ture
(C)
0
100
200
300
400
Exp Time vs Tree 7-10 CFAST Time vs Ceiling Jet Temp
Ceiling Jet TemperatureICFMP BE #3, Test 14
Time (min)
0 5 10 15 20 25 30
Tem
pera
ture
(C)
0
100
200
300
400
Exp Time vs Tree 7-10 CFAST Time vs Ceiling Jet Temp
Ceiling Jet TemperatureICFMP BE #3, Test 15
Time (min)
0 5 10 15 20 25 30
Tem
pera
ture
(C)
0
100
200
300
400
Exp Time vs Tree 7-10 CFAST Time vs Ceiling Jet Temp
Ceiling Jet TemperatureICFMP BE #3, Test 18
Time (min)
0 5 10 15 20 25 30Te
mpe
ratu
re (C
)0
100
200
300
400
Exp Time vs Tree 7-10 CFAST Time vs Ceiling Jet Temp
Figure A-20. Ceiling Jet Temperature, ICFMP BE #3, Open-Door Tests
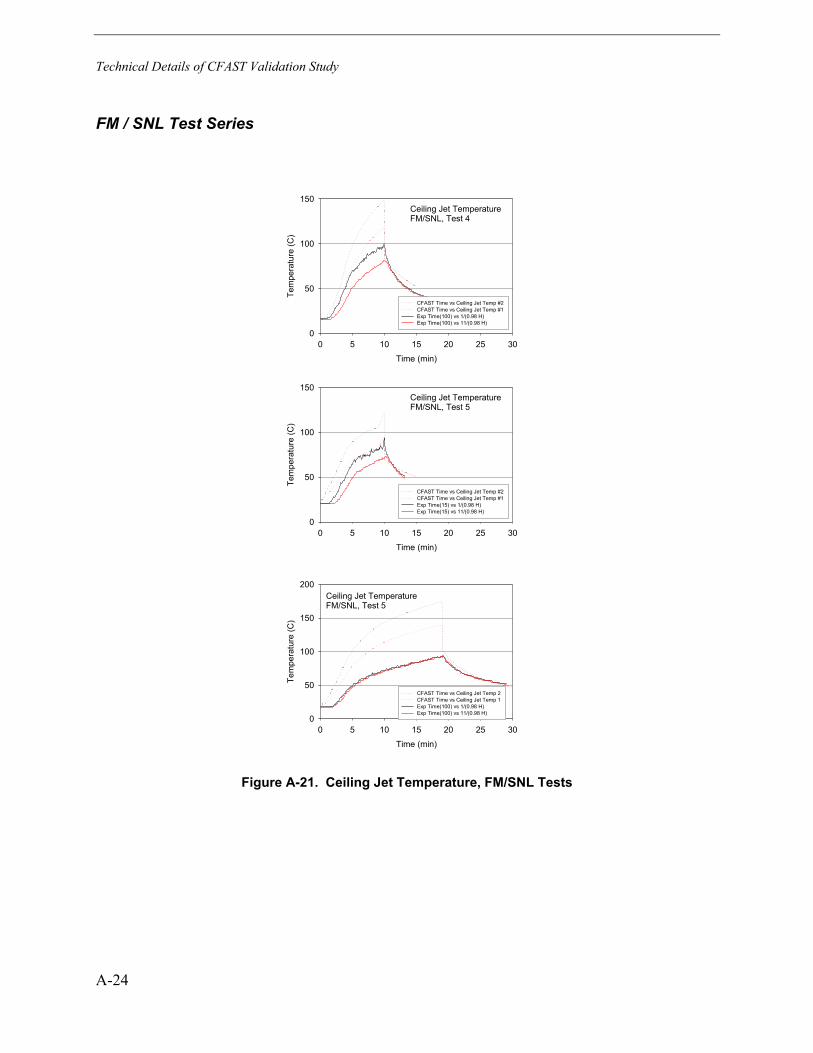
Technical Details of CFAST Validation Study
A-24
FM / SNL Test Series
Ceiling Jet TemperatureFM/SNL, Test 4
Time (min)
0 5 10 15 20 25 30
Tem
pera
ture
(C)
0
50
100
150
CFAST Time vs Ceiling Jet Temp #2 CFAST Time vs Ceiling Jet Temp #1 Exp Time(100) vs 1/(0.98 H) Exp Time(100) vs 11/(0.98 H)
Ceiling Jet TemperatureFM/SNL, Test 5
Time (min)
0 5 10 15 20 25 30
Tem
pera
ture
(C)
0
50
100
150
CFAST Time vs Ceiling Jet Temp #2 CFAST Time vs Ceiling Jet Temp #1 Exp Time(15) vs 1/(0.98 H) Exp Time(15) vs 11/(0.98 H)
Ceiling Jet TemperatureFM/SNL, Test 5
Time (min)
0 5 10 15 20 25 30
Tem
pera
ture
(C)
0
50
100
150
200
CFAST Time vs Ceiling Jet Temp 2 CFAST Time vs Ceiling Jet Temp 1 Exp Time(100) vs 1/(0.98 H) Exp Time(100) vs 11/(0.98 H)
Figure A-21. Ceiling Jet Temperature, FM/SNL Tests
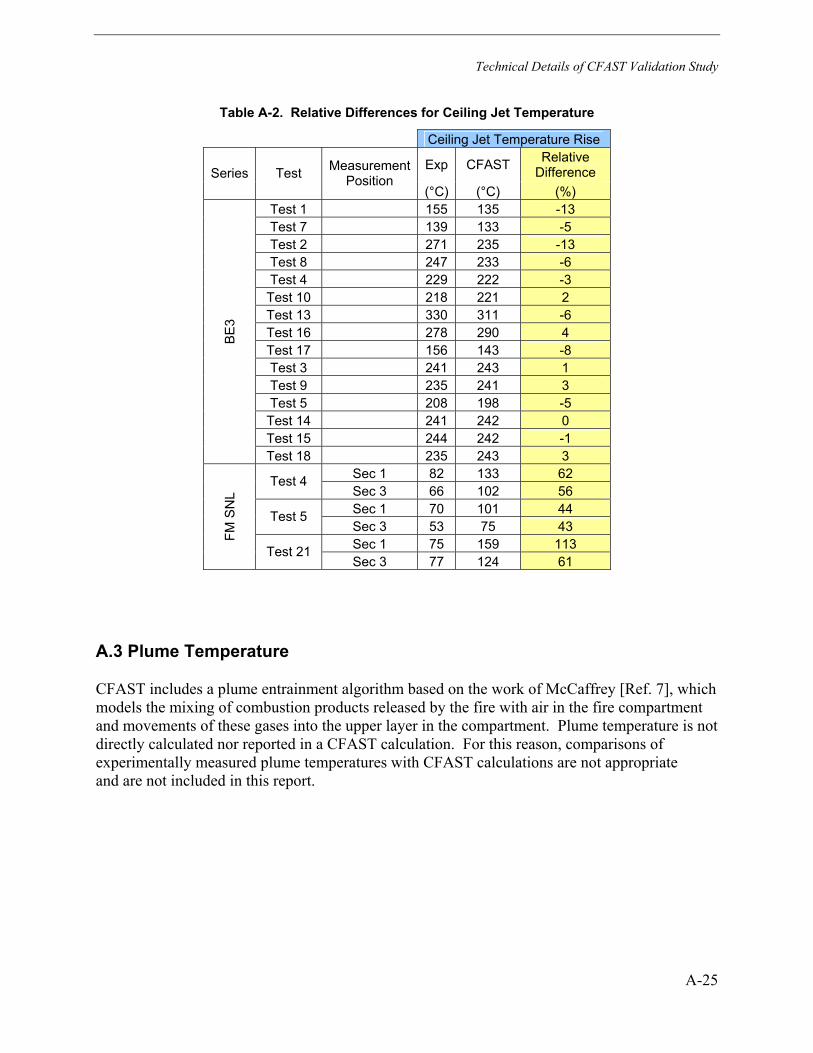
Technical Details of CFAST Validation Study
A-25
Table A-2. Relative Differences for Ceiling Jet Temperature
Ceiling Jet Temperature Rise
Exp CFAST Relative Difference Series Test Measurement
Position (°C) (°C) (%)
Test 1 155 135 -13 Test 7 139 133 -5 Test 2 271 235 -13 Test 8 247 233 -6 Test 4 229 222 -3 Test 10 218 221 2 Test 13 330 311 -6 Test 16 278 290 4 Test 17 156 143 -8 Test 3 241 243 1 Test 9 235 241 3 Test 5 208 198 -5 Test 14 241 242 0 Test 15 244 242 -1
BE
3
Test 18 235 243 3 Sec 1 82 133 62 Test 4 Sec 3 66 102 56 Sec 1 70 101 44 Test 5 Sec 3 53 75 43 Sec 1 75 159 113 FM
SN
L
Test 21 Sec 3 77 124 61
A.3 Plume Temperature
CFAST includes a plume entrainment algorithm based on the work of McCaffrey [Ref. 7], which models the mixing of combustion products released by the fire with air in the fire compartment and movements of these gases into the upper layer in the compartment. Plume temperature is not directly calculated nor reported in a CFAST calculation. For this reason, comparisons of experimentally measured plume temperatures with CFAST calculations are not appropriate and are not included in this report.
Technical Details of CFAST Validation Study
A-26
A.4 Flame Height
Flame height is recorded by visual observations, photographs or video footage. Videos from the ICFMP BE #3 test series and photographs from BE #2 are available. It is difficult to precisely measure the flame height, but the photos and videos allow one to make estimates accurate to within a pan diameter.
ICFMP BE #2
Figure A-22 contains photographs of the actual fire. The height of the visible flame in the photographs has been estimated to be between 2.4 and 3 pan diameters [3.8 m to 4.8 m (12.5 ft to 15.7 ft)]. From the CFAST calculations, the estimated flame height is 4.3 m (14.1 ft).
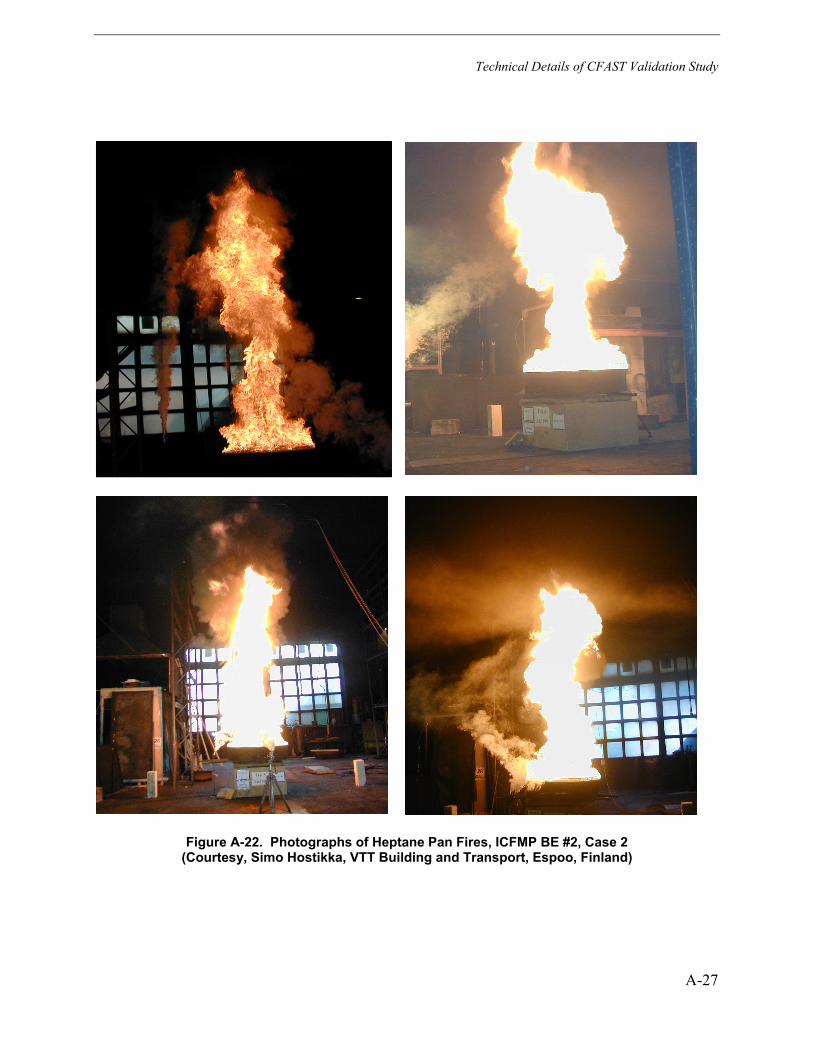
Technical Details of CFAST Validation Study
A-27
Figure A-22. Photographs of Heptane Pan Fires, ICFMP BE #2, Case 2 (Courtesy, Simo Hostikka, VTT Building and Transport, Espoo, Finland)
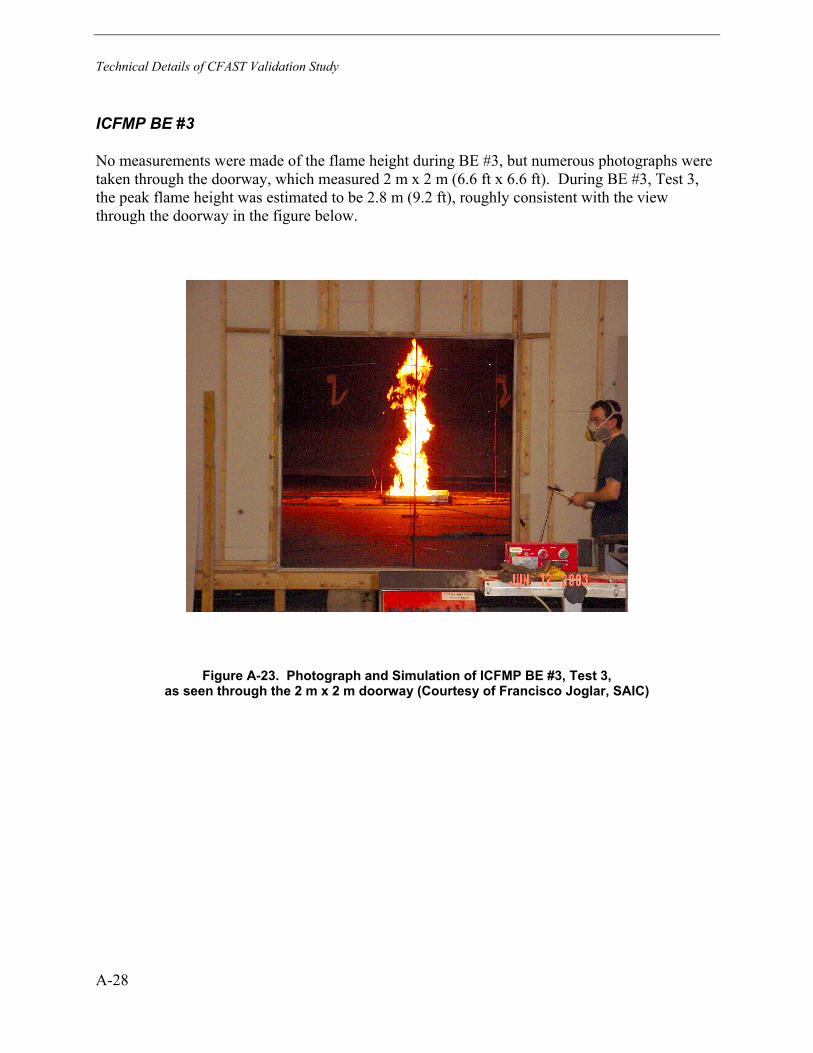
Technical Details of CFAST Validation Study
A-28
ICFMP BE #3
No measurements were made of the flame height during BE #3, but numerous photographs were taken through the doorway, which measured 2 m x 2 m (6.6 ft x 6.6 ft). During BE #3, Test 3, the peak flame height was estimated to be 2.8 m (9.2 ft), roughly consistent with the view through the doorway in the figure below.
Figure A-23. Photograph and Simulation of ICFMP BE #3, Test 3, as seen through the 2 m x 2 m doorway (Courtesy of Francisco Joglar, SAIC)
Technical Details of CFAST Validation Study
A-29
A.5 Oxygen Concentration
CFAST simulates a fire as a mass of fuel that burns at a prescribed “pyrolysis” rate and releases both energy and combustion products. CFAST calculates species production based on user-defined production yields, and both the pyrolysis rate and the resulting energy and species generation may be limited by the oxygen available for combustion. When sufficient oxygen is available for combustion, the heat release rate (HRR) for a constrained fire is the same as for an unconstrained fire. Mass and species concentrations are tracked by the model as gases flow through openings in a structure to other compartments in the structure or to the outdoors.
The following pages present comparisons of oxygen and carbon dioxide concentration predictions with measurement for BE #3 and BE #5. In BE #3, there were two oxygen measurements, one in the upper layer, one in the lower layer. There was only one carbon dioxide measurement in the upper layer. For BE #5, Test 4, a plot of upper-layer oxygen and carbon dioxide is included along with the results for BE #3.
Not surprisingly, the accuracy of the gas species predictions is comparable to that of the HGL temperature. After all, CFAST uses the same basic algorithm for transport, regardless of whether it is the transport of heat or mass.
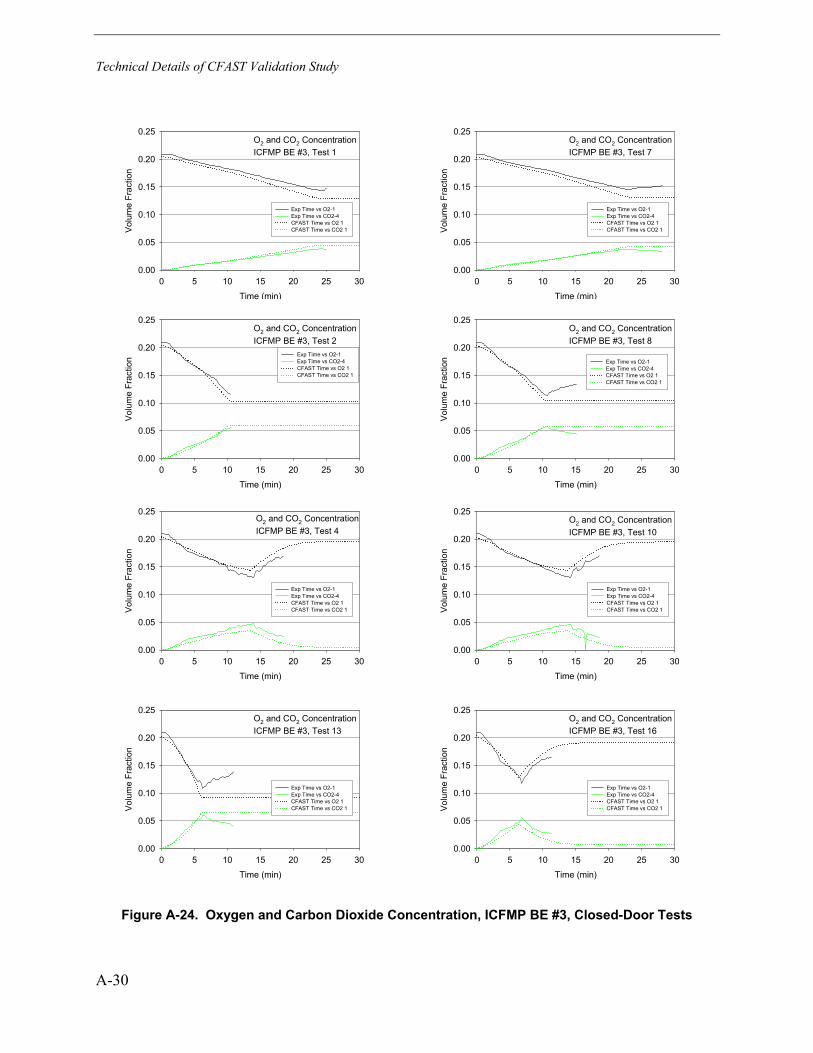
Technical Details of CFAST Validation Study
A-30
O2 and CO2 ConcentrationICFMP BE #3, Test 1
Time (min)
0 5 10 15 20 25 30
Volu
me
Frac
tion
0.00
0.05
0.10
0.15
0.20
0.25
Exp Time vs O2-1 Exp Time vs CO2-4 CFAST Time vs O2 1 CFAST Time vs CO2 1
O2 and CO2 ConcentrationICFMP BE #3, Test 7
Time (min)
0 5 10 15 20 25 30
Volu
me
Frac
tion
0.00
0.05
0.10
0.15
0.20
0.25
Exp Time vs O2-1 Exp Time vs CO2-4 CFAST Time vs O2 1 CFAST Time vs CO2 1
O2 and CO2 ConcentrationICFMP BE #3, Test 2
Time (min)
0 5 10 15 20 25 30
Vol
ume
Frac
tion
0.00
0.05
0.10
0.15
0.20
0.25
Exp Time vs O2-1 Exp Time vs CO2-4 CFAST Time vs O2 1 CFAST Time vs CO2 1
O2 and CO2 ConcentrationICFMP BE #3, Test 8
Time (min)
0 5 10 15 20 25 30
Vol
ume
Frac
tion
0.00
0.05
0.10
0.15
0.20
0.25
Exp Time vs O2-1 Exp Time vs CO2-4 CFAST Time vs O2 1 CFAST Time vs CO2 1
O2 and CO2 ConcentrationICFMP BE #3, Test 4
Time (min)
0 5 10 15 20 25 30
Vol
ume
Frac
tion
0.00
0.05
0.10
0.15
0.20
0.25
Exp Time vs O2-1 Exp Time vs CO2-4 CFAST Time vs O2 1 CFAST Time vs CO2 1
O2 and CO2 ConcentrationICFMP BE #3, Test 10
Time (min)
0 5 10 15 20 25 30
Vol
ume
Frac
tion
0.00
0.05
0.10
0.15
0.20
0.25
Exp Time vs O2-1 Exp Time vs CO2-4 CFAST Time vs O2 1 CFAST Time vs CO2 1
O2 and CO2 ConcentrationICFMP BE #3, Test 13
Time (min)
0 5 10 15 20 25 30
Volu
me
Frac
tion
0.00
0.05
0.10
0.15
0.20
0.25
Exp Time vs O2-1 Exp Time vs CO2-4 CFAST Time vs O2 1 CFAST Time vs CO2 1
O2 and CO2 ConcentrationICFMP BE #3, Test 16
Time (min)
0 5 10 15 20 25 30
Volu
me
Frac
tion
0.00
0.05
0.10
0.15
0.20
0.25
Exp Time vs O2-1 Exp Time vs CO2-4 CFAST Time vs O2 1 CFAST Time vs CO2 1
Figure A-24. Oxygen and Carbon Dioxide Concentration, ICFMP BE #3, Closed-Door Tests
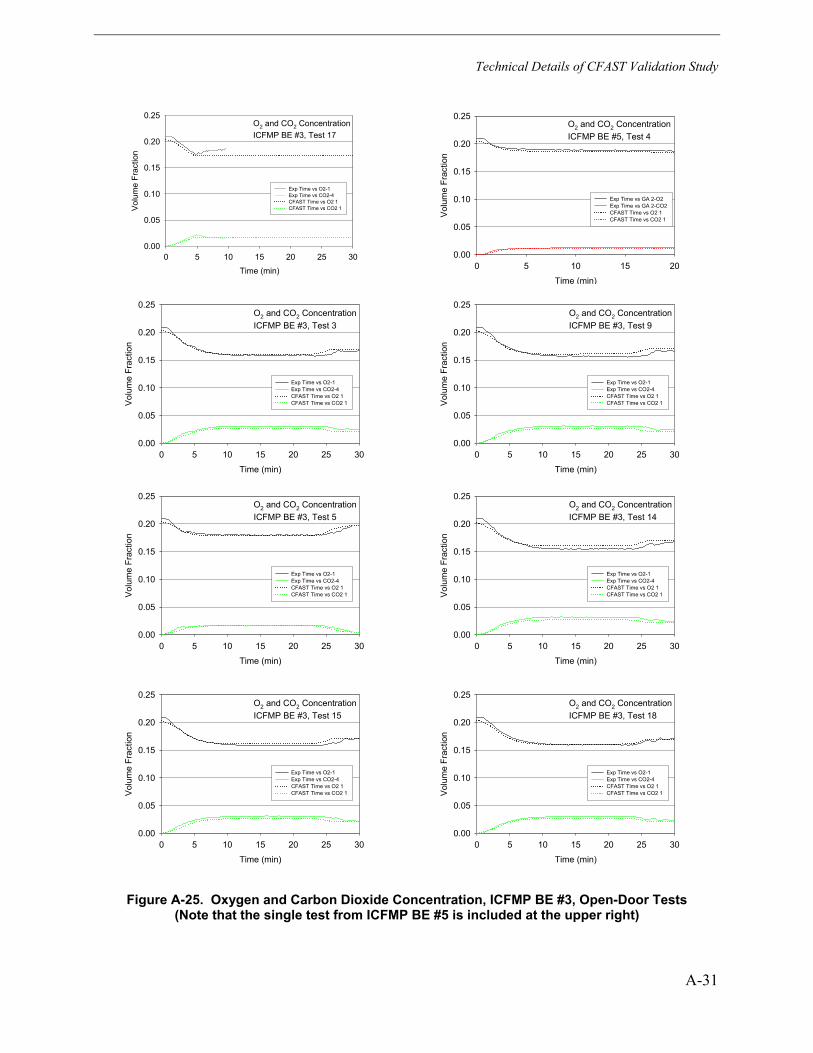
Technical Details of CFAST Validation Study
A-31
O2 and CO2 ConcentrationICFMP BE #3, Test 17
Time (min)
0 5 10 15 20 25 30
Volu
me
Frac
tion
0.00
0.05
0.10
0.15
0.20
0.25
Exp Time vs O2-1 Exp Time vs CO2-4 CFAST Time vs O2 1 CFAST Time vs CO2 1
O2 and CO2 ConcentrationICFMP BE #5, Test 4
Time (min)
0 5 10 15 20
Vol
ume
Frac
tion
0.00
0.05
0.10
0.15
0.20
0.25
Exp Time vs GA 2-O2 Exp Time vs GA 2-CO2 CFAST Time vs O2 1 CFAST Time vs CO2 1
O2 and CO2 ConcentrationICFMP BE #3, Test 3
Time (min)
0 5 10 15 20 25 30
Vol
ume
Frac
tion
0.00
0.05
0.10
0.15
0.20
0.25
Exp Time vs O2-1 Exp Time vs CO2-4 CFAST Time vs O2 1 CFAST Time vs CO2 1
O2 and CO2 ConcentrationICFMP BE #3, Test 9
Time (min)
0 5 10 15 20 25 30V
olum
e Fr
actio
n0.00
0.05
0.10
0.15
0.20
0.25
Exp Time vs O2-1 Exp Time vs CO2-4 CFAST Time vs O2 1 CFAST Time vs CO2 1
O2 and CO2 ConcentrationICFMP BE #3, Test 5
Time (min)
0 5 10 15 20 25 30
Vol
ume
Frac
tion
0.00
0.05
0.10
0.15
0.20
0.25
Exp Time vs O2-1 Exp Time vs CO2-4 CFAST Time vs O2 1 CFAST Time vs CO2 1
O2 and CO2 ConcentrationICFMP BE #3, Test 14
Time (min)
0 5 10 15 20 25 30
Vol
ume
Frac
tion
0.00
0.05
0.10
0.15
0.20
0.25
Exp Time vs O2-1 Exp Time vs CO2-4 CFAST Time vs O2 1 CFAST Time vs CO2 1
O2 and CO2 ConcentrationICFMP BE #3, Test 15
Time (min)
0 5 10 15 20 25 30
Vol
ume
Frac
tion
0.00
0.05
0.10
0.15
0.20
0.25
Exp Time vs O2-1 Exp Time vs CO2-4 CFAST Time vs O2 1 CFAST Time vs CO2 1
O2 and CO2 ConcentrationICFMP BE #3, Test 18
Time (min)
0 5 10 15 20 25 30
Vol
ume
Frac
tion
0.00
0.05
0.10
0.15
0.20
0.25
Exp Time vs O2-1 Exp Time vs CO2-4 CFAST Time vs O2 1 CFAST Time vs CO2 1
Figure A-25. Oxygen and Carbon Dioxide Concentration, ICFMP BE #3, Open-Door Tests (Note that the single test from ICFMP BE #5 is included at the upper right)
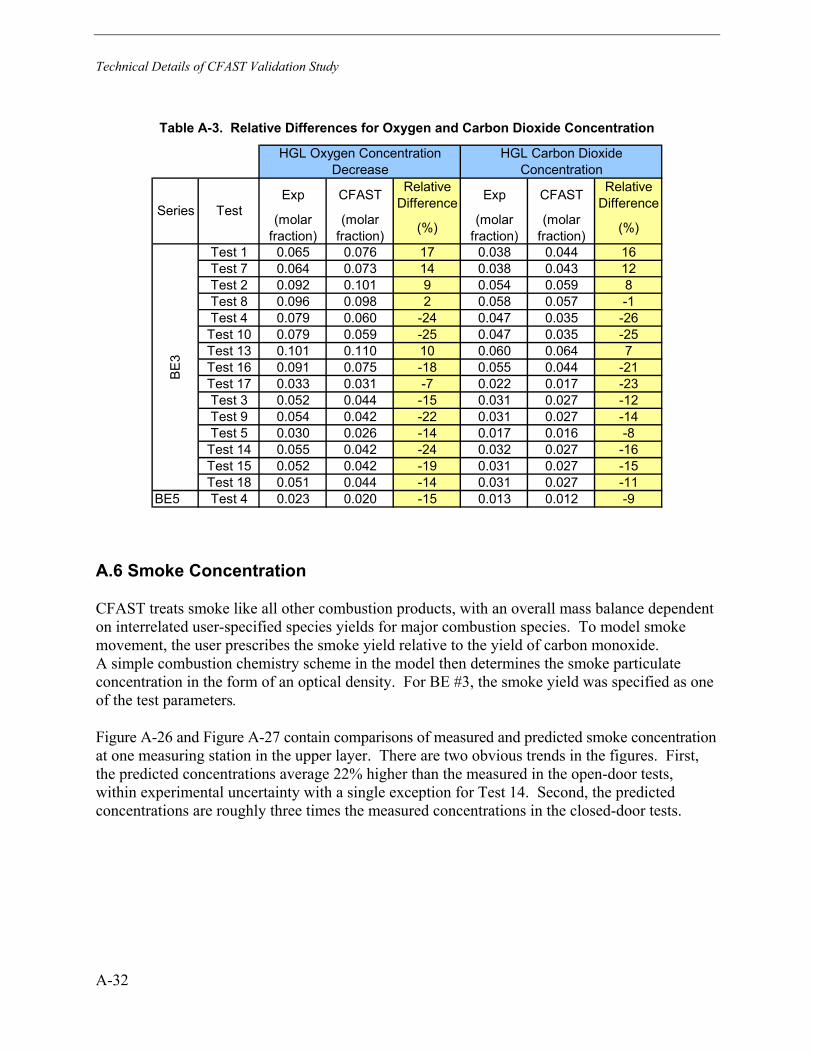
Technical Details of CFAST Validation Study
A-32
Table A-3. Relative Differences for Oxygen and Carbon Dioxide Concentration
Exp CFAST Relative Difference Exp CFAST Relative
Difference(molar
fraction)(molar
fraction) (%) (molar fraction)
(molar fraction) (%)
Test 1 0.065 0.076 17 0.038 0.044 16Test 7 0.064 0.073 14 0.038 0.043 12Test 2 0.092 0.101 9 0.054 0.059 8Test 8 0.096 0.098 2 0.058 0.057 -1Test 4 0.079 0.060 -24 0.047 0.035 -26Test 10 0.079 0.059 -25 0.047 0.035 -25Test 13 0.101 0.110 10 0.060 0.064 7Test 16 0.091 0.075 -18 0.055 0.044 -21Test 17 0.033 0.031 -7 0.022 0.017 -23Test 3 0.052 0.044 -15 0.031 0.027 -12Test 9 0.054 0.042 -22 0.031 0.027 -14Test 5 0.030 0.026 -14 0.017 0.016 -8Test 14 0.055 0.042 -24 0.032 0.027 -16Test 15 0.052 0.042 -19 0.031 0.027 -15Test 18 0.051 0.044 -14 0.031 0.027 -11
BE5 Test 4 0.023 0.020 -15 0.013 0.012 -9
HGL Oxygen Concentration Decrease
HGL Carbon Dioxide Concentration
BE3
Series Test
A.6 Smoke Concentration
CFAST treats smoke like all other combustion products, with an overall mass balance dependent on interrelated user-specified species yields for major combustion species. To model smoke movement, the user prescribes the smoke yield relative to the yield of carbon monoxide. A simple combustion chemistry scheme in the model then determines the smoke particulate concentration in the form of an optical density. For BE #3, the smoke yield was specified as one of the test parameters.
Figure A-26 and Figure A-27 contain comparisons of measured and predicted smoke concentration at one measuring station in the upper layer. There are two obvious trends in the figures. First, the predicted concentrations average 22% higher than the measured in the open-door tests, within experimental uncertainty with a single exception for Test 14. Second, the predicted concentrations are roughly three times the measured concentrations in the closed-door tests.
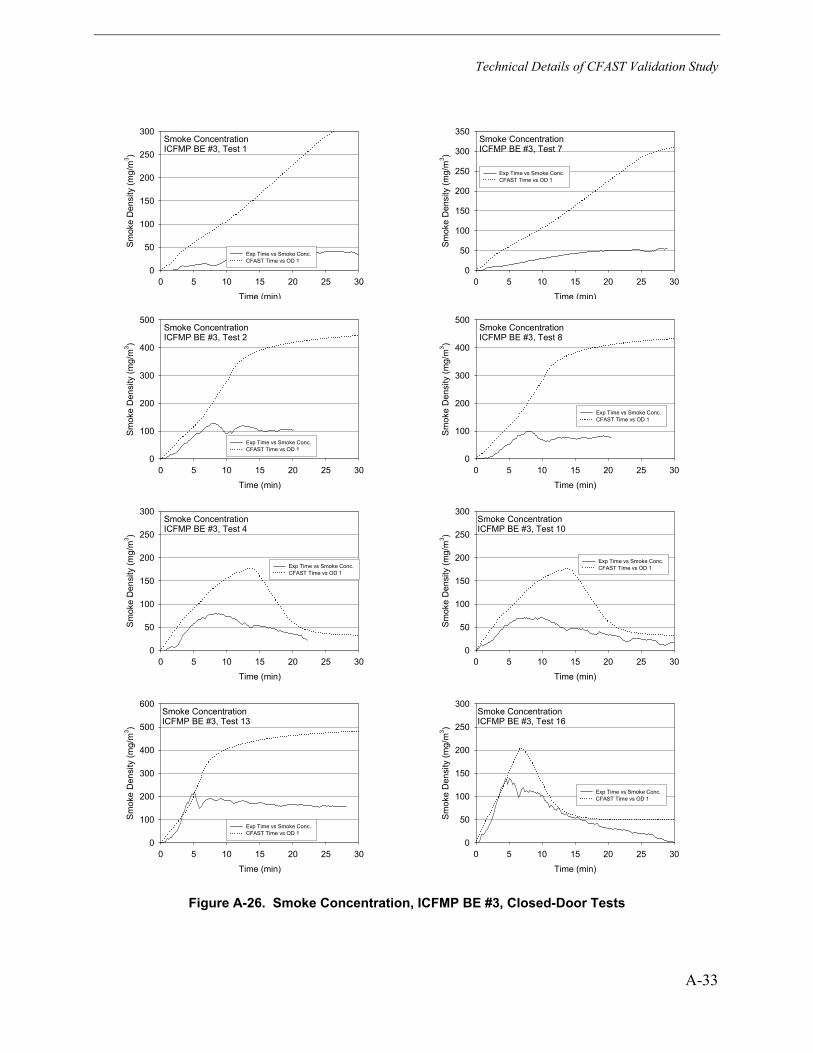
Technical Details of CFAST Validation Study
A-33
Smoke ConcentrationICFMP BE #3, Test 1
Time (min)
0 5 10 15 20 25 30
Sm
oke
Den
sity
(mg/
m3 )
0
50
100
150
200
250
300
Exp Time vs Smoke Conc. CFAST Time vs OD 1
Smoke ConcentrationICFMP BE #3, Test 7
Time (min)
0 5 10 15 20 25 30
Sm
oke
Den
sity
(mg/
m3 )
0
50
100
150
200
250
300
350
Exp Time vs Smoke Conc. CFAST Time vs OD 1
Smoke ConcentrationICFMP BE #3, Test 2
Time (min)
0 5 10 15 20 25 30
Sm
oke
Den
sity
(mg/
m3 )
0
100
200
300
400
500
Exp Time vs Smoke Conc. CFAST Time vs OD 1
Smoke ConcentrationICFMP BE #3, Test 8
Time (min)
0 5 10 15 20 25 30
Sm
oke
Den
sity
(mg/
m3 )
0
100
200
300
400
500
Exp Time vs Smoke Conc. CFAST Time vs OD 1
Smoke ConcentrationICFMP BE #3, Test 4
Time (min)
0 5 10 15 20 25 30
Sm
oke
Den
sity
(mg/
m3 )
0
50
100
150
200
250
300
Exp Time vs Smoke Conc. CFAST Time vs OD 1
Smoke ConcentrationICFMP BE #3, Test 10
Time (min)
0 5 10 15 20 25 30
Sm
oke
Den
sity
(mg/
m3 )
0
50
100
150
200
250
300
Exp Time vs Smoke Conc. CFAST Time vs OD 1
Smoke ConcentrationICFMP BE #3, Test 13
Time (min)
0 5 10 15 20 25 30
Sm
oke
Den
sity
(mg/
m3 )
0
100
200
300
400
500
600
Exp Time vs Smoke Conc. CFAST Time vs OD 1
Smoke ConcentrationICFMP BE #3, Test 16
Time (min)
0 5 10 15 20 25 30
Sm
oke
Den
sity
(mg/
m3 )
0
50
100
150
200
250
300
Exp Time vs Smoke Conc. CFAST Time vs OD 1
Figure A-26. Smoke Concentration, ICFMP BE #3, Closed-Door Tests
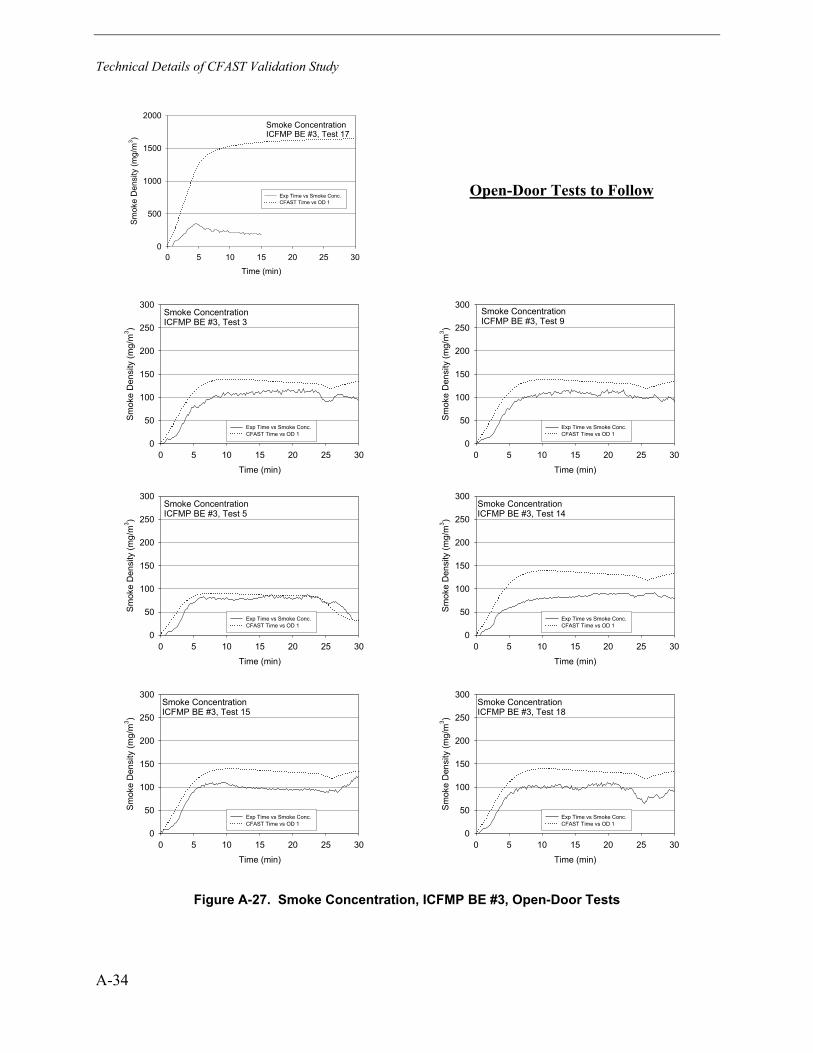
Technical Details of CFAST Validation Study
A-34
Smoke ConcentrationICFMP BE #3, Test 17
Time (min)
0 5 10 15 20 25 30
Sm
oke
Den
sity
(mg/
m3 )
0
500
1000
1500
2000
Exp Time vs Smoke Conc. CFAST Time vs OD 1
Open-Door Tests to Follow
Smoke ConcentrationICFMP BE #3, Test 3
Time (min)
0 5 10 15 20 25 30
Sm
oke
Den
sity
(mg/
m3 )
0
50
100
150
200
250
300
Exp Time vs Smoke Conc. CFAST Time vs OD 1
Smoke ConcentrationICFMP BE #3, Test 9
Time (min)
0 5 10 15 20 25 30S
mok
e D
ensi
ty (m
g/m
3 )0
50
100
150
200
250
300
Exp Time vs Smoke Conc. CFAST Time vs OD 1
Smoke ConcentrationICFMP BE #3, Test 5
Time (min)
0 5 10 15 20 25 30
Sm
oke
Den
sity
(mg/
m3 )
0
50
100
150
200
250
300
Exp Time vs Smoke Conc. CFAST Time vs OD 1
Smoke ConcentrationICFMP BE #3, Test 14
Time (min)
0 5 10 15 20 25 30
Sm
oke
Den
sity
(mg/
m3 )
0
50
100
150
200
250
300
Exp Time vs Smoke Conc. CFAST Time vs OD 1
Smoke ConcentrationICFMP BE #3, Test 15
Time (min)
0 5 10 15 20 25 30
Sm
oke
Den
sity
(mg/
m3 )
0
50
100
150
200
250
300
Exp Time vs Smoke Conc. CFAST Time vs OD 1
Smoke ConcentrationICFMP BE #3, Test 18
Time (min)
0 5 10 15 20 25 30
Sm
oke
Den
sity
(mg/
m3 )
0
50
100
150
200
250
300
Exp Time vs Smoke Conc. CFAST Time vs OD 1
Figure A-27. Smoke Concentration, ICFMP BE #3, Open-Door Tests
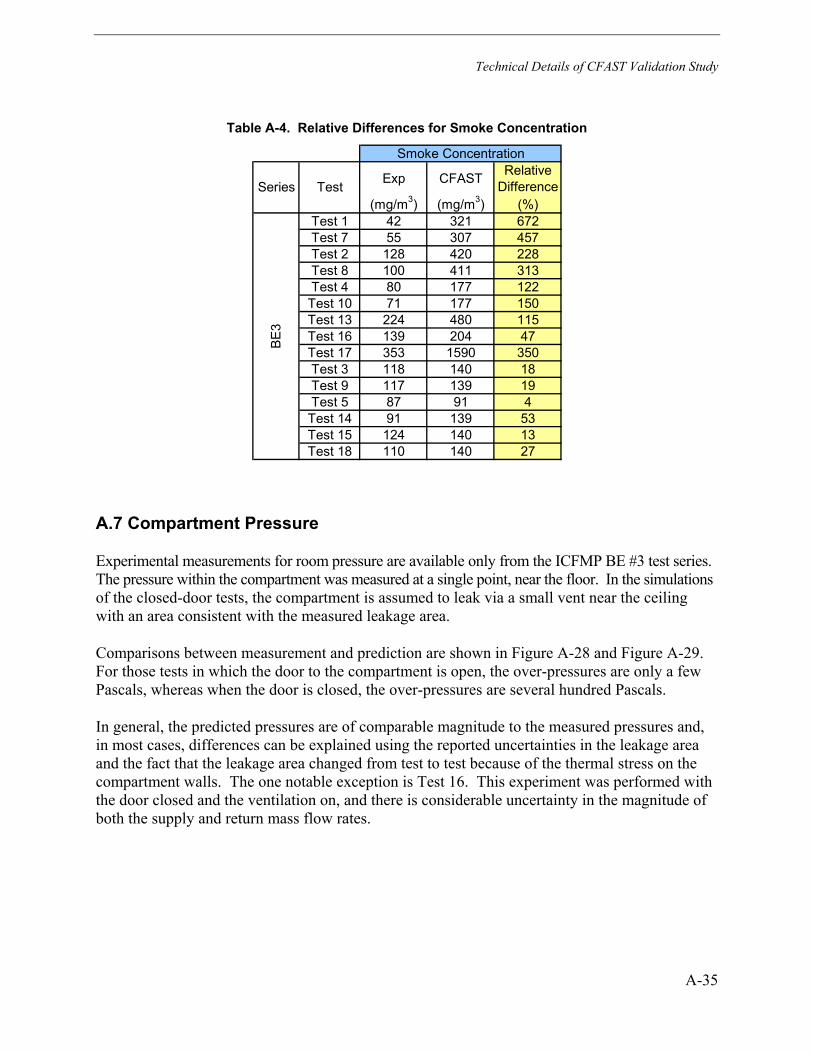
Technical Details of CFAST Validation Study
A-35
Table A-4. Relative Differences for Smoke Concentration
Exp CFAST Relative Difference
(mg/m3) (mg/m3) (%)Test 1 42 321 672Test 7 55 307 457Test 2 128 420 228Test 8 100 411 313Test 4 80 177 122Test 10 71 177 150Test 13 224 480 115Test 16 139 204 47Test 17 353 1590 350Test 3 118 140 18Test 9 117 139 19Test 5 87 91 4Test 14 91 139 53Test 15 124 140 13Test 18 110 140 27
Smoke Concentration
BE3
Series Test
A.7 Compartment Pressure
Experimental measurements for room pressure are available only from the ICFMP BE #3 test series. The pressure within the compartment was measured at a single point, near the floor. In the simulations of the closed-door tests, the compartment is assumed to leak via a small vent near the ceiling with an area consistent with the measured leakage area.
Comparisons between measurement and prediction are shown in Figure A-28 and Figure A-29. For those tests in which the door to the compartment is open, the over-pressures are only a few Pascals, whereas when the door is closed, the over-pressures are several hundred Pascals.
In general, the predicted pressures are of comparable magnitude to the measured pressures and, in most cases, differences can be explained using the reported uncertainties in the leakage area and the fact that the leakage area changed from test to test because of the thermal stress on the compartment walls. The one notable exception is Test 16. This experiment was performed with the door closed and the ventilation on, and there is considerable uncertainty in the magnitude of both the supply and return mass flow rates.
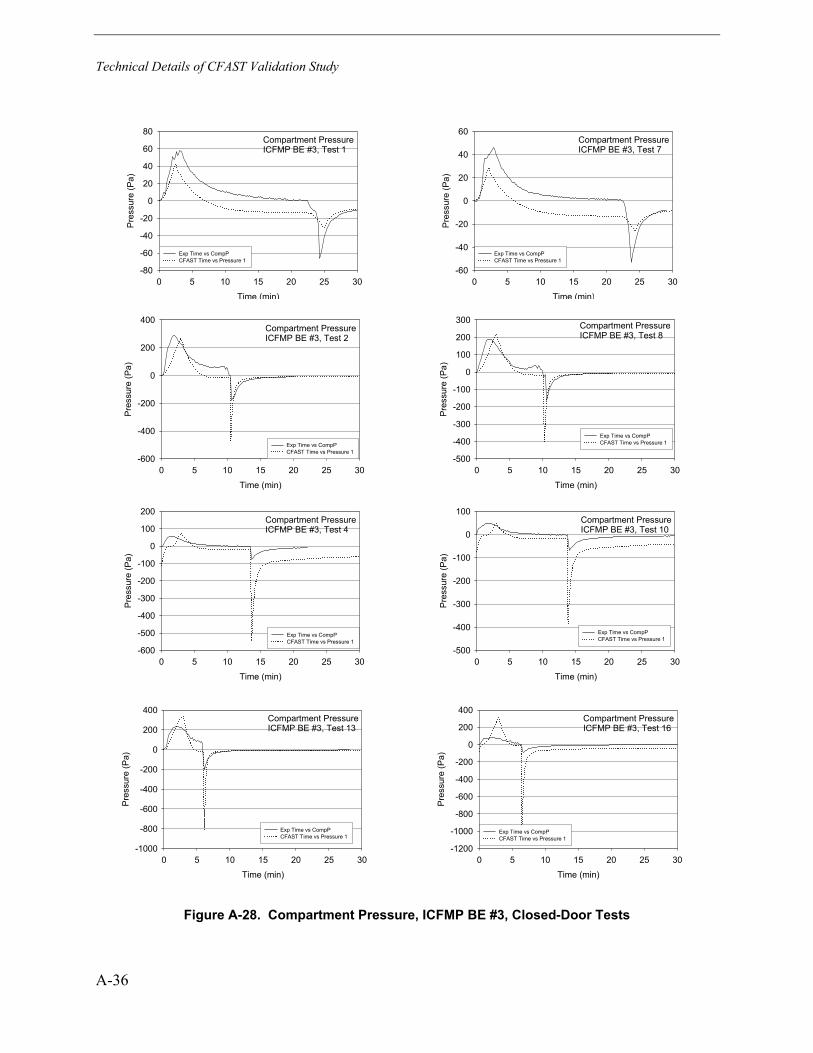
Technical Details of CFAST Validation Study
A-36
Compartment PressureICFMP BE #3, Test 1
Time (min)
0 5 10 15 20 25 30
Pre
ssur
e (P
a)
-80
-60
-40
-20
0
20
40
60
80
Exp Time vs CompP CFAST Time vs Pressure 1
Compartment PressureICFMP BE #3, Test 7
Time (min)
0 5 10 15 20 25 30
Pre
ssur
e (P
a)
-60
-40
-20
0
20
40
60
Exp Time vs CompP CFAST Time vs Pressure 1
Compartment PressureICFMP BE #3, Test 2
Time (min)
0 5 10 15 20 25 30
Pre
ssur
e (P
a)
-600
-400
-200
0
200
400
Exp Time vs CompP CFAST Time vs Pressure 1
Compartment PressureICFMP BE #3, Test 8
Time (min)
0 5 10 15 20 25 30
Pre
ssur
e (P
a)
-500
-400
-300
-200
-100
0
100
200
300
Exp Time vs CompP CFAST Time vs Pressure 1
Compartment PressureICFMP BE #3, Test 4
Time (min)
0 5 10 15 20 25 30
Pre
ssur
e (P
a)
-600
-500
-400
-300
-200
-100
0
100
200
Exp Time vs CompP CFAST Time vs Pressure 1
Compartment PressureICFMP BE #3, Test 10
Time (min)
0 5 10 15 20 25 30
Pre
ssur
e (P
a)
-500
-400
-300
-200
-100
0
100
Exp Time vs CompP CFAST Time vs Pressure 1
Compartment PressureICFMP BE #3, Test 13
Time (min)
0 5 10 15 20 25 30
Pre
ssur
e (P
a)
-1000
-800
-600
-400
-200
0
200
400
Exp Time vs CompP CFAST Time vs Pressure 1
Compartment PressureICFMP BE #3, Test 16
Time (min)
0 5 10 15 20 25 30
Pre
ssur
e (P
a)
-1200
-1000
-800
-600
-400
-200
0
200
400
Exp Time vs CompP CFAST Time vs Pressure 1
Figure A-28. Compartment Pressure, ICFMP BE #3, Closed-Door Tests
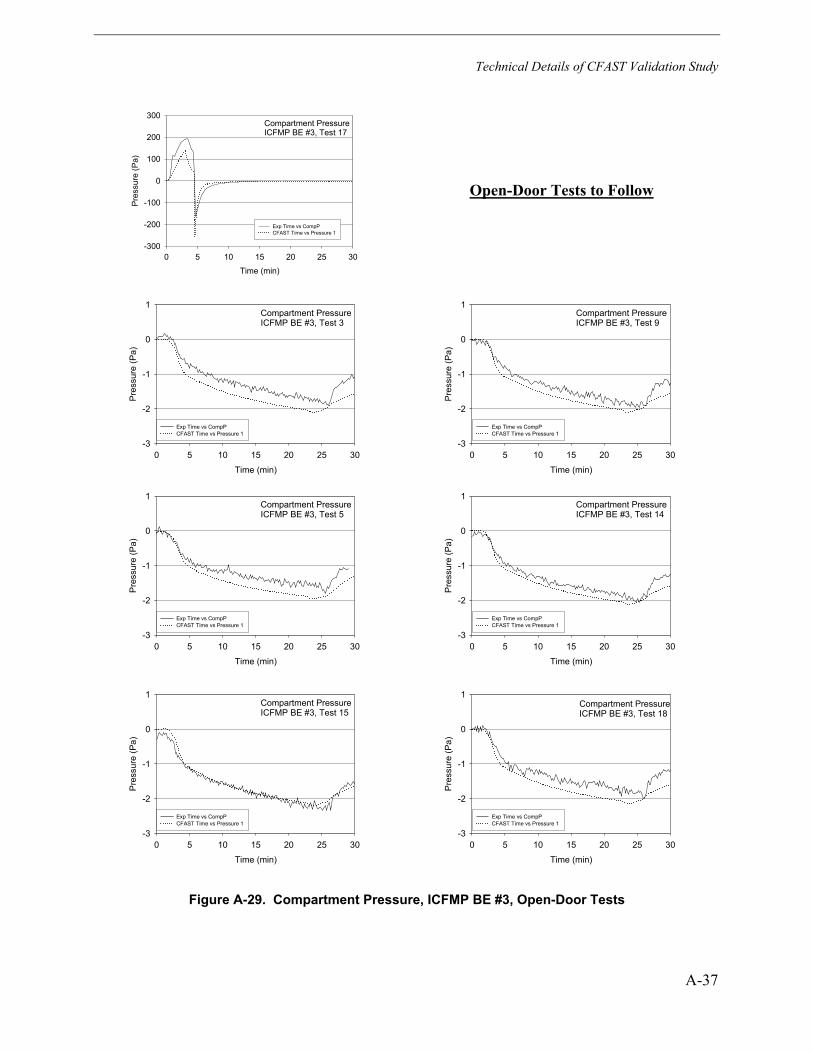
Technical Details of CFAST Validation Study
A-37
Compartment PressureICFMP BE #3, Test 17
Time (min)
0 5 10 15 20 25 30
Pres
sure
(Pa)
-300
-200
-100
0
100
200
300
Exp Time vs CompP CFAST Time vs Pressure 1
Open-Door Tests to Follow
Compartment PressureICFMP BE #3, Test 3
Time (min)
0 5 10 15 20 25 30
Pre
ssur
e (P
a)
-3
-2
-1
0
1
Exp Time vs CompP CFAST Time vs Pressure 1
Compartment PressureICFMP BE #3, Test 9
Time (min)
0 5 10 15 20 25 30P
ress
ure
(Pa)
-3
-2
-1
0
1
Exp Time vs CompP CFAST Time vs Pressure 1
Compartment PressureICFMP BE #3, Test 5
Time (min)
0 5 10 15 20 25 30
Pre
ssur
e (P
a)
-3
-2
-1
0
1
Exp Time vs CompP CFAST Time vs Pressure 1
Compartment PressureICFMP BE #3, Test 14
Time (min)
0 5 10 15 20 25 30
Pre
ssur
e (P
a)
-3
-2
-1
0
1
Exp Time vs CompP CFAST Time vs Pressure 1
Compartment PressureICFMP BE #3, Test 15
Time (min)
0 5 10 15 20 25 30
Pre
ssur
e (P
a)
-3
-2
-1
0
1
Exp Time vs CompP CFAST Time vs Pressure 1
Compartment PressureICFMP BE #3, Test 18
Time (min)
0 5 10 15 20 25 30
Pre
ssur
e (P
a)
-3
-2
-1
0
1
Exp Time vs CompP CFAST Time vs Pressure 1
Figure A-29. Compartment Pressure, ICFMP BE #3, Open-Door Tests
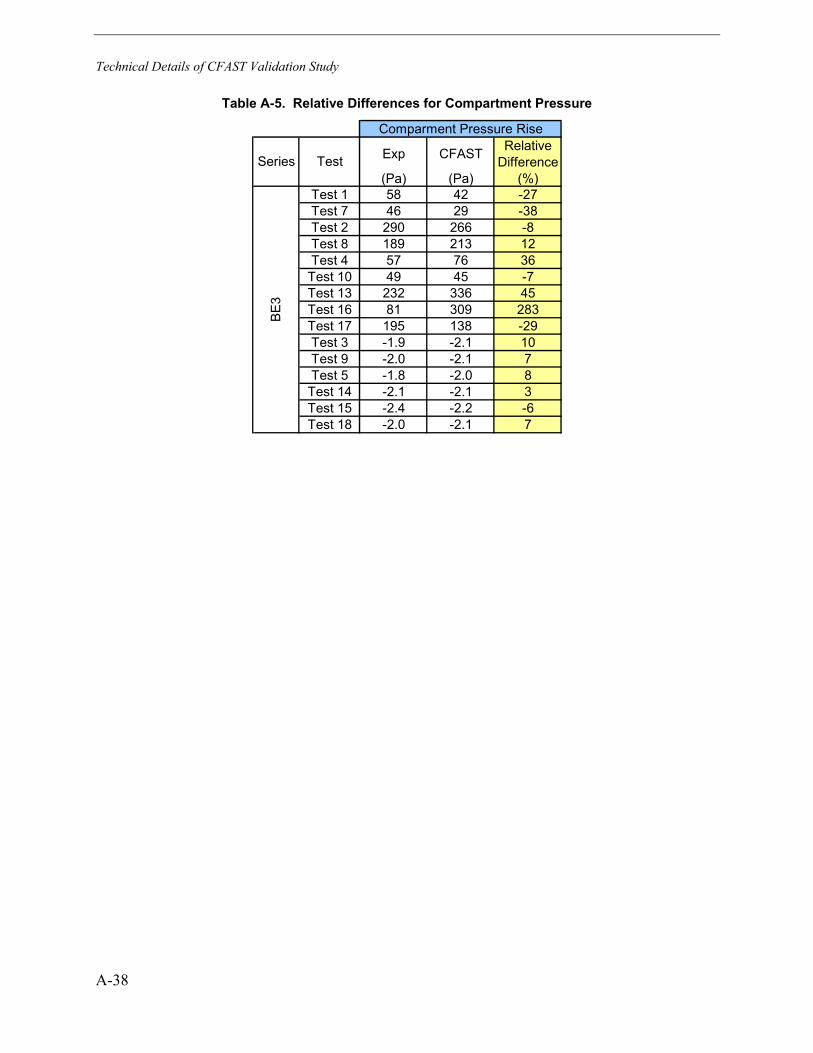
Technical Details of CFAST Validation Study
A-38
Table A-5. Relative Differences for Compartment Pressure
Exp CFAST Relative Difference
(Pa) (Pa) (%)Test 1 58 42 -27Test 7 46 29 -38Test 2 290 266 -8Test 8 189 213 12Test 4 57 76 36Test 10 49 45 -7Test 13 232 336 45Test 16 81 309 283Test 17 195 138 -29Test 3 -1.9 -2.1 10Test 9 -2.0 -2.1 7Test 5 -1.8 -2.0 8Test 14 -2.1 -2.1 3Test 15 -2.4 -2.2 -6Test 18 -2.0 -2.1 7
Comparment Pressure Rise
BE3
Series Test
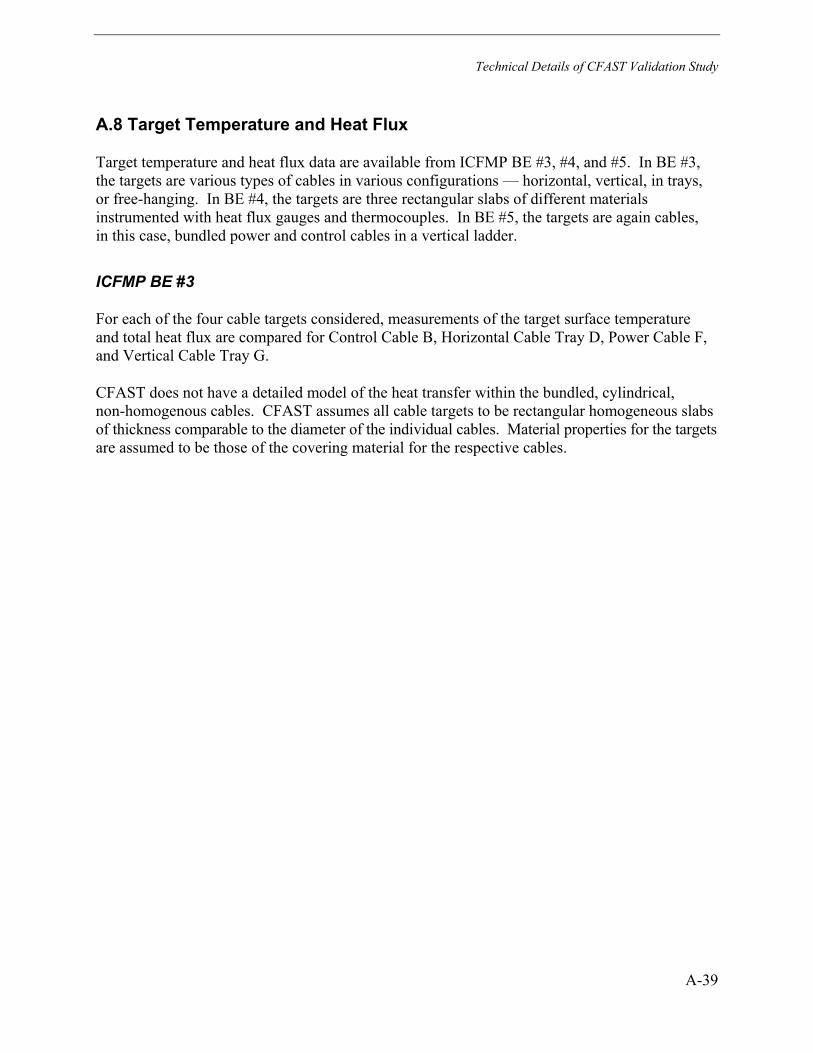
Technical Details of CFAST Validation Study
A-39
A.8 Target Temperature and Heat Flux
Target temperature and heat flux data are available from ICFMP BE #3, #4, and #5. In BE #3, the targets are various types of cables in various configurations — horizontal, vertical, in trays, or free-hanging. In BE #4, the targets are three rectangular slabs of different materials instrumented with heat flux gauges and thermocouples. In BE #5, the targets are again cables, in this case, bundled power and control cables in a vertical ladder.
ICFMP BE #3
For each of the four cable targets considered, measurements of the target surface temperature and total heat flux are compared for Control Cable B, Horizontal Cable Tray D, Power Cable F, and Vertical Cable Tray G.
CFAST does not have a detailed model of the heat transfer within the bundled, cylindrical, non-homogenous cables. CFAST assumes all cable targets to be rectangular homogeneous slabs of thickness comparable to the diameter of the individual cables. Material properties for the targets are assumed to be those of the covering material for the respective cables.
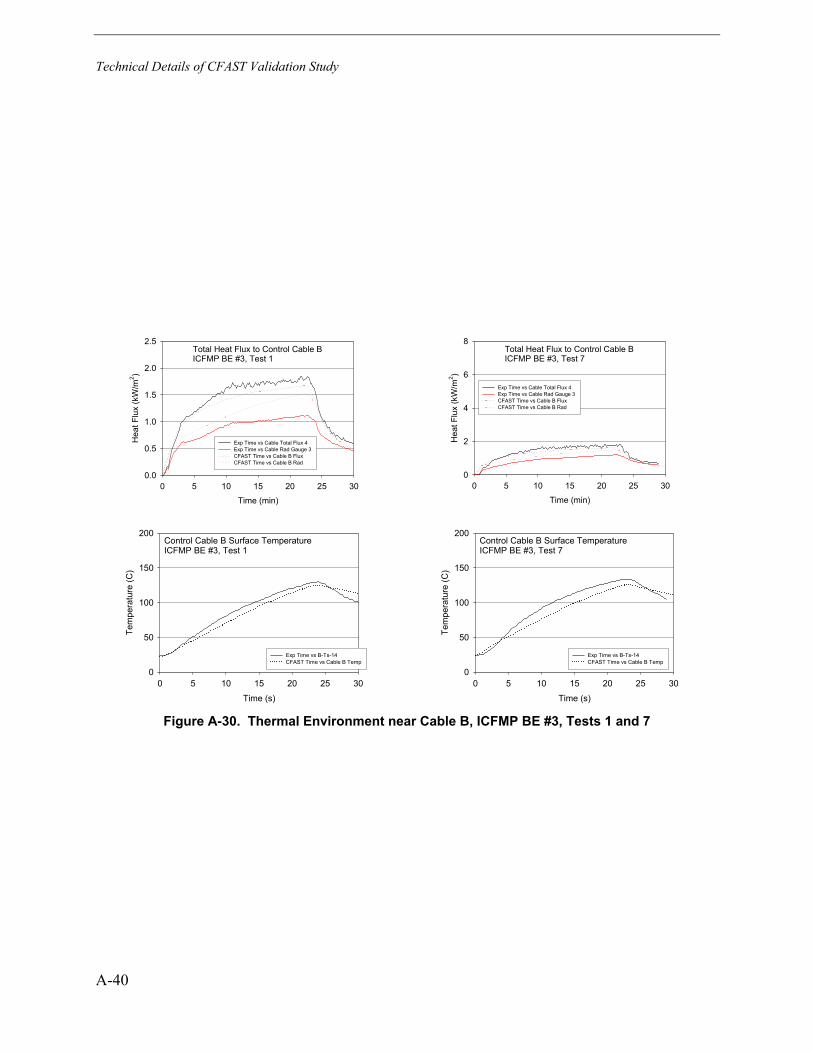
Technical Details of CFAST Validation Study
A-40
Total Heat Flux to Control Cable BICFMP BE #3, Test 1
Time (min)
0 5 10 15 20 25 30
Hea
t Flu
x (k
W/m
2 )
0.0
0.5
1.0
1.5
2.0
2.5
Exp Time vs Cable Total Flux 4 Exp Time vs Cable Rad Gauge 3 CFAST Time vs Cable B Flux CFAST Time vs Cable B Rad
Total Heat Flux to Control Cable BICFMP BE #3, Test 7
Time (min)
0 5 10 15 20 25 30
Hea
t Flu
x (k
W/m
2 )
0
2
4
6
8
Exp Time vs Cable Total Flux 4 Exp Time vs Cable Rad Gauge 3 CFAST Time vs Cable B Flux CFAST Time vs Cable B Rad
Control Cable B Surface TemperatureICFMP BE #3, Test 1
Time (s)
0 5 10 15 20 25 30
Tem
pera
ture
(C)
0
50
100
150
200
Exp Time vs B-Ts-14 CFAST Time vs Cable B Temp
Control Cable B Surface TemperatureICFMP BE #3, Test 7
Time (s)
0 5 10 15 20 25 30
Tem
pera
ture
(C)
0
50
100
150
200
Exp Time vs B-Ts-14 CFAST Time vs Cable B Temp
Figure A-30. Thermal Environment near Cable B, ICFMP BE #3, Tests 1 and 7
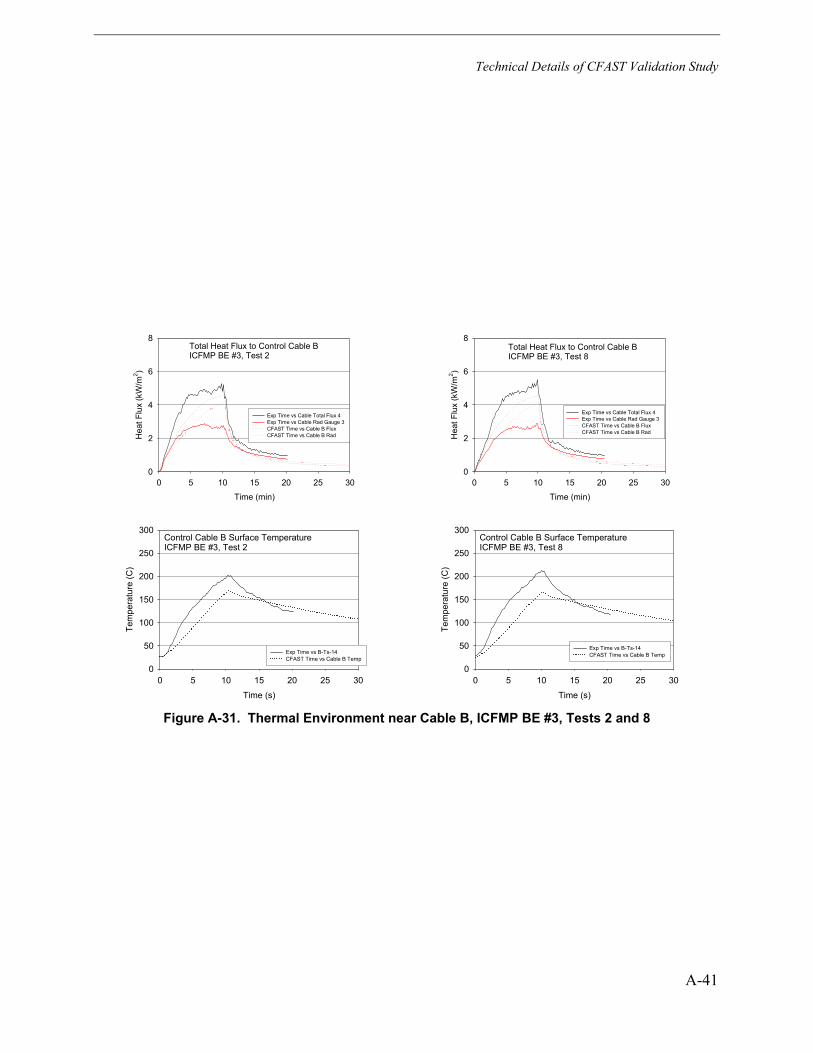
Technical Details of CFAST Validation Study
A-41
Total Heat Flux to Control Cable BICFMP BE #3, Test 2
Time (min)
0 5 10 15 20 25 30
Hea
t Flu
x (k
W/m
2 )
0
2
4
6
8
Exp Time vs Cable Total Flux 4 Exp Time vs Cable Rad Gauge 3 CFAST Time vs Cable B Flux CFAST Time vs Cable B Rad
Total Heat Flux to Control Cable BICFMP BE #3, Test 8
Time (min)
0 5 10 15 20 25 30
Hea
t Flu
x (k
W/m
2 )
0
2
4
6
8
Exp Time vs Cable Total Flux 4 Exp Time vs Cable Rad Gauge 3 CFAST Time vs Cable B Flux CFAST Time vs Cable B Rad
Control Cable B Surface TemperatureICFMP BE #3, Test 2
Time (s)
0 5 10 15 20 25 30
Tem
pera
ture
(C)
0
50
100
150
200
250
300
Exp Time vs B-Ts-14 CFAST Time vs Cable B Temp
Control Cable B Surface TemperatureICFMP BE #3, Test 8
Time (s)
0 5 10 15 20 25 30
Tem
pera
ture
(C)
0
50
100
150
200
250
300
Exp Time vs B-Ts-14 CFAST Time vs Cable B Temp
Figure A-31. Thermal Environment near Cable B, ICFMP BE #3, Tests 2 and 8
Technical Details of CFAST Validation Study
A-42
Total Heat Flux to Control Cable BICFMP BE #3, Test 4
Time (min)
0 5 10 15 20 25 30
Hea
t Flu
x (k
W/m
2 )
0
2
4
6
8
Exp Time vs Cable Total Flux 4 Exp Time vs Cable Rad Gauge 3 CFAST Time vs Cable B Flux CFAST Time vs Cable B Rad
Total Heat Flux to Control Cable BICFMP BE #3, Test 10
Time (min)
0 5 10 15 20 25 30
Hea
t Flu
x (k
W/m
2 )
0
2
4
6
8
Exp Time vs Cable Total Flux 4 Exp Time vs Cable Rad Gauge 3 CFAST Time vs Cable B Flux CFAST Time vs Cable B Rad
Control Cable B Surface TemperatureICFMP BE #3, Test 4
Time (s)
0 5 10 15 20 25 30
Tem
pera
ture
(C)
0
50
100
150
200
250
300
Exp Time vs B-Ts-14 CFAST Time vs Cable B Temp
Control Cable B Surface TemperatureICFMP BE #3, Test 10
Time (s)
0 5 10 15 20 25 30
Tem
pera
ture
(C)
0
50
100
150
200
250
300
Exp Time vs B-Ts-14 CFAST Time vs Cable B Temp
Figure A-32. Thermal Environment near Cable B, ICFMP BE #3, Tests 4 and 10
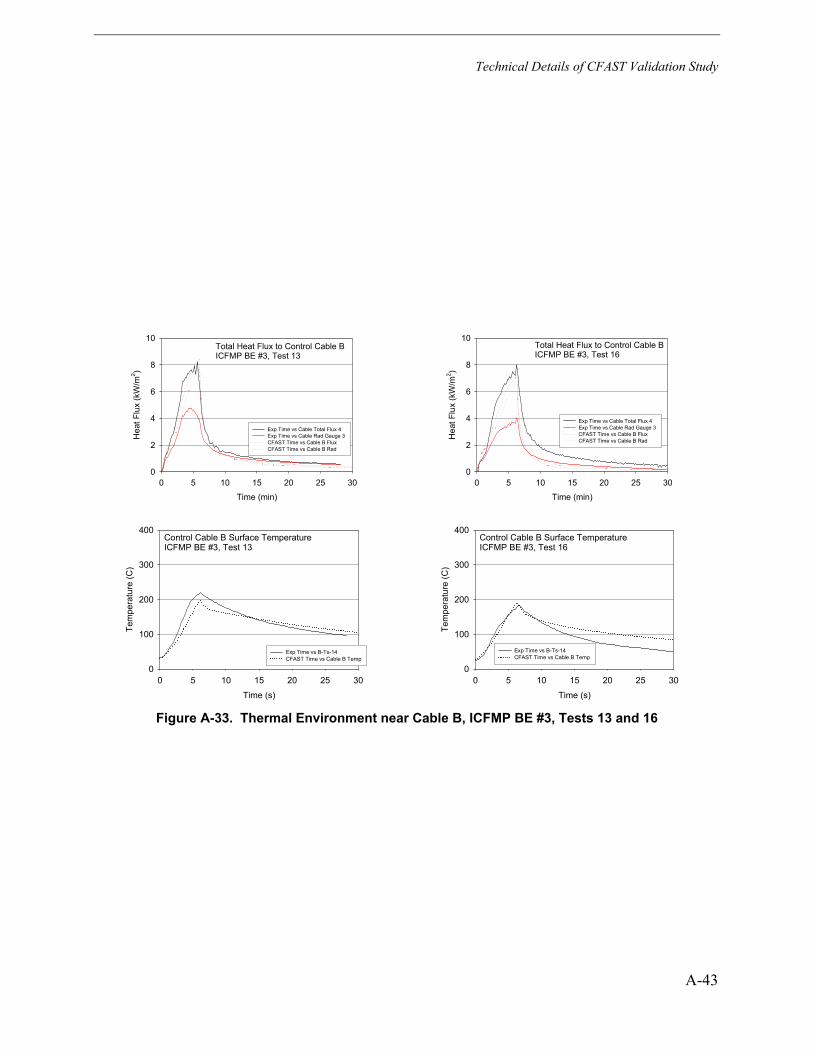
Technical Details of CFAST Validation Study
A-43
Total Heat Flux to Control Cable BICFMP BE #3, Test 13
Time (min)
0 5 10 15 20 25 30
Hea
t Flu
x (k
W/m
2 )
0
2
4
6
8
10
Exp Time vs Cable Total Flux 4 Exp Time vs Cable Rad Gauge 3 CFAST Time vs Cable B Flux CFAST Time vs Cable B Rad
Total Heat Flux to Control Cable BICFMP BE #3, Test 16
Time (min)
0 5 10 15 20 25 30
Hea
t Flu
x (k
W/m
2 )
0
2
4
6
8
10
Exp Time vs Cable Total Flux 4 Exp Time vs Cable Rad Gauge 3 CFAST Time vs Cable B Flux CFAST Time vs Cable B Rad
Control Cable B Surface TemperatureICFMP BE #3, Test 13
Time (s)
0 5 10 15 20 25 30
Tem
pera
ture
(C)
0
100
200
300
400
Exp Time vs B-Ts-14 CFAST Time vs Cable B Temp
Control Cable B Surface TemperatureICFMP BE #3, Test 16
Time (s)
0 5 10 15 20 25 30
Tem
pera
ture
(C)
0
100
200
300
400
Exp Time vs B-Ts-14 CFAST Time vs Cable B Temp
Figure A-33. Thermal Environment near Cable B, ICFMP BE #3, Tests 13 and 16
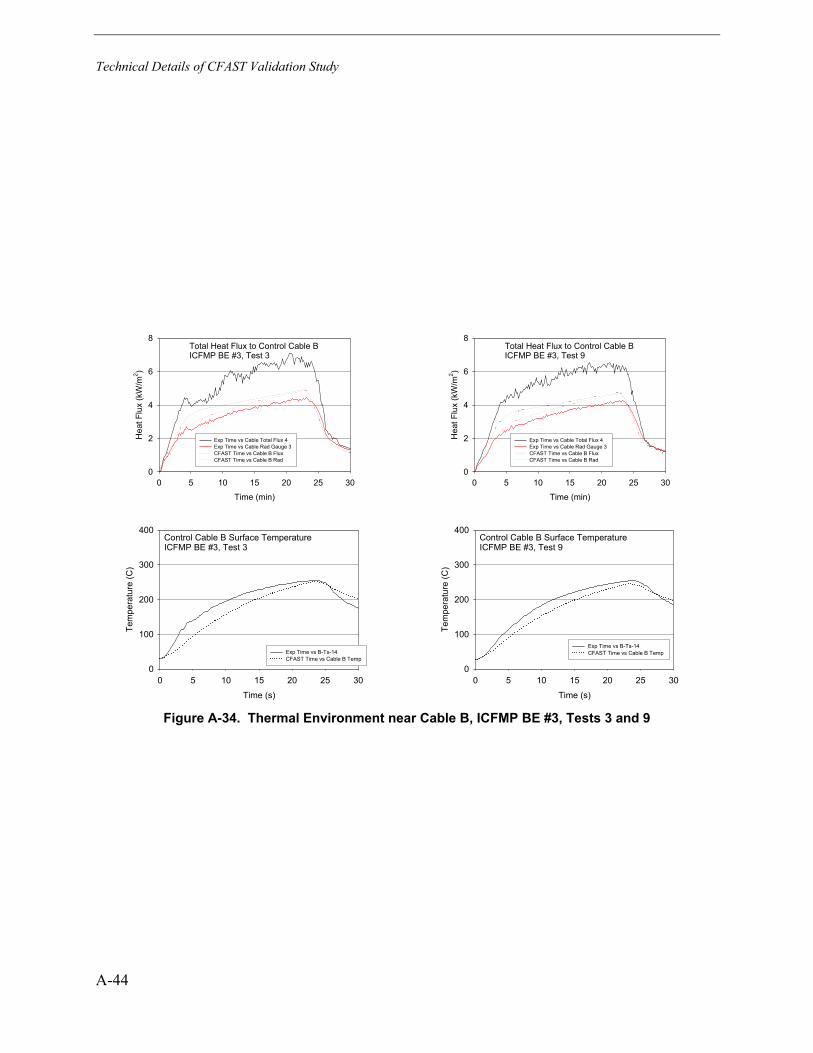
Technical Details of CFAST Validation Study
A-44
Total Heat Flux to Control Cable BICFMP BE #3, Test 3
Time (min)
0 5 10 15 20 25 30
Hea
t Flu
x (k
W/m
2 )
0
2
4
6
8
Exp Time vs Cable Total Flux 4 Exp Time vs Cable Rad Gauge 3 CFAST Time vs Cable B Flux CFAST Time vs Cable B Rad
Total Heat Flux to Control Cable BICFMP BE #3, Test 9
Time (min)
0 5 10 15 20 25 30
Hea
t Flu
x (k
W/m
2 )
0
2
4
6
8
Exp Time vs Cable Total Flux 4 Exp Time vs Cable Rad Gauge 3 CFAST Time vs Cable B Flux CFAST Time vs Cable B Rad
Control Cable B Surface TemperatureICFMP BE #3, Test 3
Time (s)
0 5 10 15 20 25 30
Tem
pera
ture
(C)
0
100
200
300
400
Exp Time vs B-Ts-14 CFAST Time vs Cable B Temp
Control Cable B Surface TemperatureICFMP BE #3, Test 9
Time (s)
0 5 10 15 20 25 30
Tem
pera
ture
(C)
0
100
200
300
400
Exp Time vs B-Ts-14 CFAST Time vs Cable B Temp
Figure A-34. Thermal Environment near Cable B, ICFMP BE #3, Tests 3 and 9
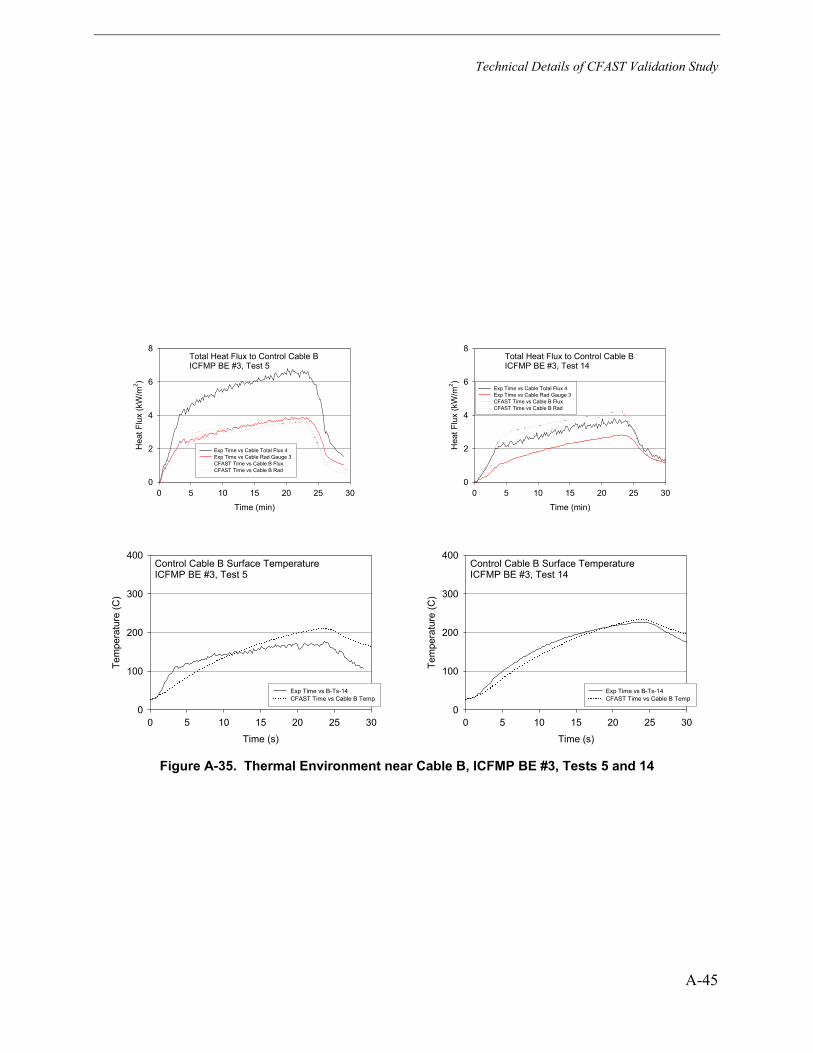
Technical Details of CFAST Validation Study
A-45
Total Heat Flux to Control Cable BICFMP BE #3, Test 5
Time (min)
0 5 10 15 20 25 30
Hea
t Flu
x (k
W/m
2 )
0
2
4
6
8
Exp Time vs Cable Total Flux 4 Exp Time vs Cable Rad Gauge 3 CFAST Time vs Cable B Flux CFAST Time vs Cable B Rad
Total Heat Flux to Control Cable BICFMP BE #3, Test 14
Time (min)
0 5 10 15 20 25 30
Hea
t Flu
x (k
W/m
2 )
0
2
4
6
8
Exp Time vs Cable Total Flux 4 Exp Time vs Cable Rad Gauge 3 CFAST Time vs Cable B Flux CFAST Time vs Cable B Rad
Control Cable B Surface TemperatureICFMP BE #3, Test 5
Time (s)
0 5 10 15 20 25 30
Tem
pera
ture
(C)
0
100
200
300
400
Exp Time vs B-Ts-14 CFAST Time vs Cable B Temp
Control Cable B Surface TemperatureICFMP BE #3, Test 14
Time (s)
0 5 10 15 20 25 30
Tem
pera
ture
(C)
0
100
200
300
400
Exp Time vs B-Ts-14 CFAST Time vs Cable B Temp
Figure A-35. Thermal Environment near Cable B, ICFMP BE #3, Tests 5 and 14
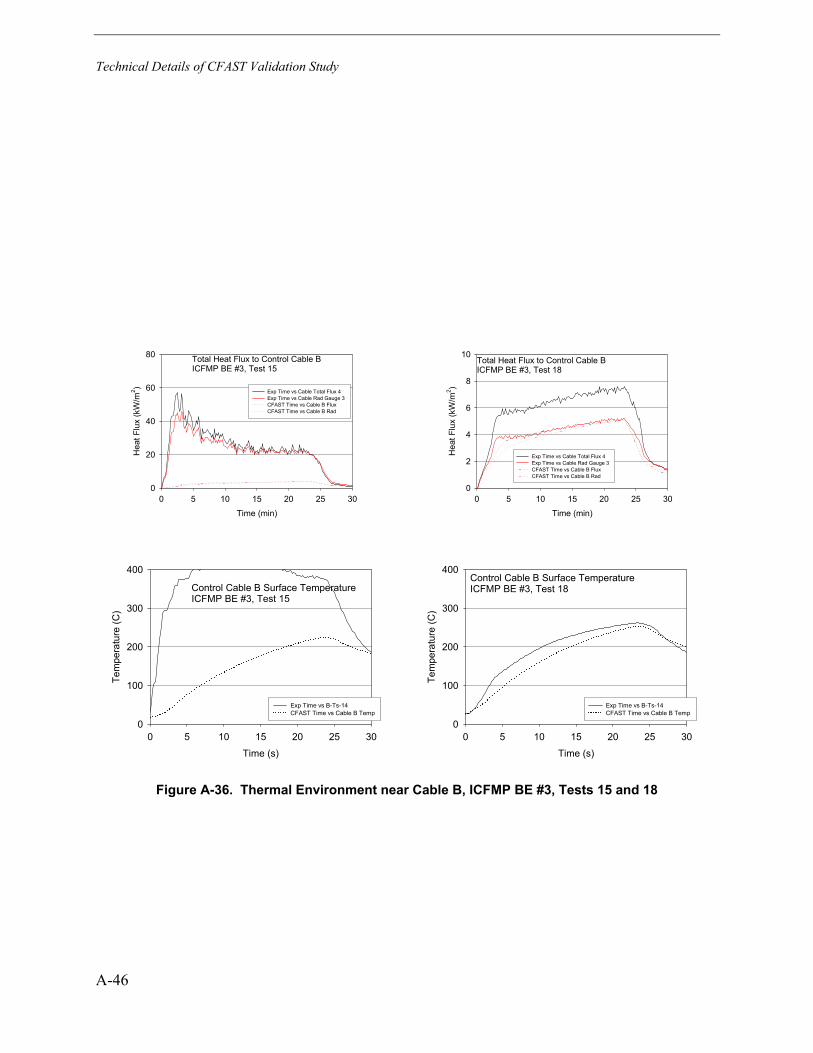
Technical Details of CFAST Validation Study
A-46
Total Heat Flux to Control Cable BICFMP BE #3, Test 15
Time (min)
0 5 10 15 20 25 30
Hea
t Flu
x (k
W/m
2 )
0
20
40
60
80
Exp Time vs Cable Total Flux 4 Exp Time vs Cable Rad Gauge 3 CFAST Time vs Cable B Flux CFAST Time vs Cable B Rad
Total Heat Flux to Control Cable BICFMP BE #3, Test 18
Time (min)
0 5 10 15 20 25 30
Hea
t Flu
x (k
W/m
2 )
0
2
4
6
8
10
Exp Time vs Cable Total Flux 4 Exp Time vs Cable Rad Gauge 3 CFAST Time vs Cable B Flux CFAST Time vs Cable B Rad
Control Cable B Surface TemperatureICFMP BE #3, Test 15
Time (s)
0 5 10 15 20 25 30
Tem
pera
ture
(C)
0
100
200
300
400
Exp Time vs B-Ts-14 CFAST Time vs Cable B Temp
Control Cable B Surface TemperatureICFMP BE #3, Test 18
Time (s)
0 5 10 15 20 25 30
Tem
pera
ture
(C)
0
100
200
300
400
Exp Time vs B-Ts-14 CFAST Time vs Cable B Temp
Figure A-36. Thermal Environment near Cable B, ICFMP BE #3, Tests 15 and 18
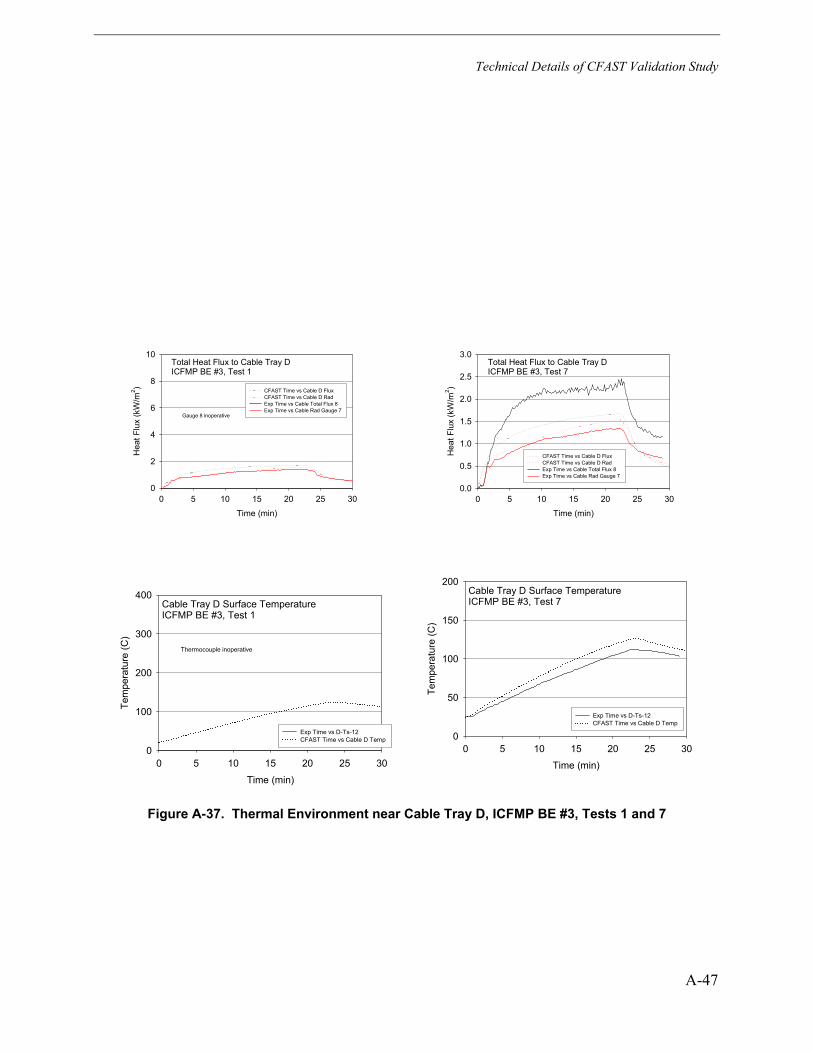
Technical Details of CFAST Validation Study
A-47
Total Heat Flux to Cable Tray DICFMP BE #3, Test 1
Time (min)
0 5 10 15 20 25 30
Hea
t Flu
x (k
W/m
2 )
0
2
4
6
8
10
CFAST Time vs Cable D Flux CFAST Time vs Cable D Rad Exp Time vs Cable Total Flux 8 Exp Time vs Cable Rad Gauge 7
Gauge 8 inoperative
Total Heat Flux to Cable Tray DICFMP BE #3, Test 7
Time (min)
0 5 10 15 20 25 30
Hea
t Flu
x (k
W/m
2 )
0.0
0.5
1.0
1.5
2.0
2.5
3.0
CFAST Time vs Cable D Flux CFAST Time vs Cable D Rad Exp Time vs Cable Total Flux 8 Exp Time vs Cable Rad Gauge 7
Cable Tray D Surface TemperatureICFMP BE #3, Test 1
Time (min)
0 5 10 15 20 25 30
Tem
pera
ture
(C)
0
100
200
300
400
Exp Time vs D-Ts-12 CFAST Time vs Cable D Temp
Thermocouple inoperative
Cable Tray D Surface TemperatureICFMP BE #3, Test 7
Time (min)
0 5 10 15 20 25 30
Tem
pera
ture
(C)
0
50
100
150
200
Exp Time vs D-Ts-12 CFAST Time vs Cable D Temp
Figure A-37. Thermal Environment near Cable Tray D, ICFMP BE #3, Tests 1 and 7
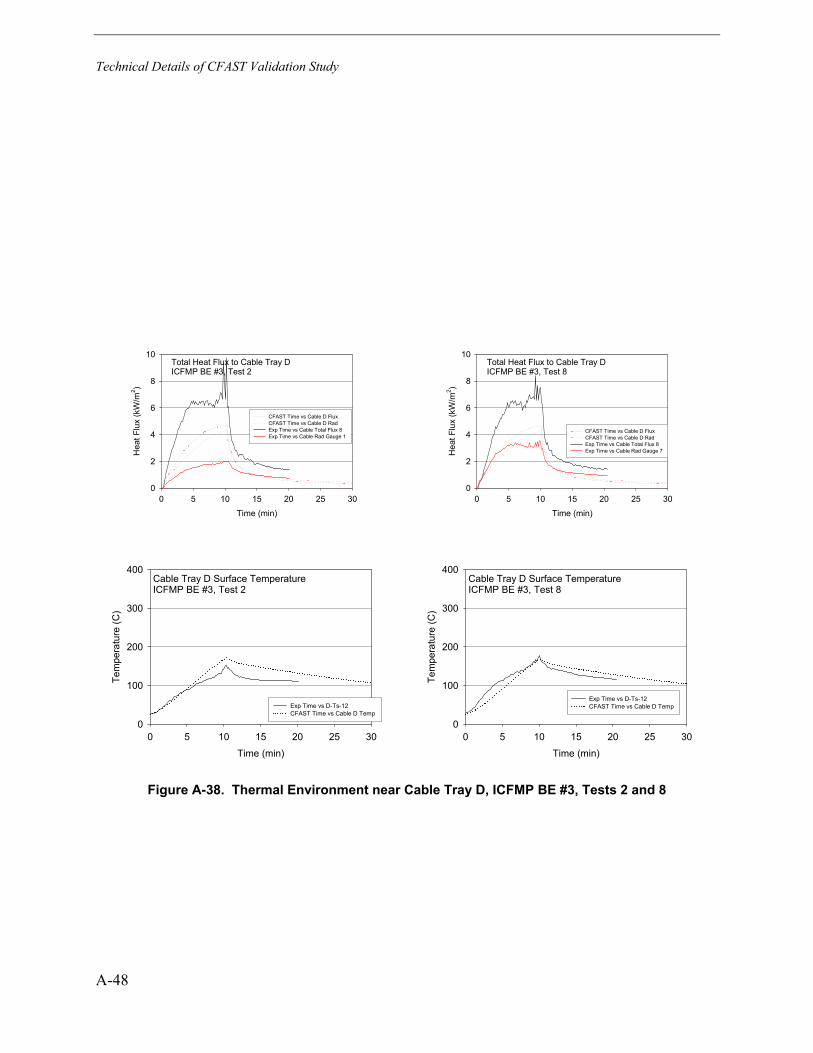
Technical Details of CFAST Validation Study
A-48
Total Heat Flux to Cable Tray DICFMP BE #3, Test 2
Time (min)
0 5 10 15 20 25 30
Hea
t Flu
x (k
W/m
2 )
0
2
4
6
8
10
CFAST Time vs Cable D Flux CFAST Time vs Cable D Rad Exp Time vs Cable Total Flux 8 Exp Time vs Cable Rad Gauge 1
Total Heat Flux to Cable Tray DICFMP BE #3, Test 8
Time (min)
0 5 10 15 20 25 30
Hea
t Flu
x (k
W/m
2 )
0
2
4
6
8
10
CFAST Time vs Cable D Flux CFAST Time vs Cable D Rad Exp Time vs Cable Total Flux 8 Exp Time vs Cable Rad Gauge 7
Cable Tray D Surface TemperatureICFMP BE #3, Test 2
Time (min)
0 5 10 15 20 25 30
Tem
pera
ture
(C)
0
100
200
300
400
Exp Time vs D-Ts-12 CFAST Time vs Cable D Temp
Cable Tray D Surface TemperatureICFMP BE #3, Test 8
Time (min)
0 5 10 15 20 25 30
Tem
pera
ture
(C)
0
100
200
300
400
Exp Time vs D-Ts-12 CFAST Time vs Cable D Temp
Figure A-38. Thermal Environment near Cable Tray D, ICFMP BE #3, Tests 2 and 8
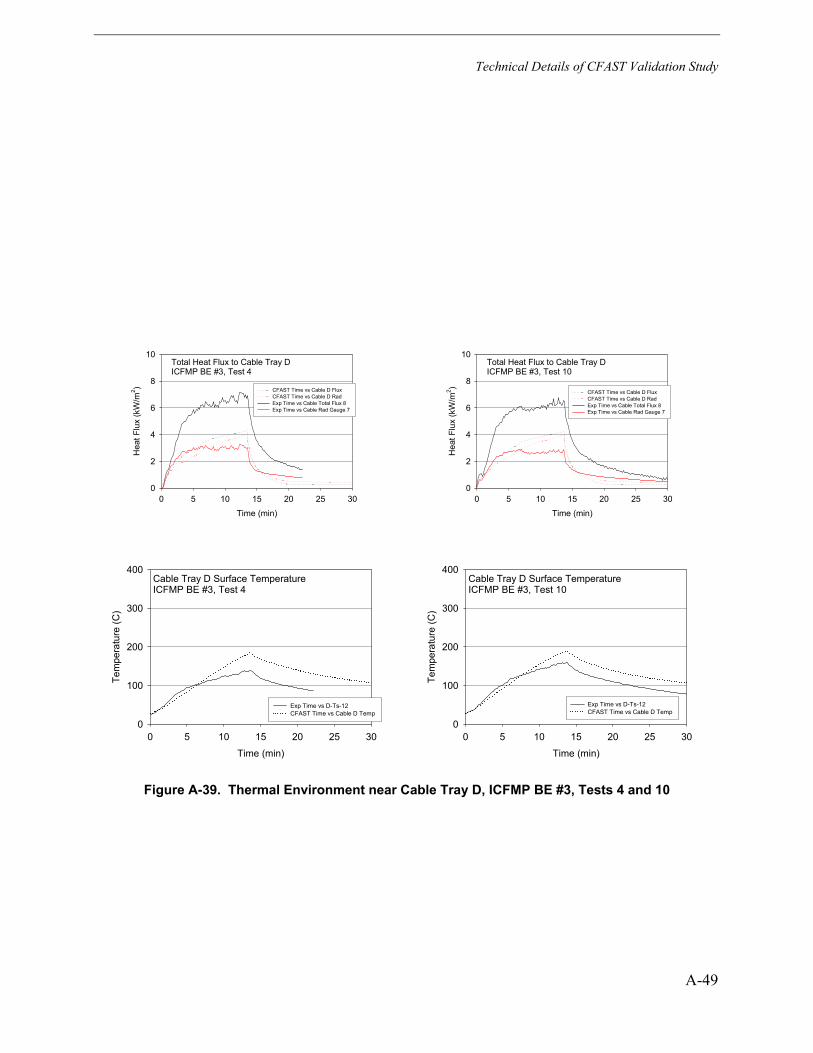
Technical Details of CFAST Validation Study
A-49
Total Heat Flux to Cable Tray DICFMP BE #3, Test 4
Time (min)
0 5 10 15 20 25 30
Hea
t Flu
x (k
W/m
2 )
0
2
4
6
8
10
CFAST Time vs Cable D Flux CFAST Time vs Cable D Rad Exp Time vs Cable Total Flux 8 Exp Time vs Cable Rad Gauge 7
Total Heat Flux to Cable Tray DICFMP BE #3, Test 10
Time (min)
0 5 10 15 20 25 30
Hea
t Flu
x (k
W/m
2 )
0
2
4
6
8
10
CFAST Time vs Cable D Flux CFAST Time vs Cable D Rad Exp Time vs Cable Total Flux 8 Exp Time vs Cable Rad Gauge 7
Cable Tray D Surface TemperatureICFMP BE #3, Test 4
Time (min)
0 5 10 15 20 25 30
Tem
pera
ture
(C)
0
100
200
300
400
Exp Time vs D-Ts-12 CFAST Time vs Cable D Temp
Cable Tray D Surface TemperatureICFMP BE #3, Test 10
Time (min)
0 5 10 15 20 25 30
Tem
pera
ture
(C)
0
100
200
300
400
Exp Time vs D-Ts-12 CFAST Time vs Cable D Temp
Figure A-39. Thermal Environment near Cable Tray D, ICFMP BE #3, Tests 4 and 10
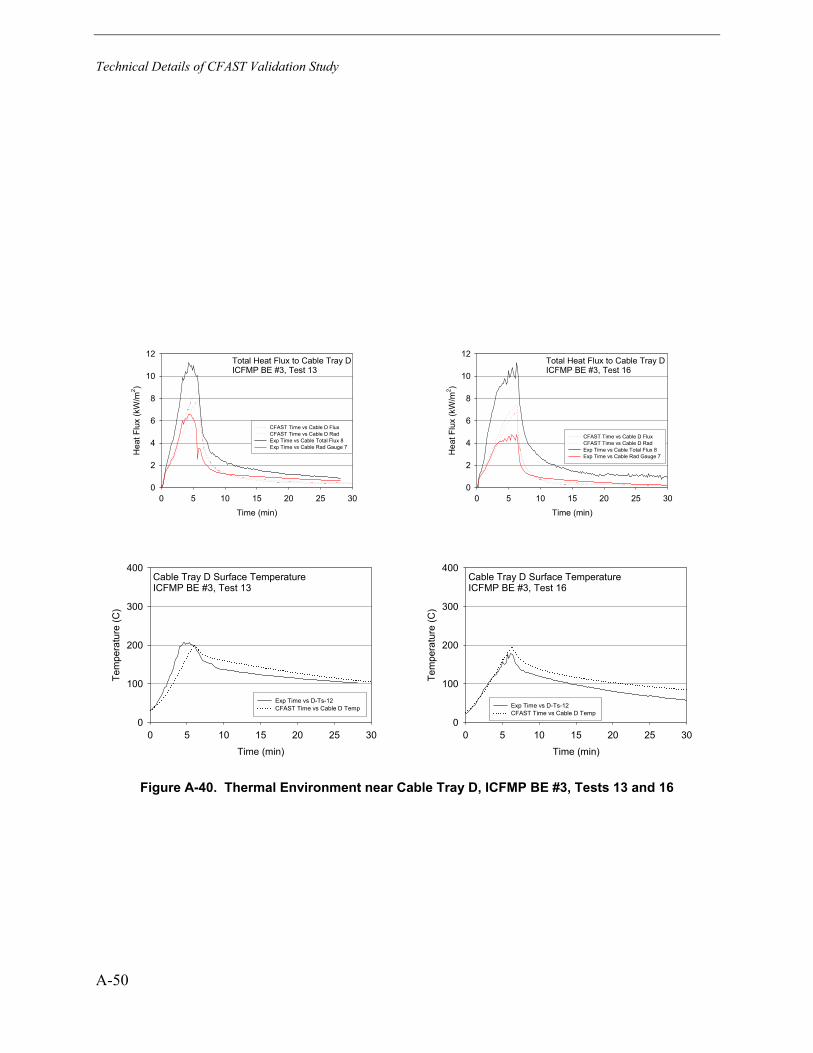
Technical Details of CFAST Validation Study
A-50
Total Heat Flux to Cable Tray DICFMP BE #3, Test 13
Time (min)
0 5 10 15 20 25 30
Hea
t Flu
x (k
W/m
2 )
0
2
4
6
8
10
12
CFAST Time vs Cable D Flux CFAST Time vs Cable D Rad Exp Time vs Cable Total Flux 8 Exp Time vs Cable Rad Gauge 7
Total Heat Flux to Cable Tray DICFMP BE #3, Test 16
Time (min)
0 5 10 15 20 25 30
Hea
t Flu
x (k
W/m
2 )
0
2
4
6
8
10
12
CFAST Time vs Cable D Flux CFAST Time vs Cable D Rad Exp Time vs Cable Total Flux 8 Exp Time vs Cable Rad Gauge 7
Cable Tray D Surface TemperatureICFMP BE #3, Test 13
Time (min)
0 5 10 15 20 25 30
Tem
pera
ture
(C)
0
100
200
300
400
Exp Time vs D-Ts-12 CFAST Time vs Cable D Temp
Cable Tray D Surface TemperatureICFMP BE #3, Test 16
Time (min)
0 5 10 15 20 25 30
Tem
pera
ture
(C)
0
100
200
300
400
Exp Time vs D-Ts-12 CFAST Time vs Cable D Temp
Figure A-40. Thermal Environment near Cable Tray D, ICFMP BE #3, Tests 13 and 16
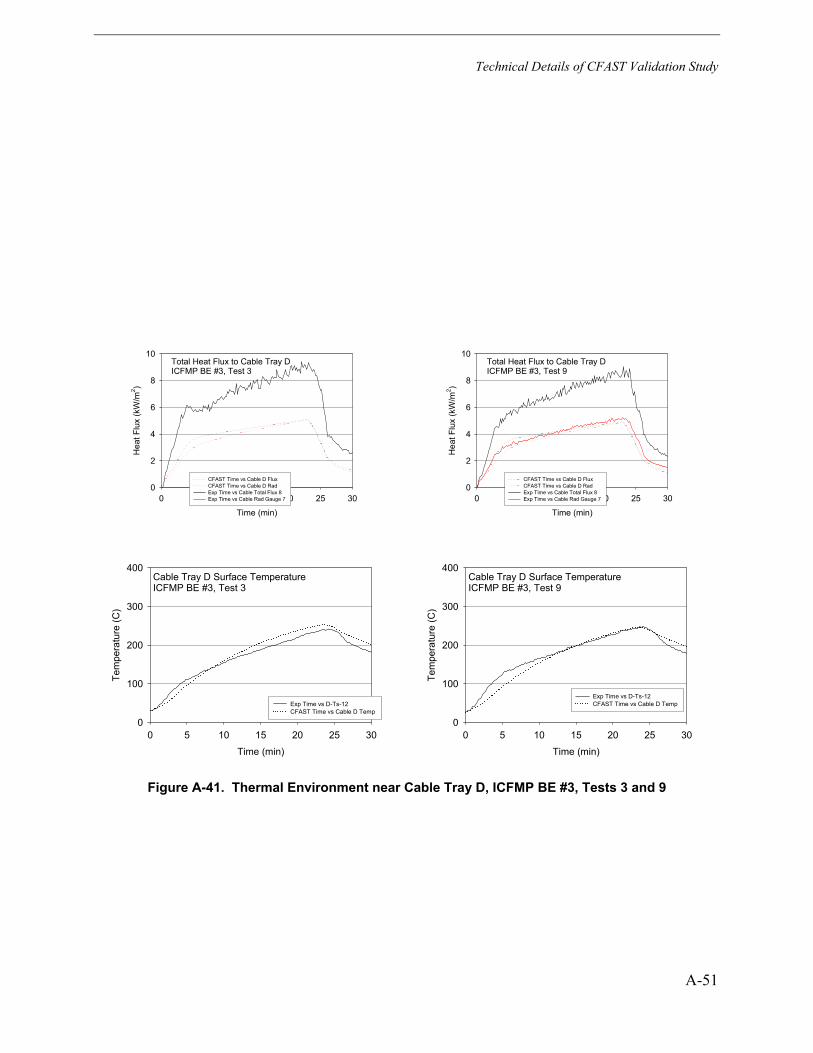
Technical Details of CFAST Validation Study
A-51
Total Heat Flux to Cable Tray DICFMP BE #3, Test 3
Time (min)
0 5 10 15 20 25 30
Hea
t Flu
x (k
W/m
2 )
0
2
4
6
8
10
CFAST Time vs Cable D Flux CFAST Time vs Cable D Rad Exp Time vs Cable Total Flux 8 Exp Time vs Cable Rad Gauge 7
Total Heat Flux to Cable Tray DICFMP BE #3, Test 9
Time (min)
0 5 10 15 20 25 30
Hea
t Flu
x (k
W/m
2 )
0
2
4
6
8
10
CFAST Time vs Cable D Flux CFAST Time vs Cable D Rad Exp Time vs Cable Total Flux 8 Exp Time vs Cable Rad Gauge 7
Cable Tray D Surface TemperatureICFMP BE #3, Test 3
Time (min)
0 5 10 15 20 25 30
Tem
pera
ture
(C)
0
100
200
300
400
Exp Time vs D-Ts-12 CFAST Time vs Cable D Temp
Cable Tray D Surface TemperatureICFMP BE #3, Test 9
Time (min)
0 5 10 15 20 25 30
Tem
pera
ture
(C)
0
100
200
300
400
Exp Time vs D-Ts-12 CFAST Time vs Cable D Temp
Figure A-41. Thermal Environment near Cable Tray D, ICFMP BE #3, Tests 3 and 9
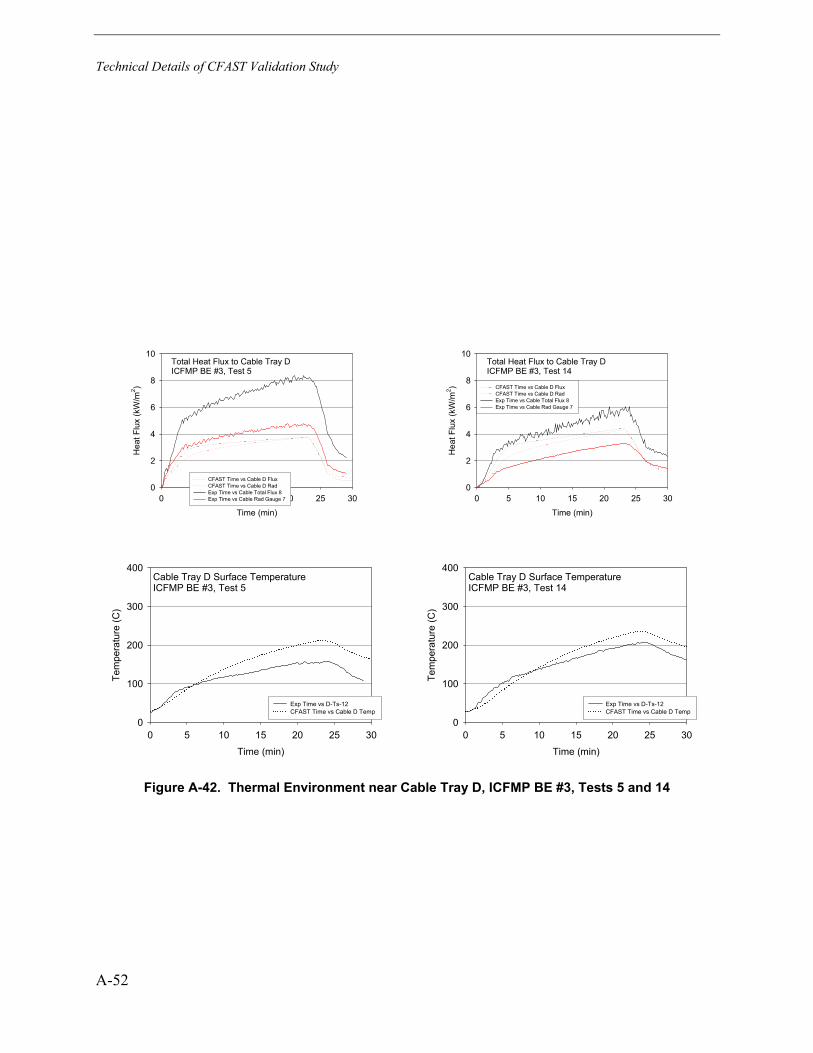
Technical Details of CFAST Validation Study
A-52
Total Heat Flux to Cable Tray DICFMP BE #3, Test 5
Time (min)
0 5 10 15 20 25 30
Hea
t Flu
x (k
W/m
2 )
0
2
4
6
8
10
CFAST Time vs Cable D Flux CFAST Time vs Cable D Rad Exp Time vs Cable Total Flux 8 Exp Time vs Cable Rad Gauge 7
Total Heat Flux to Cable Tray DICFMP BE #3, Test 14
Time (min)
0 5 10 15 20 25 30
Hea
t Flu
x (k
W/m
2 )
0
2
4
6
8
10
CFAST Time vs Cable D Flux CFAST Time vs Cable D Rad Exp Time vs Cable Total Flux 8 Exp Time vs Cable Rad Gauge 7
Cable Tray D Surface TemperatureICFMP BE #3, Test 5
Time (min)
0 5 10 15 20 25 30
Tem
pera
ture
(C)
0
100
200
300
400
Exp Time vs D-Ts-12 CFAST Time vs Cable D Temp
Cable Tray D Surface TemperatureICFMP BE #3, Test 14
Time (min)
0 5 10 15 20 25 30
Tem
pera
ture
(C)
0
100
200
300
400
Exp Time vs D-Ts-12 CFAST Time vs Cable D Temp
Figure A-42. Thermal Environment near Cable Tray D, ICFMP BE #3, Tests 5 and 14
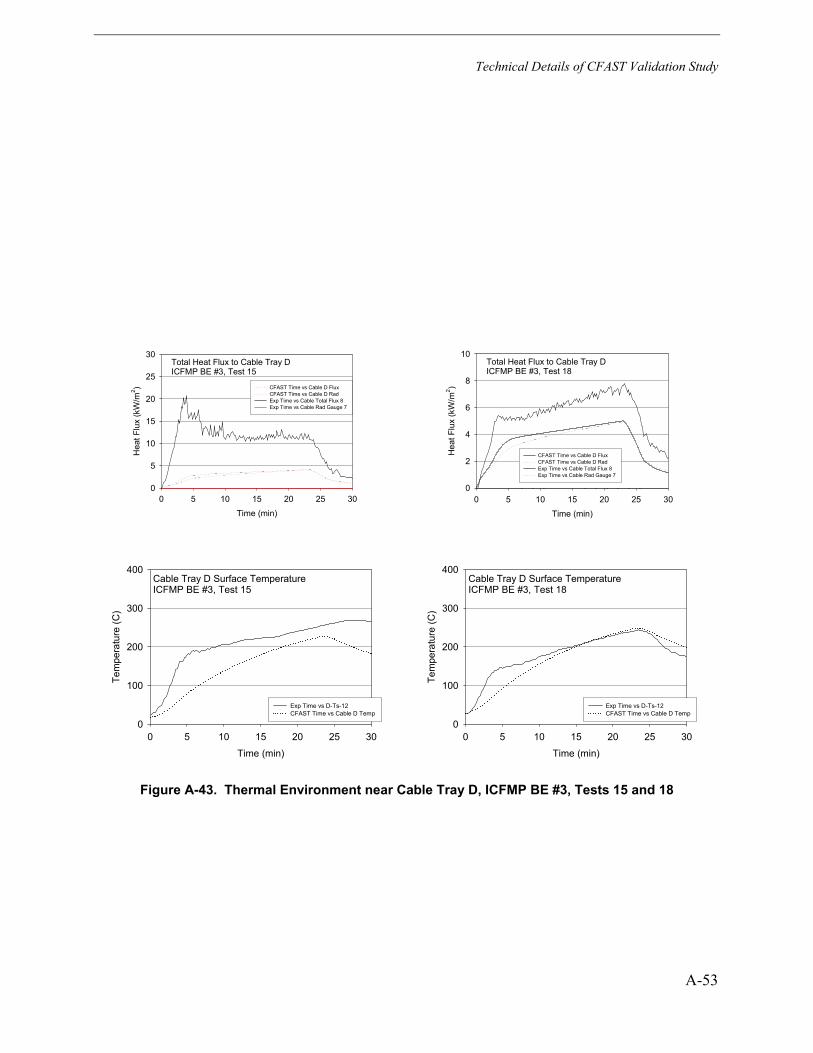
Technical Details of CFAST Validation Study
A-53
Total Heat Flux to Cable Tray DICFMP BE #3, Test 15
Time (min)
0 5 10 15 20 25 30
Hea
t Flu
x (k
W/m
2 )
0
5
10
15
20
25
30
CFAST Time vs Cable D Flux CFAST Time vs Cable D Rad Exp Time vs Cable Total Flux 8 Exp Time vs Cable Rad Gauge 7
Total Heat Flux to Cable Tray DICFMP BE #3, Test 18
Time (min)
0 5 10 15 20 25 30
Hea
t Flu
x (k
W/m
2 )
0
2
4
6
8
10
CFAST Time vs Cable D Flux CFAST Time vs Cable D Rad Exp Time vs Cable Total Flux 8 Exp Time vs Cable Rad Gauge 7
Cable Tray D Surface TemperatureICFMP BE #3, Test 15
Time (min)
0 5 10 15 20 25 30
Tem
pera
ture
(C)
0
100
200
300
400
Exp Time vs D-Ts-12 CFAST Time vs Cable D Temp
Cable Tray D Surface TemperatureICFMP BE #3, Test 18
Time (min)
0 5 10 15 20 25 30
Tem
pera
ture
(C)
0
100
200
300
400
Exp Time vs D-Ts-12 CFAST Time vs Cable D Temp
Figure A-43. Thermal Environment near Cable Tray D, ICFMP BE #3, Tests 15 and 18
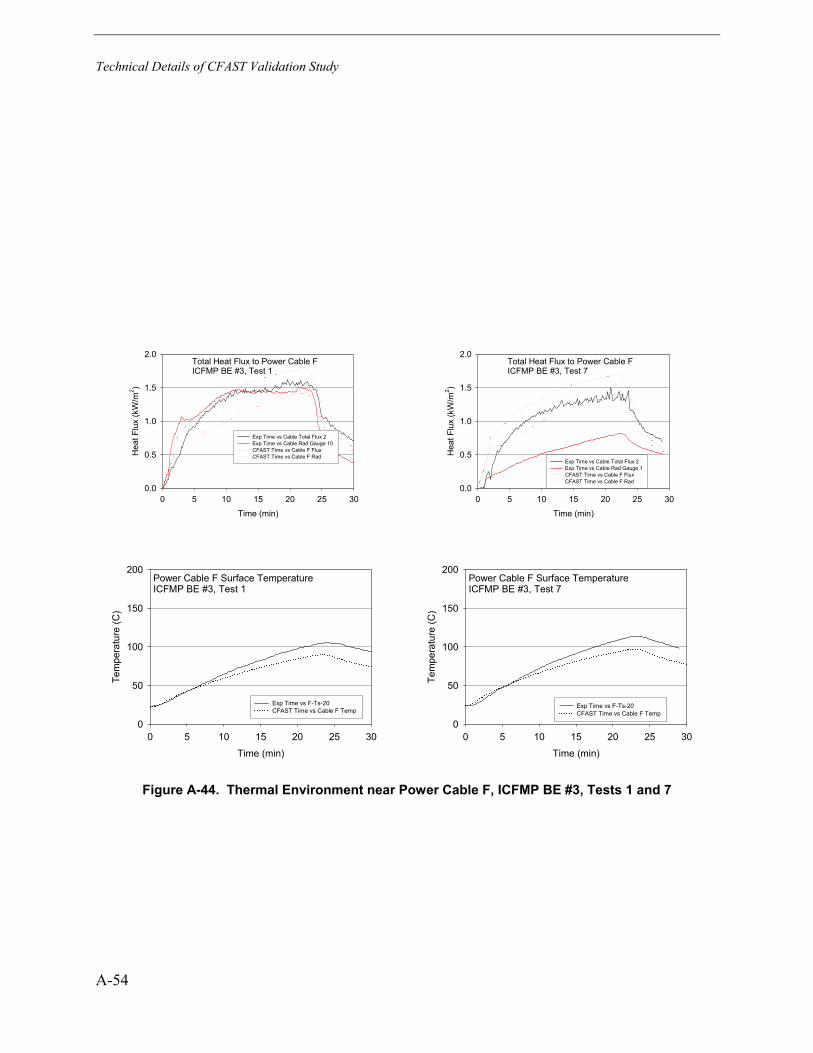
Technical Details of CFAST Validation Study
A-54
Total Heat Flux to Power Cable FICFMP BE #3, Test 1
Time (min)
0 5 10 15 20 25 30
Hea
t Flu
x (k
W/m
2 )
0.0
0.5
1.0
1.5
2.0
Exp Time vs Cable Total Flux 2 Exp Time vs Cable Rad Gauge 10 CFAST Time vs Cable F Flux CFAST Time vs Cable F Rad
Total Heat Flux to Power Cable FICFMP BE #3, Test 7
Time (min)
0 5 10 15 20 25 30
Hea
t Flu
x (k
W/m
2 )
0.0
0.5
1.0
1.5
2.0
Exp Time vs Cable Total Flux 2 Exp Time vs Cable Rad Gauge 1 CFAST Time vs Cable F Flux CFAST Time vs Cable F Rad
Power Cable F Surface TemperatureICFMP BE #3, Test 1
Time (min)
0 5 10 15 20 25 30
Tem
pera
ture
(C)
0
50
100
150
200
Exp Time vs F-Ts-20 CFAST Time vs Cable F Temp
Power Cable F Surface TemperatureICFMP BE #3, Test 7
Time (min)
0 5 10 15 20 25 30
Tem
pera
ture
(C)
0
50
100
150
200
Exp Time vs F-Ts-20 CFAST Time vs Cable F Temp
Figure A-44. Thermal Environment near Power Cable F, ICFMP BE #3, Tests 1 and 7
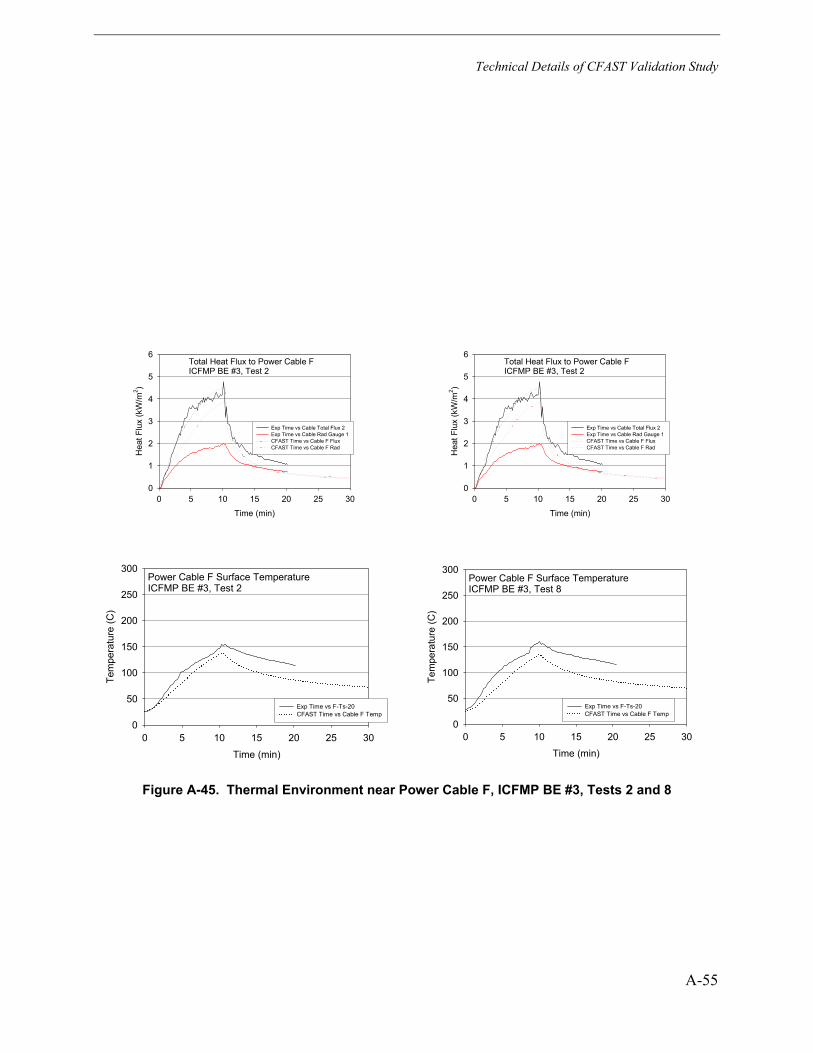
Technical Details of CFAST Validation Study
A-55
Total Heat Flux to Power Cable FICFMP BE #3, Test 2
Time (min)
0 5 10 15 20 25 30
Hea
t Flu
x (k
W/m
2 )
0
1
2
3
4
5
6
Exp Time vs Cable Total Flux 2 Exp Time vs Cable Rad Gauge 1 CFAST Time vs Cable F Flux CFAST Time vs Cable F Rad
Total Heat Flux to Power Cable FICFMP BE #3, Test 2
Time (min)
0 5 10 15 20 25 30
Hea
t Flu
x (k
W/m
2 )
0
1
2
3
4
5
6
Exp Time vs Cable Total Flux 2 Exp Time vs Cable Rad Gauge 1 CFAST Time vs Cable F Flux CFAST Time vs Cable F Rad
Power Cable F Surface TemperatureICFMP BE #3, Test 2
Time (min)
0 5 10 15 20 25 30
Tem
pera
ture
(C)
0
50
100
150
200
250
300
Exp Time vs F-Ts-20 CFAST Time vs Cable F Temp
Power Cable F Surface TemperatureICFMP BE #3, Test 8
Time (min)
0 5 10 15 20 25 30
Tem
pera
ture
(C)
0
50
100
150
200
250
300
Exp Time vs F-Ts-20 CFAST Time vs Cable F Temp
Figure A-45. Thermal Environment near Power Cable F, ICFMP BE #3, Tests 2 and 8
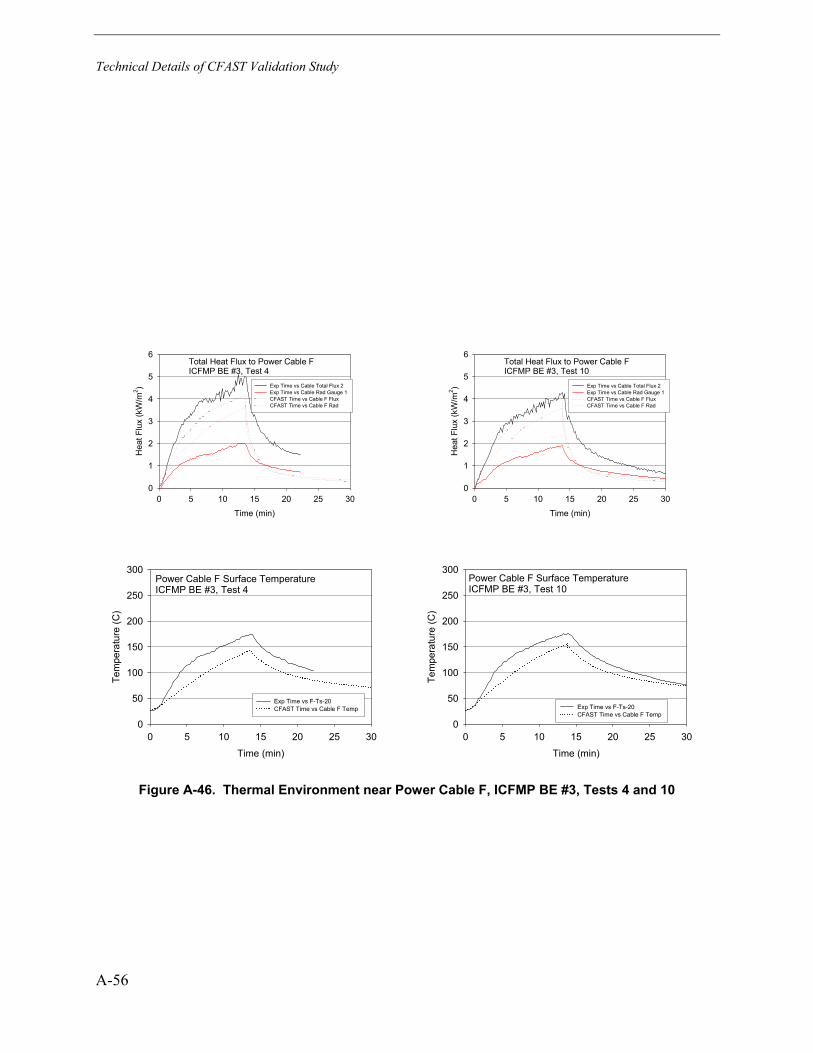
Technical Details of CFAST Validation Study
A-56
Total Heat Flux to Power Cable FICFMP BE #3, Test 4
Time (min)
0 5 10 15 20 25 30
Hea
t Flu
x (k
W/m
2 )
0
1
2
3
4
5
6
Exp Time vs Cable Total Flux 2 Exp Time vs Cable Rad Gauge 1 CFAST Time vs Cable F Flux CFAST Time vs Cable F Rad
Total Heat Flux to Power Cable FICFMP BE #3, Test 10
Time (min)
0 5 10 15 20 25 30
Hea
t Flu
x (k
W/m
2 )
0
1
2
3
4
5
6
Exp Time vs Cable Total Flux 2 Exp Time vs Cable Rad Gauge 1 CFAST Time vs Cable F Flux CFAST Time vs Cable F Rad
Power Cable F Surface TemperatureICFMP BE #3, Test 4
Time (min)
0 5 10 15 20 25 30
Tem
pera
ture
(C)
0
50
100
150
200
250
300
Exp Time vs F-Ts-20 CFAST Time vs Cable F Temp
Power Cable F Surface TemperatureICFMP BE #3, Test 10
Time (min)
0 5 10 15 20 25 30
Tem
pera
ture
(C)
0
50
100
150
200
250
300
Exp Time vs F-Ts-20 CFAST Time vs Cable F Temp
Figure A-46. Thermal Environment near Power Cable F, ICFMP BE #3, Tests 4 and 10
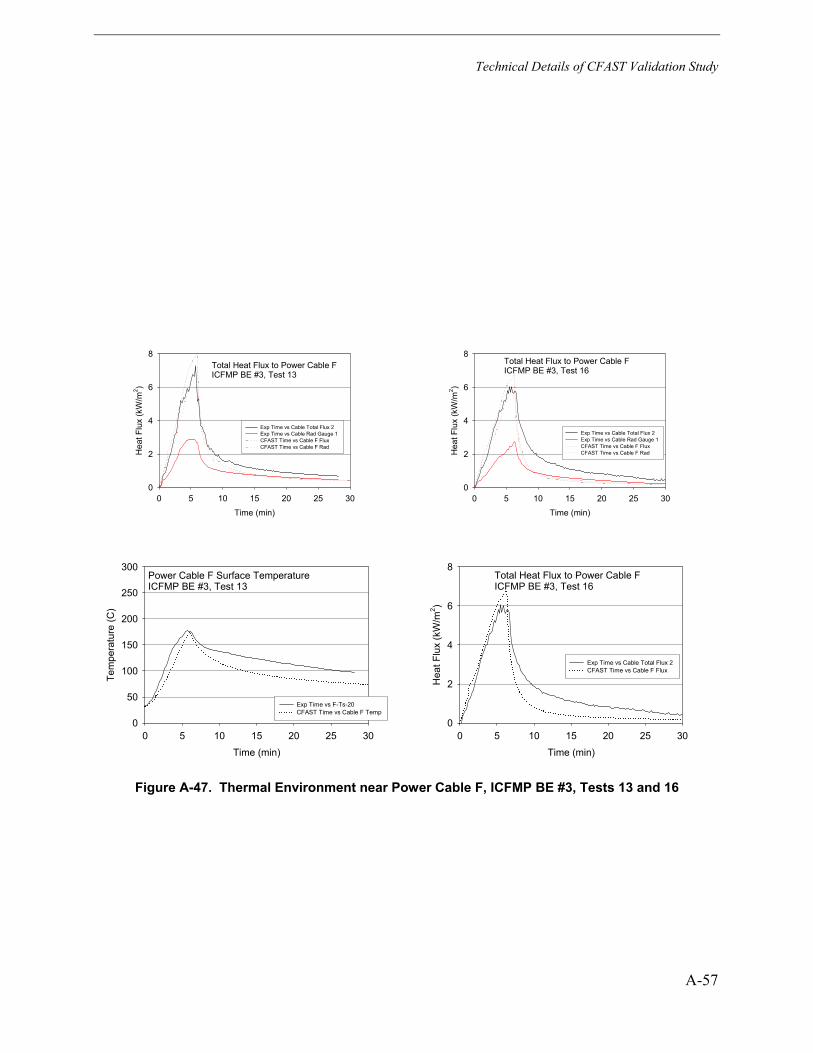
Technical Details of CFAST Validation Study
A-57
Total Heat Flux to Power Cable FICFMP BE #3, Test 13
Time (min)
0 5 10 15 20 25 30
Hea
t Flu
x (k
W/m
2 )
0
2
4
6
8
Exp Time vs Cable Total Flux 2 Exp Time vs Cable Rad Gauge 1 CFAST Time vs Cable F Flux CFAST Time vs Cable F Rad
Total Heat Flux to Power Cable FICFMP BE #3, Test 16
Time (min)
0 5 10 15 20 25 30
Hea
t Flu
x (k
W/m
2 )
0
2
4
6
8
Exp Time vs Cable Total Flux 2 Exp Time vs Cable Rad Gauge 1 CFAST Time vs Cable F Flux CFAST Time vs Cable F Rad
Power Cable F Surface TemperatureICFMP BE #3, Test 13
Time (min)
0 5 10 15 20 25 30
Tem
pera
ture
(C)
0
50
100
150
200
250
300
Exp Time vs F-Ts-20 CFAST Time vs Cable F Temp
Total Heat Flux to Power Cable FICFMP BE #3, Test 16
Time (min)
0 5 10 15 20 25 30
Hea
t Flu
x (k
W/m
2 )
0
2
4
6
8
Exp Time vs Cable Total Flux 2 CFAST Time vs Cable F Flux
Figure A-47. Thermal Environment near Power Cable F, ICFMP BE #3, Tests 13 and 16
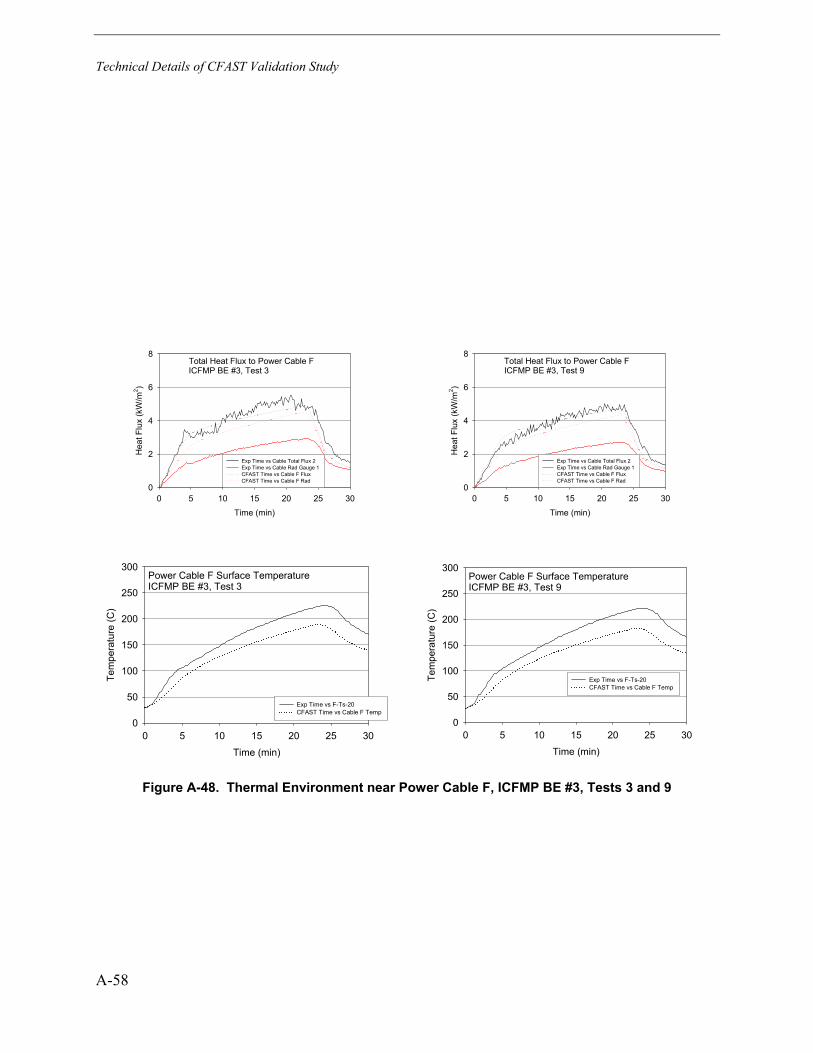
Technical Details of CFAST Validation Study
A-58
Total Heat Flux to Power Cable FICFMP BE #3, Test 3
Time (min)
0 5 10 15 20 25 30
Hea
t Flu
x (k
W/m
2 )
0
2
4
6
8
Exp Time vs Cable Total Flux 2 Exp Time vs Cable Rad Gauge 1 CFAST Time vs Cable F Flux CFAST Time vs Cable F Rad
Total Heat Flux to Power Cable FICFMP BE #3, Test 9
Time (min)
0 5 10 15 20 25 30
Hea
t Flu
x (k
W/m
2 )
0
2
4
6
8
Exp Time vs Cable Total Flux 2 Exp Time vs Cable Rad Gauge 1 CFAST Time vs Cable F Flux CFAST Time vs Cable F Rad
Power Cable F Surface TemperatureICFMP BE #3, Test 3
Time (min)
0 5 10 15 20 25 30
Tem
pera
ture
(C)
0
50
100
150
200
250
300
Exp Time vs F-Ts-20 CFAST Time vs Cable F Temp
Power Cable F Surface TemperatureICFMP BE #3, Test 9
Time (min)
0 5 10 15 20 25 30
Tem
pera
ture
(C)
0
50
100
150
200
250
300
Exp Time vs F-Ts-20 CFAST Time vs Cable F Temp
Figure A-48. Thermal Environment near Power Cable F, ICFMP BE #3, Tests 3 and 9
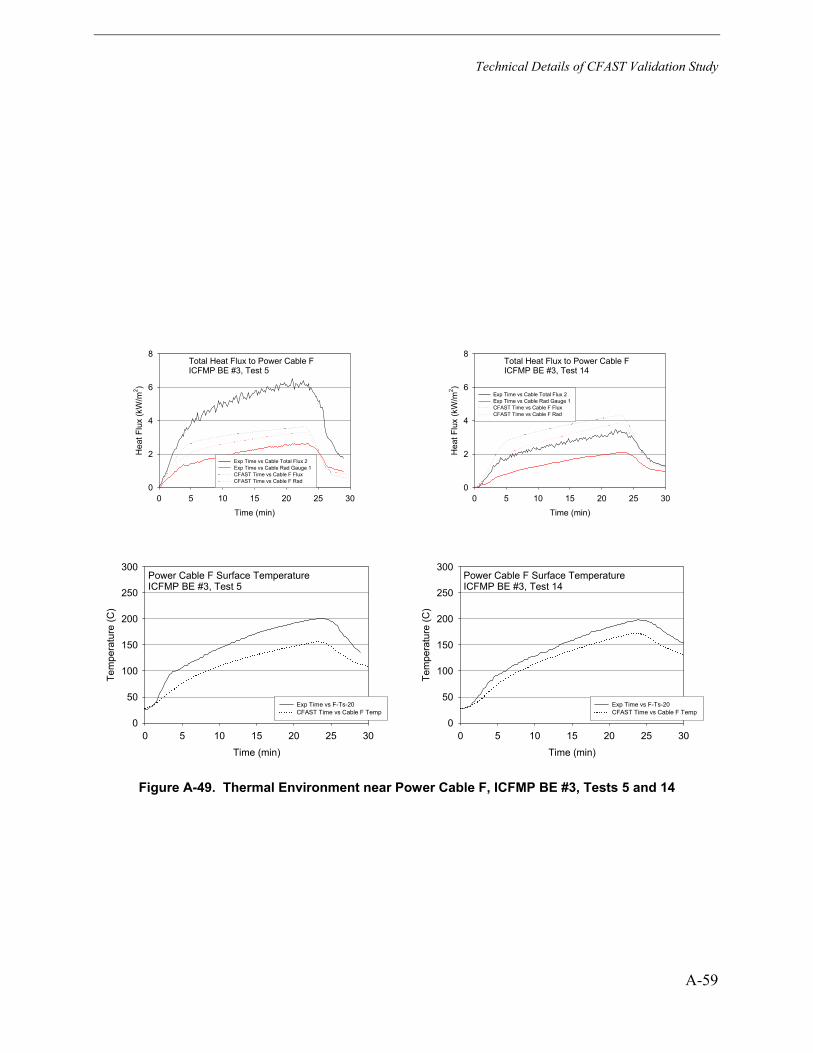
Technical Details of CFAST Validation Study
A-59
Total Heat Flux to Power Cable FICFMP BE #3, Test 5
Time (min)
0 5 10 15 20 25 30
Hea
t Flu
x (k
W/m
2 )
0
2
4
6
8
Exp Time vs Cable Total Flux 2 Exp Time vs Cable Rad Gauge 1 CFAST Time vs Cable F Flux CFAST Time vs Cable F Rad
Total Heat Flux to Power Cable FICFMP BE #3, Test 14
Time (min)
0 5 10 15 20 25 30
Hea
t Flu
x (k
W/m
2 )
0
2
4
6
8
Exp Time vs Cable Total Flux 2 Exp Time vs Cable Rad Gauge 1 CFAST Time vs Cable F Flux CFAST Time vs Cable F Rad
Power Cable F Surface TemperatureICFMP BE #3, Test 5
Time (min)
0 5 10 15 20 25 30
Tem
pera
ture
(C)
0
50
100
150
200
250
300
Exp Time vs F-Ts-20 CFAST Time vs Cable F Temp
Power Cable F Surface TemperatureICFMP BE #3, Test 14
Time (min)
0 5 10 15 20 25 30
Tem
pera
ture
(C)
0
50
100
150
200
250
300
Exp Time vs F-Ts-20 CFAST Time vs Cable F Temp
Figure A-49. Thermal Environment near Power Cable F, ICFMP BE #3, Tests 5 and 14
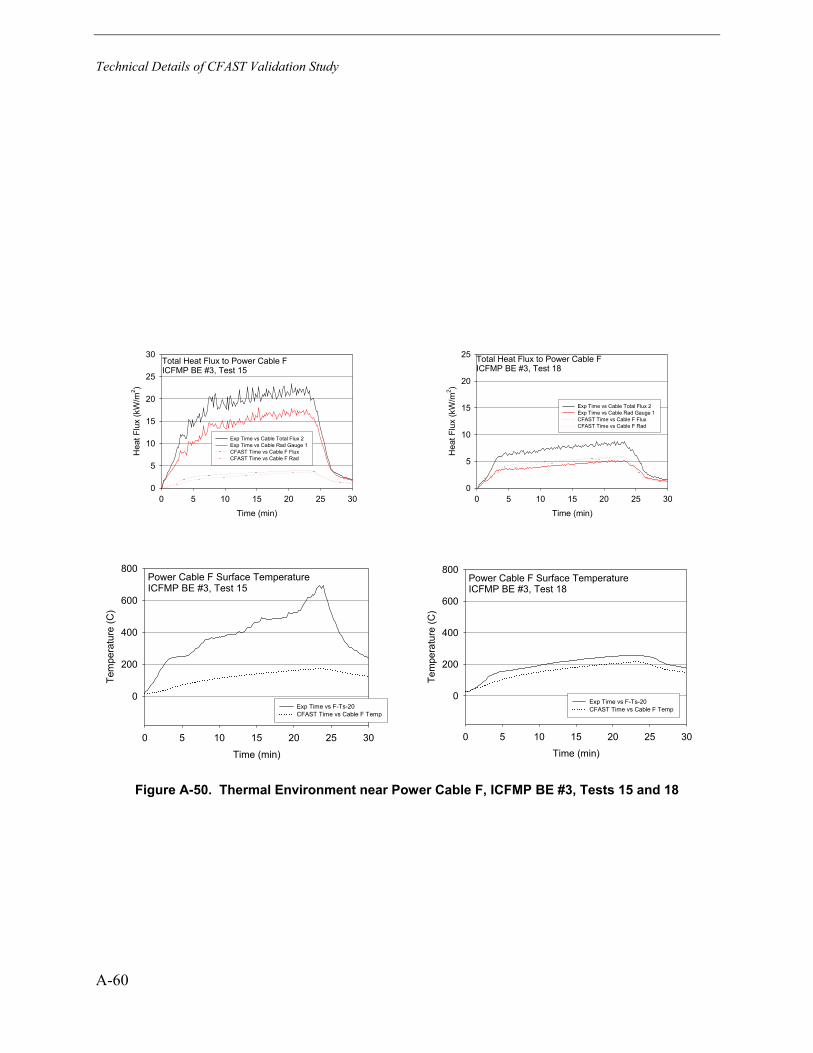
Technical Details of CFAST Validation Study
A-60
Total Heat Flux to Power Cable FICFMP BE #3, Test 15
Time (min)
0 5 10 15 20 25 30
Hea
t Flu
x (k
W/m
2 )
0
5
10
15
20
25
30
Exp Time vs Cable Total Flux 2 Exp Time vs Cable Rad Gauge 1 CFAST Time vs Cable F Flux CFAST Time vs Cable F Rad
Total Heat Flux to Power Cable FICFMP BE #3, Test 18
Time (min)
0 5 10 15 20 25 30
Hea
t Flu
x (k
W/m
2 )
0
5
10
15
20
25
Exp Time vs Cable Total Flux 2 Exp Time vs Cable Rad Gauge 1 CFAST Time vs Cable F Flux CFAST Time vs Cable F Rad
Power Cable F Surface TemperatureICFMP BE #3, Test 15
Time (min)
0 5 10 15 20 25 30
Tem
pera
ture
(C)
0
200
400
600
800
Exp Time vs F-Ts-20 CFAST Time vs Cable F Temp
Power Cable F Surface TemperatureICFMP BE #3, Test 18
Time (min)
0 5 10 15 20 25 30
Tem
pera
ture
(C)
0
200
400
600
800
Exp Time vs F-Ts-20 CFAST Time vs Cable F Temp
Figure A-50. Thermal Environment near Power Cable F, ICFMP BE #3, Tests 15 and 18
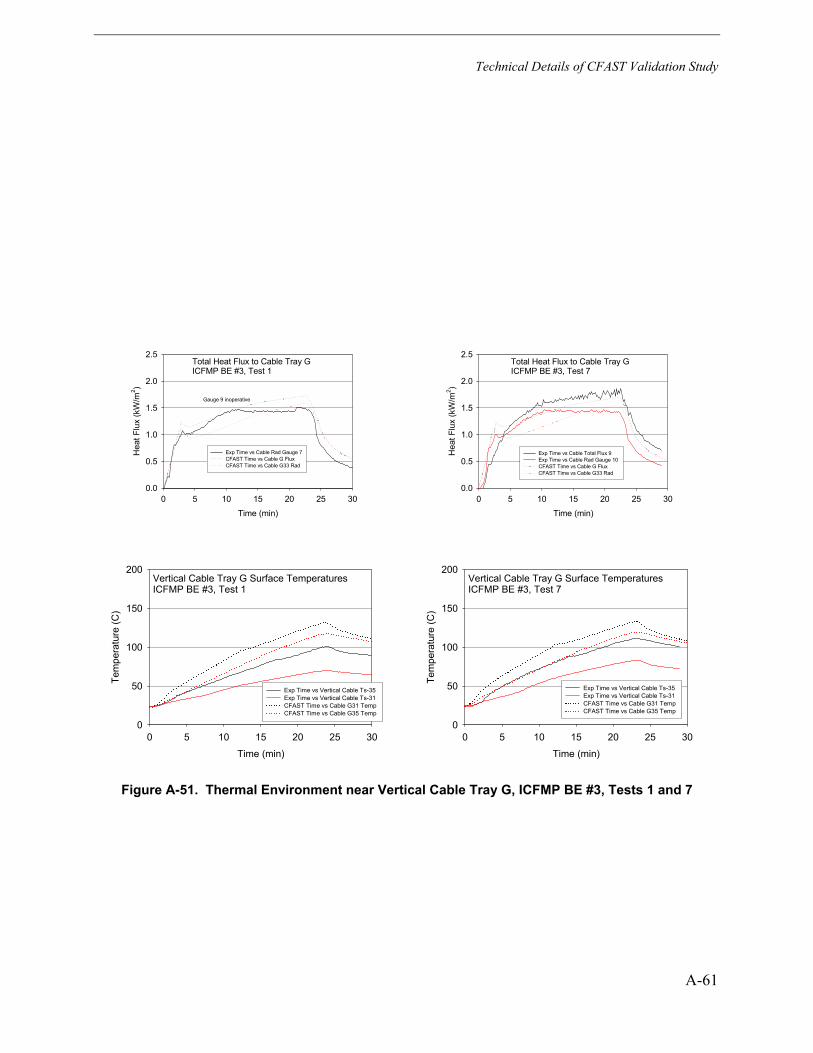
Technical Details of CFAST Validation Study
A-61
Total Heat Flux to Cable Tray GICFMP BE #3, Test 1
Time (min)
0 5 10 15 20 25 30
Hea
t Flu
x (k
W/m
2 )
0.0
0.5
1.0
1.5
2.0
2.5
Exp Time vs Cable Rad Gauge 7CFAST Time vs Cable G Flux CFAST Time vs Cable G33 Rad
Gauge 9 inoperative
Total Heat Flux to Cable Tray GICFMP BE #3, Test 7
Time (min)
0 5 10 15 20 25 30
Hea
t Flu
x (k
W/m
2 )
0.0
0.5
1.0
1.5
2.0
2.5
Exp Time vs Cable Total Flux 9 Exp Time vs Cable Rad Gauge 10 CFAST Time vs Cable G Flux CFAST Time vs Cable G33 Rad
Vertical Cable Tray G Surface TemperaturesICFMP BE #3, Test 1
Time (min)
0 5 10 15 20 25 30
Tem
pera
ture
(C)
0
50
100
150
200
Exp Time vs Vertical Cable Ts-35 Exp Time vs Vertical Cable Ts-31 CFAST Time vs Cable G31 Temp CFAST Time vs Cable G35 Temp
Vertical Cable Tray G Surface TemperaturesICFMP BE #3, Test 7
Time (min)
0 5 10 15 20 25 30
Tem
pera
ture
(C)
0
50
100
150
200
Exp Time vs Vertical Cable Ts-35 Exp Time vs Vertical Cable Ts-31 CFAST Time vs Cable G31 Temp CFAST Time vs Cable G35 Temp
Figure A-51. Thermal Environment near Vertical Cable Tray G, ICFMP BE #3, Tests 1 and 7
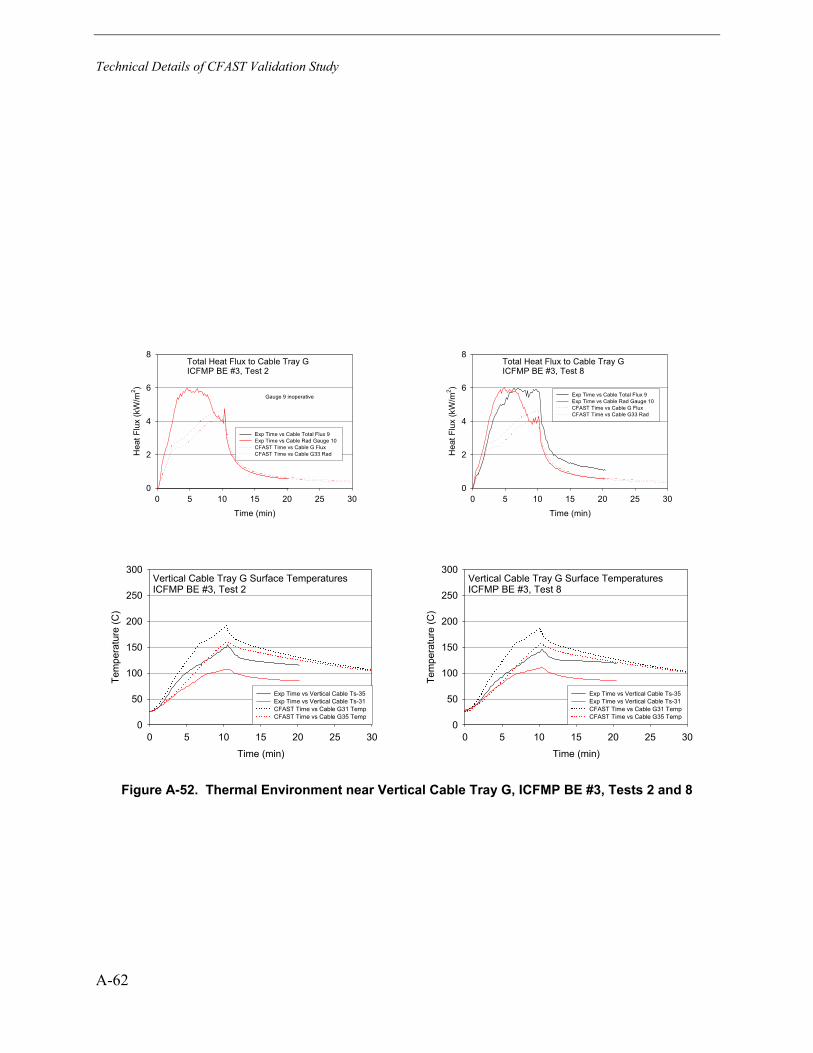
Technical Details of CFAST Validation Study
A-62
Total Heat Flux to Cable Tray GICFMP BE #3, Test 2
Time (min)
0 5 10 15 20 25 30
Hea
t Flu
x (k
W/m
2 )
0
2
4
6
8
Exp Time vs Cable Total Flux 9 Exp Time vs Cable Rad Gauge 10 CFAST Time vs Cable G Flux CFAST Time vs Cable G33 Rad
Gauge 9 inoperative
Total Heat Flux to Cable Tray GICFMP BE #3, Test 8
Time (min)
0 5 10 15 20 25 30
Hea
t Flu
x (k
W/m
2 )
0
2
4
6
8
Exp Time vs Cable Total Flux 9 Exp Time vs Cable Rad Gauge 10 CFAST Time vs Cable G Flux CFAST Time vs Cable G33 Rad
Vertical Cable Tray G Surface TemperaturesICFMP BE #3, Test 2
Time (min)
0 5 10 15 20 25 30
Tem
pera
ture
(C)
0
50
100
150
200
250
300
Exp Time vs Vertical Cable Ts-35 Exp Time vs Vertical Cable Ts-31 CFAST Time vs Cable G31 Temp CFAST Time vs Cable G35 Temp
Vertical Cable Tray G Surface TemperaturesICFMP BE #3, Test 8
Time (min)
0 5 10 15 20 25 30
Tem
pera
ture
(C)
0
50
100
150
200
250
300
Exp Time vs Vertical Cable Ts-35 Exp Time vs Vertical Cable Ts-31 CFAST Time vs Cable G31 Temp CFAST Time vs Cable G35 Temp
Figure A-52. Thermal Environment near Vertical Cable Tray G, ICFMP BE #3, Tests 2 and 8
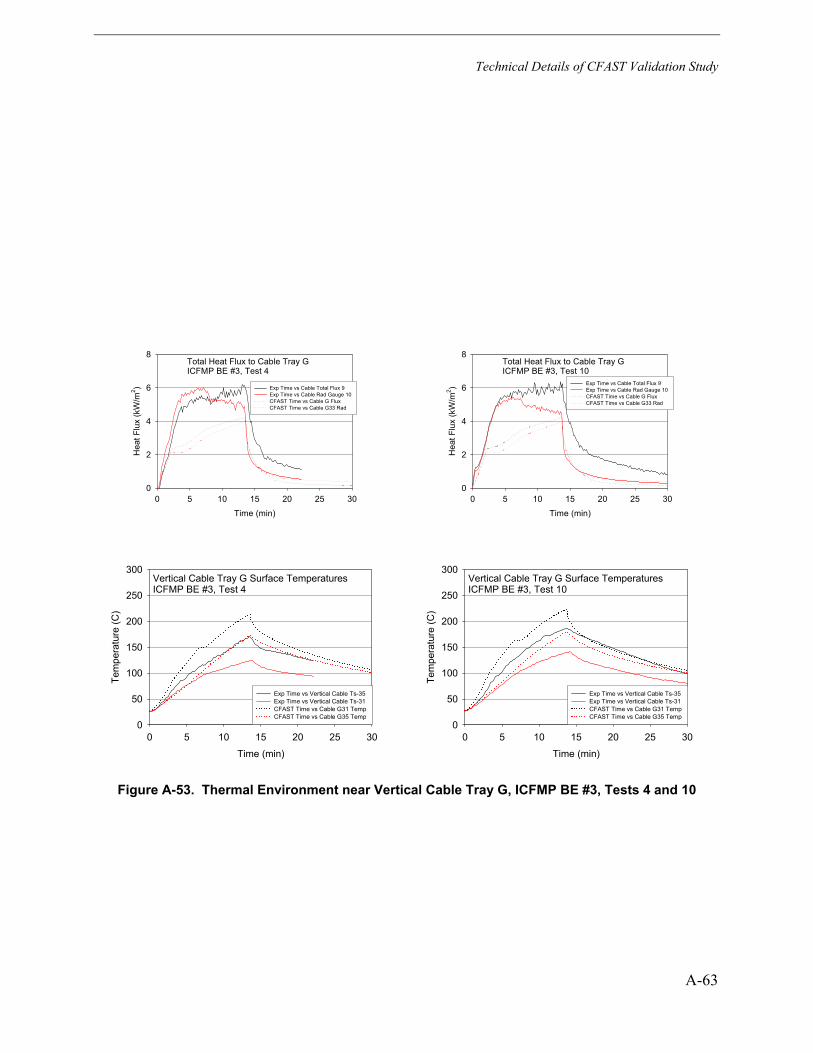
Technical Details of CFAST Validation Study
A-63
Total Heat Flux to Cable Tray GICFMP BE #3, Test 4
Time (min)
0 5 10 15 20 25 30
Hea
t Flu
x (k
W/m
2 )
0
2
4
6
8
Exp Time vs Cable Total Flux 9 Exp Time vs Cable Rad Gauge 10 CFAST Time vs Cable G Flux CFAST Time vs Cable G33 Rad
Total Heat Flux to Cable Tray GICFMP BE #3, Test 10
Time (min)
0 5 10 15 20 25 30
Hea
t Flu
x (k
W/m
2 )
0
2
4
6
8
Exp Time vs Cable Total Flux 9 Exp Time vs Cable Rad Gauge 10 CFAST Time vs Cable G Flux CFAST Time vs Cable G33 Rad
Vertical Cable Tray G Surface TemperaturesICFMP BE #3, Test 4
Time (min)
0 5 10 15 20 25 30
Tem
pera
ture
(C)
0
50
100
150
200
250
300
Exp Time vs Vertical Cable Ts-35 Exp Time vs Vertical Cable Ts-31 CFAST Time vs Cable G31 Temp CFAST Time vs Cable G35 Temp
Vertical Cable Tray G Surface TemperaturesICFMP BE #3, Test 10
Time (min)
0 5 10 15 20 25 30
Tem
pera
ture
(C)
0
50
100
150
200
250
300
Exp Time vs Vertical Cable Ts-35 Exp Time vs Vertical Cable Ts-31 CFAST Time vs Cable G31 Temp CFAST Time vs Cable G35 Temp
Figure A-53. Thermal Environment near Vertical Cable Tray G, ICFMP BE #3, Tests 4 and 10
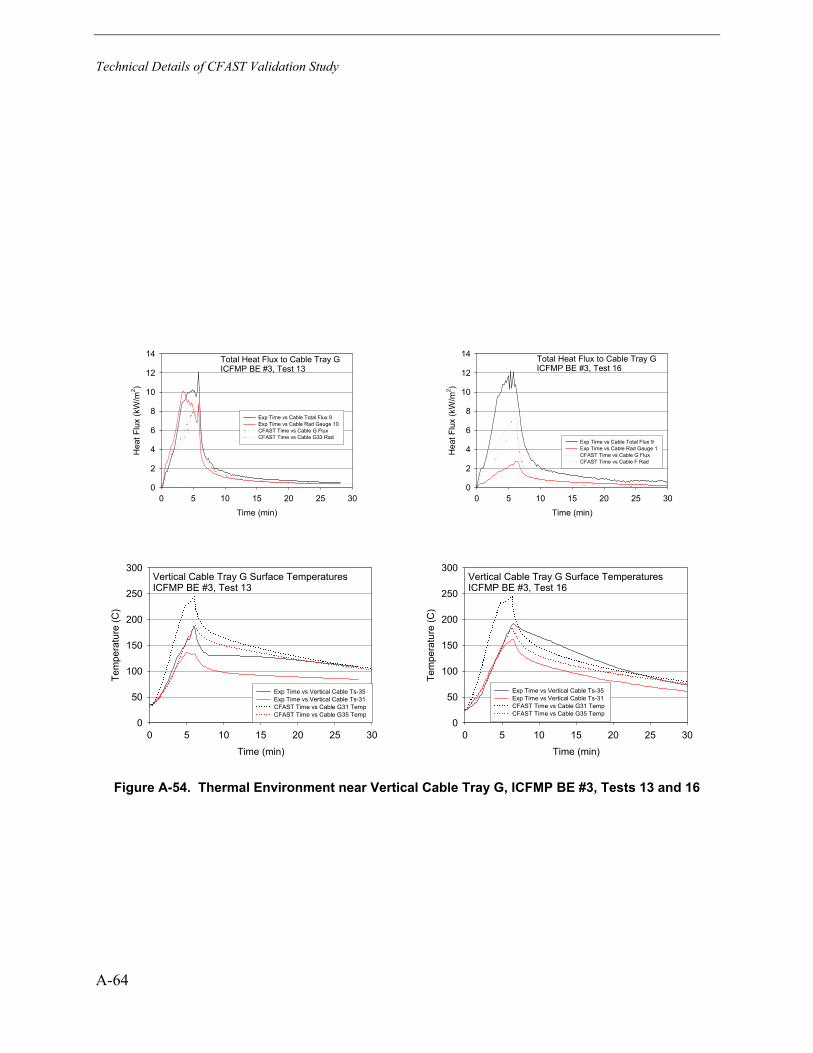
Technical Details of CFAST Validation Study
A-64
Total Heat Flux to Cable Tray GICFMP BE #3, Test 13
Time (min)
0 5 10 15 20 25 30
Hea
t Flu
x (k
W/m
2 )
0
2
4
6
8
10
12
14
Exp Time vs Cable Total Flux 9 Exp Time vs Cable Rad Gauge 10 CFAST Time vs Cable G Flux CFAST Time vs Cable G33 Rad
Total Heat Flux to Cable Tray GICFMP BE #3, Test 16
Time (min)
0 5 10 15 20 25 30
Hea
t Flu
x (k
W/m
2 )
0
2
4
6
8
10
12
14
Exp Time vs Cable Total Flux 9 Exp Time vs Cable Rad Gauge 1 CFAST Time vs Cable G Flux CFAST Time vs Cable F Rad
Vertical Cable Tray G Surface TemperaturesICFMP BE #3, Test 13
Time (min)
0 5 10 15 20 25 30
Tem
pera
ture
(C)
0
50
100
150
200
250
300
Exp Time vs Vertical Cable Ts-35 Exp Time vs Vertical Cable Ts-31 CFAST Time vs Cable G31 Temp CFAST Time vs Cable G35 Temp
Vertical Cable Tray G Surface TemperaturesICFMP BE #3, Test 16
Time (min)
0 5 10 15 20 25 30
Tem
pera
ture
(C)
0
50
100
150
200
250
300
Exp Time vs Vertical Cable Ts-35 Exp Time vs Vertical Cable Ts-31 CFAST Time vs Cable G31 Temp CFAST Time vs Cable G35 Temp
Figure A-54. Thermal Environment near Vertical Cable Tray G, ICFMP BE #3, Tests 13 and 16
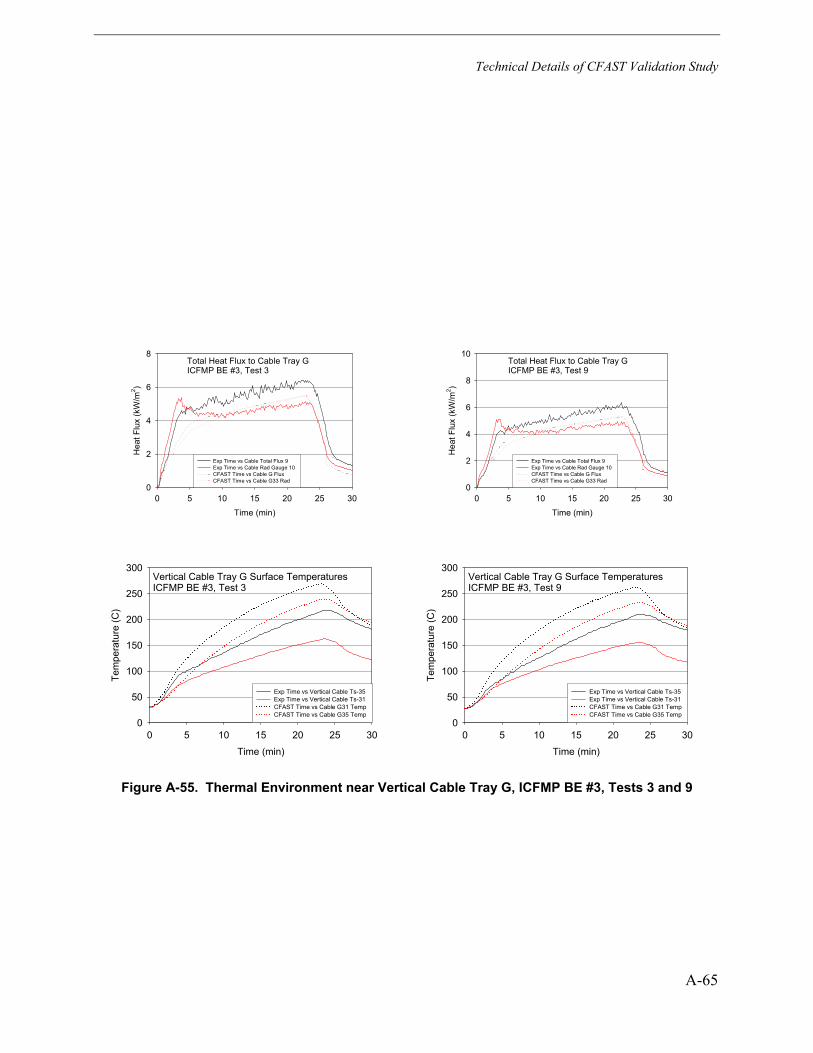
Technical Details of CFAST Validation Study
A-65
Total Heat Flux to Cable Tray GICFMP BE #3, Test 3
Time (min)
0 5 10 15 20 25 30
Hea
t Flu
x (k
W/m
2 )
0
2
4
6
8
Exp Time vs Cable Total Flux 9 Exp Time vs Cable Rad Gauge 10 CFAST Time vs Cable G Flux CFAST Time vs Cable G33 Rad
Total Heat Flux to Cable Tray GICFMP BE #3, Test 9
Time (min)
0 5 10 15 20 25 30
Hea
t Flu
x (k
W/m
2 )
0
2
4
6
8
10
Exp Time vs Cable Total Flux 9 Exp Time vs Cable Rad Gauge 10 CFAST Time vs Cable G Flux CFAST Time vs Cable G33 Rad
Vertical Cable Tray G Surface TemperaturesICFMP BE #3, Test 3
Time (min)
0 5 10 15 20 25 30
Tem
pera
ture
(C)
0
50
100
150
200
250
300
Exp Time vs Vertical Cable Ts-35 Exp Time vs Vertical Cable Ts-31 CFAST Time vs Cable G31 Temp CFAST Time vs Cable G35 Temp
Vertical Cable Tray G Surface TemperaturesICFMP BE #3, Test 9
Time (min)
0 5 10 15 20 25 30
Tem
pera
ture
(C)
0
50
100
150
200
250
300
Exp Time vs Vertical Cable Ts-35 Exp Time vs Vertical Cable Ts-31 CFAST Time vs Cable G31 Temp CFAST Time vs Cable G35 Temp
Figure A-55. Thermal Environment near Vertical Cable Tray G, ICFMP BE #3, Tests 3 and 9
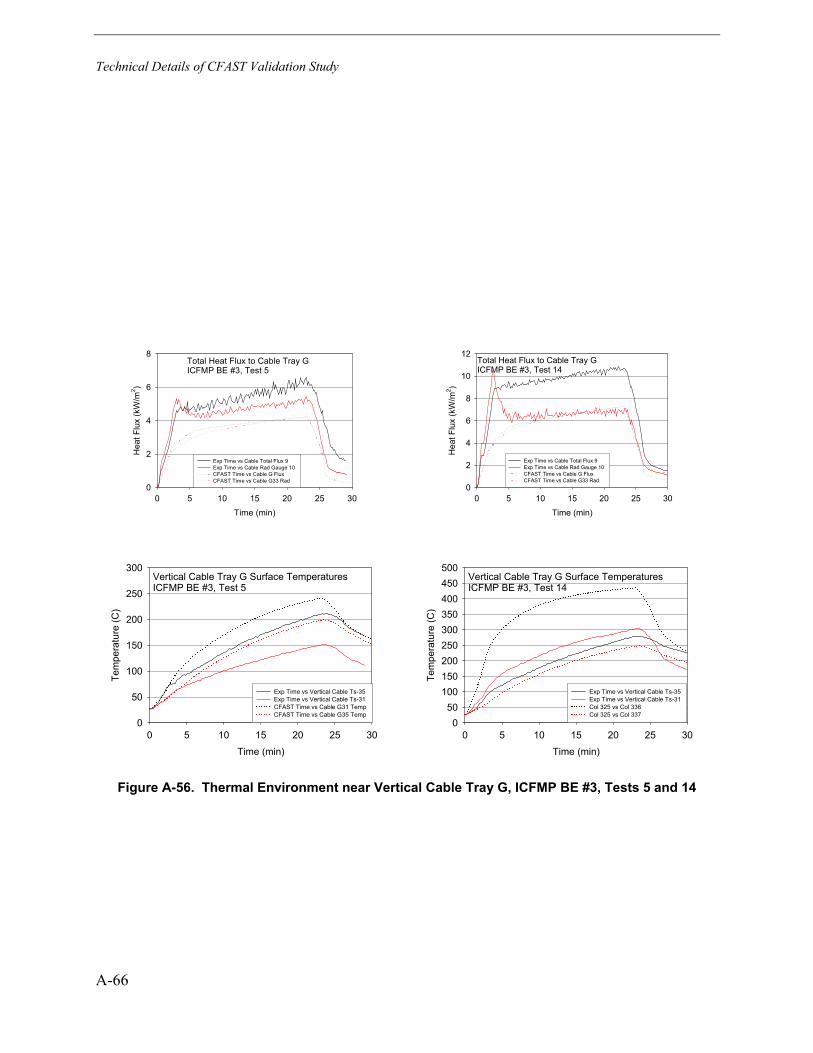
Technical Details of CFAST Validation Study
A-66
Total Heat Flux to Cable Tray GICFMP BE #3, Test 5
Time (min)
0 5 10 15 20 25 30
Hea
t Flu
x (k
W/m
2 )
0
2
4
6
8
Exp Time vs Cable Total Flux 9 Exp Time vs Cable Rad Gauge 10 CFAST Time vs Cable G Flux CFAST Time vs Cable G33 Rad
Total Heat Flux to Cable Tray GICFMP BE #3, Test 14
Time (min)
0 5 10 15 20 25 30
Hea
t Flu
x (k
W/m
2 )
0
2
4
6
8
10
12
Exp Time vs Cable Total Flux 9 Exp Time vs Cable Rad Gauge 10 CFAST Time vs Cable G Flux CFAST Time vs Cable G33 Rad
Vertical Cable Tray G Surface TemperaturesICFMP BE #3, Test 5
Time (min)
0 5 10 15 20 25 30
Tem
pera
ture
(C)
0
50
100
150
200
250
300
Exp Time vs Vertical Cable Ts-35 Exp Time vs Vertical Cable Ts-31 CFAST Time vs Cable G31 Temp CFAST Time vs Cable G35 Temp
Vertical Cable Tray G Surface TemperaturesICFMP BE #3, Test 14
Time (min)
0 5 10 15 20 25 30
Tem
pera
ture
(C)
050
100150200250300350400450500
Exp Time vs Vertical Cable Ts-35 Exp Time vs Vertical Cable Ts-31 Col 325 vs Col 336 Col 325 vs Col 337
Figure A-56. Thermal Environment near Vertical Cable Tray G, ICFMP BE #3, Tests 5 and 14
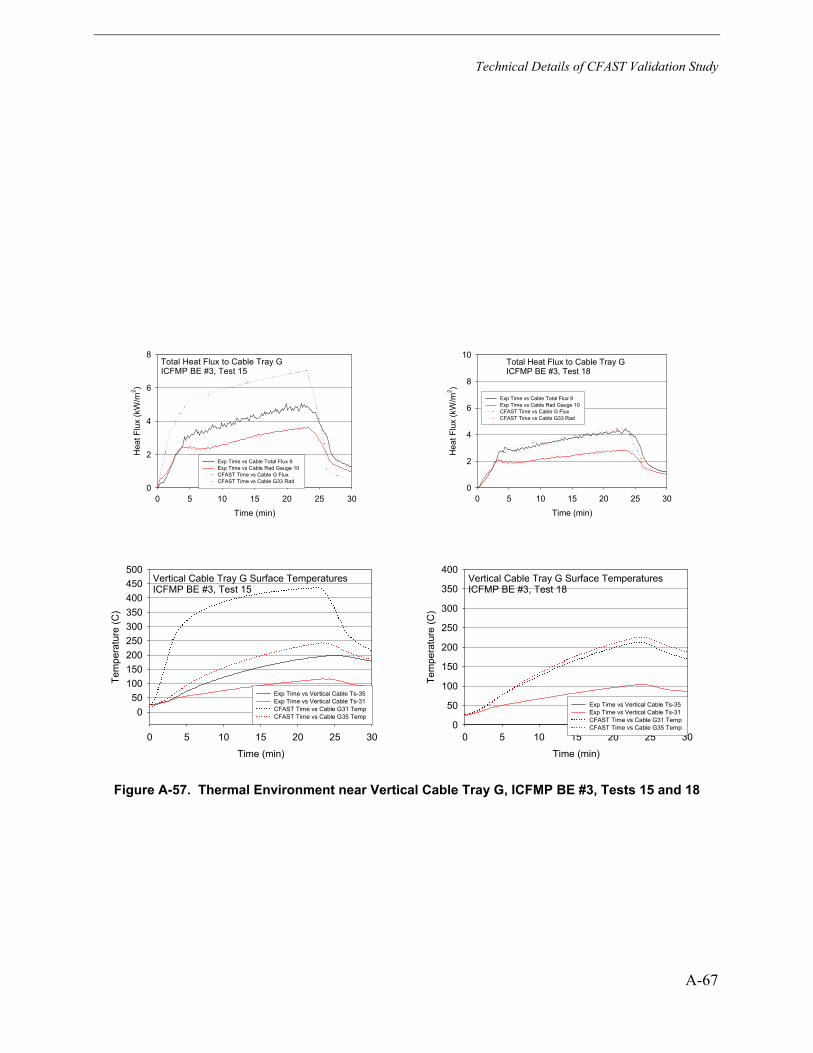
Technical Details of CFAST Validation Study
A-67
Total Heat Flux to Cable Tray GICFMP BE #3, Test 15
Time (min)
0 5 10 15 20 25 30
Hea
t Flu
x (k
W/m
2 )
0
2
4
6
8
Exp Time vs Cable Total Flux 9 Exp Time vs Cable Rad Gauge 10 CFAST Time vs Cable G Flux CFAST Time vs Cable G33 Rad
Total Heat Flux to Cable Tray GICFMP BE #3, Test 18
Time (min)
0 5 10 15 20 25 30
Hea
t Flu
x (k
W/m
2 )
0
2
4
6
8
10
Exp Time vs Cable Total Flux 9 Exp Time vs Cable Rad Gauge 10 CFAST Time vs Cable G Flux CFAST Time vs Cable G33 Rad
Vertical Cable Tray G Surface TemperaturesICFMP BE #3, Test 15
Time (min)
0 5 10 15 20 25 30
Tem
pera
ture
(C)
050
100150200250300350400450500
Exp Time vs Vertical Cable Ts-35 Exp Time vs Vertical Cable Ts-31 CFAST Time vs Cable G31 Temp CFAST Time vs Cable G35 Temp
Vertical Cable Tray G Surface TemperaturesICFMP BE #3, Test 18
Time (min)
0 5 10 15 20 25 30
Tem
pera
ture
(C)
0
50
100
150
200
250
300
350
400
Exp Time vs Vertical Cable Ts-35 Exp Time vs Vertical Cable Ts-31 CFAST Time vs Cable G31 Temp CFAST Time vs Cable G35 Temp
Figure A-57. Thermal Environment near Vertical Cable Tray G, ICFMP BE #3, Tests 15 and 18
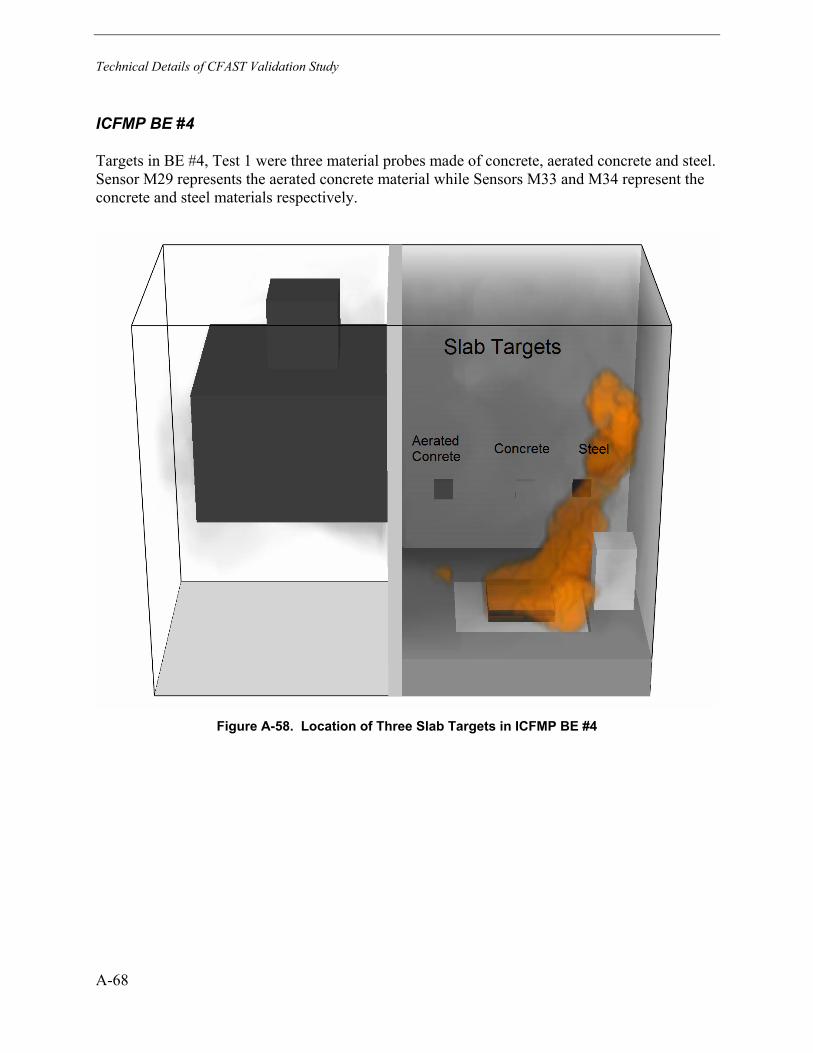
Technical Details of CFAST Validation Study
A-68
ICFMP BE #4
Targets in BE #4, Test 1 were three material probes made of concrete, aerated concrete and steel. Sensor M29 represents the aerated concrete material while Sensors M33 and M34 represent the concrete and steel materials respectively.
Figure A-58. Location of Three Slab Targets in ICFMP BE #4
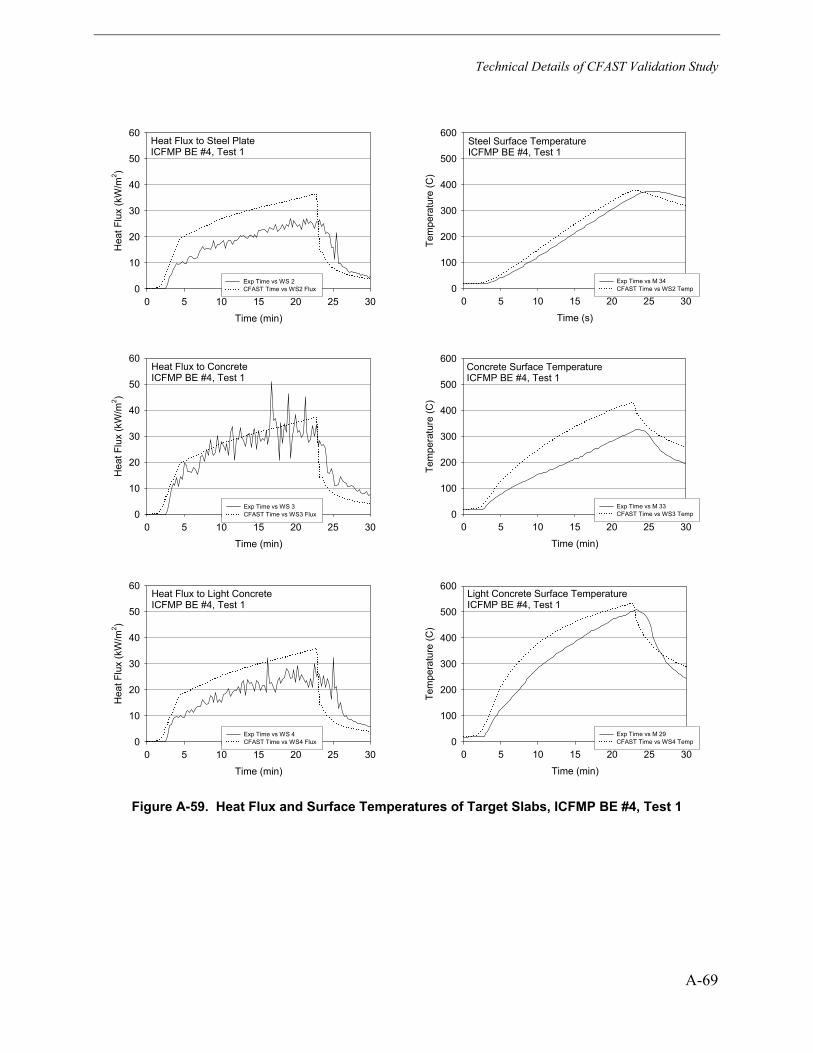
Technical Details of CFAST Validation Study
A-69
Heat Flux to Steel PlateICFMP BE #4, Test 1
Time (min)
0 5 10 15 20 25 30
Hea
t Flu
x (k
W/m
2 )
0
10
20
30
40
50
60
Exp Time vs WS 2 CFAST Time vs WS2 Flux
Steel Surface TemperatureICFMP BE #4, Test 1
Time (s)
0 5 10 15 20 25 30
Tem
pera
ture
(C)
0
100
200
300
400
500
600
Exp Time vs M 34 CFAST Time vs WS2 Temp
Heat Flux to ConcreteICFMP BE #4, Test 1
Time (min)
0 5 10 15 20 25 30
Hea
t Flu
x (k
W/m
2 )
0
10
20
30
40
50
60
Exp Time vs WS 3 CFAST Time vs WS3 Flux
Concrete Surface TemperatureICFMP BE #4, Test 1
Time (min)
0 5 10 15 20 25 30
Tem
pera
ture
(C)
0
100
200
300
400
500
600
Exp Time vs M 33 CFAST Time vs WS3 Temp
Heat Flux to Light ConcreteICFMP BE #4, Test 1
Time (min)
0 5 10 15 20 25 30
Hea
t Flu
x (k
W/m
2 )
0
10
20
30
40
50
60
Exp Time vs WS 4 CFAST Time vs WS4 Flux
Light Concrete Surface TemperatureICFMP BE #4, Test 1
Time (min)
0 5 10 15 20 25 30
Tem
pera
ture
(C)
0
100
200
300
400
500
600
Exp Time vs M 29 CFAST Time vs WS4 Temp
Figure A-59. Heat Flux and Surface Temperatures of Target Slabs, ICFMP BE #4, Test 1

Technical Details of CFAST Validation Study
A-70
ICFMP BE #5
A vertical cable tray was positioned near a wall opposite the fire. Heat flux gauges were inserted in between two bundles of cables (one containing power cables, and the other containing control cables). The following pages present plots of the gas temperature, heat flux, and cable surface temperatures at three vertical locations along the tray.
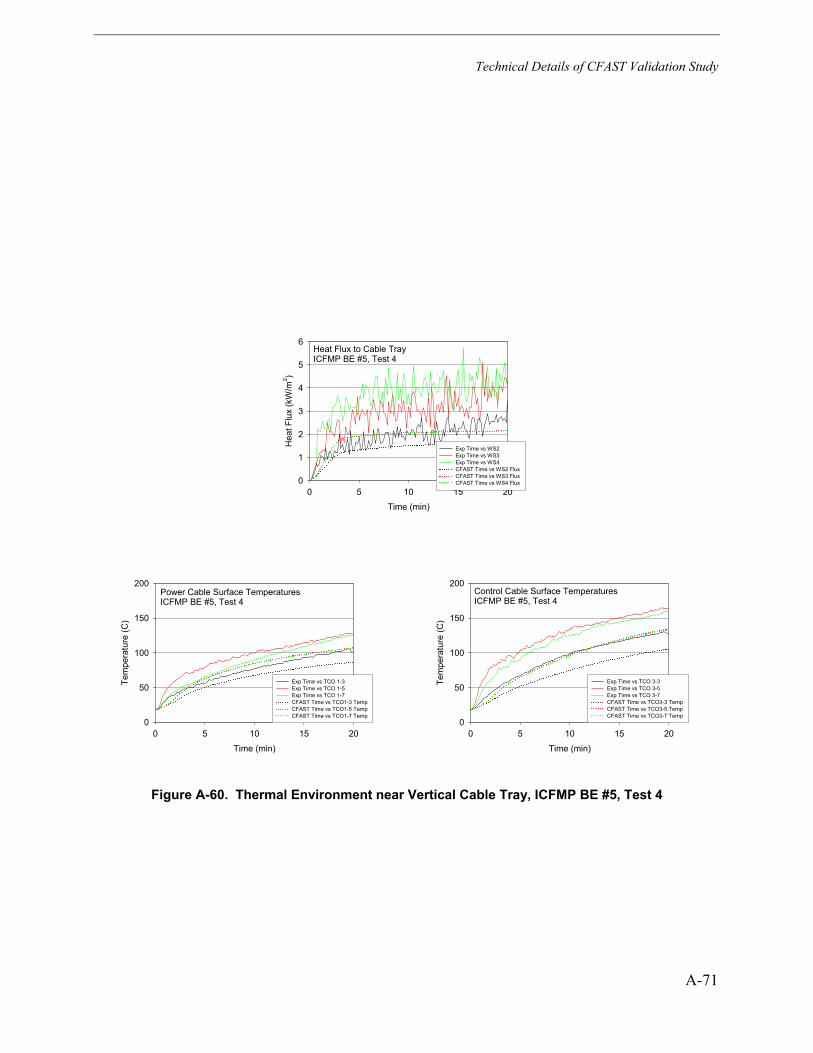
Technical Details of CFAST Validation Study
A-71
Heat Flux to Cable TrayICFMP BE #5, Test 4
Time (min)
0 5 10 15 20
Hea
t Flu
x (k
W/m
2 )
0
1
2
3
4
5
6
Exp Time vs WS2 Exp Time vs WS3 Exp Time vs WS4 CFAST Time vs WS2 Flux CFAST Time vs WS3 Flux CFAST Time vs WS4 Flux
Power Cable Surface TemperaturesICFMP BE #5, Test 4
Time (min)
0 5 10 15 20
Tem
pera
ture
(C)
0
50
100
150
200
Exp Time vs TCO 1-3 Exp Time vs TCO 1-5 Exp Time vs TCO 1-7 CFAST Time vs TCO1-3 Temp CFAST Time vs TCO1-5 Temp CFAST Time vs TCO1-7 Temp
Control Cable Surface TemperaturesICFMP BE #5, Test 4
Time (min)
0 5 10 15 20
Tem
pera
ture
(C)
0
50
100
150
200
Exp Time vs TCO 3-3 Exp Time vs TCO 3-5 Exp Time vs TCO 3-7 CFAST Time vs TCO3-3 Temp CFAST Time vs TCO3-5 Temp CFAST Time vs TCO3-7 Temp
Figure A-60. Thermal Environment near Vertical Cable Tray, ICFMP BE #5, Test 4
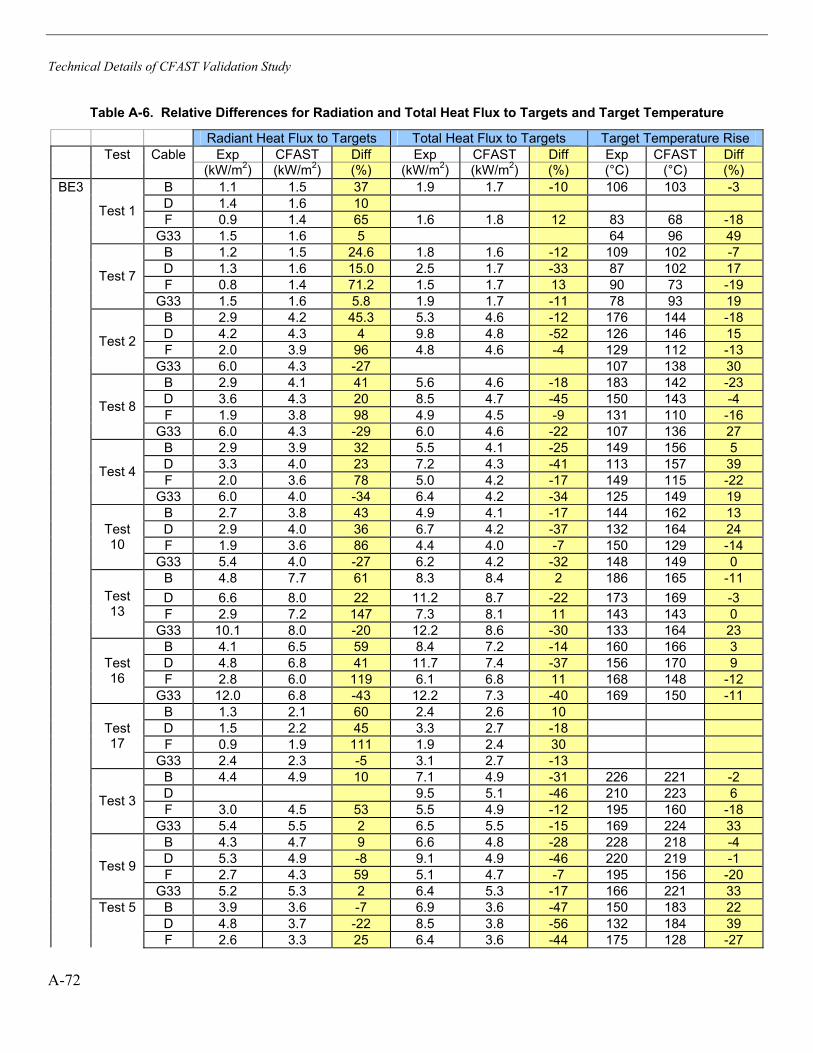
Technical Details of CFAST Validation Study
A-72
Table A-6. Relative Differences for Radiation and Total Heat Flux to Targets and Target Temperature
Radiant Heat Flux to Targets Total Heat Flux to Targets Target Temperature Rise Test Cable Exp CFAST Diff Exp CFAST Diff Exp CFAST Diff (kW/m2) (kW/m2) (%) (kW/m2) (kW/m2) (%) (°C) (°C) (%)
BE3 B 1.1 1.5 37 1.9 1.7 -10 106 103 -3 D 1.4 1.6 10 F 0.9 1.4 65 1.6 1.8 12 83 68 -18
Test 1
G33 1.5 1.6 5 64 96 49 B 1.2 1.5 24.6 1.8 1.6 -12 109 102 -7 D 1.3 1.6 15.0 2.5 1.7 -33 87 102 17 F 0.8 1.4 71.2 1.5 1.7 13 90 73 -19
Test 7
G33 1.5 1.6 5.8 1.9 1.7 -11 78 93 19 B 2.9 4.2 45.3 5.3 4.6 -12 176 144 -18 D 4.2 4.3 4 9.8 4.8 -52 126 146 15 F 2.0 3.9 96 4.8 4.6 -4 129 112 -13
Test 2
G33 6.0 4.3 -27 107 138 30 B 2.9 4.1 41 5.6 4.6 -18 183 142 -23 D 3.6 4.3 20 8.5 4.7 -45 150 143 -4 F 1.9 3.8 98 4.9 4.5 -9 131 110 -16
Test 8
G33 6.0 4.3 -29 6.0 4.6 -22 107 136 27 B 2.9 3.9 32 5.5 4.1 -25 149 156 5 D 3.3 4.0 23 7.2 4.3 -41 113 157 39 F 2.0 3.6 78 5.0 4.2 -17 149 115 -22
Test 4
G33 6.0 4.0 -34 6.4 4.2 -34 125 149 19 B 2.7 3.8 43 4.9 4.1 -17 144 162 13 D 2.9 4.0 36 6.7 4.2 -37 132 164 24 F 1.9 3.6 86 4.4 4.0 -7 150 129 -14
Test 10
G33 5.4 4.0 -27 6.2 4.2 -32 148 149 0 B 4.8 7.7 61 8.3 8.4 2 186 165 -11 D 6.6 8.0 22 11.2 8.7 -22 173 169 -3 F 2.9 7.2 147 7.3 8.1 11 143 143 0
Test 13
G33 10.1 8.0 -20 12.2 8.6 -30 133 164 23 B 4.1 6.5 59 8.4 7.2 -14 160 166 3 D 4.8 6.8 41 11.7 7.4 -37 156 170 9 F 2.8 6.0 119 6.1 6.8 11 168 148 -12
Test 16
G33 12.0 6.8 -43 12.2 7.3 -40 169 150 -11 B 1.3 2.1 60 2.4 2.6 10 D 1.5 2.2 45 3.3 2.7 -18 F 0.9 1.9 111 1.9 2.4 30
Test 17
G33 2.4 2.3 -5 3.1 2.7 -13 B 4.4 4.9 10 7.1 4.9 -31 226 221 -2 D 9.5 5.1 -46 210 223 6 F 3.0 4.5 53 5.5 4.9 -12 195 160 -18
Test 3
G33 5.4 5.5 2 6.5 5.5 -15 169 224 33 B 4.3 4.7 9 6.6 4.8 -28 228 218 -4 D 5.3 4.9 -8 9.1 4.9 -46 220 219 -1 F 2.7 4.3 59 5.1 4.7 -7 195 156 -20
Test 9
G33 5.2 5.3 2 6.4 5.3 -17 166 221 33 B 3.9 3.6 -7 6.9 3.6 -47 150 183 22 D 4.8 3.7 -22 8.5 3.8 -56 132 184 39
Test 5
F 2.6 3.3 25 6.4 3.6 -44 175 128 -27
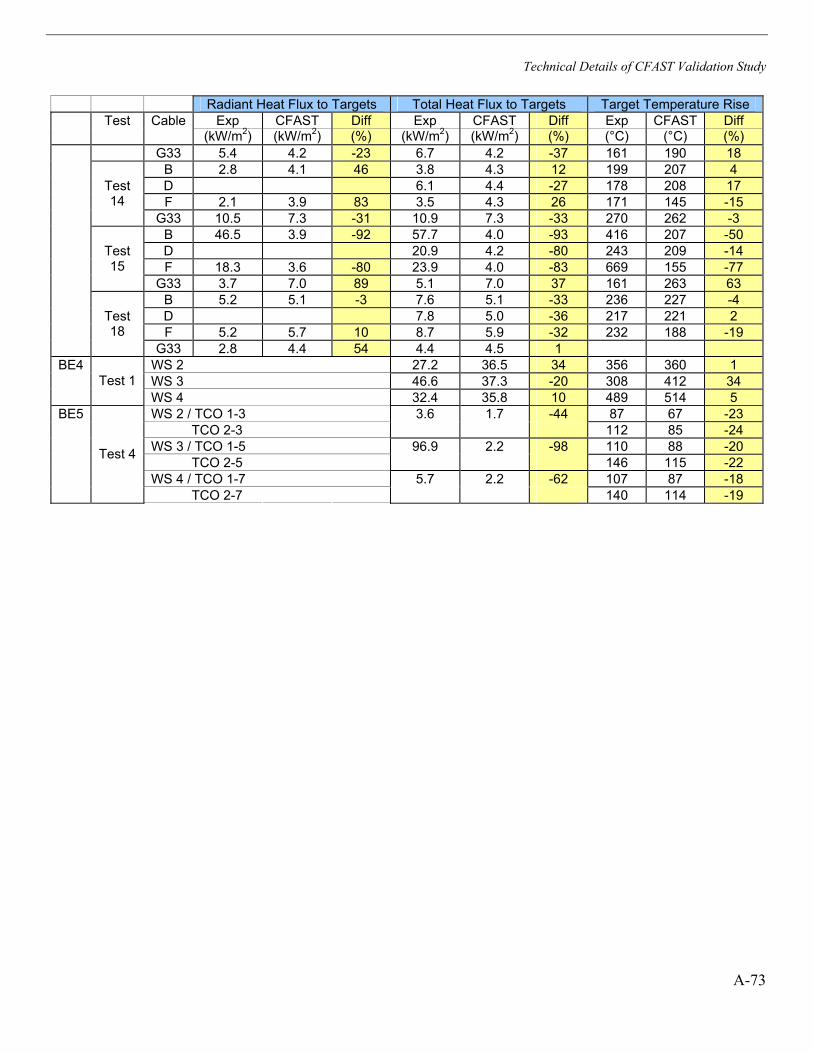
Technical Details of CFAST Validation Study
A-73
Radiant Heat Flux to Targets Total Heat Flux to Targets Target Temperature Rise Test Cable Exp CFAST Diff Exp CFAST Diff Exp CFAST Diff (kW/m2) (kW/m2) (%) (kW/m2) (kW/m2) (%) (°C) (°C) (%) G33 5.4 4.2 -23 6.7 4.2 -37 161 190 18 B 2.8 4.1 46 3.8 4.3 12 199 207 4 D 6.1 4.4 -27 178 208 17 F 2.1 3.9 83 3.5 4.3 26 171 145 -15
Test 14
G33 10.5 7.3 -31 10.9 7.3 -33 270 262 -3 B 46.5 3.9 -92 57.7 4.0 -93 416 207 -50 D 20.9 4.2 -80 243 209 -14 F 18.3 3.6 -80 23.9 4.0 -83 669 155 -77
Test 15
G33 3.7 7.0 89 5.1 7.0 37 161 263 63 B 5.2 5.1 -3 7.6 5.1 -33 236 227 -4 D 7.8 5.0 -36 217 221 2 F 5.2 5.7 10 8.7 5.9 -32 232 188 -19
Test 18
G33 2.8 4.4 54 4.4 4.5 1 BE4 WS 2 27.2 36.5 34 356 360 1
WS 3 46.6 37.3 -20 308 412 34
Test 1 WS 4 32.4 35.8 10 489 514 5
BE5 WS 2 / TCO 1-3 3.6 1.7 -44 87 67 -23 TCO 2-3 112 85 -24 WS 3 / TCO 1-5 96.9 2.2 -98 110 88 -20 TCO 2-5 146 115 -22 WS 4 / TCO 1-7 5.7 2.2 -62 107 87 -18
Test 4
TCO 2-7 140 114 -19
Technical Details of CFAST Validation Study
A-74
A.9 Heat Flux and Surface Temperature of Compartment Walls
Heat fluxes and surfaces temperatures at compartment walls, floor, and ceiling are available from ICFMP BE #3. This category is similar to that of the previous section, “Heat Flux and Surface Temperature of Targets,” with the exception that the focus here is on compartment walls, ceilings, and floors.
ICFMP BE #3
Thirty-six heat flux gauges were positioned at various locations on all four walls of the compartment, plus the ceiling and floor. Comparisons between measured and predicted heat fluxes and surface temperatures are shown on the following pages for a selected number of locations. More than half of the measurement points were in roughly the same relative location to the fire and hence the measurements and predictions were similar. For this reason, data for the east and north walls are shown because the data from the south and west walls are comparable. Data from the south wall are used in cases where the corresponding instrument on the north wall failed, or in cases where the fire was positioned close to the south wall. The heat flux gauges used on the compartment walls measured the net (not total) heat flux.
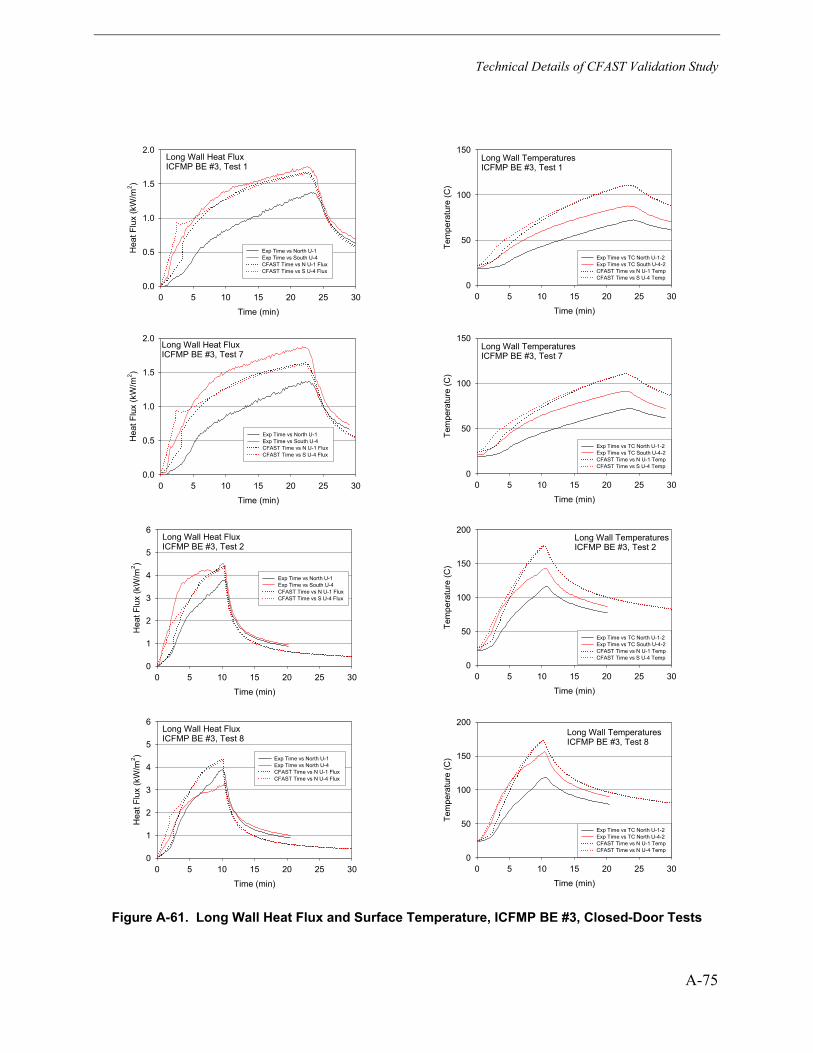
Technical Details of CFAST Validation Study
A-75
Long Wall Heat FluxICFMP BE #3, Test 1
Time (min)
0 5 10 15 20 25 30
Hea
t Flu
x (k
W/m
2 )
0.0
0.5
1.0
1.5
2.0
Exp Time vs North U-1 Exp Time vs South U-4 CFAST Time vs N U-1 Flux CFAST Time vs S U-4 Flux
Long Wall TemperaturesICFMP BE #3, Test 1
Time (min)
0 5 10 15 20 25 30
Tem
pera
ture
(C)
0
50
100
150
Exp Time vs TC North U-1-2 Exp Time vs TC South U-4-2 CFAST Time vs N U-1 Temp CFAST Time vs S U-4 Temp
Long Wall Heat FluxICFMP BE #3, Test 7
Time (min)
0 5 10 15 20 25 30
Hea
t Flu
x (k
W/m
2 )
0.0
0.5
1.0
1.5
2.0
Exp Time vs North U-1 Exp Time vs South U-4 CFAST Time vs N U-1 Flux CFAST Time vs S U-4 Flux
Long Wall TemperaturesICFMP BE #3, Test 7
Time (min)
0 5 10 15 20 25 30
Tem
pera
ture
(C)
0
50
100
150
Exp Time vs TC North U-1-2 Exp Time vs TC South U-4-2 CFAST Time vs N U-1 Temp CFAST Time vs S U-4 Temp
Long Wall Heat FluxICFMP BE #3, Test 2
Time (min)
0 5 10 15 20 25 30
Hea
t Flu
x (k
W/m
2 )
0
1
2
3
4
5
6
Exp Time vs North U-1 Exp Time vs South U-4 CFAST Time vs N U-1 Flux CFAST Time vs S U-4 Flux
Long Wall TemperaturesICFMP BE #3, Test 2
Time (min)
0 5 10 15 20 25 30
Tem
pera
ture
(C)
0
50
100
150
200
Exp Time vs TC North U-1-2 Exp Time vs TC South U-4-2 CFAST Time vs N U-1 Temp CFAST Time vs S U-4 Temp
Long Wall Heat FluxICFMP BE #3, Test 8
Time (min)
0 5 10 15 20 25 30
Hea
t Flu
x (k
W/m
2 )
0
1
2
3
4
5
6
Exp Time vs North U-1 Exp Time vs North U-4 CFAST Time vs N U-1 Flux CFAST Time vs N U-4 Flux
Long Wall TemperaturesICFMP BE #3, Test 8
Time (min)
0 5 10 15 20 25 30
Tem
pera
ture
(C)
0
50
100
150
200
Exp Time vs TC North U-1-2 Exp Time vs TC North U-4-2 CFAST Time vs N U-1 Temp CFAST Time vs N U-4 Temp
Figure A-61. Long Wall Heat Flux and Surface Temperature, ICFMP BE #3, Closed-Door Tests
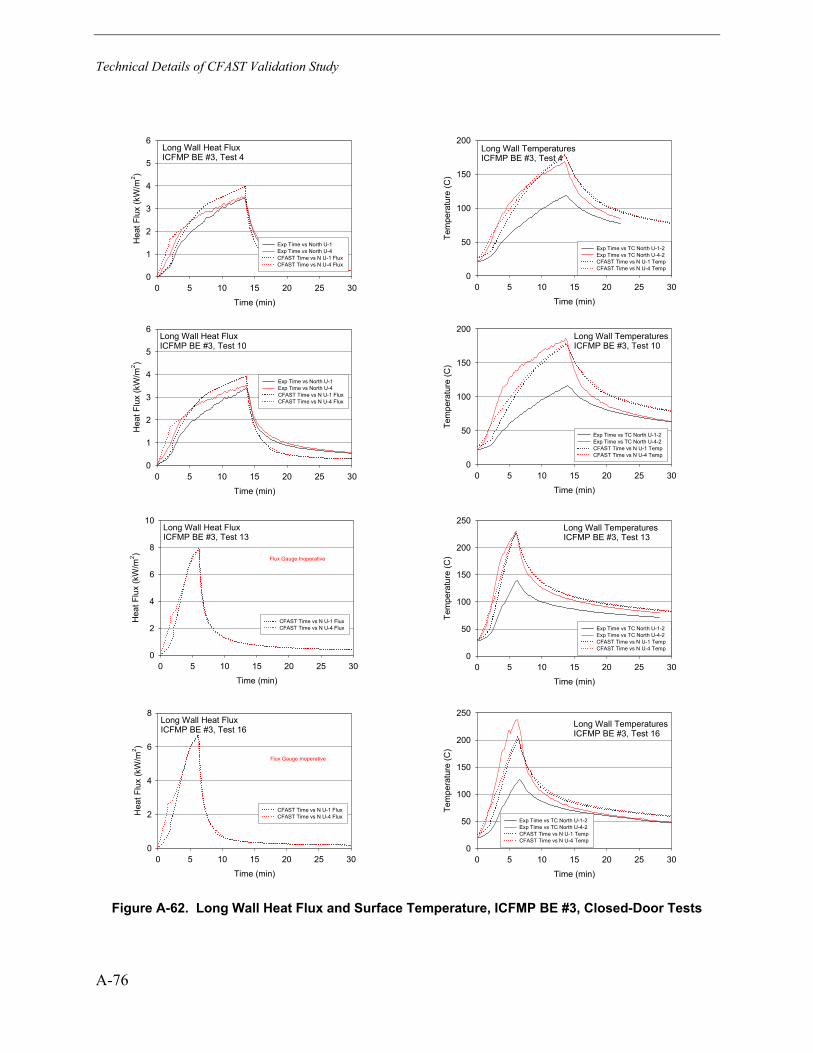
Technical Details of CFAST Validation Study
A-76
Long Wall Heat FluxICFMP BE #3, Test 4
Time (min)
0 5 10 15 20 25 30
Hea
t Flu
x (k
W/m
2 )
0
1
2
3
4
5
6
Exp Time vs North U-1 Exp Time vs North U-4 CFAST Time vs N U-1 Flux CFAST Time vs N U-4 Flux
Long Wall TemperaturesICFMP BE #3, Test 4
Time (min)
0 5 10 15 20 25 30
Tem
pera
ture
(C)
0
50
100
150
200
Exp Time vs TC North U-1-2 Exp Time vs TC North U-4-2 CFAST Time vs N U-1 Temp CFAST Time vs N U-4 Temp
Long Wall Heat FluxICFMP BE #3, Test 10
Time (min)
0 5 10 15 20 25 30
Hea
t Flu
x (k
W/m
2 )
0
1
2
3
4
5
6
Exp Time vs North U-1 Exp Time vs North U-4 CFAST Time vs N U-1 Flux CFAST Time vs N U-4 Flux
Long Wall TemperaturesICFMP BE #3, Test 10
Time (min)
0 5 10 15 20 25 30
Tem
pera
ture
(C)
0
50
100
150
200
Exp Time vs TC North U-1-2 Exp Time vs TC North U-4-2 CFAST Time vs N U-1 Temp CFAST Time vs N U-4 Temp
Long Wall Heat FluxICFMP BE #3, Test 13
Time (min)
0 5 10 15 20 25 30
Hea
t Flu
x (k
W/m
2 )
0
2
4
6
8
10
CFAST Time vs N U-1 Flux CFAST Time vs N U-4 Flux
Flux Gauge Inoperative
Long Wall TemperaturesICFMP BE #3, Test 13
Time (min)
0 5 10 15 20 25 30
Tem
pera
ture
(C)
0
50
100
150
200
250
Exp Time vs TC North U-1-2 Exp Time vs TC North U-4-2 CFAST Time vs N U-1 Temp CFAST Time vs N U-4 Temp
Long Wall Heat FluxICFMP BE #3, Test 16
Time (min)
0 5 10 15 20 25 30
Hea
t Flu
x (k
W/m
2 )
0
2
4
6
8
CFAST Time vs N U-1 Flux CFAST Time vs N U-4 Flux
Flux Gauge Inoperative
Long Wall TemperaturesICFMP BE #3, Test 16
Time (min)
0 5 10 15 20 25 30
Tem
pera
ture
(C)
0
50
100
150
200
250
Exp Time vs TC North U-1-2 Exp Time vs TC North U-4-2 CFAST Time vs N U-1 Temp CFAST Time vs N U-4 Temp
Figure A-62. Long Wall Heat Flux and Surface Temperature, ICFMP BE #3, Closed-Door Tests
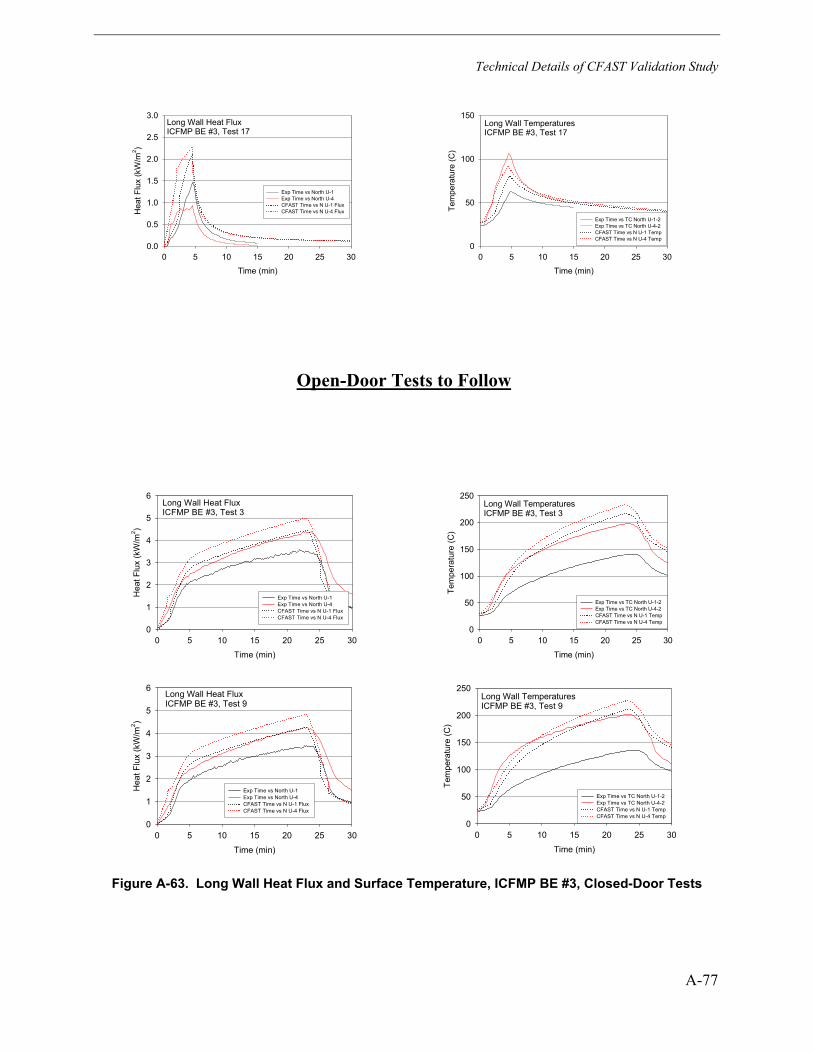
Technical Details of CFAST Validation Study
A-77
Long Wall Heat FluxICFMP BE #3, Test 17
Time (min)
0 5 10 15 20 25 30
Hea
t Flu
x (k
W/m
2 )
0.0
0.5
1.0
1.5
2.0
2.5
3.0
Exp Time vs North U-1 Exp Time vs North U-4 CFAST Time vs N U-1 Flux CFAST Time vs N U-4 Flux
Long Wall TemperaturesICFMP BE #3, Test 17
Time (min)
0 5 10 15 20 25 30
Tem
pera
ture
(C)
0
50
100
150
Exp Time vs TC North U-1-2 Exp Time vs TC North U-4-2 CFAST Time vs N U-1 Temp CFAST Time vs N U-4 Temp
Open-Door Tests to Follow
Long Wall Heat FluxICFMP BE #3, Test 3
Time (min)
0 5 10 15 20 25 30
Hea
t Flu
x (k
W/m
2 )
0
1
2
3
4
5
6
Exp Time vs North U-1 Exp Time vs North U-4 CFAST Time vs N U-1 Flux CFAST Time vs N U-4 Flux
Long Wall TemperaturesICFMP BE #3, Test 3
Time (min)
0 5 10 15 20 25 30
Tem
pera
ture
(C)
0
50
100
150
200
250
Exp Time vs TC North U-1-2 Exp Time vs TC North U-4-2 CFAST Time vs N U-1 Temp CFAST Time vs N U-4 Temp
Long Wall Heat FluxICFMP BE #3, Test 9
Time (min)
0 5 10 15 20 25 30
Hea
t Flu
x (k
W/m
2 )
0
1
2
3
4
5
6
Exp Time vs North U-1 Exp Time vs North U-4 CFAST Time vs N U-1 Flux CFAST Time vs N U-4 Flux
Long Wall TemperaturesICFMP BE #3, Test 9
Time (min)
0 5 10 15 20 25 30
Tem
pera
ture
(C)
0
50
100
150
200
250
Exp Time vs TC North U-1-2 Exp Time vs TC North U-4-2 CFAST Time vs N U-1 Temp CFAST Time vs N U-4 Temp
Figure A-63. Long Wall Heat Flux and Surface Temperature, ICFMP BE #3, Closed-Door Tests
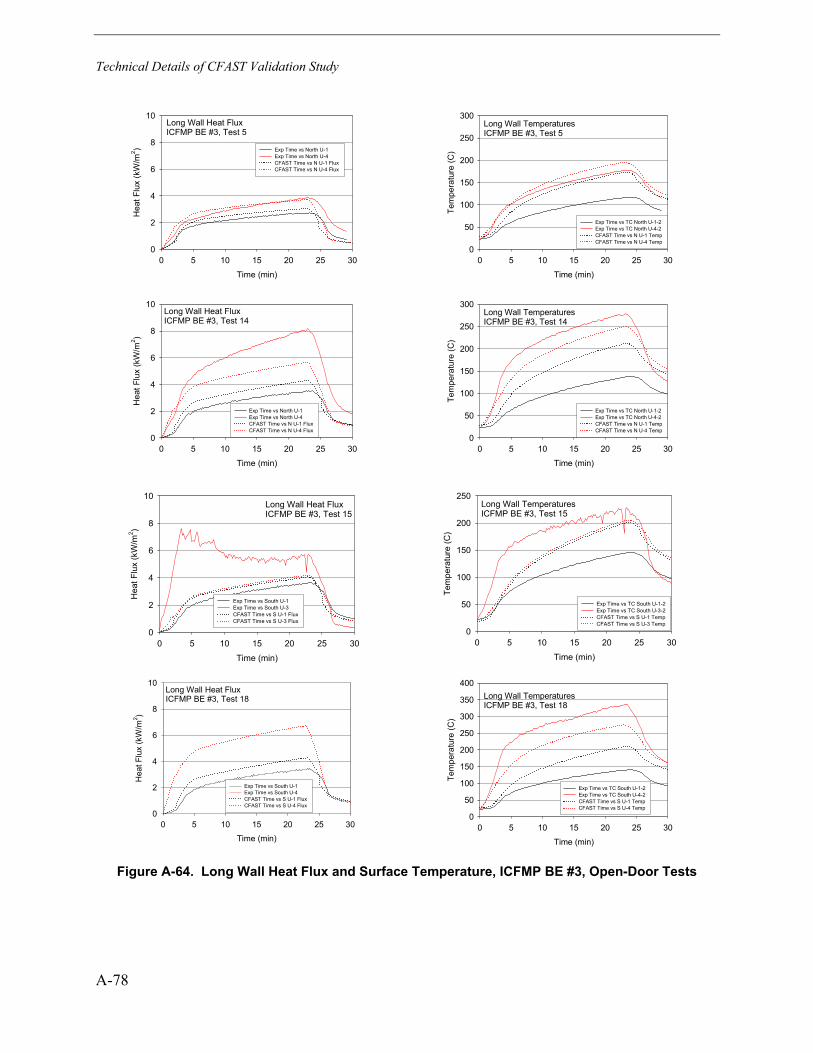
Technical Details of CFAST Validation Study
A-78
Long Wall Heat FluxICFMP BE #3, Test 5
Time (min)
0 5 10 15 20 25 30
Hea
t Flu
x (k
W/m
2 )
0
2
4
6
8
10
Exp Time vs North U-1 Exp Time vs North U-4 CFAST Time vs N U-1 Flux CFAST Time vs N U-4 Flux
Long Wall TemperaturesICFMP BE #3, Test 5
Time (min)
0 5 10 15 20 25 30
Tem
pera
ture
(C)
0
50
100
150
200
250
300
Exp Time vs TC North U-1-2 Exp Time vs TC North U-4-2 CFAST Time vs N U-1 Temp CFAST Time vs N U-4 Temp
Long Wall Heat FluxICFMP BE #3, Test 14
Time (min)
0 5 10 15 20 25 30
Hea
t Flu
x (k
W/m
2 )
0
2
4
6
8
10
Exp Time vs North U-1 Exp Time vs North U-4 CFAST Time vs N U-1 Flux CFAST Time vs N U-4 Flux
Long Wall TemperaturesICFMP BE #3, Test 14
Time (min)
0 5 10 15 20 25 30Te
mpe
ratu
re (C
)0
50
100
150
200
250
300
Exp Time vs TC North U-1-2 Exp Time vs TC North U-4-2 CFAST Time vs N U-1 Temp CFAST Time vs N U-4 Temp
Long Wall Heat FluxICFMP BE #3, Test 15
Time (min)
0 5 10 15 20 25 30
Hea
t Flu
x (k
W/m
2 )
0
2
4
6
8
10
Exp Time vs South U-1 Exp Time vs South U-3CFAST Time vs S U-1 Flux CFAST Time vs S U-3 Flux
Long Wall TemperaturesICFMP BE #3, Test 15
Time (min)
0 5 10 15 20 25 30
Tem
pera
ture
(C)
0
50
100
150
200
250
Exp Time vs TC South U-1-2 Exp Time vs TC South U-3-2 CFAST Time vs S U-1 Temp CFAST Time vs S U-3 Temp
Long Wall Heat FluxICFMP BE #3, Test 18
Time (min)
0 5 10 15 20 25 30
Hea
t Flu
x (k
W/m
2 )
0
2
4
6
8
10
Exp Time vs South U-1Exp Time vs South U-4 CFAST Time vs S U-1 Flux CFAST Time vs S U-4 Flux
Long Wall TemperaturesICFMP BE #3, Test 18
Time (min)
0 5 10 15 20 25 30
Tem
pera
ture
(C)
0
50
100
150
200
250
300
350
400
Exp Time vs TC South U-1-2 Exp Time vs TC South U-4-2 CFAST Time vs S U-1 Temp CFAST Time vs S U-4 Temp
Figure A-64. Long Wall Heat Flux and Surface Temperature, ICFMP BE #3, Open-Door Tests
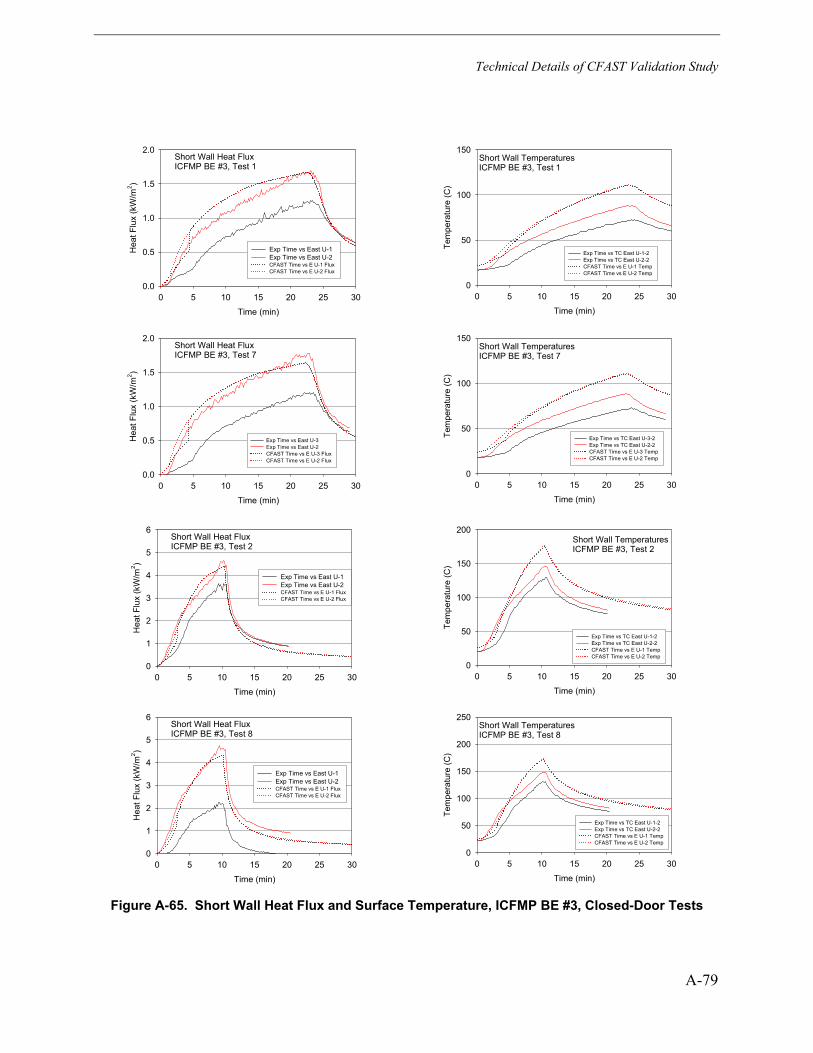
Technical Details of CFAST Validation Study
A-79
Short Wall Heat FluxICFMP BE #3, Test 1
Time (min)
0 5 10 15 20 25 30
Hea
t Flu
x (k
W/m
2 )
0.0
0.5
1.0
1.5
2.0
Exp Time vs East U-1 Exp Time vs East U-2 CFAST Time vs E U-1 Flux CFAST Time vs E U-2 Flux
Short Wall TemperaturesICFMP BE #3, Test 1
Time (min)
0 5 10 15 20 25 30
Tem
pera
ture
(C)
0
50
100
150
Exp Time vs TC East U-1-2 Exp Time vs TC East U-2-2 CFAST Time vs E U-1 Temp CFAST Time vs E U-2 Temp
Short Wall Heat FluxICFMP BE #3, Test 7
Time (min)
0 5 10 15 20 25 30
Hea
t Flu
x (k
W/m
2 )
0.0
0.5
1.0
1.5
2.0
Exp Time vs East U-3 Exp Time vs East U-2 CFAST Time vs E U-3 Flux CFAST Time vs E U-2 Flux
Short Wall TemperaturesICFMP BE #3, Test 7
Time (min)
0 5 10 15 20 25 30
Tem
pera
ture
(C)
0
50
100
150
Exp Time vs TC East U-3-2 Exp Time vs TC East U-2-2 CFAST Time vs E U-3 Temp CFAST Time vs E U-2 Temp
Short Wall Heat FluxICFMP BE #3, Test 2
Time (min)
0 5 10 15 20 25 30
Hea
t Flu
x (k
W/m
2 )
0
1
2
3
4
5
6
Exp Time vs East U-1 Exp Time vs East U-2 CFAST Time vs E U-1 Flux CFAST Time vs E U-2 Flux
Short Wall TemperaturesICFMP BE #3, Test 2
Time (min)
0 5 10 15 20 25 30
Tem
pera
ture
(C)
0
50
100
150
200
Exp Time vs TC East U-1-2 Exp Time vs TC East U-2-2 CFAST Time vs E U-1 Temp CFAST Time vs E U-2 Temp
Short Wall Heat FluxICFMP BE #3, Test 8
Time (min)
0 5 10 15 20 25 30
Hea
t Flu
x (k
W/m
2 )
0
1
2
3
4
5
6
Exp Time vs East U-1 Exp Time vs East U-2 CFAST Time vs E U-1 Flux CFAST Time vs E U-2 Flux
Short Wall TemperaturesICFMP BE #3, Test 8
Time (min)
0 5 10 15 20 25 30
Tem
pera
ture
(C)
0
50
100
150
200
250
Exp Time vs TC East U-1-2 Exp Time vs TC East U-2-2 CFAST Time vs E U-1 Temp CFAST Time vs E U-2 Temp
Figure A-65. Short Wall Heat Flux and Surface Temperature, ICFMP BE #3, Closed-Door Tests
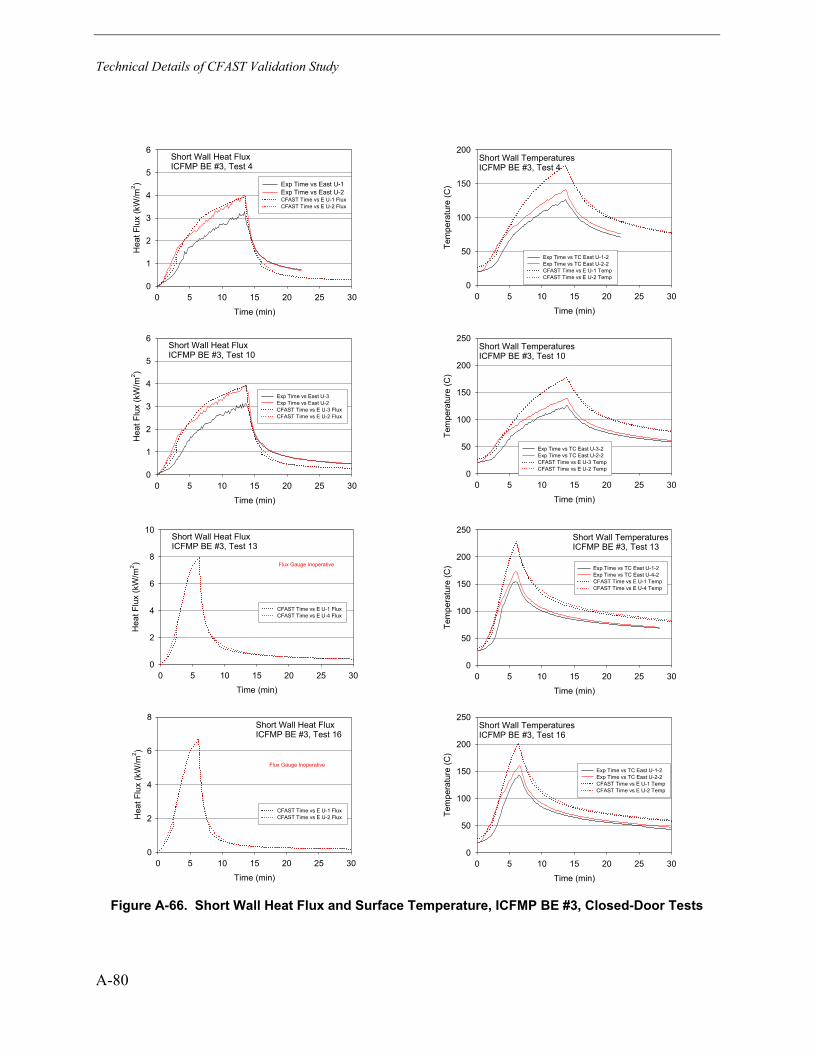
Technical Details of CFAST Validation Study
A-80
Short Wall Heat FluxICFMP BE #3, Test 4
Time (min)
0 5 10 15 20 25 30
Hea
t Flu
x (k
W/m
2 )
0
1
2
3
4
5
6
Exp Time vs East U-1 Exp Time vs East U-2 CFAST Time vs E U-1 Flux CFAST Time vs E U-2 Flux
Short Wall TemperaturesICFMP BE #3, Test 4
Time (min)
0 5 10 15 20 25 30
Tem
pera
ture
(C)
0
50
100
150
200
Exp Time vs TC East U-1-2 Exp Time vs TC East U-2-2 CFAST Time vs E U-1 Temp CFAST Time vs E U-2 Temp
Short Wall Heat FluxICFMP BE #3, Test 10
Time (min)
0 5 10 15 20 25 30
Hea
t Flu
x (k
W/m
2 )
0
1
2
3
4
5
6
Exp Time vs East U-3 Exp Time vs East U-2 CFAST Time vs E U-3 Flux CFAST Time vs E U-2 Flux
Short Wall TemperaturesICFMP BE #3, Test 10
Time (min)
0 5 10 15 20 25 30
Tem
pera
ture
(C)
0
50
100
150
200
250
Exp Time vs TC East U-3-2 Exp Time vs TC East U-2-2 CFAST Time vs E U-3 Temp CFAST Time vs E U-2 Temp
Short Wall Heat FluxICFMP BE #3, Test 13
Time (min)
0 5 10 15 20 25 30
Hea
t Flu
x (k
W/m
2 )
0
2
4
6
8
10
CFAST Time vs E U-1 Flux CFAST Time vs E U-4 Flux
Flux Gauge Inoperative
Short Wall TemperaturesICFMP BE #3, Test 13
Time (min)
0 5 10 15 20 25 30
Tem
pera
ture
(C)
0
50
100
150
200
250
Exp Time vs TC East U-1-2 Exp Time vs TC East U-4-2 CFAST Time vs E U-1 Temp CFAST Time vs E U-4 Temp
Short Wall Heat FluxICFMP BE #3, Test 16
Time (min)
0 5 10 15 20 25 30
Hea
t Flu
x (k
W/m
2 )
0
2
4
6
8
CFAST Time vs E U-1 Flux CFAST Time vs E U-2 Flux
Flux Gauge Inoperative
Short Wall TemperaturesICFMP BE #3, Test 16
Time (min)
0 5 10 15 20 25 30
Tem
pera
ture
(C)
0
50
100
150
200
250
Exp Time vs TC East U-1-2 Exp Time vs TC East U-2-2 CFAST Time vs E U-1 Temp CFAST Time vs E U-2 Temp
Figure A-66. Short Wall Heat Flux and Surface Temperature, ICFMP BE #3, Closed-Door Tests
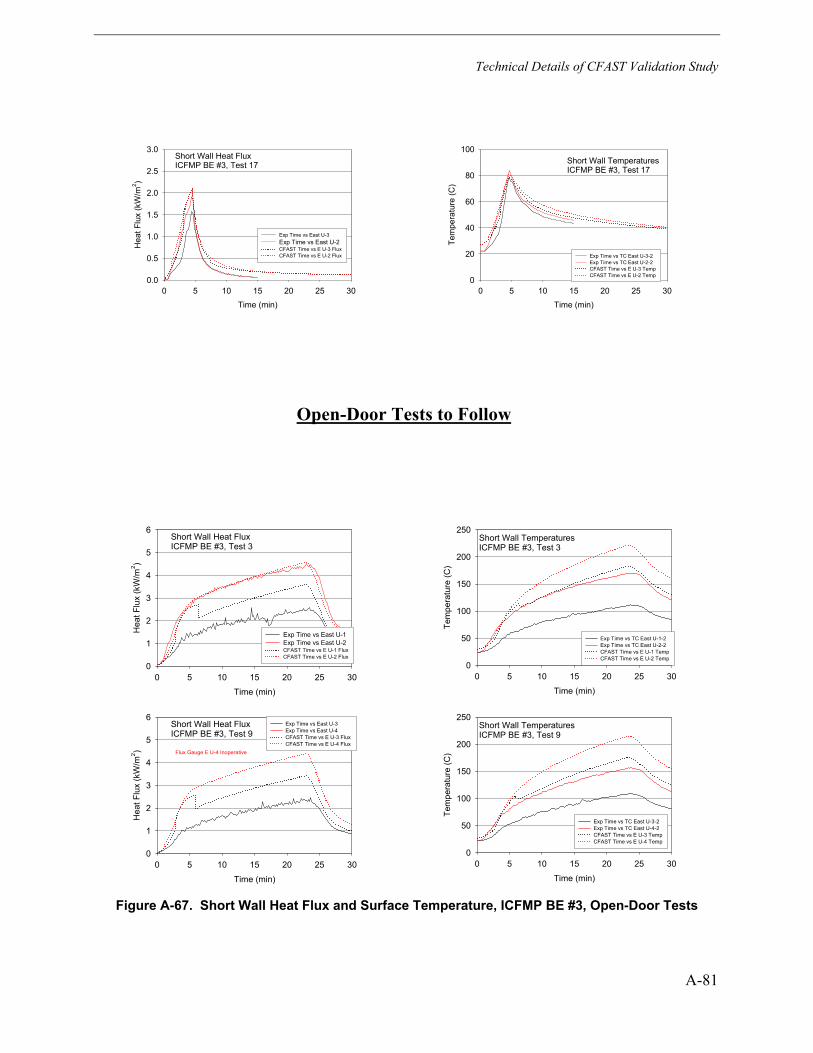
Technical Details of CFAST Validation Study
A-81
Short Wall Heat FluxICFMP BE #3, Test 17
Time (min)
0 5 10 15 20 25 30
Hea
t Flu
x (k
W/m
2 )
0.0
0.5
1.0
1.5
2.0
2.5
3.0
Exp Time vs East U-3 Exp Time vs East U-2 CFAST Time vs E U-3 Flux CFAST Time vs E U-2 Flux
Short Wall TemperaturesICFMP BE #3, Test 17
Time (min)
0 5 10 15 20 25 30
Tem
pera
ture
(C)
0
20
40
60
80
100
Exp Time vs TC East U-3-2 Exp Time vs TC East U-2-2 CFAST Time vs E U-3 Temp CFAST Time vs E U-2 Temp
Open-Door Tests to Follow
Short Wall Heat FluxICFMP BE #3, Test 3
Time (min)
0 5 10 15 20 25 30
Hea
t Flu
x (k
W/m
2 )
0
1
2
3
4
5
6
Exp Time vs East U-1 Exp Time vs East U-2 CFAST Time vs E U-1 Flux CFAST Time vs E U-2 Flux
Short Wall TemperaturesICFMP BE #3, Test 3
Time (min)
0 5 10 15 20 25 30
Tem
pera
ture
(C)
0
50
100
150
200
250
Exp Time vs TC East U-1-2 Exp Time vs TC East U-2-2 CFAST Time vs E U-1 Temp CFAST Time vs E U-2 Temp
Short Wall Heat FluxICFMP BE #3, Test 9
Time (min)
0 5 10 15 20 25 30
Hea
t Flu
x (k
W/m
2 )
0
1
2
3
4
5
6Exp Time vs East U-3 Exp Time vs East U-4 CFAST Time vs E U-3 Flux CFAST Time vs E U-4 Flux
Flux Gauge E U-4 Inoperative
Short Wall TemperaturesICFMP BE #3, Test 9
Time (min)
0 5 10 15 20 25 30
Tem
pera
ture
(C)
0
50
100
150
200
250
Exp Time vs TC East U-3-2 Exp Time vs TC East U-4-2 CFAST Time vs E U-3 Temp CFAST Time vs E U-4 Temp
Figure A-67. Short Wall Heat Flux and Surface Temperature, ICFMP BE #3, Open-Door Tests
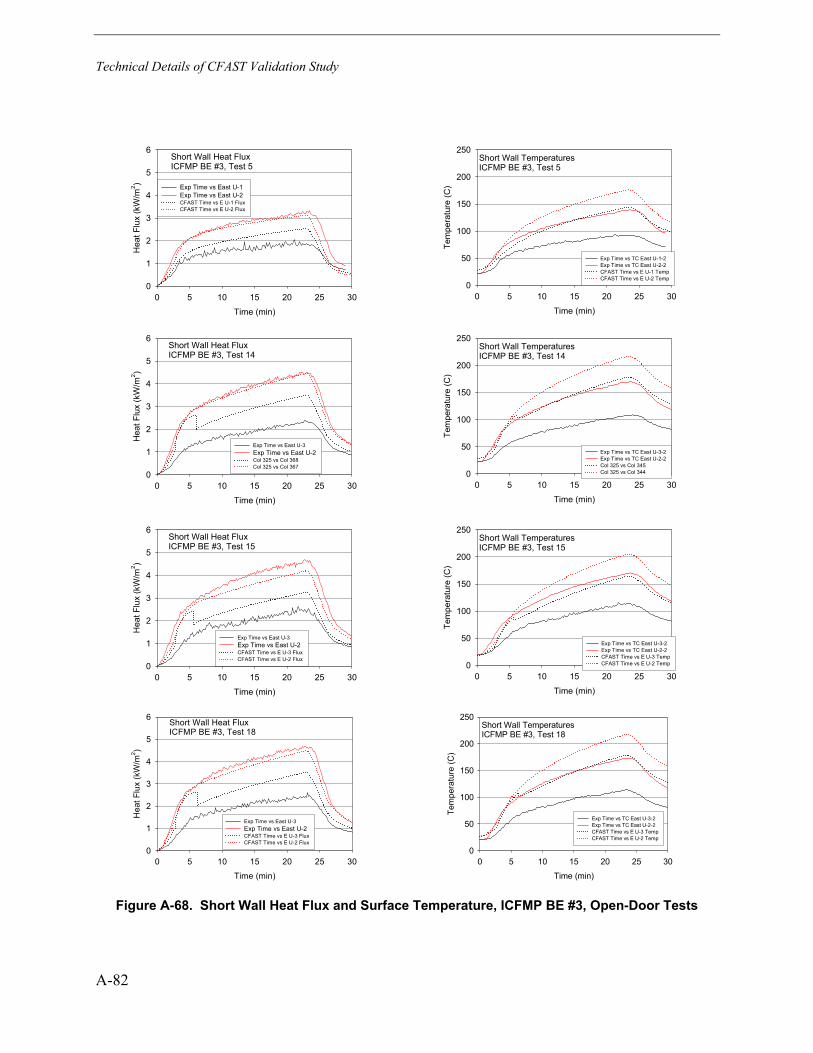
Technical Details of CFAST Validation Study
A-82
Short Wall Heat FluxICFMP BE #3, Test 5
Time (min)
0 5 10 15 20 25 30
Hea
t Flu
x (k
W/m
2 )
0
1
2
3
4
5
6
Exp Time vs East U-1 Exp Time vs East U-2 CFAST Time vs E U-1 Flux CFAST Time vs E U-2 Flux
Short Wall TemperaturesICFMP BE #3, Test 5
Time (min)
0 5 10 15 20 25 30
Tem
pera
ture
(C)
0
50
100
150
200
250
Exp Time vs TC East U-1-2 Exp Time vs TC East U-2-2 CFAST Time vs E U-1 Temp CFAST Time vs E U-2 Temp
Short Wall Heat FluxICFMP BE #3, Test 14
Time (min)
0 5 10 15 20 25 30
Hea
t Flu
x (k
W/m
2 )
0
1
2
3
4
5
6
Exp Time vs East U-3 Exp Time vs East U-2 Col 325 vs Col 368 Col 325 vs Col 367
Short Wall TemperaturesICFMP BE #3, Test 14
Time (min)
0 5 10 15 20 25 30
Tem
pera
ture
(C)
0
50
100
150
200
250
Exp Time vs TC East U-3-2 Exp Time vs TC East U-2-2 Col 325 vs Col 345 Col 325 vs Col 344
Short Wall Heat FluxICFMP BE #3, Test 15
Time (min)
0 5 10 15 20 25 30
Hea
t Flu
x (k
W/m
2 )
0
1
2
3
4
5
6
Exp Time vs East U-3 Exp Time vs East U-2 CFAST Time vs E U-3 Flux CFAST Time vs E U-2 Flux
Short Wall TemperaturesICFMP BE #3, Test 15
Time (min)
0 5 10 15 20 25 30
Tem
pera
ture
(C)
0
50
100
150
200
250
Exp Time vs TC East U-3-2 Exp Time vs TC East U-2-2 CFAST Time vs E U-3 Temp CFAST Time vs E U-2 Temp
Short Wall Heat FluxICFMP BE #3, Test 18
Time (min)
0 5 10 15 20 25 30
Hea
t Flu
x (k
W/m
2 )
0
1
2
3
4
5
6
Exp Time vs East U-3 Exp Time vs East U-2 CFAST Time vs E U-3 Flux CFAST Time vs E U-2 Flux
Short Wall TemperaturesICFMP BE #3, Test 18
Time (min)
0 5 10 15 20 25 30
Tem
pera
ture
(C)
0
50
100
150
200
250
Exp Time vs TC East U-3-2 Exp Time vs TC East U-2-2 CFAST Time vs E U-3 Temp CFAST Time vs E U-2 Temp
Figure A-68. Short Wall Heat Flux and Surface Temperature, ICFMP BE #3, Open-Door Tests
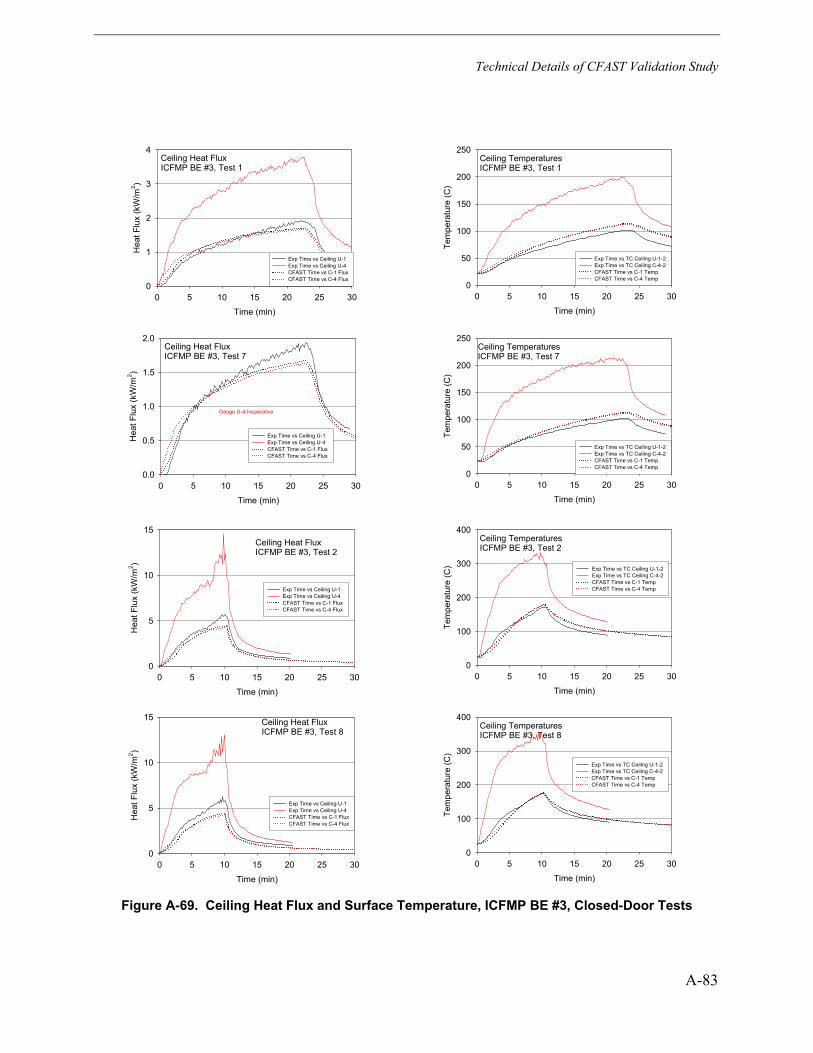
Technical Details of CFAST Validation Study
A-83
Ceiling Heat FluxICFMP BE #3, Test 1
Time (min)
0 5 10 15 20 25 30
Hea
t Flu
x (k
W/m
2 )
0
1
2
3
4
Exp Time vs Ceiling U-1 Exp Time vs Ceiling U-4 CFAST Time vs C-1 Flux CFAST Time vs C-4 Flux
Ceiling TemperaturesICFMP BE #3, Test 1
Time (min)
0 5 10 15 20 25 30
Tem
pera
ture
(C)
0
50
100
150
200
250
Exp Time vs TC Ceiling U-1-2 Exp Time vs TC Ceiling C-4-2 CFAST Time vs C-1 Temp CFAST Time vs C-4 Temp
Ceiling Heat FluxICFMP BE #3, Test 7
Time (min)
0 5 10 15 20 25 30
Hea
t Flu
x (k
W/m
2 )
0.0
0.5
1.0
1.5
2.0
Exp Time vs Ceiling U-1 Exp Time vs Ceiling U-4 CFAST Time vs C-1 Flux CFAST Time vs C-4 Flux
Gauge U-4 Inoperative
Ceiling TemperaturesICFMP BE #3, Test 7
Time (min)
0 5 10 15 20 25 30
Tem
pera
ture
(C)
0
50
100
150
200
250
Exp Time vs TC Ceiling U-1-2 Exp Time vs TC Ceiling C-4-2 CFAST Time vs C-1 Temp CFAST Time vs C-4 Temp
Ceiling Heat FluxICFMP BE #3, Test 2
Time (min)
0 5 10 15 20 25 30
Hea
t Flu
x (k
W/m
2 )
0
5
10
15
Exp Time vs Ceiling U-1 Exp Time vs Ceiling U-4 CFAST Time vs C-1 Flux CFAST Time vs C-4 Flux
Ceiling TemperaturesICFMP BE #3, Test 2
Time (min)
0 5 10 15 20 25 30
Tem
pera
ture
(C)
0
100
200
300
400
Exp Time vs TC Ceiling U-1-2 Exp Time vs TC Ceiling C-4-2 CFAST Time vs C-1 Temp CFAST Time vs C-4 Temp
Ceiling Heat FluxICFMP BE #3, Test 8
Time (min)
0 5 10 15 20 25 30
Hea
t Flu
x (k
W/m
2 )
0
5
10
15
Exp Time vs Ceiling U-1 Exp Time vs Ceiling U-4 CFAST Time vs C-1 Flux CFAST Time vs C-4 Flux
Ceiling TemperaturesICFMP BE #3, Test 8
Time (min)
0 5 10 15 20 25 30
Tem
pera
ture
(C)
0
100
200
300
400
Exp Time vs TC Ceiling U-1-2 Exp Time vs TC Ceiling C-4-2 CFAST Time vs C-1 Temp CFAST Time vs C-4 Temp
Figure A-69. Ceiling Heat Flux and Surface Temperature, ICFMP BE #3, Closed-Door Tests
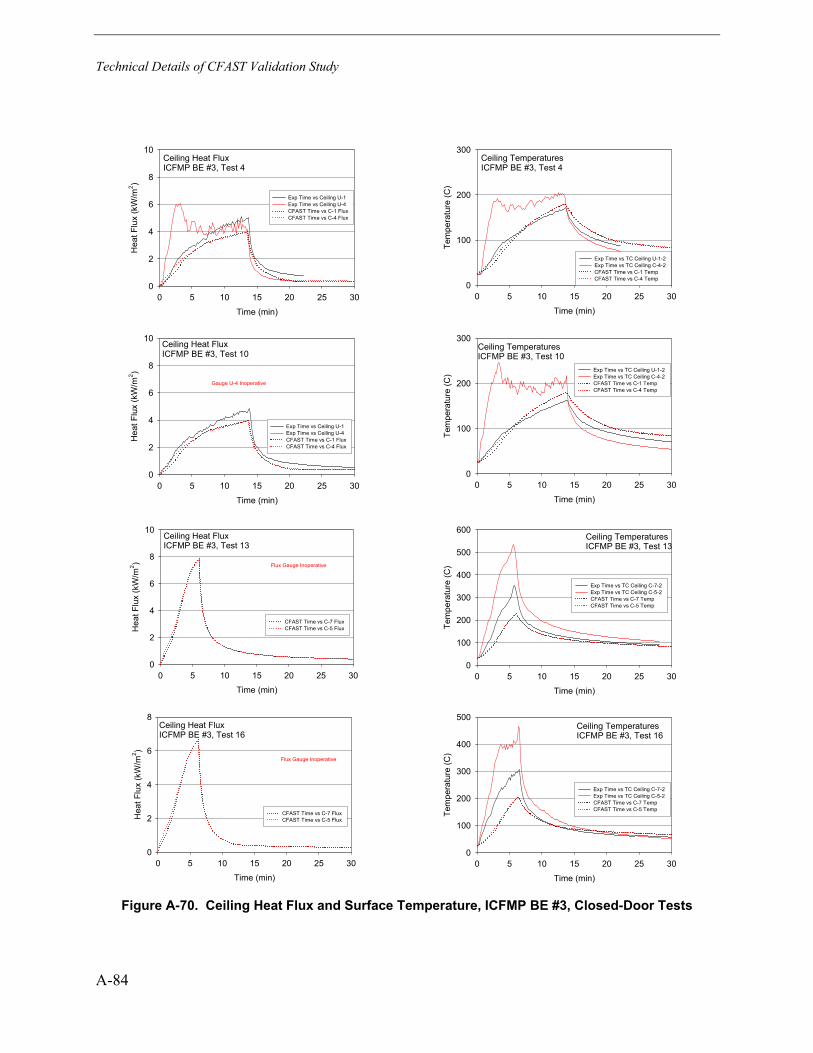
Technical Details of CFAST Validation Study
A-84
Ceiling Heat FluxICFMP BE #3, Test 4
Time (min)
0 5 10 15 20 25 30
Hea
t Flu
x (k
W/m
2 )
0
2
4
6
8
10
Exp Time vs Ceiling U-1 Exp Time vs Ceiling U-4 CFAST Time vs C-1 Flux CFAST Time vs C-4 Flux
Ceiling TemperaturesICFMP BE #3, Test 4
Time (min)
0 5 10 15 20 25 30
Tem
pera
ture
(C)
0
100
200
300
Exp Time vs TC Ceiling U-1-2 Exp Time vs TC Ceiling C-4-2 CFAST Time vs C-1 Temp CFAST Time vs C-4 Temp
Ceiling Heat FluxICFMP BE #3, Test 10
Time (min)
0 5 10 15 20 25 30
Hea
t Flu
x (k
W/m
2 )
0
2
4
6
8
10
Exp Time vs Ceiling U-1 Exp Time vs Ceiling U-4 CFAST Time vs C-1 Flux CFAST Time vs C-4 Flux
Gauge U-4 Inoperative
Ceiling TemperaturesICFMP BE #3, Test 10
Time (min)
0 5 10 15 20 25 30
Tem
pera
ture
(C)
0
100
200
300
Exp Time vs TC Ceiling U-1-2 Exp Time vs TC Ceiling C-4-2 CFAST Time vs C-1 Temp CFAST Time vs C-4 Temp
Ceiling Heat FluxICFMP BE #3, Test 13
Time (min)
0 5 10 15 20 25 30
Hea
t Flu
x (k
W/m
2 )
0
2
4
6
8
10
CFAST Time vs C-7 Flux CFAST Time vs C-5 Flux
Flux Gauge Inoperative
Ceiling TemperaturesICFMP BE #3, Test 13
Time (min)
0 5 10 15 20 25 30
Tem
pera
ture
(C)
0
100
200
300
400
500
600
Exp Time vs TC Ceiling C-7-2 Exp Time vs TC Ceiling C-5-2 CFAST Time vs C-7 Temp CFAST Time vs C-5 Temp
Ceiling Heat FluxICFMP BE #3, Test 16
Time (min)
0 5 10 15 20 25 30
Hea
t Flu
x (k
W/m
2 )
0
2
4
6
8
CFAST Time vs C-7 Flux CFAST Time vs C-5 Flux
Flux Gauge Inoperative
Ceiling TemperaturesICFMP BE #3, Test 16
Time (min)
0 5 10 15 20 25 30
Tem
pera
ture
(C)
0
100
200
300
400
500
Exp Time vs TC Ceiling C-7-2 Exp Time vs TC Ceiling C-5-2 CFAST Time vs C-7 Temp CFAST Time vs C-5 Temp
Figure A-70. Ceiling Heat Flux and Surface Temperature, ICFMP BE #3, Closed-Door Tests
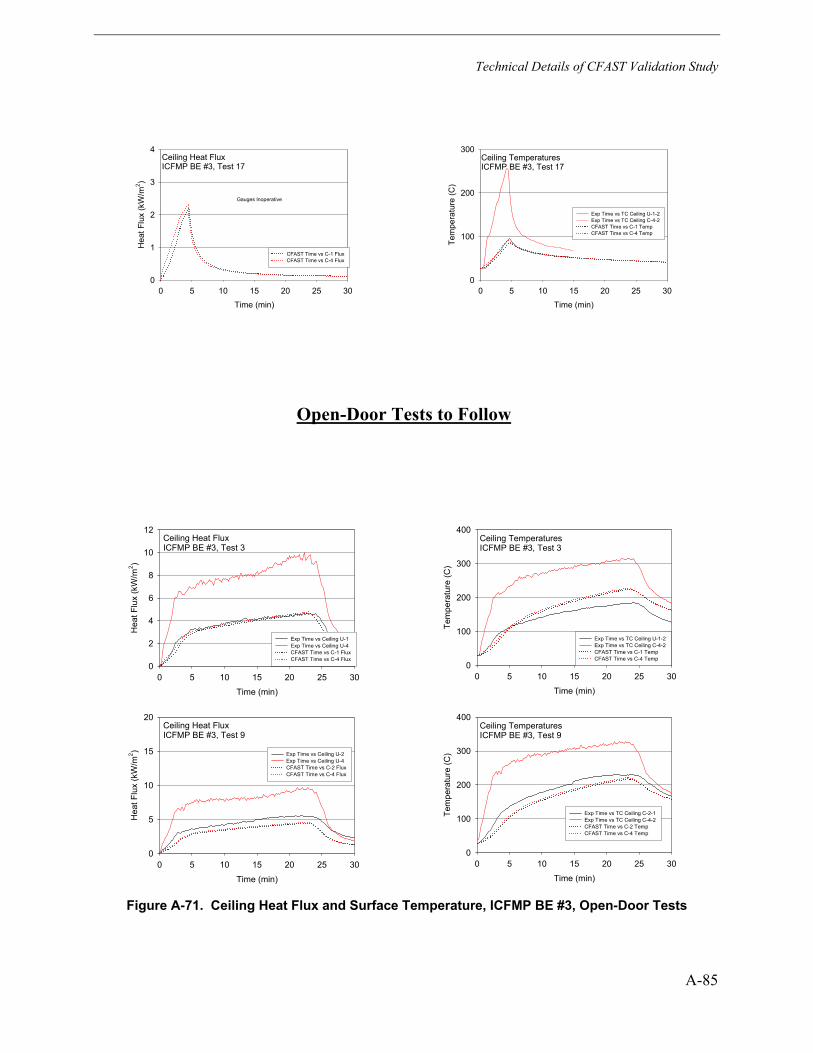
Technical Details of CFAST Validation Study
A-85
Ceiling Heat FluxICFMP BE #3, Test 17
Time (min)
0 5 10 15 20 25 30
Hea
t Flu
x (k
W/m
2 )
0
1
2
3
4
CFAST Time vs C-1 Flux CFAST Time vs C-4 Flux
Gauges Inoperative
Ceiling TemperaturesICFMP BE #3, Test 17
Time (min)
0 5 10 15 20 25 30
Tem
pera
ture
(C)
0
100
200
300
Exp Time vs TC Ceiling U-1-2 Exp Time vs TC Ceiling C-4-2 CFAST Time vs C-1 Temp CFAST Time vs C-4 Temp
Open-Door Tests to Follow
Ceiling Heat FluxICFMP BE #3, Test 3
Time (min)
0 5 10 15 20 25 30
Hea
t Flu
x (k
W/m
2 )
0
2
4
6
8
10
12
Exp Time vs Ceiling U-1 Exp Time vs Ceiling U-4 CFAST Time vs C-1 Flux CFAST Time vs C-4 Flux
Ceiling TemperaturesICFMP BE #3, Test 3
Time (min)
0 5 10 15 20 25 30
Tem
pera
ture
(C)
0
100
200
300
400
Exp Time vs TC Ceiling U-1-2 Exp Time vs TC Ceiling C-4-2 CFAST Time vs C-1 Temp CFAST Time vs C-4 Temp
Ceiling Heat FluxICFMP BE #3, Test 9
Time (min)
0 5 10 15 20 25 30
Hea
t Flu
x (k
W/m
2 )
0
5
10
15
20
Exp Time vs Ceiling U-2 Exp Time vs Ceiling U-4 CFAST Time vs C-2 Flux CFAST Time vs C-4 Flux
Ceiling TemperaturesICFMP BE #3, Test 9
Time (min)
0 5 10 15 20 25 30
Tem
pera
ture
(C)
0
100
200
300
400
Exp Time vs TC Ceiling C-2-1 Exp Time vs TC Ceiling C-4-2 CFAST Time vs C-2 Temp CFAST Time vs C-4 Temp
Figure A-71. Ceiling Heat Flux and Surface Temperature, ICFMP BE #3, Open-Door Tests
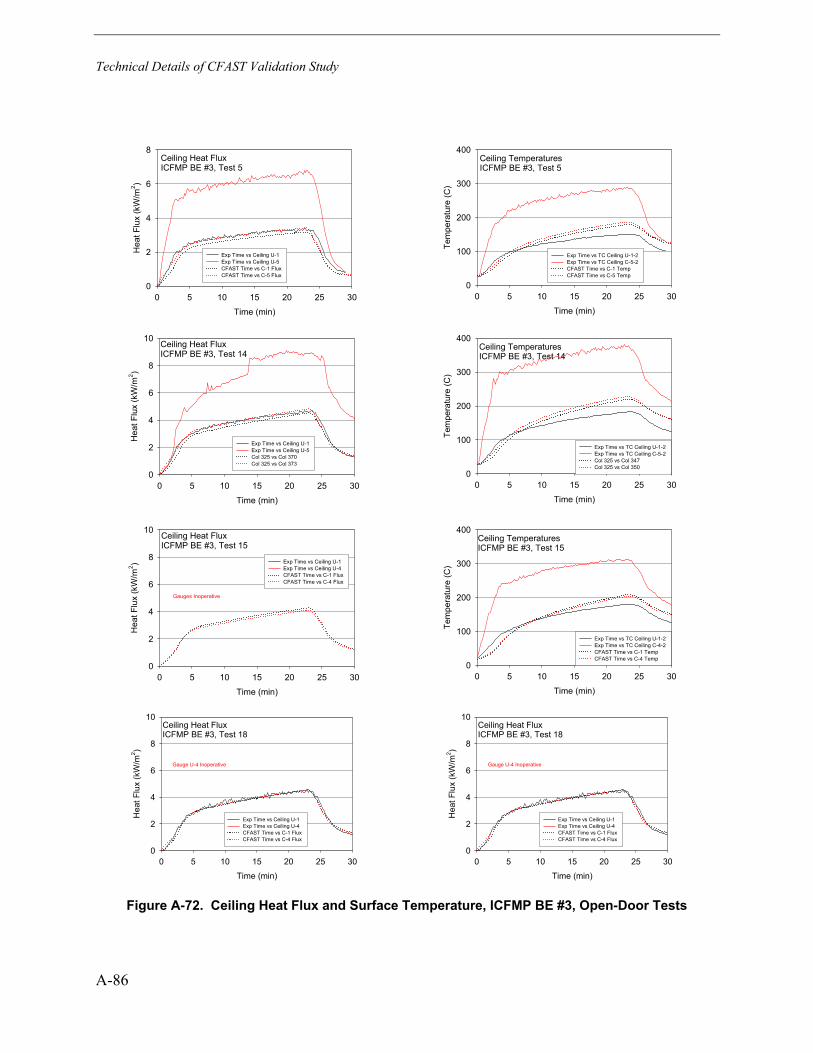
Technical Details of CFAST Validation Study
A-86
Ceiling Heat FluxICFMP BE #3, Test 5
Time (min)
0 5 10 15 20 25 30
Hea
t Flu
x (k
W/m
2 )
0
2
4
6
8
Exp Time vs Ceiling U-1 Exp Time vs Ceiling U-5 CFAST Time vs C-1 Flux CFAST Time vs C-5 Flux
Ceiling TemperaturesICFMP BE #3, Test 5
Time (min)
0 5 10 15 20 25 30
Tem
pera
ture
(C)
0
100
200
300
400
Exp Time vs TC Ceiling U-1-2 Exp Time vs TC Ceiling C-5-2 CFAST Time vs C-1 Temp CFAST Time vs C-5 Temp
Ceiling Heat FluxICFMP BE #3, Test 14
Time (min)
0 5 10 15 20 25 30
Hea
t Flu
x (k
W/m
2 )
0
2
4
6
8
10
Exp Time vs Ceiling U-1 Exp Time vs Ceiling U-5 Col 325 vs Col 370 Col 325 vs Col 373
Ceiling TemperaturesICFMP BE #3, Test 14
Time (min)
0 5 10 15 20 25 30
Tem
pera
ture
(C)
0
100
200
300
400
Exp Time vs TC Ceiling U-1-2 Exp Time vs TC Ceiling C-5-2 Col 325 vs Col 347 Col 325 vs Col 350
Ceiling Heat FluxICFMP BE #3, Test 15
Time (min)
0 5 10 15 20 25 30
Hea
t Flu
x (k
W/m
2 )
0
2
4
6
8
10
Exp Time vs Ceiling U-1 Exp Time vs Ceiling U-4 CFAST Time vs C-1 Flux CFAST Time vs C-4 Flux
Gauges Inoperative
Ceiling TemperaturesICFMP BE #3, Test 15
Time (min)
0 5 10 15 20 25 30
Tem
pera
ture
(C)
0
100
200
300
400
Exp Time vs TC Ceiling U-1-2 Exp Time vs TC Ceiling C-4-2 CFAST Time vs C-1 Temp CFAST Time vs C-4 Temp
Ceiling Heat FluxICFMP BE #3, Test 18
Time (min)
0 5 10 15 20 25 30
Hea
t Flu
x (k
W/m
2 )
0
2
4
6
8
10
Exp Time vs Ceiling U-1 Exp Time vs Ceiling U-4 CFAST Time vs C-1 Flux CFAST Time vs C-4 Flux
Gauge U-4 Inoperative
Ceiling Heat FluxICFMP BE #3, Test 18
Time (min)
0 5 10 15 20 25 30
Hea
t Flu
x (k
W/m
2 )
0
2
4
6
8
10
Exp Time vs Ceiling U-1 Exp Time vs Ceiling U-4 CFAST Time vs C-1 Flux CFAST Time vs C-4 Flux
Gauge U-4 Inoperative
Figure A-72. Ceiling Heat Flux and Surface Temperature, ICFMP BE #3, Open-Door Tests
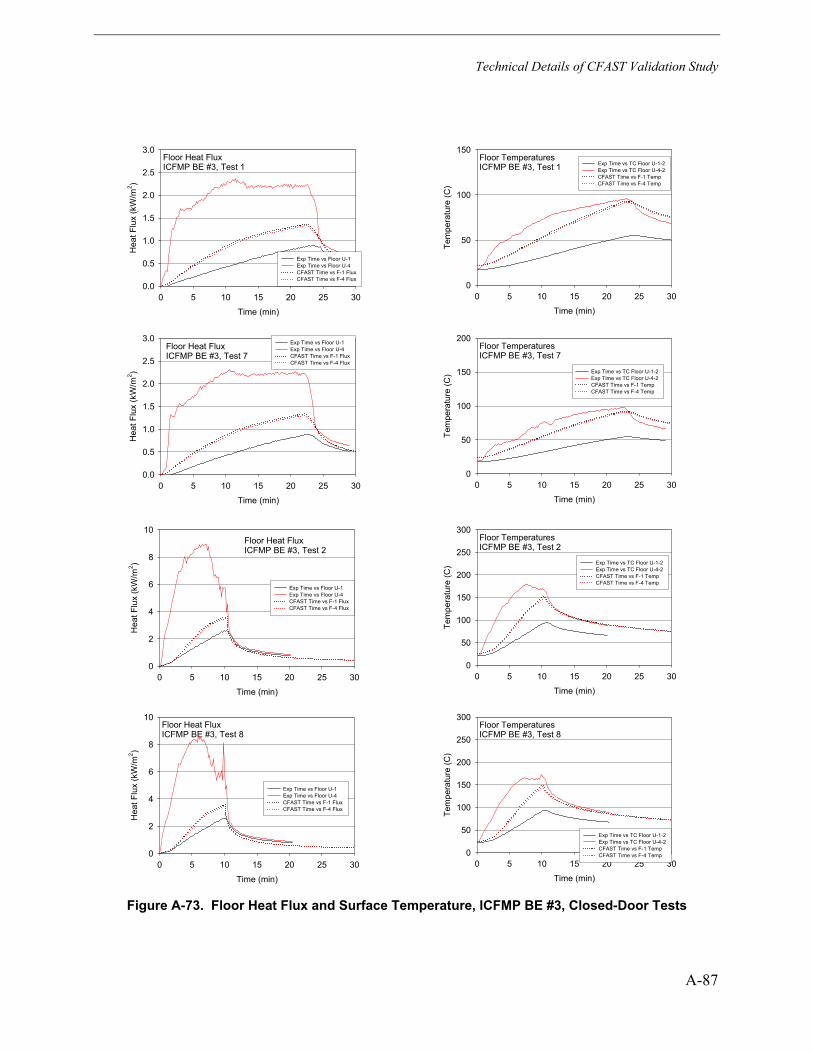
Technical Details of CFAST Validation Study
A-87
Floor Heat FluxICFMP BE #3, Test 1
Time (min)
0 5 10 15 20 25 30
Hea
t Flu
x (k
W/m
2 )
0.0
0.5
1.0
1.5
2.0
2.5
3.0
Exp Time vs Floor U-1 Exp Time vs Floor U-4 CFAST Time vs F-1 Flux CFAST Time vs F-4 Flux
Floor TemperaturesICFMP BE #3, Test 1
Time (min)
0 5 10 15 20 25 30
Tem
pera
ture
(C)
0
50
100
150Exp Time vs TC Floor U-1-2 Exp Time vs TC Floor U-4-2 CFAST Time vs F-1 Temp CFAST Time vs F-4 Temp
Floor Heat FluxICFMP BE #3, Test 7
Time (min)
0 5 10 15 20 25 30
Hea
t Flu
x (k
W/m
2 )
0.0
0.5
1.0
1.5
2.0
2.5
3.0 Exp Time vs Floor U-1 Exp Time vs Floor U-4 CFAST Time vs F-1 Flux CFAST Time vs F-4 Flux
Floor TemperaturesICFMP BE #3, Test 7
Time (min)
0 5 10 15 20 25 30
Tem
pera
ture
(C)
0
50
100
150
200
Exp Time vs TC Floor U-1-2 Exp Time vs TC Floor U-4-2 CFAST Time vs F-1 Temp CFAST Time vs F-4 Temp
Floor Heat FluxICFMP BE #3, Test 2
Time (min)
0 5 10 15 20 25 30
Hea
t Flu
x (k
W/m
2 )
0
2
4
6
8
10
Exp Time vs Floor U-1 Exp Time vs Floor U-4 CFAST Time vs F-1 Flux CFAST Time vs F-4 Flux
Floor TemperaturesICFMP BE #3, Test 2
Time (min)
0 5 10 15 20 25 30
Tem
pera
ture
(C)
0
50
100
150
200
250
300
Exp Time vs TC Floor U-1-2 Exp Time vs TC Floor U-4-2 CFAST Time vs F-1 Temp CFAST Time vs F-4 Temp
Floor Heat FluxICFMP BE #3, Test 8
Time (min)
0 5 10 15 20 25 30
Hea
t Flu
x (k
W/m
2 )
0
2
4
6
8
10
Exp Time vs Floor U-1 Exp Time vs Floor U-4 CFAST Time vs F-1 Flux CFAST Time vs F-4 Flux
Floor TemperaturesICFMP BE #3, Test 8
Time (min)
0 5 10 15 20 25 30
Tem
pera
ture
(C)
0
50
100
150
200
250
300
Exp Time vs TC Floor U-1-2 Exp Time vs TC Floor U-4-2 CFAST Time vs F-1 Temp CFAST Time vs F-4 Temp
Figure A-73. Floor Heat Flux and Surface Temperature, ICFMP BE #3, Closed-Door Tests
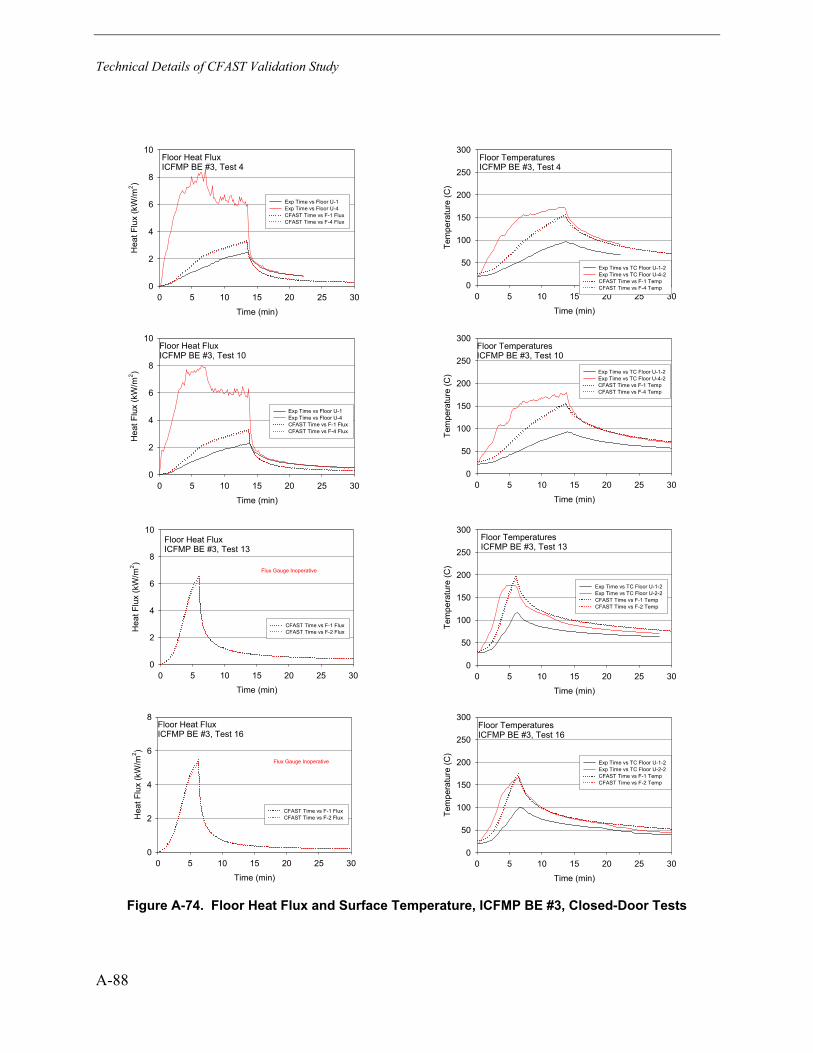
Technical Details of CFAST Validation Study
A-88
Floor Heat FluxICFMP BE #3, Test 4
Time (min)
0 5 10 15 20 25 30
Hea
t Flu
x (k
W/m
2 )
0
2
4
6
8
10
Exp Time vs Floor U-1 Exp Time vs Floor U-4 CFAST Time vs F-1 Flux CFAST Time vs F-4 Flux
Floor TemperaturesICFMP BE #3, Test 4
Time (min)
0 5 10 15 20 25 30
Tem
pera
ture
(C)
0
50
100
150
200
250
300
Exp Time vs TC Floor U-1-2 Exp Time vs TC Floor U-4-2 CFAST Time vs F-1 Temp CFAST Time vs F-4 Temp
Floor Heat FluxICFMP BE #3, Test 10
Time (min)
0 5 10 15 20 25 30
Hea
t Flu
x (k
W/m
2 )
0
2
4
6
8
10
Exp Time vs Floor U-1 Exp Time vs Floor U-4 CFAST Time vs F-1 Flux CFAST Time vs F-4 Flux
Floor TemperaturesICFMP BE #3, Test 10
Time (min)
0 5 10 15 20 25 30
Tem
pera
ture
(C)
0
50
100
150
200
250
300
Exp Time vs TC Floor U-1-2 Exp Time vs TC Floor U-4-2 CFAST Time vs F-1 Temp CFAST Time vs F-4 Temp
Floor Heat FluxICFMP BE #3, Test 13
Time (min)
0 5 10 15 20 25 30
Hea
t Flu
x (k
W/m
2 )
0
2
4
6
8
10
CFAST Time vs F-1 Flux CFAST Time vs F-2 Flux
Flux Gauge Inoperative
Floor TemperaturesICFMP BE #3, Test 13
Time (min)
0 5 10 15 20 25 30
Tem
pera
ture
(C)
0
50
100
150
200
250
300
Exp Time vs TC Floor U-1-2 Exp Time vs TC Floor U-2-2 CFAST Time vs F-1 Temp CFAST Time vs F-2 Temp
Floor Heat FluxICFMP BE #3, Test 16
Time (min)
0 5 10 15 20 25 30
Hea
t Flu
x (k
W/m
2 )
0
2
4
6
8
CFAST Time vs F-1 Flux CFAST Time vs F-2 Flux
Flux Gauge Inoperative
Floor TemperaturesICFMP BE #3, Test 16
Time (min)
0 5 10 15 20 25 30
Tem
pera
ture
(C)
0
50
100
150
200
250
300
Exp Time vs TC Floor U-1-2 Exp Time vs TC Floor U-2-2 CFAST Time vs F-1 Temp CFAST Time vs F-2 Temp
Figure A-74. Floor Heat Flux and Surface Temperature, ICFMP BE #3, Closed-Door Tests
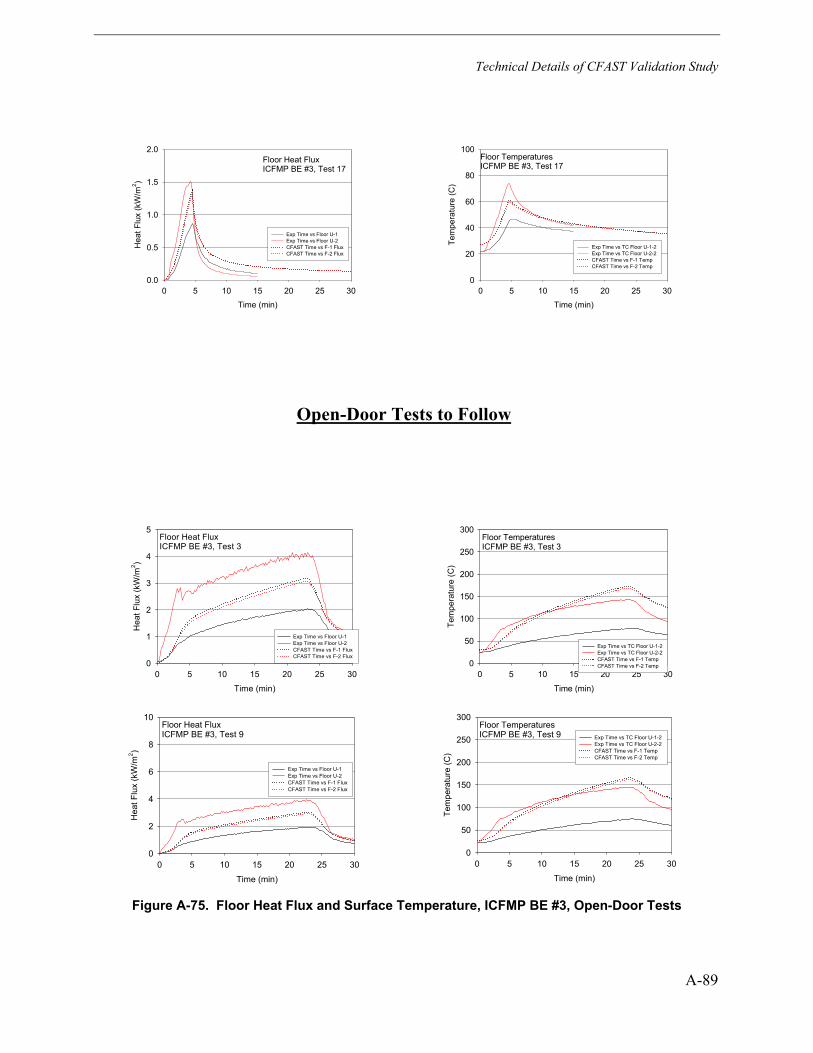
Technical Details of CFAST Validation Study
A-89
Floor Heat FluxICFMP BE #3, Test 17
Time (min)
0 5 10 15 20 25 30
Hea
t Flu
x (k
W/m
2 )
0.0
0.5
1.0
1.5
2.0
Exp Time vs Floor U-1 Exp Time vs Floor U-2 CFAST Time vs F-1 Flux CFAST Time vs F-2 Flux
Floor TemperaturesICFMP BE #3, Test 17
Time (min)
0 5 10 15 20 25 30
Tem
pera
ture
(C)
0
20
40
60
80
100
Exp Time vs TC Floor U-1-2 Exp Time vs TC Floor U-2-2 CFAST Time vs F-1 Temp CFAST Time vs F-2 Temp
Open-Door Tests to Follow
Floor Heat FluxICFMP BE #3, Test 3
Time (min)
0 5 10 15 20 25 30
Hea
t Flu
x (k
W/m
2 )
0
1
2
3
4
5
Exp Time vs Floor U-1 Exp Time vs Floor U-2 CFAST Time vs F-1 Flux CFAST Time vs F-2 Flux
Floor TemperaturesICFMP BE #3, Test 3
Time (min)
0 5 10 15 20 25 30
Tem
pera
ture
(C)
0
50
100
150
200
250
300
Exp Time vs TC Floor U-1-2 Exp Time vs TC Floor U-2-2 CFAST Time vs F-1 Temp CFAST Time vs F-2 Temp
Floor Heat FluxICFMP BE #3, Test 9
Time (min)
0 5 10 15 20 25 30
Hea
t Flu
x (k
W/m
2 )
0
2
4
6
8
10
Exp Time vs Floor U-1 Exp Time vs Floor U-2 CFAST Time vs F-1 Flux CFAST Time vs F-2 Flux
Floor TemperaturesICFMP BE #3, Test 9
Time (min)
0 5 10 15 20 25 30
Tem
pera
ture
(C)
0
50
100
150
200
250
300
Exp Time vs TC Floor U-1-2 Exp Time vs TC Floor U-2-2 CFAST Time vs F-1 Temp CFAST Time vs F-2 Temp
Figure A-75. Floor Heat Flux and Surface Temperature, ICFMP BE #3, Open-Door Tests
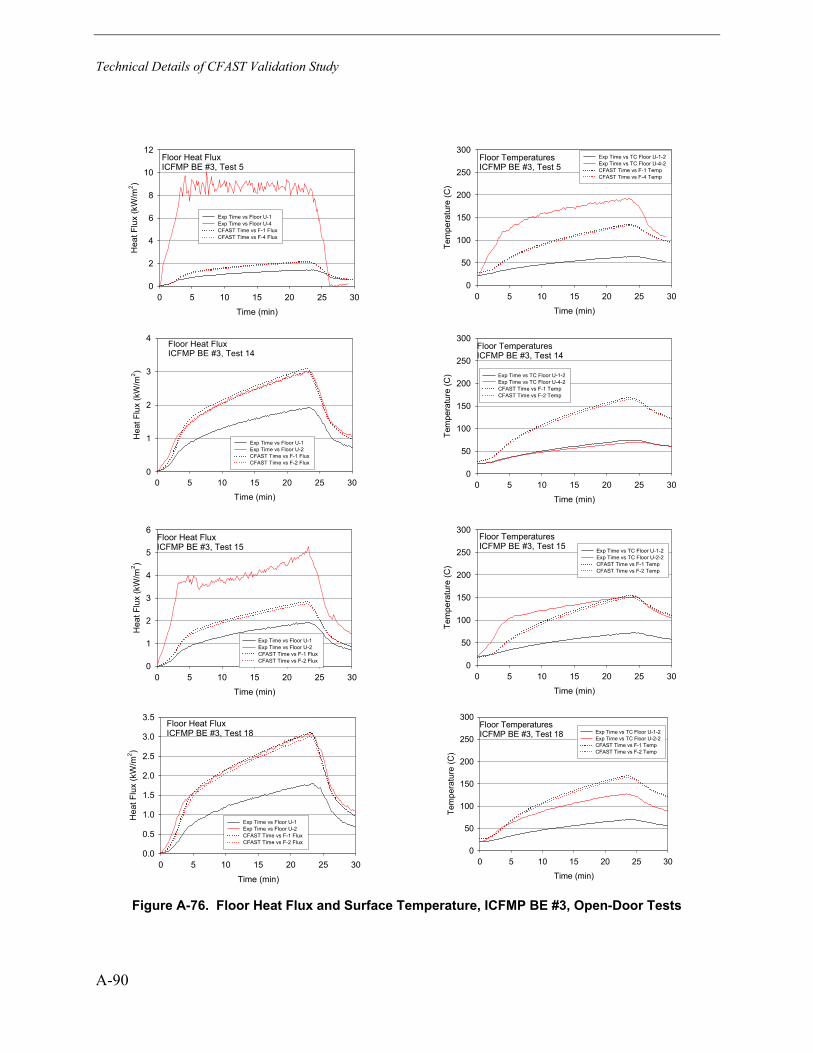
Technical Details of CFAST Validation Study
A-90
Floor Heat FluxICFMP BE #3, Test 5
Time (min)
0 5 10 15 20 25 30
Hea
t Flu
x (k
W/m
2 )
0
2
4
6
8
10
12
Exp Time vs Floor U-1 Exp Time vs Floor U-4 CFAST Time vs F-1 Flux CFAST Time vs F-4 Flux
Floor TemperaturesICFMP BE #3, Test 5
Time (min)
0 5 10 15 20 25 30
Tem
pera
ture
(C)
0
50
100
150
200
250
300Exp Time vs TC Floor U-1-2 Exp Time vs TC Floor U-4-2 CFAST Time vs F-1 Temp CFAST Time vs F-4 Temp
Floor Heat FluxICFMP BE #3, Test 14
Time (min)
0 5 10 15 20 25 30
Hea
t Flu
x (k
W/m
2 )
0
1
2
3
4
Exp Time vs Floor U-1 Exp Time vs Floor U-2 CFAST Time vs F-1 Flux CFAST Time vs F-2 Flux
Floor TemperaturesICFMP BE #3, Test 14
Time (min)
0 5 10 15 20 25 30
Tem
pera
ture
(C)
0
50
100
150
200
250
300
Exp Time vs TC Floor U-1-2 Exp Time vs TC Floor U-4-2 CFAST Time vs F-1 Temp CFAST Time vs F-2 Temp
Floor Heat FluxICFMP BE #3, Test 15
Time (min)
0 5 10 15 20 25 30
Hea
t Flu
x (k
W/m
2 )
0
1
2
3
4
5
6
Exp Time vs Floor U-1 Exp Time vs Floor U-2 CFAST Time vs F-1 Flux CFAST Time vs F-2 Flux
Floor TemperaturesICFMP BE #3, Test 15
Time (min)
0 5 10 15 20 25 30
Tem
pera
ture
(C)
0
50
100
150
200
250
300
Exp Time vs TC Floor U-1-2 Exp Time vs TC Floor U-2-2 CFAST Time vs F-1 Temp CFAST Time vs F-2 Temp
Floor Heat FluxICFMP BE #3, Test 18
Time (min)
0 5 10 15 20 25 30
Hea
t Flu
x (k
W/m
2 )
0.0
0.5
1.0
1.5
2.0
2.5
3.0
3.5
Exp Time vs Floor U-1 Exp Time vs Floor U-2 CFAST Time vs F-1 Flux CFAST Time vs F-2 Flux
Floor TemperaturesICFMP BE #3, Test 18
Time (min)
0 5 10 15 20 25 30
Tem
pera
ture
(C)
0
50
100
150
200
250
300Exp Time vs TC Floor U-1-2 Exp Time vs TC Floor U-2-2 CFAST Time vs F-1 Temp CFAST Time vs F-2 Temp
Figure A-76. Floor Heat Flux and Surface Temperature, ICFMP BE #3, Open-Door Tests
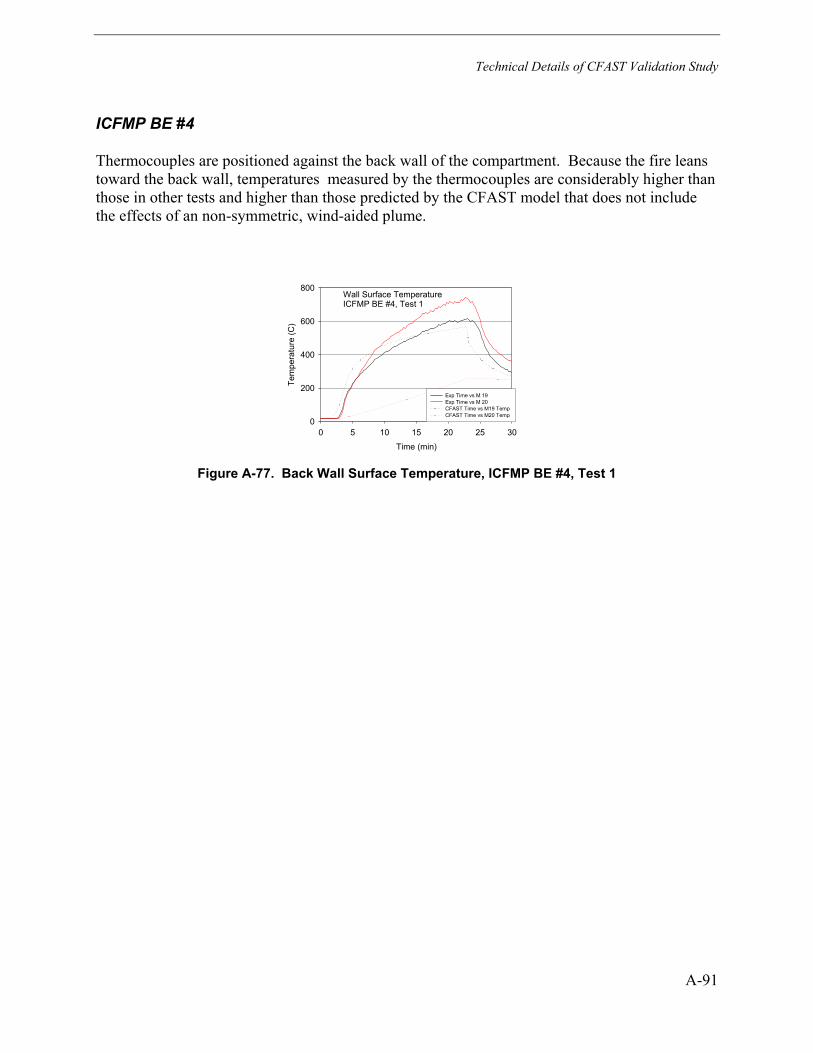
Technical Details of CFAST Validation Study
A-91
ICFMP BE #4
Thermocouples are positioned against the back wall of the compartment. Because the fire leans toward the back wall, temperatures measured by the thermocouples are considerably higher than those in other tests and higher than those predicted by the CFAST model that does not include the effects of an non-symmetric, wind-aided plume.
Wall Surface TemperatureICFMP BE #4, Test 1
Time (min)
0 5 10 15 20 25 30
Tem
pera
ture
(C)
0
200
400
600
800
Exp Time vs M 19 Exp Time vs M 20 CFAST Time vs M19 Temp CFAST Time vs M20 Temp
Figure A-77. Back Wall Surface Temperature, ICFMP BE #4, Test 1
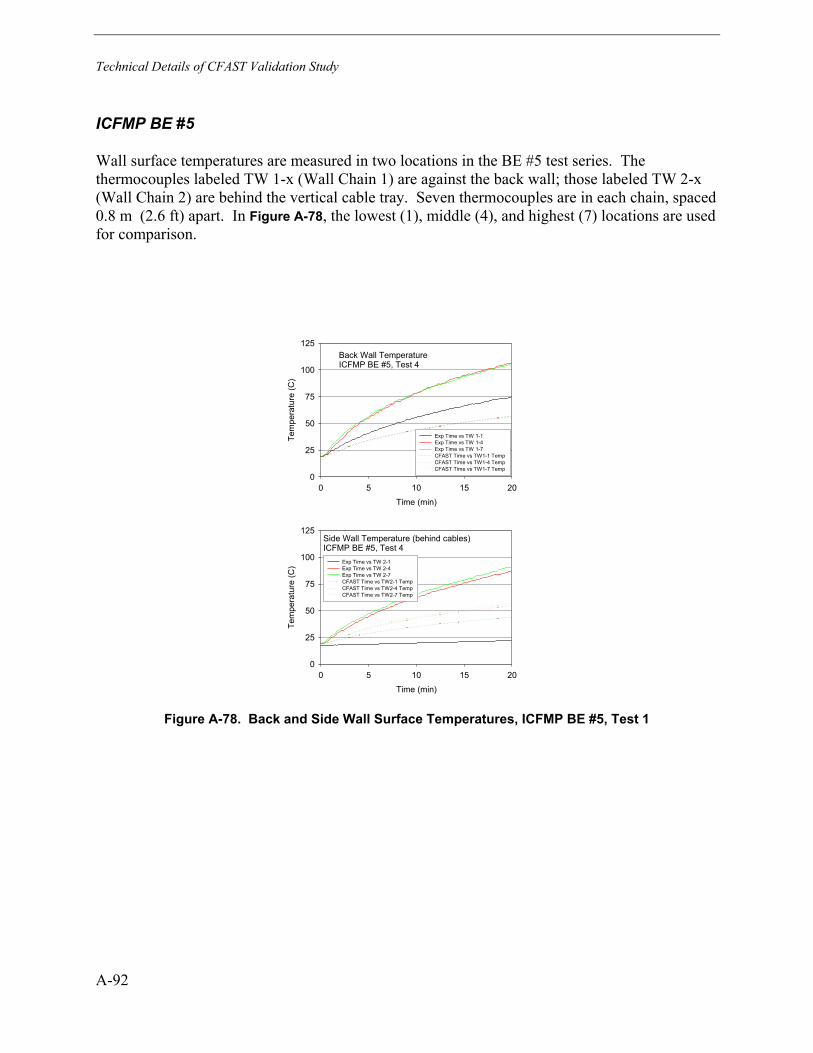
Technical Details of CFAST Validation Study
A-92
ICFMP BE #5
Wall surface temperatures are measured in two locations in the BE #5 test series. The thermocouples labeled TW 1-x (Wall Chain 1) are against the back wall; those labeled TW 2-x (Wall Chain 2) are behind the vertical cable tray. Seven thermocouples are in each chain, spaced 0.8 m (2.6 ft) apart. In Figure A-78, the lowest (1), middle (4), and highest (7) locations are used for comparison.
Back Wall TemperatureICFMP BE #5, Test 4
Time (min)
0 5 10 15 20
Tem
pera
ture
(C)
0
25
50
75
100
125
Exp Time vs TW 1-1 Exp Time vs TW 1-4 Exp Time vs TW 1-7 CFAST Time vs TW1-1 Temp CFAST Time vs TW1-4 Temp CFAST Time vs TW1-7 Temp
Side Wall Temperature (behind cables)ICFMP BE #5, Test 4
Time (min)
0 5 10 15 20
Tem
pera
ture
(C)
0
25
50
75
100
125
Exp Time vs TW 2-1 Exp Time vs TW 2-4 Exp Time vs TW 2-7 CFAST Time vs TW2-1 Temp CFAST Time vs TW2-4 Temp CFAST Time vs TW2-7 Temp
Figure A-78. Back and Side Wall Surface Temperatures, ICFMP BE #5, Test 1
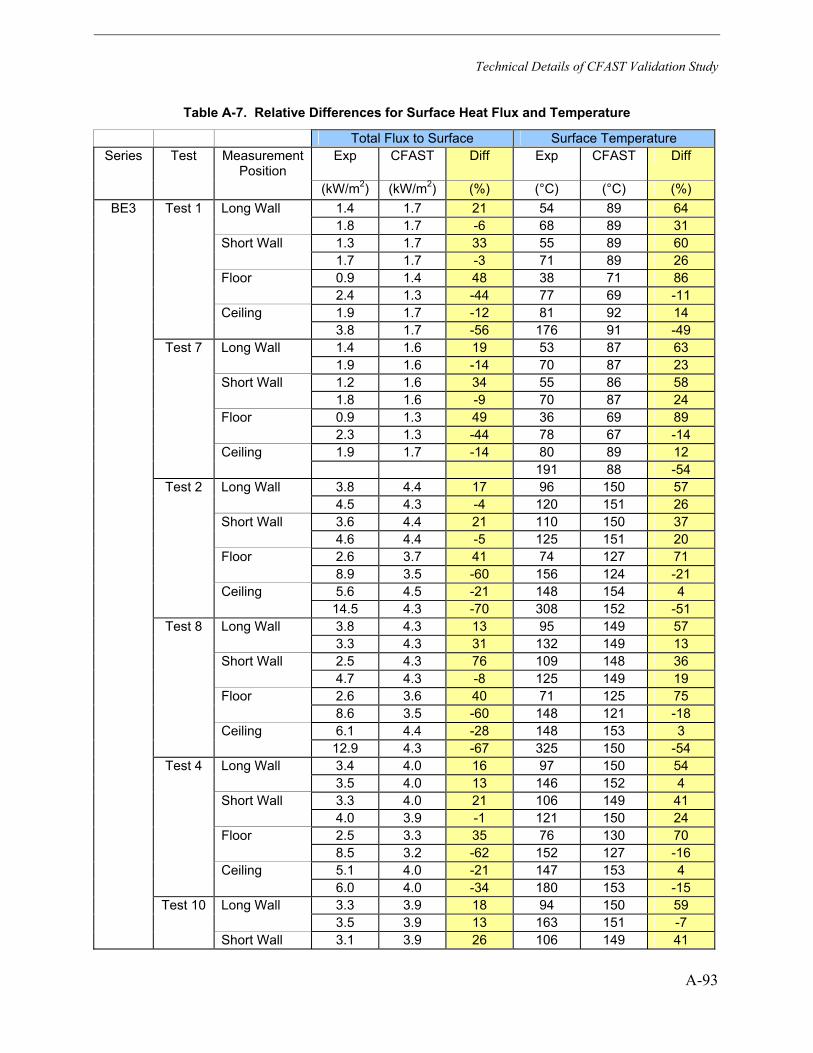
Technical Details of CFAST Validation Study
A-93
Table A-7. Relative Differences for Surface Heat Flux and Temperature
Total Flux to Surface Surface Temperature Series Test Measurement
Position Exp CFAST Diff Exp CFAST Diff
(kW/m2) (kW/m2) (%) (°C) (°C) (%) BE3 Test 1 Long Wall 1.4 1.7 21 54 89 64
1.8 1.7 -6 68 89 31 Short Wall 1.3 1.7 33 55 89 60 1.7 1.7 -3 71 89 26 Floor 0.9 1.4 48 38 71 86 2.4 1.3 -44 77 69 -11 Ceiling 1.9 1.7 -12 81 92 14 3.8 1.7 -56 176 91 -49 Test 7 Long Wall 1.4 1.6 19 53 87 63 1.9 1.6 -14 70 87 23 Short Wall 1.2 1.6 34 55 86 58 1.8 1.6 -9 70 87 24 Floor 0.9 1.3 49 36 69 89 2.3 1.3 -44 78 67 -14 Ceiling 1.9 1.7 -14 80 89 12 191 88 -54 Test 2 Long Wall 3.8 4.4 17 96 150 57 4.5 4.3 -4 120 151 26 Short Wall 3.6 4.4 21 110 150 37 4.6 4.4 -5 125 151 20 Floor 2.6 3.7 41 74 127 71 8.9 3.5 -60 156 124 -21 Ceiling 5.6 4.5 -21 148 154 4 14.5 4.3 -70 308 152 -51 Test 8 Long Wall 3.8 4.3 13 95 149 57 3.3 4.3 31 132 149 13 Short Wall 2.5 4.3 76 109 148 36 4.7 4.3 -8 125 149 19 Floor 2.6 3.6 40 71 125 75 8.6 3.5 -60 148 121 -18 Ceiling 6.1 4.4 -28 148 153 3 12.9 4.3 -67 325 150 -54 Test 4 Long Wall 3.4 4.0 16 97 150 54 3.5 4.0 13 146 152 4 Short Wall 3.3 4.0 21 106 149 41 4.0 3.9 -1 121 150 24 Floor 2.5 3.3 35 76 130 70 8.5 3.2 -62 152 127 -16 Ceiling 5.1 4.0 -21 147 153 4 6.0 4.0 -34 180 153 -15 Test 10 Long Wall 3.3 3.9 18 94 150 59 3.5 3.9 13 163 151 -7 Short Wall 3.1 3.9 26 106 149 41
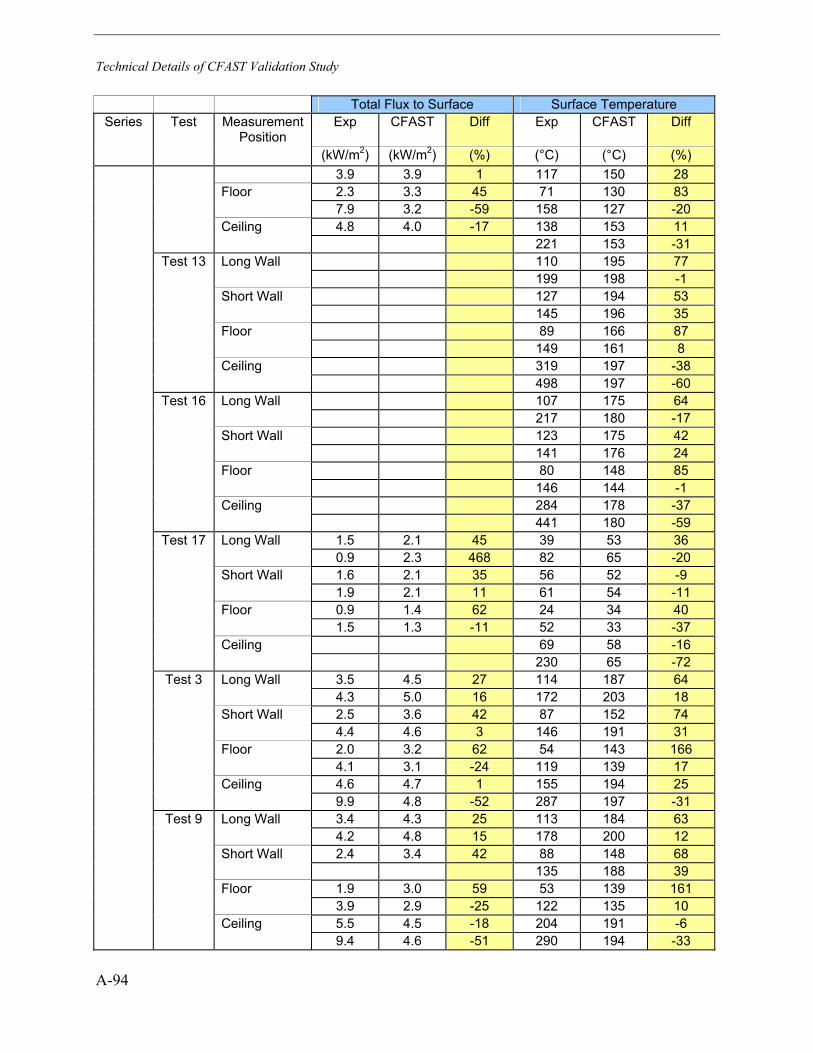
Technical Details of CFAST Validation Study
A-94
Total Flux to Surface Surface Temperature Series Test Measurement
Position Exp CFAST Diff Exp CFAST Diff
(kW/m2) (kW/m2) (%) (°C) (°C) (%) 3.9 3.9 1 117 150 28 Floor 2.3 3.3 45 71 130 83 7.9 3.2 -59 158 127 -20 Ceiling 4.8 4.0 -17 138 153 11 221 153 -31 Test 13 Long Wall 110 195 77 199 198 -1 Short Wall 127 194 53 145 196 35 Floor 89 166 87 149 161 8 Ceiling 319 197 -38 498 197 -60 Test 16 Long Wall 107 175 64 217 180 -17 Short Wall 123 175 42 141 176 24 Floor 80 148 85 146 144 -1 Ceiling 284 178 -37 441 180 -59 Test 17 Long Wall 1.5 2.1 45 39 53 36 0.9 2.3 468 82 65 -20 Short Wall 1.6 2.1 35 56 52 -9 1.9 2.1 11 61 54 -11 Floor 0.9 1.4 62 24 34 40 1.5 1.3 -11 52 33 -37 Ceiling 69 58 -16 230 65 -72 Test 3 Long Wall 3.5 4.5 27 114 187 64 4.3 5.0 16 172 203 18 Short Wall 2.5 3.6 42 87 152 74 4.4 4.6 3 146 191 31 Floor 2.0 3.2 62 54 143 166 4.1 3.1 -24 119 139 17 Ceiling 4.6 4.7 1 155 194 25 9.9 4.8 -52 287 197 -31 Test 9 Long Wall 3.4 4.3 25 113 184 63 4.2 4.8 15 178 200 12 Short Wall 2.4 3.4 42 88 148 68 135 188 39 Floor 1.9 3.0 59 53 139 161 3.9 2.9 -25 122 135 10 Ceiling 5.5 4.5 -18 204 191 -6 9.4 4.6 -51 290 194 -33
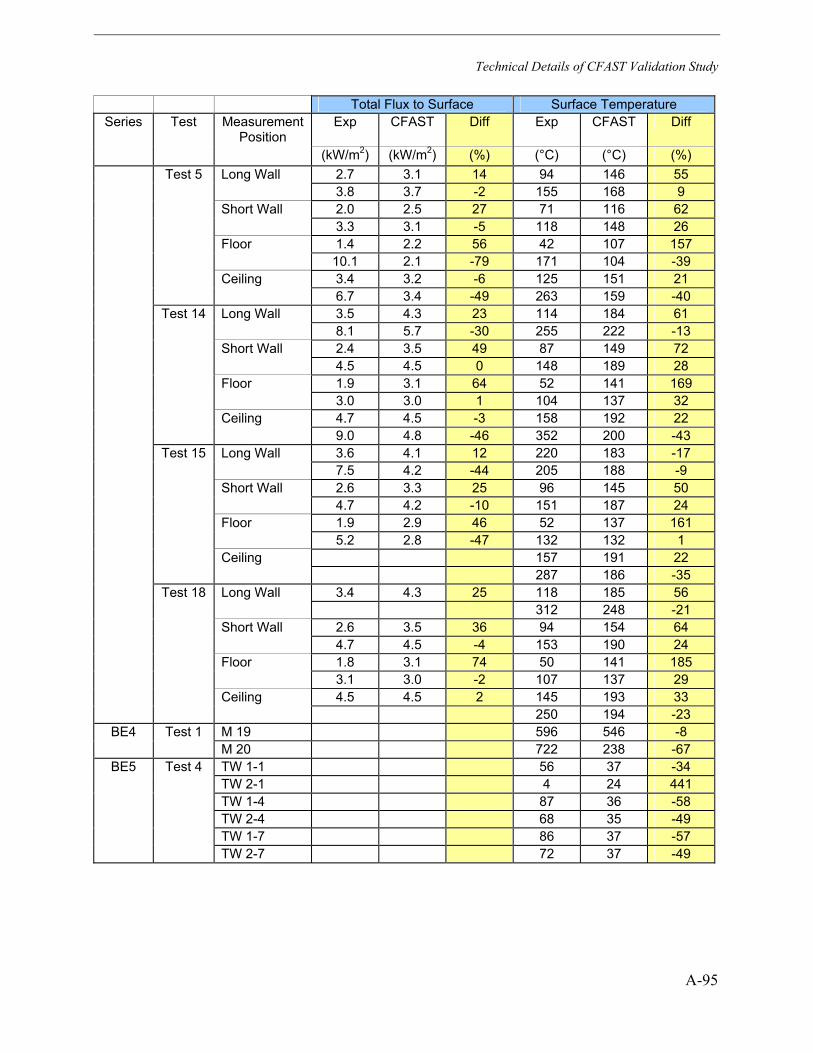
Technical Details of CFAST Validation Study
A-95
Total Flux to Surface Surface Temperature Series Test Measurement
Position Exp CFAST Diff Exp CFAST Diff
(kW/m2) (kW/m2) (%) (°C) (°C) (%) Test 5 Long Wall 2.7 3.1 14 94 146 55 3.8 3.7 -2 155 168 9 Short Wall 2.0 2.5 27 71 116 62 3.3 3.1 -5 118 148 26 Floor 1.4 2.2 56 42 107 157 10.1 2.1 -79 171 104 -39 Ceiling 3.4 3.2 -6 125 151 21 6.7 3.4 -49 263 159 -40 Test 14 Long Wall 3.5 4.3 23 114 184 61 8.1 5.7 -30 255 222 -13 Short Wall 2.4 3.5 49 87 149 72 4.5 4.5 0 148 189 28 Floor 1.9 3.1 64 52 141 169 3.0 3.0 1 104 137 32 Ceiling 4.7 4.5 -3 158 192 22 9.0 4.8 -46 352 200 -43 Test 15 Long Wall 3.6 4.1 12 220 183 -17 7.5 4.2 -44 205 188 -9 Short Wall 2.6 3.3 25 96 145 50 4.7 4.2 -10 151 187 24 Floor 1.9 2.9 46 52 137 161 5.2 2.8 -47 132 132 1 Ceiling 157 191 22 287 186 -35 Test 18 Long Wall 3.4 4.3 25 118 185 56 312 248 -21 Short Wall 2.6 3.5 36 94 154 64 4.7 4.5 -4 153 190 24 Floor 1.8 3.1 74 50 141 185 3.1 3.0 -2 107 137 29 Ceiling 4.5 4.5 2 145 193 33 250 194 -23
BE4 Test 1 M 19 596 546 -8 M 20 722 238 -67
BE5 Test 4 TW 1-1 56 37 -34 TW 2-1 4 24 441 TW 1-4 87 36 -58 TW 2-4 68 35 -49 TW 1-7 86 37 -57 TW 2-7 72 37 -49

B-1
B CFAST INPUT FILES
This appendix includes the CFAST input files used for the simulations in this V&V study. They are organized by test series, as follows:
B.1 ICFMP Benchmark Exercise #2
B.2 ICFMP Benchmark Exercise #3
B.3 ICFMP Benchmark Exercise #4
B.4 ICFMP Benchmark Exercise #5
B.5 FM /SNL Test Series
B.6 NBS Test Series
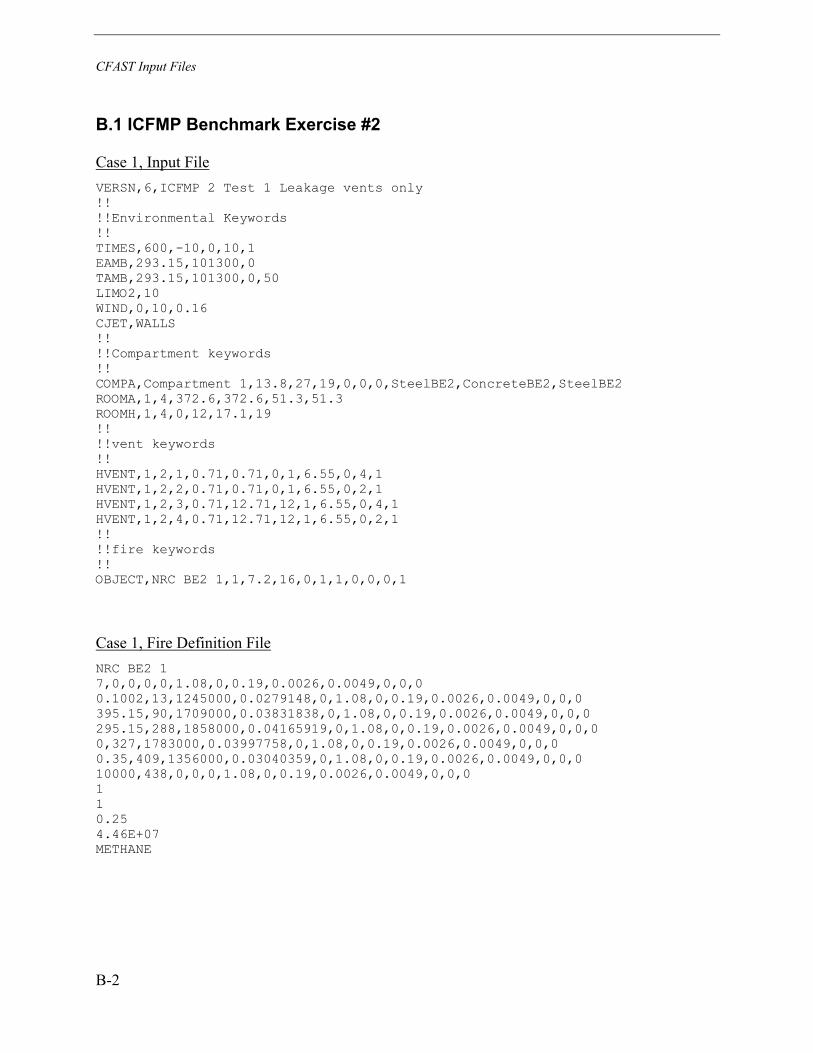
CFAST Input Files
B-2
B.1 ICFMP Benchmark Exercise #2
Case 1, Input File VERSN,6,ICFMP 2 Test 1 Leakage vents only !! !!Environmental Keywords !! TIMES,600,-10,0,10,1 EAMB,293.15,101300,0 TAMB,293.15,101300,0,50 LIMO2,10 WIND,0,10,0.16 CJET,WALLS !! !!Compartment keywords !! COMPA,Compartment 1,13.8,27,19,0,0,0,SteelBE2,ConcreteBE2,SteelBE2 ROOMA,1,4,372.6,372.6,51.3,51.3 ROOMH,1,4,0,12,17.1,19 !! !!vent keywords !! HVENT,1,2,1,0.71,0.71,0,1,6.55,0,4,1 HVENT,1,2,2,0.71,0.71,0,1,6.55,0,2,1 HVENT,1,2,3,0.71,12.71,12,1,6.55,0,4,1 HVENT,1,2,4,0.71,12.71,12,1,6.55,0,2,1 !! !!fire keywords !! OBJECT,NRC BE2 1,1,7.2,16,0,1,1,0,0,0,1
Case 1, Fire Definition File NRC BE2 1 7,0,0,0,0,1.08,0,0.19,0.0026,0.0049,0,0,0 0.1002,13,1245000,0.0279148,0,1.08,0,0.19,0.0026,0.0049,0,0,0 395.15,90,1709000,0.03831838,0,1.08,0,0.19,0.0026,0.0049,0,0,0 295.15,288,1858000,0.04165919,0,1.08,0,0.19,0.0026,0.0049,0,0,0 0,327,1783000,0.03997758,0,1.08,0,0.19,0.0026,0.0049,0,0,0 0.35,409,1356000,0.03040359,0,1.08,0,0.19,0.0026,0.0049,0,0,0 10000,438,0,0,0,1.08,0,0.19,0.0026,0.0049,0,0,0 1 1 0.25 4.46E+07 METHANE
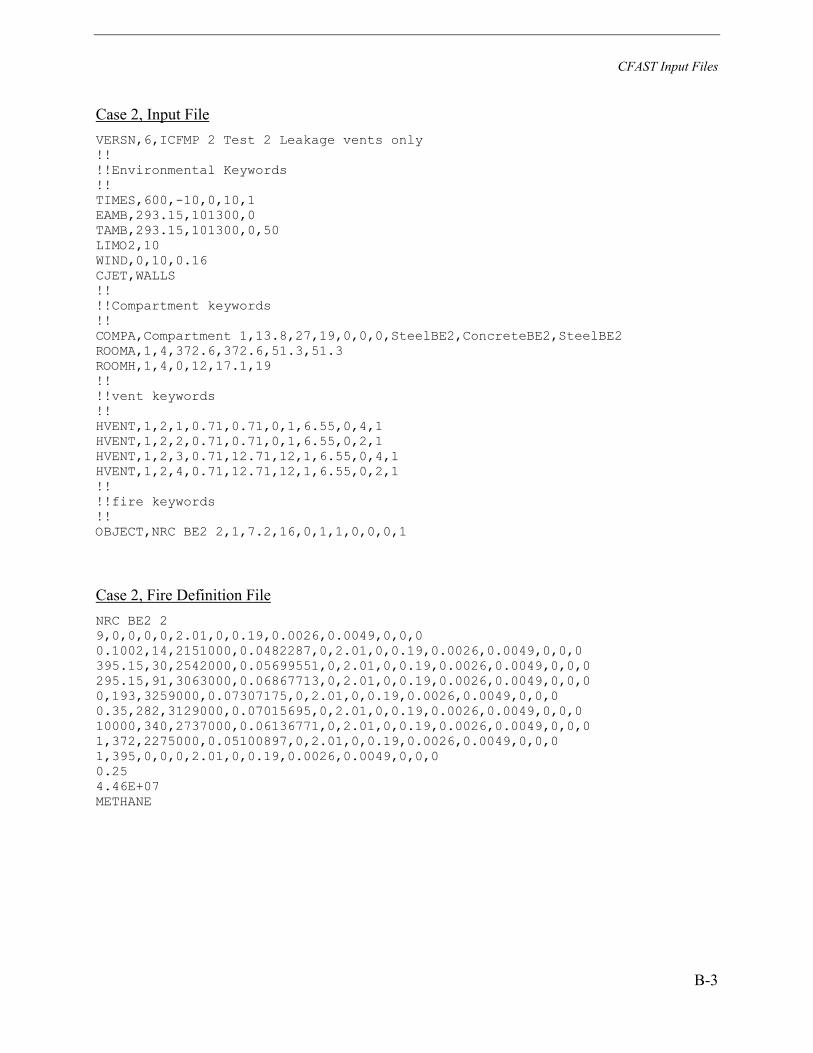
CFAST Input Files
B-3
Case 2, Input File VERSN,6,ICFMP 2 Test 2 Leakage vents only !! !!Environmental Keywords !! TIMES,600,-10,0,10,1 EAMB,293.15,101300,0 TAMB,293.15,101300,0,50 LIMO2,10 WIND,0,10,0.16 CJET,WALLS !! !!Compartment keywords !! COMPA,Compartment 1,13.8,27,19,0,0,0,SteelBE2,ConcreteBE2,SteelBE2 ROOMA,1,4,372.6,372.6,51.3,51.3 ROOMH,1,4,0,12,17.1,19 !! !!vent keywords !! HVENT,1,2,1,0.71,0.71,0,1,6.55,0,4,1 HVENT,1,2,2,0.71,0.71,0,1,6.55,0,2,1 HVENT,1,2,3,0.71,12.71,12,1,6.55,0,4,1 HVENT,1,2,4,0.71,12.71,12,1,6.55,0,2,1 !! !!fire keywords !! OBJECT,NRC BE2 2,1,7.2,16,0,1,1,0,0,0,1
Case 2, Fire Definition File NRC BE2 2 9,0,0,0,0,2.01,0,0.19,0.0026,0.0049,0,0,0 0.1002,14,2151000,0.0482287,0,2.01,0,0.19,0.0026,0.0049,0,0,0 395.15,30,2542000,0.05699551,0,2.01,0,0.19,0.0026,0.0049,0,0,0 295.15,91,3063000,0.06867713,0,2.01,0,0.19,0.0026,0.0049,0,0,0 0,193,3259000,0.07307175,0,2.01,0,0.19,0.0026,0.0049,0,0,0 0.35,282,3129000,0.07015695,0,2.01,0,0.19,0.0026,0.0049,0,0,0 10000,340,2737000,0.06136771,0,2.01,0,0.19,0.0026,0.0049,0,0,0 1,372,2275000,0.05100897,0,2.01,0,0.19,0.0026,0.0049,0,0,0 1,395,0,0,0,2.01,0,0.19,0.0026,0.0049,0,0,0 0.25 4.46E+07 METHANE
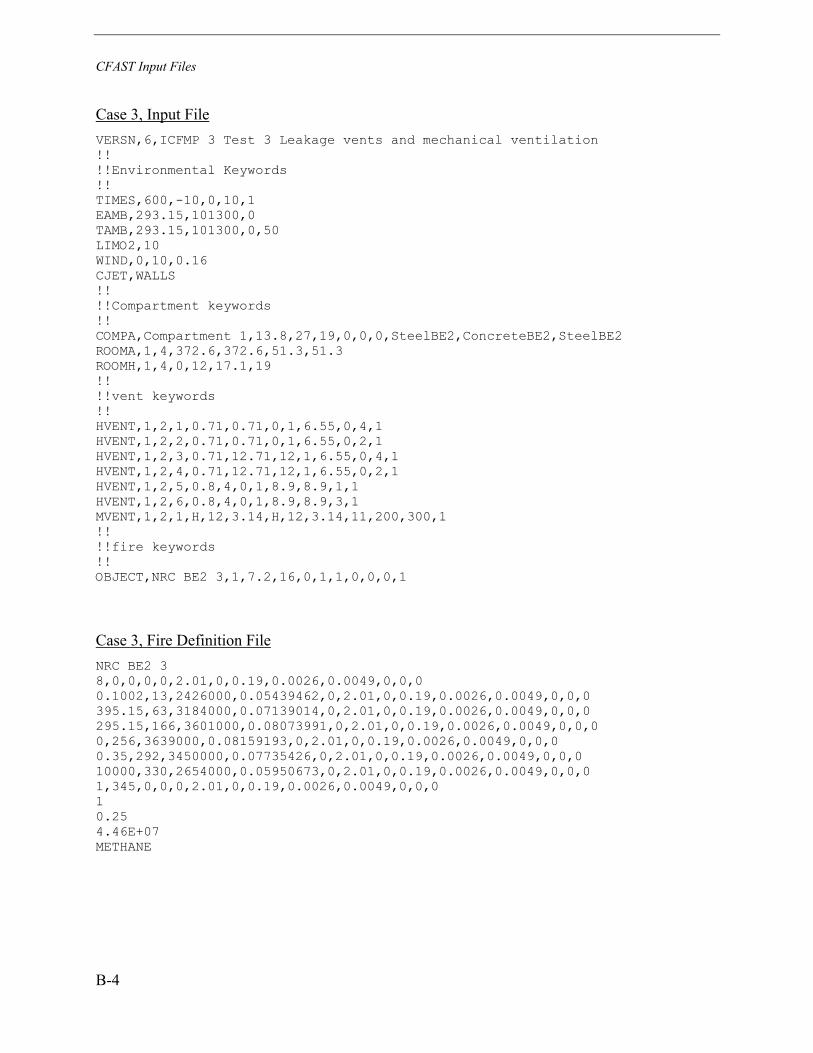
CFAST Input Files
B-4
Case 3, Input File VERSN,6,ICFMP 3 Test 3 Leakage vents and mechanical ventilation !! !!Environmental Keywords !! TIMES,600,-10,0,10,1 EAMB,293.15,101300,0 TAMB,293.15,101300,0,50 LIMO2,10 WIND,0,10,0.16 CJET,WALLS !! !!Compartment keywords !! COMPA,Compartment 1,13.8,27,19,0,0,0,SteelBE2,ConcreteBE2,SteelBE2 ROOMA,1,4,372.6,372.6,51.3,51.3 ROOMH,1,4,0,12,17.1,19 !! !!vent keywords !! HVENT,1,2,1,0.71,0.71,0,1,6.55,0,4,1 HVENT,1,2,2,0.71,0.71,0,1,6.55,0,2,1 HVENT,1,2,3,0.71,12.71,12,1,6.55,0,4,1 HVENT,1,2,4,0.71,12.71,12,1,6.55,0,2,1 HVENT,1,2,5,0.8,4,0,1,8.9,8.9,1,1 HVENT,1,2,6,0.8,4,0,1,8.9,8.9,3,1 MVENT,1,2,1,H,12,3.14,H,12,3.14,11,200,300,1 !! !!fire keywords !! OBJECT,NRC BE2 3,1,7.2,16,0,1,1,0,0,0,1
Case 3, Fire Definition File NRC BE2 3 8,0,0,0,0,2.01,0,0.19,0.0026,0.0049,0,0,0 0.1002,13,2426000,0.05439462,0,2.01,0,0.19,0.0026,0.0049,0,0,0 395.15,63,3184000,0.07139014,0,2.01,0,0.19,0.0026,0.0049,0,0,0 295.15,166,3601000,0.08073991,0,2.01,0,0.19,0.0026,0.0049,0,0,0 0,256,3639000,0.08159193,0,2.01,0,0.19,0.0026,0.0049,0,0,0 0.35,292,3450000,0.07735426,0,2.01,0,0.19,0.0026,0.0049,0,0,0 10000,330,2654000,0.05950673,0,2.01,0,0.19,0.0026,0.0049,0,0,0 1,345,0,0,0,2.01,0,0.19,0.0026,0.0049,0,0,0 1 0.25 4.46E+07 METHANE
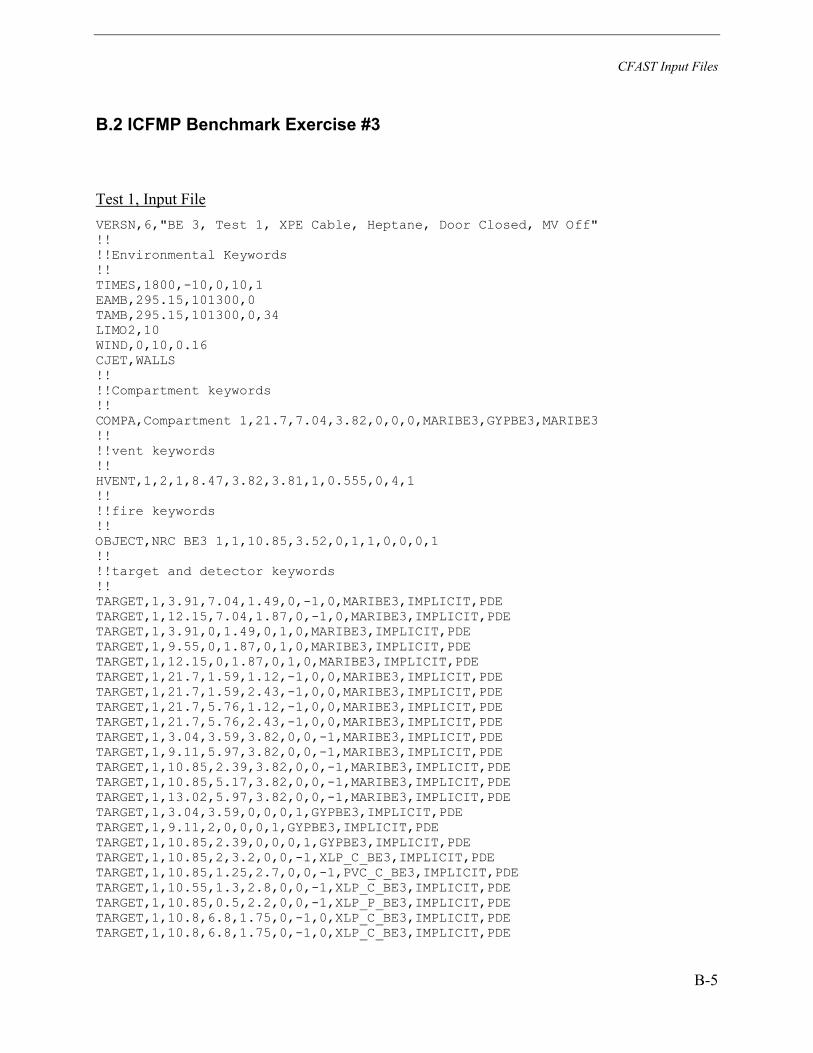
CFAST Input Files
B-5
B.2 ICFMP Benchmark Exercise #3
Test 1, Input File VERSN,6,"BE 3, Test 1, XPE Cable, Heptane, Door Closed, MV Off" !! !!Environmental Keywords !! TIMES,1800,-10,0,10,1 EAMB,295.15,101300,0 TAMB,295.15,101300,0,34 LIMO2,10 WIND,0,10,0.16 CJET,WALLS !! !!Compartment keywords !! COMPA,Compartment 1,21.7,7.04,3.82,0,0,0,MARIBE3,GYPBE3,MARIBE3 !! !!vent keywords !! HVENT,1,2,1,8.47,3.82,3.81,1,0.555,0,4,1 !! !!fire keywords !! OBJECT,NRC BE3 1,1,10.85,3.52,0,1,1,0,0,0,1 !! !!target and detector keywords !! TARGET,1,3.91,7.04,1.49,0,-1,0,MARIBE3,IMPLICIT,PDE TARGET,1,12.15,7.04,1.87,0,-1,0,MARIBE3,IMPLICIT,PDE TARGET,1,3.91,0,1.49,0,1,0,MARIBE3,IMPLICIT,PDE TARGET,1,9.55,0,1.87,0,1,0,MARIBE3,IMPLICIT,PDE TARGET,1,12.15,0,1.87,0,1,0,MARIBE3,IMPLICIT,PDE TARGET,1,21.7,1.59,1.12,-1,0,0,MARIBE3,IMPLICIT,PDE TARGET,1,21.7,1.59,2.43,-1,0,0,MARIBE3,IMPLICIT,PDE TARGET,1,21.7,5.76,1.12,-1,0,0,MARIBE3,IMPLICIT,PDE TARGET,1,21.7,5.76,2.43,-1,0,0,MARIBE3,IMPLICIT,PDE TARGET,1,3.04,3.59,3.82,0,0,-1,MARIBE3,IMPLICIT,PDE TARGET,1,9.11,5.97,3.82,0,0,-1,MARIBE3,IMPLICIT,PDE TARGET,1,10.85,2.39,3.82,0,0,-1,MARIBE3,IMPLICIT,PDE TARGET,1,10.85,5.17,3.82,0,0,-1,MARIBE3,IMPLICIT,PDE TARGET,1,13.02,5.97,3.82,0,0,-1,MARIBE3,IMPLICIT,PDE TARGET,1,3.04,3.59,0,0,0,1,GYPBE3,IMPLICIT,PDE TARGET,1,9.11,2,0,0,0,1,GYPBE3,IMPLICIT,PDE TARGET,1,10.85,2.39,0,0,0,1,GYPBE3,IMPLICIT,PDE TARGET,1,10.85,2,3.2,0,0,-1,XLP_C_BE3,IMPLICIT,PDE TARGET,1,10.85,1.25,2.7,0,0,-1,PVC_C_BE3,IMPLICIT,PDE TARGET,1,10.55,1.3,2.8,0,0,-1,XLP_C_BE3,IMPLICIT,PDE TARGET,1,10.85,0.5,2.2,0,0,-1,XLP_P_BE3,IMPLICIT,PDE TARGET,1,10.8,6.8,1.75,0,-1,0,XLP_C_BE3,IMPLICIT,PDE TARGET,1,10.8,6.8,1.75,0,-1,0,XLP_C_BE3,IMPLICIT,PDE
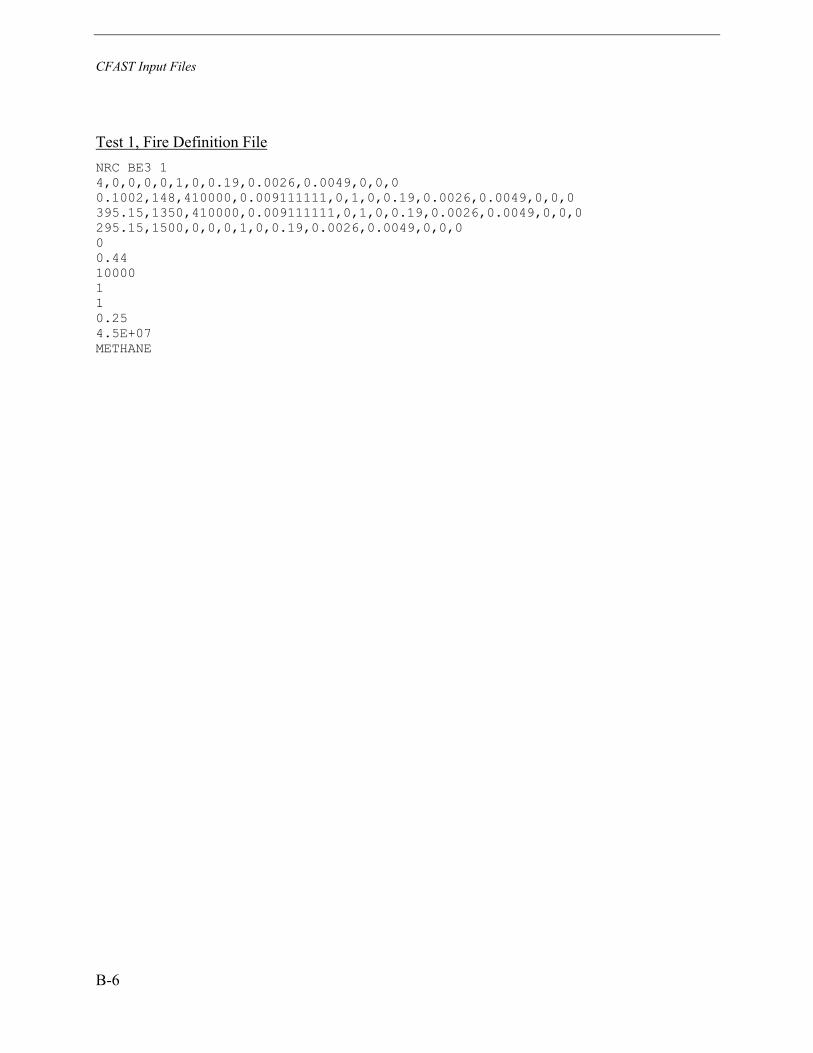
CFAST Input Files
B-6
Test 1, Fire Definition File NRC BE3 1 4,0,0,0,0,1,0,0.19,0.0026,0.0049,0,0,0 0.1002,148,410000,0.009111111,0,1,0,0.19,0.0026,0.0049,0,0,0 395.15,1350,410000,0.009111111,0,1,0,0.19,0.0026,0.0049,0,0,0 295.15,1500,0,0,0,1,0,0.19,0.0026,0.0049,0,0,0 0 0.44 10000 1 1 0.25 4.5E+07 METHANE

CFAST Input Files
B-7
Test 2, Input File VERSN,6,"BE 3, Test 2, XPE Cable, Heptane, Door Closed, MV Off" !! !!Environmental Keywords !! TIMES,1800,-10,0,10,1 EAMB,299.15,101300,0 TAMB,299.15,101300,0,36 LIMO2,10 WIND,0,10,0.16 CJET,WALLS !! !!Compartment keywords !! COMPA,Compartment 1,21.7,7.04,3.82,0,0,0,MARIBE3,GYPBE3,MARIBE3 !! !!vent keywords !! HVENT,1,2,1,8.29,3.82,3.81,1,0.555,0,4,1 !! !!fire keywords !! OBJECT,NRC BE3 2,1,10.85,3.52,0,1,1,0,0,0,1 !! !!target and detector keywords !! TARGET,1,3.91,7.04,1.49,0,-1,0,MARIBE3,IMPLICIT,PDE TARGET,1,12.15,7.04,1.87,0,-1,0,MARIBE3,IMPLICIT,PDE TARGET,1,3.91,0,1.49,0,1,0,MARIBE3,IMPLICIT,PDE TARGET,1,9.55,0,1.87,0,1,0,MARIBE3,IMPLICIT,PDE TARGET,1,12.15,0,1.87,0,1,0,MARIBE3,IMPLICIT,PDE TARGET,1,21.7,1.59,1.12,-1,0,0,MARIBE3,IMPLICIT,PDE TARGET,1,21.7,1.59,2.43,-1,0,0,MARIBE3,IMPLICIT,PDE TARGET,1,21.7,5.76,1.12,-1,0,0,MARIBE3,IMPLICIT,PDE TARGET,1,21.7,5.76,2.43,-1,0,0,MARIBE3,IMPLICIT,PDE TARGET,1,3.04,3.59,3.82,0,0,-1,MARIBE3,IMPLICIT,PDE TARGET,1,9.11,5.97,3.82,0,0,-1,MARIBE3,IMPLICIT,PDE TARGET,1,10.85,2.39,3.82,0,0,-1,MARIBE3,IMPLICIT,PDE TARGET,1,10.85,5.17,3.82,0,0,-1,MARIBE3,IMPLICIT,PDE TARGET,1,13.02,5.97,3.82,0,0,-1,MARIBE3,IMPLICIT,PDE TARGET,1,3.04,3.59,0,0,0,1,GYPBE3,IMPLICIT,PDE TARGET,1,9.11,2,0,0,0,1,GYPBE3,IMPLICIT,PDE TARGET,1,10.85,2.39,0,0,0,1,GYPBE3,IMPLICIT,PDE TARGET,1,10.85,2,3.2,0,0,-1,XLP_C_BE3,IMPLICIT,PDE TARGET,1,10.85,1.25,2.7,0,0,-1,PVC_C_BE3,IMPLICIT,PDE TARGET,1,10.55,1.3,2.8,0,0,-1,XLP_C_BE3,IMPLICIT,PDE TARGET,1,10.85,0.5,2.2,0,0,-1,XLP_P_BE3,IMPLICIT,PDE TARGET,1,10.8,6.8,1.75,0,-1,0,XLP_C_BE3,IMPLICIT,PDE TARGET,1,10.8,6.8,1.75,0,-1,0,XLP_C_BE3,IMPLICIT,PDE
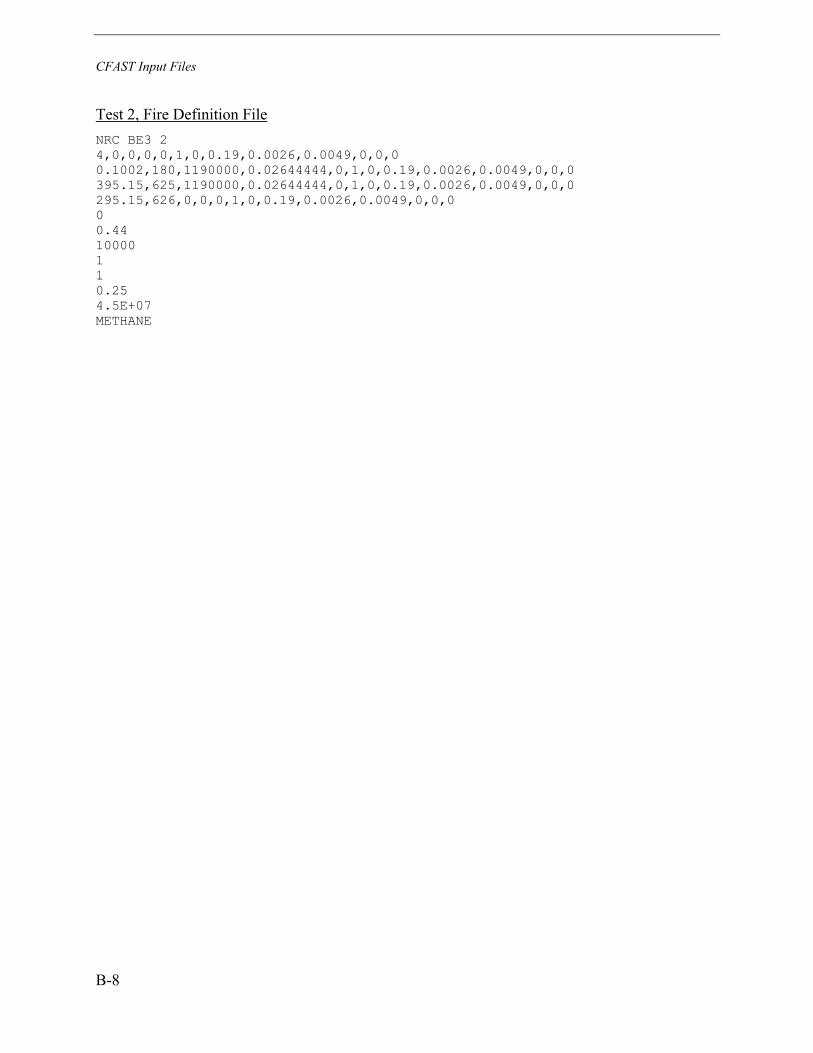
CFAST Input Files
B-8
Test 2, Fire Definition File NRC BE3 2 4,0,0,0,0,1,0,0.19,0.0026,0.0049,0,0,0 0.1002,180,1190000,0.02644444,0,1,0,0.19,0.0026,0.0049,0,0,0 395.15,625,1190000,0.02644444,0,1,0,0.19,0.0026,0.0049,0,0,0 295.15,626,0,0,0,1,0,0.19,0.0026,0.0049,0,0,0 0 0.44 10000 1 1 0.25 4.5E+07 METHANE

CFAST Input Files
B-9
Test 3, Input File VERSN,6,"BE 3, Test 3, XPE Cable, Heptane, Door Open, MV Off" !! !!Environmental Keywords !! TIMES,1800,-10,0,10,1 EAMB,303.15,101300,0 TAMB,303.15,101300,0,34 LIMO2,10 WIND,0,10,0.16 CJET,WALLS !! !!Compartment keywords !! COMPA,Compartment 1,21.7,7.04,3.82,0,0,0,MARIBE3,GYPBE3,MARIBE3 !! !!vent keywords !! HVENT,1,2,1,2,2,0,1,2.58,0,4,1 !! !!fire keywords !! OBJECT,NRC BE3 3,1,10.85,3.52,0,1,1,0,0,0,1 !! !!target and detector keywords !! TARGET,1,3.91,7.04,1.49,0,-1,0,MARIBE3,IMPLICIT,PDE TARGET,1,12.15,7.04,1.87,0,-1,0,MARIBE3,IMPLICIT,PDE TARGET,1,3.91,0,1.49,0,1,0,MARIBE3,IMPLICIT,PDE TARGET,1,9.55,0,1.87,0,1,0,MARIBE3,IMPLICIT,PDE TARGET,1,12.15,0,1.87,0,1,0,MARIBE3,IMPLICIT,PDE TARGET,1,21.7,1.59,1.12,-1,0,0,MARIBE3,IMPLICIT,PDE TARGET,1,21.7,1.59,2.43,-1,0,0,MARIBE3,IMPLICIT,PDE TARGET,1,21.7,5.76,1.12,-1,0,0,MARIBE3,IMPLICIT,PDE TARGET,1,21.7,5.76,2.43,-1,0,0,MARIBE3,IMPLICIT,PDE TARGET,1,3.04,3.59,3.82,0,0,-1,MARIBE3,IMPLICIT,PDE TARGET,1,9.11,5.97,3.82,0,0,-1,MARIBE3,IMPLICIT,PDE TARGET,1,10.85,2.39,3.82,0,0,-1,MARIBE3,IMPLICIT,PDE TARGET,1,10.85,5.17,3.82,0,0,-1,MARIBE3,IMPLICIT,PDE TARGET,1,13.02,5.97,3.82,0,0,-1,MARIBE3,IMPLICIT,PDE TARGET,1,3.04,3.59,0,0,0,1,GYPBE3,IMPLICIT,PDE TARGET,1,9.11,2,0,0,0,1,GYPBE3,IMPLICIT,PDE TARGET,1,10.85,2.39,0,0,0,1,GYPBE3,IMPLICIT,PDE TARGET,1,10.85,2,3.2,0,0,-1,XLP_C_BE3,IMPLICIT,PDE TARGET,1,10.85,1.25,2.7,0,0,-1,PVC_C_BE3,IMPLICIT,PDE TARGET,1,10.55,1.3,2.8,0,0,-1,XLP_C_BE3,IMPLICIT,PDE TARGET,1,10.85,0.5,2.2,0,0,-1,XLP_P_BE3,IMPLICIT,PDE TARGET,1,10.8,6.8,1.75,0,-1,0,XLP_C_BE3,IMPLICIT,PDE TARGET,1,10.8,6.8,1.75,0,-1,0,XLP_C_BE3,IMPLICIT,PDE

CFAST Input Files
B-10
Test 3, Fire Definition File NRC BE3 3 4,0,0,0,0,1,0,0.19,0.0026,0.0049,0,0,0 0.1002,178,1190000,0.02644444,0,1,0,0.19,0.0026,0.0049,0,0,0 395.15,1379,1190000,0.02644444,0,1,0,0.19,0.0026,0.0049,0,0,0 295.15,1562,0,0,0,1,0,0.19,0.0026,0.0049,0,0,0 0 0.44 10000 1 1 0.25 4.5E+07 METHANE

CFAST Input Files
B-11
Test 4, Input File VERSN,6,"BE 3, Test 4, XPE Cable, Heptane, Door Closed, MV On" !! !!Environmental Keywords !! TIMES,1800,-10,0,10,1 EAMB,300.15,101300,0 TAMB,300.15,101300,0,44 LIMO2,10 WIND,0,10,0.16 CJET,WALLS !! !!Compartment keywords !! COMPA,Compartment 1,21.7,7.04,3.82,0,0,0,MARIBE3,GYPBE3,MARIBE3 !! !!vent keywords !! HVENT,1,2,1,8.29,3.82,3.81,1,0.555,0,4,1 MVENT,2,1,1,V,2.4,0.49,V,2.4,0.49,0.9,200,300,1 MVENT,1,2,2,V,2.4,0.49,V,2.4,0.49,1.7,200,300,1 !! !!fire keywords !! OBJECT,NRC BE3 4,1,10.85,3.52,0,1,1,0,0,0,1 !! !!target and detector keywords !! TARGET,1,3.91,7.04,1.49,0,-1,0,MARIBE3,IMPLICIT,PDE TARGET,1,12.15,7.04,1.87,0,-1,0,MARIBE3,IMPLICIT,PDE TARGET,1,3.91,0,1.49,0,1,0,MARIBE3,IMPLICIT,PDE TARGET,1,9.55,0,1.87,0,1,0,MARIBE3,IMPLICIT,PDE TARGET,1,12.15,0,1.87,0,1,0,MARIBE3,IMPLICIT,PDE TARGET,1,21.7,1.59,1.12,-1,0,0,MARIBE3,IMPLICIT,PDE TARGET,1,21.7,1.59,2.43,-1,0,0,MARIBE3,IMPLICIT,PDE TARGET,1,21.7,5.76,1.12,-1,0,0,MARIBE3,IMPLICIT,PDE TARGET,1,21.7,5.76,2.43,-1,0,0,MARIBE3,IMPLICIT,PDE TARGET,1,3.04,3.59,3.82,0,0,-1,MARIBE3,IMPLICIT,PDE TARGET,1,9.11,5.97,3.82,0,0,-1,MARIBE3,IMPLICIT,PDE TARGET,1,10.85,2.39,3.82,0,0,-1,MARIBE3,IMPLICIT,PDE TARGET,1,10.85,5.17,3.82,0,0,-1,MARIBE3,IMPLICIT,PDE TARGET,1,13.02,5.97,3.82,0,0,-1,MARIBE3,IMPLICIT,PDE TARGET,1,3.04,3.59,0,0,0,1,GYPBE3,IMPLICIT,PDE TARGET,1,9.11,2,0,0,0,1,GYPBE3,IMPLICIT,PDE TARGET,1,10.85,2.39,0,0,0,1,GYPBE3,IMPLICIT,PDE TARGET,1,10.85,2,3.2,0,0,-1,XLP_C_BE3,IMPLICIT,PDE TARGET,1,10.85,1.25,2.7,0,0,-1,XLP_C_BE3,IMPLICIT,PDE TARGET,1,10.55,1.3,2.8,0,0,-1,XLP_C_BE3,IMPLICIT,PDE TARGET,1,10.85,0.5,2.2,0,0,-1,XLP_P_BE3,IMPLICIT,PDE TARGET,1,10.8,6.8,1.75,0,-1,0,XLP_C_BE3,IMPLICIT,PDE TARGET,1,10.8,6.8,1.75,0,-1,0,XLP_C_BE3,IMPLICIT,PDE

CFAST Input Files
B-12
Test 4, Fire Definition File NRC BE3 4 4,0,0,0,0,1,0,0.19,0.0026,0.0049,0,0,0 0.1002,178,1200000,0.02666667,0,1,0,0.19,0.0026,0.0049,0,0,0 395.15,814,1200000,0.02666667,0,1,0,0.19,0.0026,0.0049,0,0,0 295.15,815,0,0,0,1,0,0.19,0.0026,0.0049,0,0,0 0 0.44 10000 1 1 0.25 4.5E+07 METHANE
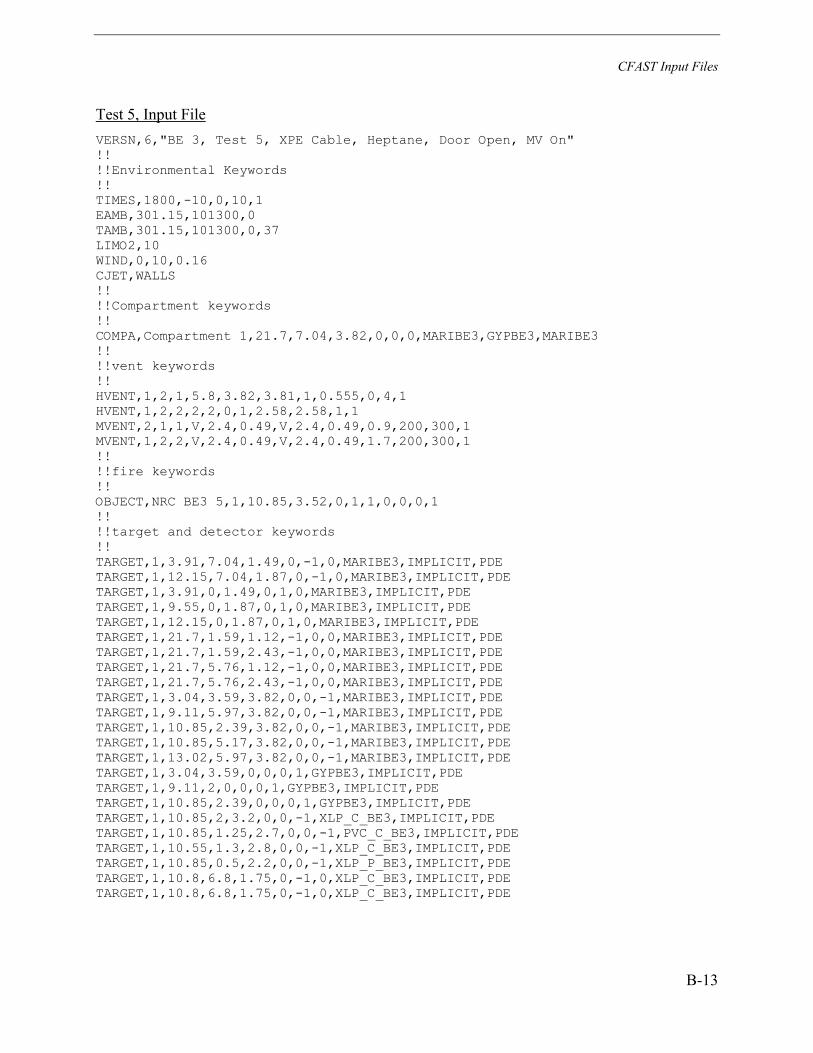
CFAST Input Files
B-13
Test 5, Input File VERSN,6,"BE 3, Test 5, XPE Cable, Heptane, Door Open, MV On" !! !!Environmental Keywords !! TIMES,1800,-10,0,10,1 EAMB,301.15,101300,0 TAMB,301.15,101300,0,37 LIMO2,10 WIND,0,10,0.16 CJET,WALLS !! !!Compartment keywords !! COMPA,Compartment 1,21.7,7.04,3.82,0,0,0,MARIBE3,GYPBE3,MARIBE3 !! !!vent keywords !! HVENT,1,2,1,5.8,3.82,3.81,1,0.555,0,4,1 HVENT,1,2,2,2,2,0,1,2.58,2.58,1,1 MVENT,2,1,1,V,2.4,0.49,V,2.4,0.49,0.9,200,300,1 MVENT,1,2,2,V,2.4,0.49,V,2.4,0.49,1.7,200,300,1 !! !!fire keywords !! OBJECT,NRC BE3 5,1,10.85,3.52,0,1,1,0,0,0,1 !! !!target and detector keywords !! TARGET,1,3.91,7.04,1.49,0,-1,0,MARIBE3,IMPLICIT,PDE TARGET,1,12.15,7.04,1.87,0,-1,0,MARIBE3,IMPLICIT,PDE TARGET,1,3.91,0,1.49,0,1,0,MARIBE3,IMPLICIT,PDE TARGET,1,9.55,0,1.87,0,1,0,MARIBE3,IMPLICIT,PDE TARGET,1,12.15,0,1.87,0,1,0,MARIBE3,IMPLICIT,PDE TARGET,1,21.7,1.59,1.12,-1,0,0,MARIBE3,IMPLICIT,PDE TARGET,1,21.7,1.59,2.43,-1,0,0,MARIBE3,IMPLICIT,PDE TARGET,1,21.7,5.76,1.12,-1,0,0,MARIBE3,IMPLICIT,PDE TARGET,1,21.7,5.76,2.43,-1,0,0,MARIBE3,IMPLICIT,PDE TARGET,1,3.04,3.59,3.82,0,0,-1,MARIBE3,IMPLICIT,PDE TARGET,1,9.11,5.97,3.82,0,0,-1,MARIBE3,IMPLICIT,PDE TARGET,1,10.85,2.39,3.82,0,0,-1,MARIBE3,IMPLICIT,PDE TARGET,1,10.85,5.17,3.82,0,0,-1,MARIBE3,IMPLICIT,PDE TARGET,1,13.02,5.97,3.82,0,0,-1,MARIBE3,IMPLICIT,PDE TARGET,1,3.04,3.59,0,0,0,1,GYPBE3,IMPLICIT,PDE TARGET,1,9.11,2,0,0,0,1,GYPBE3,IMPLICIT,PDE TARGET,1,10.85,2.39,0,0,0,1,GYPBE3,IMPLICIT,PDE TARGET,1,10.85,2,3.2,0,0,-1,XLP_C_BE3,IMPLICIT,PDE TARGET,1,10.85,1.25,2.7,0,0,-1,PVC_C_BE3,IMPLICIT,PDE TARGET,1,10.55,1.3,2.8,0,0,-1,XLP_C_BE3,IMPLICIT,PDE TARGET,1,10.85,0.5,2.2,0,0,-1,XLP_P_BE3,IMPLICIT,PDE TARGET,1,10.8,6.8,1.75,0,-1,0,XLP_C_BE3,IMPLICIT,PDE TARGET,1,10.8,6.8,1.75,0,-1,0,XLP_C_BE3,IMPLICIT,PDE

CFAST Input Files
B-14
Test 5, Fire Definition File NRC BE3 5 4,0,0,0,0,1,0,0.19,0.0026,0.0049,0,0,0 0.1002,178,1190000,0.02644444,0,1,0,0.19,0.0026,0.0049,0,0,0 395.15,1379,1190000,0.02644444,0,1,0,0.19,0.0026,0.0049,0,0,0 295.15,1562,0,0,0,1,0,0.19,0.0026,0.0049,0,0,0 0 0.44 10000 1 1 0.25 4.5E+07 METHANE

CFAST Input Files
B-15
Test 7, Input File VERSN,6,"BE 3, Test 7, PVC Cable, Heptane, Door Closed, MV Off" !! !!Environmental Keywords !! TIMES,1800,-10,0,10,1 EAMB,297.15,101300,0 TAMB,297.15,101300,0,58 LIMO2,10 WIND,0,10,0.16 CJET,WALLS !! !!Compartment keywords !! COMPA,Compartment 1,21.7,7.04,3.82,0,0,0,MARIBE3,GYPBE3,MARIBE3 !! !!vent keywords !! HVENT,1,2,1,10.17,3.82,3.81,1,0.555,0,4,1 !! !!fire keywords !! OBJECT,NRC BE3 7,1,10.85,3.52,0,1,1,0,0,0,1 !! !!target and detector keywords !! TARGET,1,3.91,7.04,1.49,0,-1,0,MARIBE3,IMPLICIT,PDE TARGET,1,12.15,7.04,1.87,0,-1,0,MARIBE3,IMPLICIT,PDE TARGET,1,3.91,0,1.49,0,1,0,MARIBE3,IMPLICIT,PDE TARGET,1,9.55,0,1.87,0,1,0,MARIBE3,IMPLICIT,PDE TARGET,1,12.15,0,1.87,0,1,0,MARIBE3,IMPLICIT,PDE TARGET,1,21.7,1.59,1.12,-1,0,0,MARIBE3,IMPLICIT,PDE TARGET,1,21.7,1.59,2.43,-1,0,0,MARIBE3,IMPLICIT,PDE TARGET,1,21.7,5.76,1.12,-1,0,0,MARIBE3,IMPLICIT,PDE TARGET,1,21.7,5.76,2.43,-1,0,0,MARIBE3,IMPLICIT,PDE TARGET,1,3.04,3.59,3.82,0,0,-1,MARIBE3,IMPLICIT,PDE TARGET,1,9.11,5.97,3.82,0,0,-1,MARIBE3,IMPLICIT,PDE TARGET,1,10.85,2.39,3.82,0,0,-1,MARIBE3,IMPLICIT,PDE TARGET,1,10.85,5.17,3.82,0,0,-1,MARIBE3,IMPLICIT,PDE TARGET,1,13.02,5.97,3.82,0,0,-1,MARIBE3,IMPLICIT,PDE TARGET,1,3.04,3.59,0,0,0,1,GYPBE3,IMPLICIT,PDE TARGET,1,9.11,2,0,0,0,1,GYPBE3,IMPLICIT,PDE TARGET,1,10.85,2.39,0,0,0,1,GYPBE3,IMPLICIT,PDE TARGET,1,10.85,2,3.2,0,0,-1,PVC_C_BE3,IMPLICIT,PDE TARGET,1,10.85,1.25,2.7,0,0,-1,PVC_C_BE3,IMPLICIT,PDE TARGET,1,10.55,1.3,2.8,0,0,-1,PVC_C_BE3,IMPLICIT,PDE TARGET,1,10.85,0.5,2.2,0,0,-1,PVC_P_BE3,IMPLICIT,PDE TARGET,1,10.8,6.8,1.75,0,-1,0,XLP_C_BE3,IMPLICIT,PDE TARGET,1,10.8,6.8,1.75,0,-1,0,XLP_C_BE3,IMPLICIT,PDE

CFAST Input Files
B-16
Test 7, Fire Definition File NRC BE3 7 4,0,0,0,0,1,0,0.19,0.0026,0.0049,0,0,0 0.1002,129,400000,0.008888889,0,1,0,0.19,0.0026,0.0049,0,0,0 395.15,1332,400000,0.008888889,0,1,0,0.19,0.0026,0.0049,0,0,0 295.15,1460,0,0,0,1,0,0.19,0.0026,0.0049,0,0,0 0 0.44 10000 1 1 0.25 4.5E+07 METHANE

CFAST Input Files
B-17
Test 8, Input File VERSN,6,"BE 3, Test 8, XPE Cable, Heptane, Door Closed, MV Off" !! !!Environmental Keywords !! TIMES,1800,-10,0,10,1 EAMB,298.15,101300,0 TAMB,298.15,101300,0,63 LIMO2,10 WIND,0,10,0.16 CJET,WALLS !! !!Compartment keywords !! COMPA,Compartment 1,21.7,7.04,3.82,0,0,0,MARIBE3,GYPBE3,MARIBE3 !! !!vent keywords !! HVENT,1,2,1,9.21,3.82,3.81,1,0.555,0,4,1 !! !!fire keywords !! OBJECT,NRC BE3 8,1,10.85,3.52,0,1,1,0,0,0,1 !! !!target and detector keywords !! TARGET,1,3.91,7.04,1.49,0,-1,0,MARIBE3,IMPLICIT,PDE TARGET,1,12.15,7.04,1.87,0,-1,0,MARIBE3,IMPLICIT,PDE TARGET,1,3.91,0,1.49,0,1,0,MARIBE3,IMPLICIT,PDE TARGET,1,9.55,0,1.87,0,1,0,MARIBE3,IMPLICIT,PDE TARGET,1,12.15,0,1.87,0,1,0,MARIBE3,IMPLICIT,PDE TARGET,1,21.7,1.59,1.12,-1,0,0,MARIBE3,IMPLICIT,PDE TARGET,1,21.7,1.59,2.43,-1,0,0,MARIBE3,IMPLICIT,PDE TARGET,1,21.7,5.76,1.12,-1,0,0,MARIBE3,IMPLICIT,PDE TARGET,1,21.7,5.76,2.43,-1,0,0,MARIBE3,IMPLICIT,PDE TARGET,1,3.04,3.59,3.82,0,0,-1,MARIBE3,IMPLICIT,PDE TARGET,1,9.11,5.97,3.82,0,0,-1,MARIBE3,IMPLICIT,PDE TARGET,1,10.85,2.39,3.82,0,0,-1,MARIBE3,IMPLICIT,PDE TARGET,1,10.85,5.17,3.82,0,0,-1,MARIBE3,IMPLICIT,PDE TARGET,1,13.02,5.97,3.82,0,0,-1,MARIBE3,IMPLICIT,PDE TARGET,1,3.04,3.59,0,0,0,1,GYPBE3,IMPLICIT,PDE TARGET,1,9.11,2,0,0,0,1,GYPBE3,IMPLICIT,PDE TARGET,1,10.85,2.39,0,0,0,1,GYPBE3,IMPLICIT,PDE TARGET,1,10.85,2,3.2,0,0,-1,XLP_C_BE3,IMPLICIT,PDE TARGET,1,10.85,1.25,2.7,0,0,-1,PVC_C_BE3,IMPLICIT,PDE TARGET,1,10.55,1.3,2.8,0,0,-1,XLP_C_BE3,IMPLICIT,PDE TARGET,1,10.85,0.5,2.2,0,0,-1,XLP_P_BE3,IMPLICIT,PDE TARGET,1,10.8,6.8,1.75,0,-1,0,XLP_C_BE3,IMPLICIT,PDE TARGET,1,10.8,6.8,1.75,0,-1,0,XLP_C_BE3,IMPLICIT,PDE
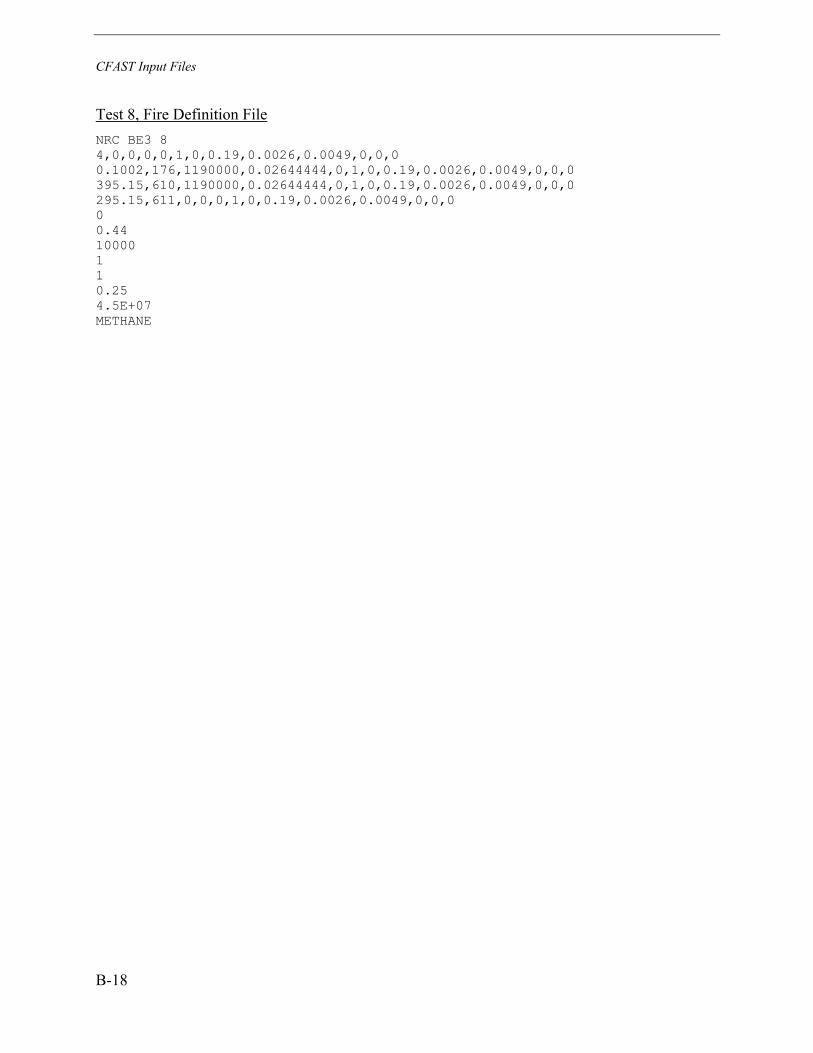
CFAST Input Files
B-18
Test 8, Fire Definition File NRC BE3 8 4,0,0,0,0,1,0,0.19,0.0026,0.0049,0,0,0 0.1002,176,1190000,0.02644444,0,1,0,0.19,0.0026,0.0049,0,0,0 395.15,610,1190000,0.02644444,0,1,0,0.19,0.0026,0.0049,0,0,0 295.15,611,0,0,0,1,0,0.19,0.0026,0.0049,0,0,0 0 0.44 10000 1 1 0.25 4.5E+07 METHANE

CFAST Input Files
B-19
Test 9, Input File VERSN,6,"BE 3, Test 9, XPE Cable, Heptane, Door Open, MV Off" !! !!Environmental Keywords !! TIMES,1800,-10,0,10,1 EAMB,300.15,101300,0 TAMB,300.15,101300,0,62 LIMO2,10 WIND,0,10,0.16 CJET,WALLS !! !!Compartment keywords !! COMPA,Compartment 1,21.7,7.04,3.82,0,0,0,MARIBE3,GYPBE3,MARIBE3 !! !!vent keywords !! HVENT,1,2,1,2,2,0,1,2.58,0,4,1 !! !!fire keywords !! OBJECT,NRC BE3 9,1,10.85,3.52,0,1,1,0,0,0,1 !! !!target and detector keywords !! TARGET,1,3.91,7.04,1.49,0,-1,0,MARIBE3,IMPLICIT,PDE TARGET,1,12.15,7.04,1.87,0,-1,0,MARIBE3,IMPLICIT,PDE TARGET,1,3.91,0,1.49,0,1,0,MARIBE3,IMPLICIT,PDE TARGET,1,9.55,0,1.87,0,1,0,MARIBE3,IMPLICIT,PDE TARGET,1,12.15,0,1.87,0,1,0,MARIBE3,IMPLICIT,PDE TARGET,1,21.7,1.59,1.12,-1,0,0,MARIBE3,IMPLICIT,PDE TARGET,1,21.7,1.59,2.43,-1,0,0,MARIBE3,IMPLICIT,PDE TARGET,1,21.7,5.76,1.12,-1,0,0,MARIBE3,IMPLICIT,PDE TARGET,1,21.7,5.76,2.43,-1,0,0,MARIBE3,IMPLICIT,PDE TARGET,1,3.04,3.59,3.82,0,0,-1,MARIBE3,IMPLICIT,PDE TARGET,1,9.11,5.97,3.82,0,0,-1,MARIBE3,IMPLICIT,PDE TARGET,1,10.85,2.39,3.82,0,0,-1,MARIBE3,IMPLICIT,PDE TARGET,1,10.85,5.17,3.82,0,0,-1,MARIBE3,IMPLICIT,PDE TARGET,1,13.02,5.97,3.82,0,0,-1,MARIBE3,IMPLICIT,PDE TARGET,1,3.04,3.59,0,0,0,1,GYPBE3,IMPLICIT,PDE TARGET,1,9.11,2,0,0,0,1,GYPBE3,IMPLICIT,PDE TARGET,1,10.85,2.39,0,0,0,1,GYPBE3,IMPLICIT,PDE TARGET,1,10.85,2,3.2,0,0,-1,XLP_C_BE3,IMPLICIT,PDE TARGET,1,10.85,1.25,2.7,0,0,-1,PVC_C_BE3,IMPLICIT,PDE TARGET,1,10.55,1.3,2.8,0,0,-1,XLP_C_BE3,IMPLICIT,PDE TARGET,1,10.85,0.5,2.2,0,0,-1,XLP_P_BE3,IMPLICIT,PDE TARGET,1,10.8,6.8,1.75,0,-1,0,XLP_C_BE3,IMPLICIT,PDE TARGET,1,10.8,6.8,1.75,0,-1,0,XLP_C_BE3,IMPLICIT,PDE

CFAST Input Files
B-20
Test 9, Fire Definition File NRC BE3 9 4,0,0,0,0,1,0,0.19,0.0026,0.0049,0,0,0 0.1002,175,1170000,0.026,0,1,0,0.19,0.0026,0.0049,0,0,0 395.15,1376,1170000,0.026,0,1,0,0.19,0.0026,0.0049,0,0,0 295.15,1560,0,0,0,1,0,0.19,0.0026,0.0049,0,0,0 0 0.44 10000 1 1 0.25 4.5E+07 METHANE

CFAST Input Files
B-21
Test 10, Input File lVERSN,6,"BE 3, Test 10, PVC Cable, Heptane, Door Closed, MV On" !! !!Environmental Keywords !! TIMES,1800,-10,0,10,1 EAMB,300.15,101300,0 TAMB,300.15,101300,0,63 LIMO2,10 WIND,0,10,0.16 CJET,WALLS !! !!Compartment keywords !! COMPA,Compartment 1,21.7,7.04,3.82,0,0,0,MARIBE3,GYPBE3,MARIBE3 !! !!vent keywords !! HVENT,1,2,1,10.17,3.82,3.81,1,0.555,0,4,1 MVENT,2,1,1,V,2.4,0.49,V,2.4,0.49,0.9,200,300,1 MVENT,1,2,2,V,2.4,0.49,V,2.4,0.49,1.7,200,300,1 !! !!fire keywords !! OBJECT,NRC BE3 10,1,10.85,3.52,0,1,1,0,0,0,1 !! !!target and detector keywords !! TARGET,1,3.91,7.04,1.49,0,-1,0,MARIBE3,IMPLICIT,PDE TARGET,1,12.15,7.04,1.87,0,-1,0,MARIBE3,IMPLICIT,PDE TARGET,1,3.91,0,1.49,0,1,0,MARIBE3,IMPLICIT,PDE TARGET,1,9.55,0,1.87,0,1,0,MARIBE3,IMPLICIT,PDE TARGET,1,12.15,0,1.87,0,1,0,MARIBE3,IMPLICIT,PDE TARGET,1,21.7,1.59,1.12,-1,0,0,MARIBE3,IMPLICIT,PDE TARGET,1,21.7,1.59,2.43,-1,0,0,MARIBE3,IMPLICIT,PDE TARGET,1,21.7,5.76,1.12,-1,0,0,MARIBE3,IMPLICIT,PDE TARGET,1,21.7,5.76,2.43,-1,0,0,MARIBE3,IMPLICIT,PDE TARGET,1,3.04,3.59,3.82,0,0,-1,MARIBE3,IMPLICIT,PDE TARGET,1,9.11,5.97,3.82,0,0,-1,MARIBE3,IMPLICIT,PDE TARGET,1,10.85,2.39,3.82,0,0,-1,MARIBE3,IMPLICIT,PDE TARGET,1,10.85,5.17,3.82,0,0,-1,MARIBE3,IMPLICIT,PDE TARGET,1,13.02,5.97,3.82,0,0,-1,MARIBE3,IMPLICIT,PDE TARGET,1,3.04,3.59,0,0,0,1,GYPBE3,IMPLICIT,PDE TARGET,1,9.11,2,0,0,0,1,GYPBE3,IMPLICIT,PDE TARGET,1,10.85,2.39,0,0,0,1,GYPBE3,IMPLICIT,PDE TARGET,1,10.85,2,3.2,0,0,-1,PVC_C_BE3,IMPLICIT,PDE TARGET,1,10.85,1.25,2.7,0,0,-1,PVC_C_BE3,IMPLICIT,PDE TARGET,1,10.55,1.3,2.8,0,0,-1,PVC_C_BE3,IMPLICIT,PDE TARGET,1,10.85,0.5,2.2,0,0,-1,PVC_P_BE3,IMPLICIT,PDE TARGET,1,10.8,6.8,1.75,0,-1,0,XLP_C_BE3,IMPLICIT,PDE TARGET,1,10.8,6.8,1.75,0,-1,0,XLP_C_BE3,IMPLICIT,PDE

CFAST Input Files
B-22
Test 10, Fire Definition File NRC BE3 10 4,0,0,0,0,1,0,0.19,0.0026,0.0049,0,0,0 0.1002,176,1190000,0.02644444,0,1,0,0.19,0.0026,0.0049,0,0,0 395.15,826,1190000,0.02644444,0,1,0,0.19,0.0026,0.0049,0,0,0 295.15,827,0,0,0,1,0,0.19,0.0026,0.0049,0,0,0 0 0.44 10000 1 1 0.25 4.5E+07 METHANE

CFAST Input Files
B-23
Test 13, Input File VERSN,6,"BE 3, Test 13, XPE Cable, Heptane, Door Closed, MV Off" !! !!Environmental Keywords !! TIMES,1800,-10,0,10,1 EAMB,304.15,101300,0 TAMB,304.15,101300,0,52 LIMO2,10 WIND,0,10,0.16 CJET,WALLS !! !!Compartment keywords !! COMPA,Compartment 1,21.7,7.04,3.82,0,0,0,MARIBE3,GYPBE3,MARIBE3 !! !!vent keywords !! HVENT,1,2,1,11.9,3.82,3.81,1,0.555,0,4,1 !! !!fire keywords !! OBJECT,NRC BE3 13,1,10.85,3.52,0,1,1,0,0,0,1 !! !!target and detector keywords !! TARGET,1,3.91,7.04,1.49,0,-1,0,MARIBE3,IMPLICIT,PDE TARGET,1,12.15,7.04,1.87,0,-1,0,MARIBE3,IMPLICIT,PDE TARGET,1,3.91,0,1.49,0,1,0,MARIBE3,IMPLICIT,PDE TARGET,1,9.55,0,1.87,0,1,0,MARIBE3,IMPLICIT,PDE TARGET,1,12.15,0,1.87,0,1,0,MARIBE3,IMPLICIT,PDE TARGET,1,21.7,1.59,1.12,-1,0,0,MARIBE3,IMPLICIT,PDE TARGET,1,21.7,1.59,2.43,-1,0,0,MARIBE3,IMPLICIT,PDE TARGET,1,21.7,5.76,1.12,-1,0,0,MARIBE3,IMPLICIT,PDE TARGET,1,21.7,5.76,2.43,-1,0,0,MARIBE3,IMPLICIT,PDE TARGET,1,3.04,3.59,3.82,0,0,-1,MARIBE3,IMPLICIT,PDE TARGET,1,9.11,5.97,3.82,0,0,-1,MARIBE3,IMPLICIT,PDE TARGET,1,10.85,2.39,3.82,0,0,-1,MARIBE3,IMPLICIT,PDE TARGET,1,10.85,5.17,3.82,0,0,-1,MARIBE3,IMPLICIT,PDE TARGET,1,13.02,5.97,3.82,0,0,-1,MARIBE3,IMPLICIT,PDE TARGET,1,3.04,3.59,0,0,0,1,GYPBE3,IMPLICIT,PDE TARGET,1,9.11,2,0,0,0,1,GYPBE3,IMPLICIT,PDE TARGET,1,10.85,2.39,0,0,0,1,GYPBE3,IMPLICIT,PDE TARGET,1,10.85,2,3.2,0,0,-1,XLP_C_BE3,IMPLICIT,PDE TARGET,1,10.85,1.25,2.7,0,0,-1,PVC_C_BE3,IMPLICIT,PDE TARGET,1,10.55,1.3,2.8,0,0,-1,XLP_C_BE3,IMPLICIT,PDE TARGET,1,10.85,0.5,2.2,0,0,-1,XLP_P_BE3,IMPLICIT,PDE TARGET,1,10.8,6.8,1.75,0,-1,0,XLP_C_BE3,IMPLICIT,PDE TARGET,1,10.8,6.8,1.75,0,-1,0,XLP_C_BE3,IMPLICIT,PDE

CFAST Input Files
B-24
Test 13, Fire Definition File NRC BE3 13 4,0,0,0,0,1,0,0.19,0.0026,0.0049,0,0,0 0.1002,177,2330000,0.05177778,0,1,0,0.19,0.0026,0.0049,0,0,0 395.15,364,2330000,0.05177778,0,1,0,0.19,0.0026,0.0049,0,0,0 295.15,365,0,0,0,1,0,0.19,0.0026,0.0049,0,0,0 0 0.44 10000 1 1 0.25 4.5E+07 METHANE

CFAST Input Files
B-25
Test 14, Input File VERSN,6,"BE 14, Test 3, XPE Cable, Heptane, Door Open, MV Off" !! !!Environmental Keywords !! TIMES,1800,-10,0,10,1 EAMB,301.15,101300,0 TAMB,301.15,101300,0,61 LIMO2,10 WIND,0,10,0.16 CJET,WALLS !! !!Compartment keywords !! COMPA,Compartment 1,21.7,7.04,3.82,0,0,0,MARIBE3,GYPBE3,MARIBE3 !! !!vent keywords !! HVENT,1,2,1,2,2,0,1,2.58,0,4,1 !! !!fire keywords !! OBJECT,NRC BE3 14,1,10.83,5.21,0,1,1,0,0,0,1 !! !!target and detector keywords !! TARGET,1,3.91,7.04,1.49,0,-1,0,MARIBE3,IMPLICIT,PDE TARGET,1,12.15,7.04,1.87,0,-1,0,MARIBE3,IMPLICIT,PDE TARGET,1,3.91,0,1.49,0,1,0,MARIBE3,IMPLICIT,PDE TARGET,1,9.55,0,1.87,0,1,0,MARIBE3,IMPLICIT,PDE TARGET,1,12.15,0,1.87,0,1,0,MARIBE3,IMPLICIT,PDE TARGET,1,21.7,1.59,1.12,-1,0,0,MARIBE3,IMPLICIT,PDE TARGET,1,21.7,1.59,2.43,-1,0,0,MARIBE3,IMPLICIT,PDE TARGET,1,21.7,5.76,1.12,-1,0,0,MARIBE3,IMPLICIT,PDE TARGET,1,21.7,5.76,2.43,-1,0,0,MARIBE3,IMPLICIT,PDE TARGET,1,3.04,3.59,3.82,0,0,-1,MARIBE3,IMPLICIT,PDE TARGET,1,9.11,5.97,3.82,0,0,-1,MARIBE3,IMPLICIT,PDE TARGET,1,10.85,2.39,3.82,0,0,-1,MARIBE3,IMPLICIT,PDE TARGET,1,10.85,5.17,3.82,0,0,-1,MARIBE3,IMPLICIT,PDE TARGET,1,13.02,5.97,3.82,0,0,-1,MARIBE3,IMPLICIT,PDE TARGET,1,3.04,3.59,0,0,0,1,GYPBE3,IMPLICIT,PDE TARGET,1,9.11,2,0,0,0,1,GYPBE3,IMPLICIT,PDE TARGET,1,10.85,2.39,0,0,0,1,GYPBE3,IMPLICIT,PDE TARGET,1,10.85,2,3.2,0,0,-1,XLP_C_BE3,IMPLICIT,PDE TARGET,1,10.85,1.25,2.7,0,0,-1,PVC_C_BE3,IMPLICIT,PDE TARGET,1,10.55,1.3,2.8,0,0,-1,XLP_C_BE3,IMPLICIT,PDE TARGET,1,10.85,0.5,2.2,0,0,-1,XLP_P_BE3,IMPLICIT,PDE TARGET,1,10.8,6.8,1.75,0,-1,0,XLP_C_BE3,IMPLICIT,PDE TARGET,1,10.8,6.8,1.75,0,-1,0,XLP_C_BE3,IMPLICIT,PDE
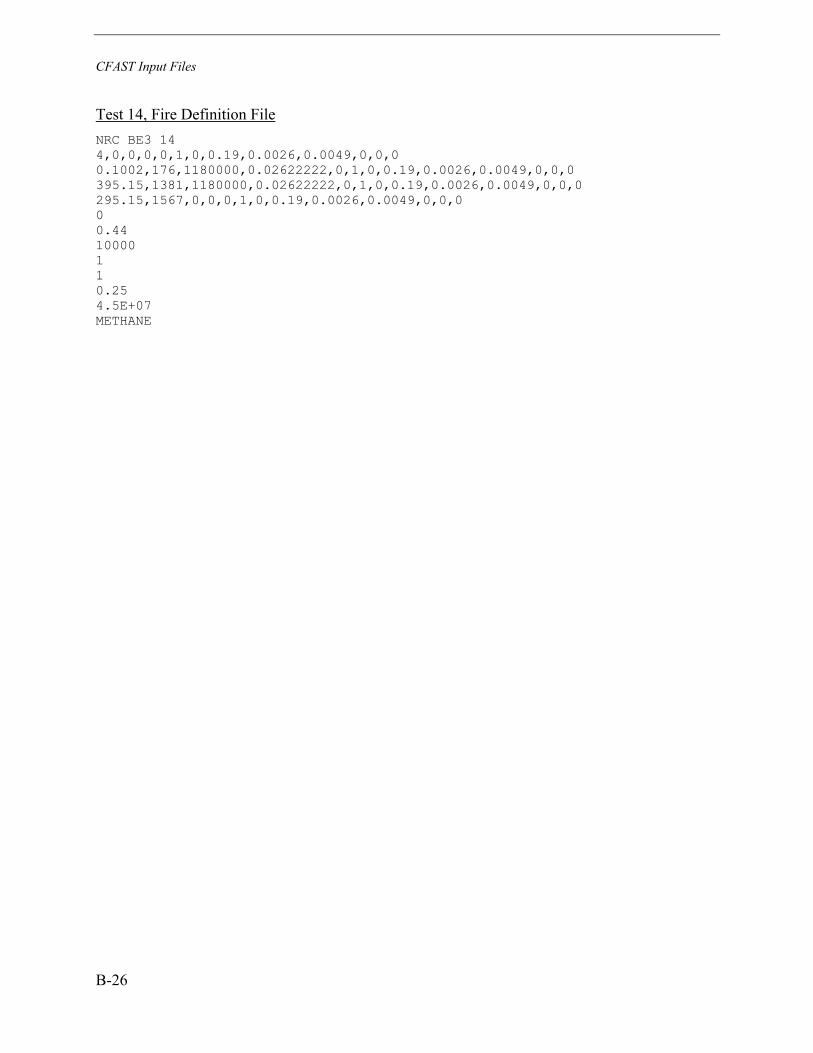
CFAST Input Files
B-26
Test 14, Fire Definition File NRC BE3 14 4,0,0,0,0,1,0,0.19,0.0026,0.0049,0,0,0 0.1002,176,1180000,0.02622222,0,1,0,0.19,0.0026,0.0049,0,0,0 395.15,1381,1180000,0.02622222,0,1,0,0.19,0.0026,0.0049,0,0,0 295.15,1567,0,0,0,1,0,0.19,0.0026,0.0049,0,0,0 0 0.44 10000 1 1 0.25 4.5E+07 METHANE

CFAST Input Files
B-27
Test 15, Input File VERSN,6,"BE 15, Test 3, PVC Cable, Heptane, Door Open, MV Off" !! !!Environmental Keywords !! TIMES,1800,-10,0,10,1 EAMB,291.15,101300,0 TAMB,291.15,101300,0,95 LIMO2,10 WIND,0,10,0.16 CJET,WALLS !! !!Compartment keywords !! COMPA,Compartment 1,21.7,7.04,3.82,0,0,0,MARIBE3,GYPBE3,MARIBE3 !! !!vent keywords !! HVENT,1,2,1,2,2,0,1,2.58,0,4,1 !! !!fire keywords !! OBJECT,NRC BE3 15,1,10.83,5.21,0,1,1,0,0,0,1 !! !!target and detector keywords !! TARGET,1,3.91,7.04,1.49,0,-1,0,MARIBE3,IMPLICIT,PDE TARGET,1,12.15,7.04,1.87,0,-1,0,MARIBE3,IMPLICIT,PDE TARGET,1,3.91,0,1.49,0,1,0,MARIBE3,IMPLICIT,PDE TARGET,1,9.55,0,1.87,0,1,0,MARIBE3,IMPLICIT,PDE TARGET,1,12.15,0,1.87,0,1,0,MARIBE3,IMPLICIT,PDE TARGET,1,21.7,1.59,1.12,-1,0,0,MARIBE3,IMPLICIT,PDE TARGET,1,21.7,1.59,2.43,-1,0,0,MARIBE3,IMPLICIT,PDE TARGET,1,21.7,5.76,1.12,-1,0,0,MARIBE3,IMPLICIT,PDE TARGET,1,21.7,5.76,2.43,-1,0,0,MARIBE3,IMPLICIT,PDE TARGET,1,3.04,3.59,3.82,0,0,-1,MARIBE3,IMPLICIT,PDE TARGET,1,9.11,5.97,3.82,0,0,-1,MARIBE3,IMPLICIT,PDE TARGET,1,10.85,2.39,3.82,0,0,-1,MARIBE3,IMPLICIT,PDE TARGET,1,10.85,5.17,3.82,0,0,-1,MARIBE3,IMPLICIT,PDE TARGET,1,13.02,5.97,3.82,0,0,-1,MARIBE3,IMPLICIT,PDE TARGET,1,3.04,3.59,0,0,0,1,GYPBE3,IMPLICIT,PDE TARGET,1,9.11,2,0,0,0,1,GYPBE3,IMPLICIT,PDE TARGET,1,10.85,2.39,0,0,0,1,GYPBE3,IMPLICIT,PDE TARGET,1,10.85,2,3.2,0,0,-1,PVC_C_BE3,IMPLICIT,PDE TARGET,1,10.85,1.25,2.7,0,0,-1,PVC_C_BE3,IMPLICIT,PDE TARGET,1,10.55,1.3,2.8,0,0,-1,PVC_C_BE3,IMPLICIT,PDE TARGET,1,10.85,0.5,2.2,0,0,-1,PVC_P_BE3,IMPLICIT,PDE TARGET,1,10.8,6.8,1.75,0,-1,0,XLP_C_BE3,IMPLICIT,PDE TARGET,1,10.8,6.8,1.75,0,-1,0,XLP_C_BE3,IMPLICIT,PDE

CFAST Input Files
B-28
Test 15, Fire Definition File NRC BE3 15 4,0,0,0,0,1,0,0.19,0.0026,0.0049,0,0,0 0.1002,180,1180000,0.02622222,0,1,0,0.19,0.0026,0.0049,0,0,0 395.15,1380,1180000,0.02622222,0,1,0,0.19,0.0026,0.0049,0,0,0 295.15,1567,0,0,0,1,0,0.19,0.0026,0.0049,0,0,0 0 0.44 10000 1 1 0.25 4.5E+07 METHANE
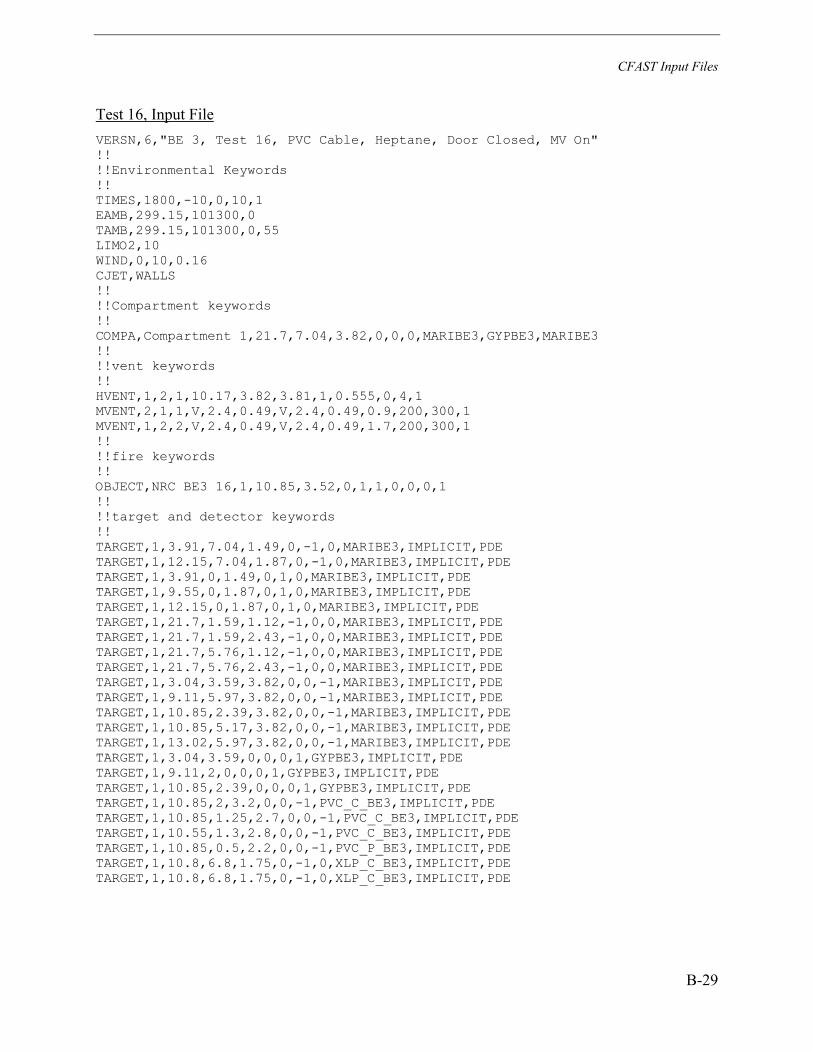
CFAST Input Files
B-29
Test 16, Input File VERSN,6,"BE 3, Test 16, PVC Cable, Heptane, Door Closed, MV On" !! !!Environmental Keywords !! TIMES,1800,-10,0,10,1 EAMB,299.15,101300,0 TAMB,299.15,101300,0,55 LIMO2,10 WIND,0,10,0.16 CJET,WALLS !! !!Compartment keywords !! COMPA,Compartment 1,21.7,7.04,3.82,0,0,0,MARIBE3,GYPBE3,MARIBE3 !! !!vent keywords !! HVENT,1,2,1,10.17,3.82,3.81,1,0.555,0,4,1 MVENT,2,1,1,V,2.4,0.49,V,2.4,0.49,0.9,200,300,1 MVENT,1,2,2,V,2.4,0.49,V,2.4,0.49,1.7,200,300,1 !! !!fire keywords !! OBJECT,NRC BE3 16,1,10.85,3.52,0,1,1,0,0,0,1 !! !!target and detector keywords !! TARGET,1,3.91,7.04,1.49,0,-1,0,MARIBE3,IMPLICIT,PDE TARGET,1,12.15,7.04,1.87,0,-1,0,MARIBE3,IMPLICIT,PDE TARGET,1,3.91,0,1.49,0,1,0,MARIBE3,IMPLICIT,PDE TARGET,1,9.55,0,1.87,0,1,0,MARIBE3,IMPLICIT,PDE TARGET,1,12.15,0,1.87,0,1,0,MARIBE3,IMPLICIT,PDE TARGET,1,21.7,1.59,1.12,-1,0,0,MARIBE3,IMPLICIT,PDE TARGET,1,21.7,1.59,2.43,-1,0,0,MARIBE3,IMPLICIT,PDE TARGET,1,21.7,5.76,1.12,-1,0,0,MARIBE3,IMPLICIT,PDE TARGET,1,21.7,5.76,2.43,-1,0,0,MARIBE3,IMPLICIT,PDE TARGET,1,3.04,3.59,3.82,0,0,-1,MARIBE3,IMPLICIT,PDE TARGET,1,9.11,5.97,3.82,0,0,-1,MARIBE3,IMPLICIT,PDE TARGET,1,10.85,2.39,3.82,0,0,-1,MARIBE3,IMPLICIT,PDE TARGET,1,10.85,5.17,3.82,0,0,-1,MARIBE3,IMPLICIT,PDE TARGET,1,13.02,5.97,3.82,0,0,-1,MARIBE3,IMPLICIT,PDE TARGET,1,3.04,3.59,0,0,0,1,GYPBE3,IMPLICIT,PDE TARGET,1,9.11,2,0,0,0,1,GYPBE3,IMPLICIT,PDE TARGET,1,10.85,2.39,0,0,0,1,GYPBE3,IMPLICIT,PDE TARGET,1,10.85,2,3.2,0,0,-1,PVC_C_BE3,IMPLICIT,PDE TARGET,1,10.85,1.25,2.7,0,0,-1,PVC_C_BE3,IMPLICIT,PDE TARGET,1,10.55,1.3,2.8,0,0,-1,PVC_C_BE3,IMPLICIT,PDE TARGET,1,10.85,0.5,2.2,0,0,-1,PVC_P_BE3,IMPLICIT,PDE TARGET,1,10.8,6.8,1.75,0,-1,0,XLP_C_BE3,IMPLICIT,PDE TARGET,1,10.8,6.8,1.75,0,-1,0,XLP_C_BE3,IMPLICIT,PDE

CFAST Input Files
B-30
Test 16, Fire Definition File NRC BE3 16 4,0,0,0,0,1,0,0.19,0.0026,0.0049,0,0,0 0.1002,177,2300000,0.05111111,0,1,0,0.19,0.0026,0.0049,0,0,0 395.15,382,2300000,0.05111111,0,1,0,0.19,0.0026,0.0049,0,0,0 295.15,383,0,0,0,1,0,0.19,0.0026,0.0049,0,0,0 0 0.44 10000 1 1 0.25 4.5E+07 METHANE
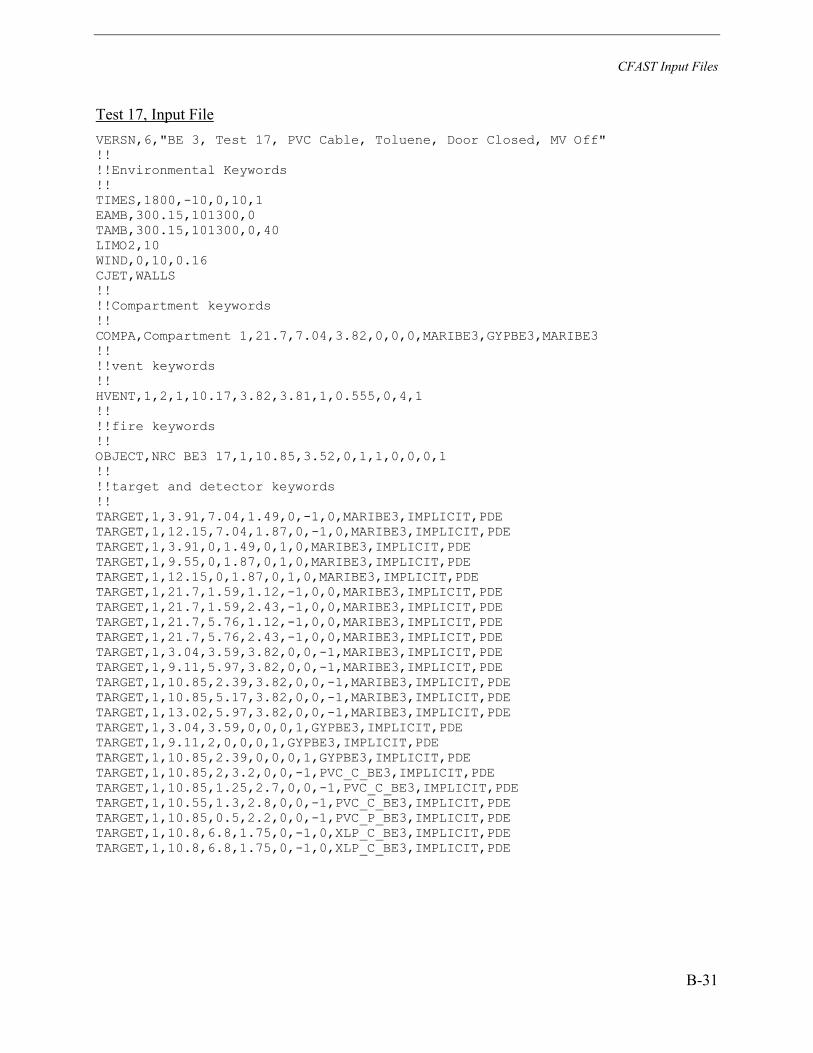
CFAST Input Files
B-31
Test 17, Input File VERSN,6,"BE 3, Test 17, PVC Cable, Toluene, Door Closed, MV Off" !! !!Environmental Keywords !! TIMES,1800,-10,0,10,1 EAMB,300.15,101300,0 TAMB,300.15,101300,0,40 LIMO2,10 WIND,0,10,0.16 CJET,WALLS !! !!Compartment keywords !! COMPA,Compartment 1,21.7,7.04,3.82,0,0,0,MARIBE3,GYPBE3,MARIBE3 !! !!vent keywords !! HVENT,1,2,1,10.17,3.82,3.81,1,0.555,0,4,1 !! !!fire keywords !! OBJECT,NRC BE3 17,1,10.85,3.52,0,1,1,0,0,0,1 !! !!target and detector keywords !! TARGET,1,3.91,7.04,1.49,0,-1,0,MARIBE3,IMPLICIT,PDE TARGET,1,12.15,7.04,1.87,0,-1,0,MARIBE3,IMPLICIT,PDE TARGET,1,3.91,0,1.49,0,1,0,MARIBE3,IMPLICIT,PDE TARGET,1,9.55,0,1.87,0,1,0,MARIBE3,IMPLICIT,PDE TARGET,1,12.15,0,1.87,0,1,0,MARIBE3,IMPLICIT,PDE TARGET,1,21.7,1.59,1.12,-1,0,0,MARIBE3,IMPLICIT,PDE TARGET,1,21.7,1.59,2.43,-1,0,0,MARIBE3,IMPLICIT,PDE TARGET,1,21.7,5.76,1.12,-1,0,0,MARIBE3,IMPLICIT,PDE TARGET,1,21.7,5.76,2.43,-1,0,0,MARIBE3,IMPLICIT,PDE TARGET,1,3.04,3.59,3.82,0,0,-1,MARIBE3,IMPLICIT,PDE TARGET,1,9.11,5.97,3.82,0,0,-1,MARIBE3,IMPLICIT,PDE TARGET,1,10.85,2.39,3.82,0,0,-1,MARIBE3,IMPLICIT,PDE TARGET,1,10.85,5.17,3.82,0,0,-1,MARIBE3,IMPLICIT,PDE TARGET,1,13.02,5.97,3.82,0,0,-1,MARIBE3,IMPLICIT,PDE TARGET,1,3.04,3.59,0,0,0,1,GYPBE3,IMPLICIT,PDE TARGET,1,9.11,2,0,0,0,1,GYPBE3,IMPLICIT,PDE TARGET,1,10.85,2.39,0,0,0,1,GYPBE3,IMPLICIT,PDE TARGET,1,10.85,2,3.2,0,0,-1,PVC_C_BE3,IMPLICIT,PDE TARGET,1,10.85,1.25,2.7,0,0,-1,PVC_C_BE3,IMPLICIT,PDE TARGET,1,10.55,1.3,2.8,0,0,-1,PVC_C_BE3,IMPLICIT,PDE TARGET,1,10.85,0.5,2.2,0,0,-1,PVC_P_BE3,IMPLICIT,PDE TARGET,1,10.8,6.8,1.75,0,-1,0,XLP_C_BE3,IMPLICIT,PDE TARGET,1,10.8,6.8,1.75,0,-1,0,XLP_C_BE3,IMPLICIT,PDE
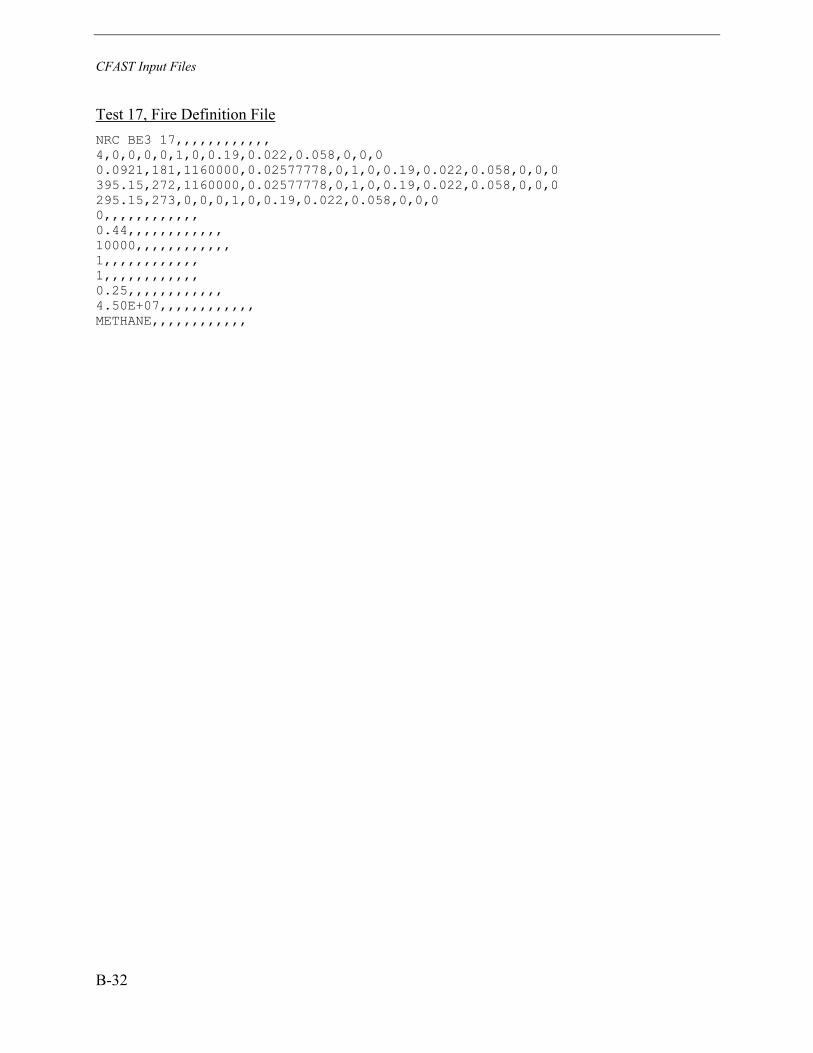
CFAST Input Files
B-32
Test 17, Fire Definition File NRC BE3 17,,,,,,,,,,,, 4,0,0,0,0,1,0,0.19,0.022,0.058,0,0,0 0.0921,181,1160000,0.02577778,0,1,0,0.19,0.022,0.058,0,0,0 395.15,272,1160000,0.02577778,0,1,0,0.19,0.022,0.058,0,0,0 295.15,273,0,0,0,1,0,0.19,0.022,0.058,0,0,0 0,,,,,,,,,,,, 0.44,,,,,,,,,,,, 10000,,,,,,,,,,,, 1,,,,,,,,,,,, 1,,,,,,,,,,,, 0.25,,,,,,,,,,,, 4.50E+07,,,,,,,,,,,, METHANE,,,,,,,,,,,,
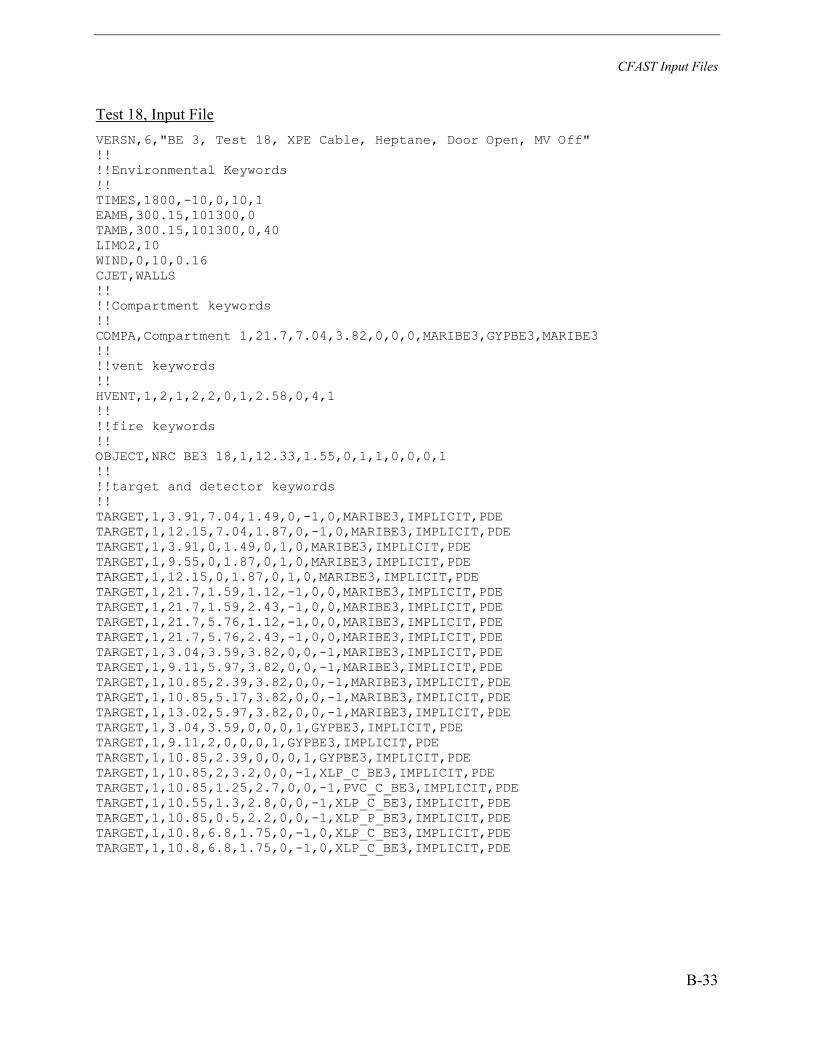
CFAST Input Files
B-33
Test 18, Input File VERSN,6,"BE 3, Test 18, XPE Cable, Heptane, Door Open, MV Off" !! !!Environmental Keywords !! TIMES,1800,-10,0,10,1 EAMB,300.15,101300,0 TAMB,300.15,101300,0,40 LIMO2,10 WIND,0,10,0.16 CJET,WALLS !! !!Compartment keywords !! COMPA,Compartment 1,21.7,7.04,3.82,0,0,0,MARIBE3,GYPBE3,MARIBE3 !! !!vent keywords !! HVENT,1,2,1,2,2,0,1,2.58,0,4,1 !! !!fire keywords !! OBJECT,NRC BE3 18,1,12.33,1.55,0,1,1,0,0,0,1 !! !!target and detector keywords !! TARGET,1,3.91,7.04,1.49,0,-1,0,MARIBE3,IMPLICIT,PDE TARGET,1,12.15,7.04,1.87,0,-1,0,MARIBE3,IMPLICIT,PDE TARGET,1,3.91,0,1.49,0,1,0,MARIBE3,IMPLICIT,PDE TARGET,1,9.55,0,1.87,0,1,0,MARIBE3,IMPLICIT,PDE TARGET,1,12.15,0,1.87,0,1,0,MARIBE3,IMPLICIT,PDE TARGET,1,21.7,1.59,1.12,-1,0,0,MARIBE3,IMPLICIT,PDE TARGET,1,21.7,1.59,2.43,-1,0,0,MARIBE3,IMPLICIT,PDE TARGET,1,21.7,5.76,1.12,-1,0,0,MARIBE3,IMPLICIT,PDE TARGET,1,21.7,5.76,2.43,-1,0,0,MARIBE3,IMPLICIT,PDE TARGET,1,3.04,3.59,3.82,0,0,-1,MARIBE3,IMPLICIT,PDE TARGET,1,9.11,5.97,3.82,0,0,-1,MARIBE3,IMPLICIT,PDE TARGET,1,10.85,2.39,3.82,0,0,-1,MARIBE3,IMPLICIT,PDE TARGET,1,10.85,5.17,3.82,0,0,-1,MARIBE3,IMPLICIT,PDE TARGET,1,13.02,5.97,3.82,0,0,-1,MARIBE3,IMPLICIT,PDE TARGET,1,3.04,3.59,0,0,0,1,GYPBE3,IMPLICIT,PDE TARGET,1,9.11,2,0,0,0,1,GYPBE3,IMPLICIT,PDE TARGET,1,10.85,2.39,0,0,0,1,GYPBE3,IMPLICIT,PDE TARGET,1,10.85,2,3.2,0,0,-1,XLP_C_BE3,IMPLICIT,PDE TARGET,1,10.85,1.25,2.7,0,0,-1,PVC_C_BE3,IMPLICIT,PDE TARGET,1,10.55,1.3,2.8,0,0,-1,XLP_C_BE3,IMPLICIT,PDE TARGET,1,10.85,0.5,2.2,0,0,-1,XLP_P_BE3,IMPLICIT,PDE TARGET,1,10.8,6.8,1.75,0,-1,0,XLP_C_BE3,IMPLICIT,PDE TARGET,1,10.8,6.8,1.75,0,-1,0,XLP_C_BE3,IMPLICIT,PDE

CFAST Input Files
B-34
Test 18, Fire Definition File NRC BE3 18 4,0,0,0,0,1,0,0.19,0.0026,0.0049,0,0,0 0.1002,178,1190000,0.02644444,0,1,0,0.19,0.0026,0.0049,0,0,0 395.15,1379,1190000,0.02644444,0,1,0,0.19,0.0026,0.0049,0,0,0 295.15,1562,0,0,0,1,0,0.19,0.0026,0.0049,0,0,0 0 0.44 10000 1 1 0.25 4.5E+07 METHANE
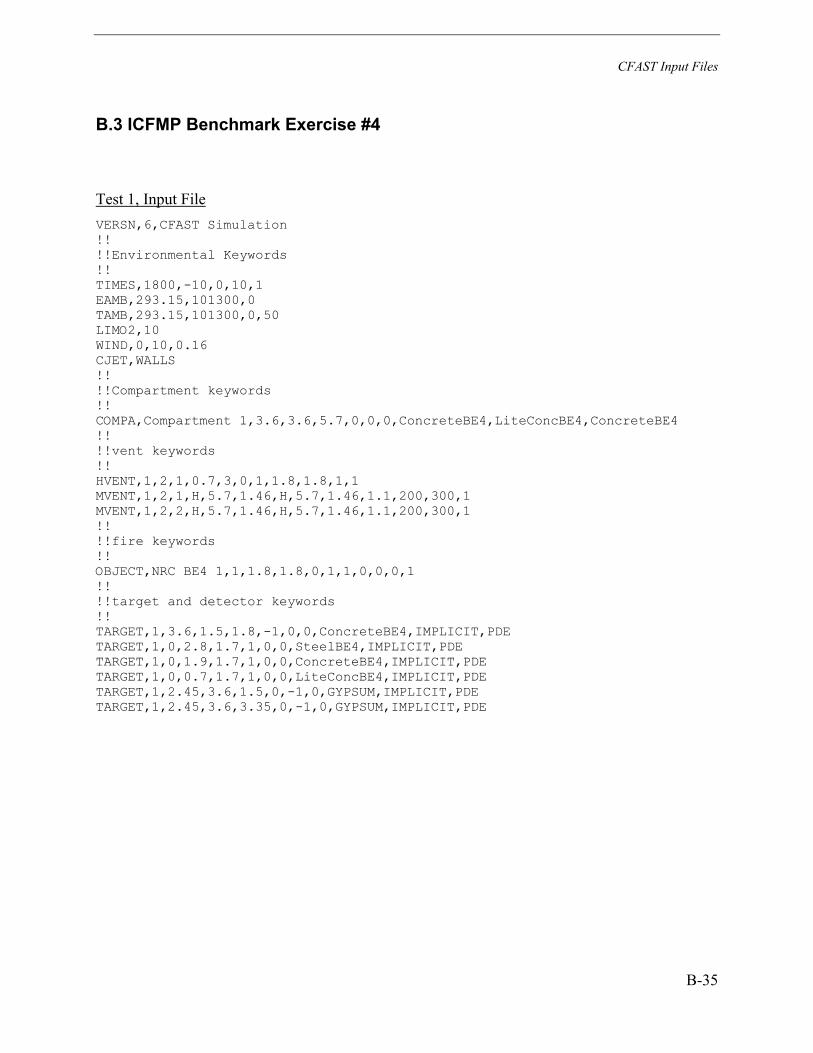
CFAST Input Files
B-35
B.3 ICFMP Benchmark Exercise #4
Test 1, Input File VERSN,6,CFAST Simulation !! !!Environmental Keywords !! TIMES,1800,-10,0,10,1 EAMB,293.15,101300,0 TAMB,293.15,101300,0,50 LIMO2,10 WIND,0,10,0.16 CJET,WALLS !! !!Compartment keywords !! COMPA,Compartment 1,3.6,3.6,5.7,0,0,0,ConcreteBE4,LiteConcBE4,ConcreteBE4 !! !!vent keywords !! HVENT,1,2,1,0.7,3,0,1,1.8,1.8,1,1 MVENT,1,2,1,H,5.7,1.46,H,5.7,1.46,1.1,200,300,1 MVENT,1,2,2,H,5.7,1.46,H,5.7,1.46,1.1,200,300,1 !! !!fire keywords !! OBJECT,NRC BE4 1,1,1.8,1.8,0,1,1,0,0,0,1 !! !!target and detector keywords !! TARGET,1,3.6,1.5,1.8,-1,0,0,ConcreteBE4,IMPLICIT,PDE TARGET,1,0,2.8,1.7,1,0,0,SteelBE4,IMPLICIT,PDE TARGET,1,0,1.9,1.7,1,0,0,ConcreteBE4,IMPLICIT,PDE TARGET,1,0,0.7,1.7,1,0,0,LiteConcBE4,IMPLICIT,PDE TARGET,1,2.45,3.6,1.5,0,-1,0,GYPSUM,IMPLICIT,PDE TARGET,1,2.45,3.6,3.35,0,-1,0,GYPSUM,IMPLICIT,PDE

CFAST Input Files
B-36
Test 1, Fire Definition File NRC BE4 1 9,0,0,0,0,1.08,0,0.18,0.0026,0.0049,0,0,0 0.165,92,119840,0.0028,0,1.08,0,0.18,0.0026,0.0049,0,0,0 395.15,180,1583600,0.037,0,1.08,0,0.18,0.0026,0.0049,0,0,0 295.15,260,2623640,0.0613,0,1.08,0,0.18,0.0026,0.0049,0,0,0 0,600,3197160,0.0747,0,1.08,0,0.18,0.0026,0.0049,0,0,0 0.35,822,3351240,0.0783,0,1.08,0,0.18,0.0026,0.0049,0,0,0 10000,870,3381200,0.079,0,1.08,0,0.18,0.0026,0.0049,0,0,0 1,1368,3518160,0.0822,0,1.08,0,0.18,0.0026,0.0049,0,0,0 1,1395,0,0,0,1.08,0,0.18,0.0026,0.0049,0,0,0 0.25 4.28E+07 METHANE
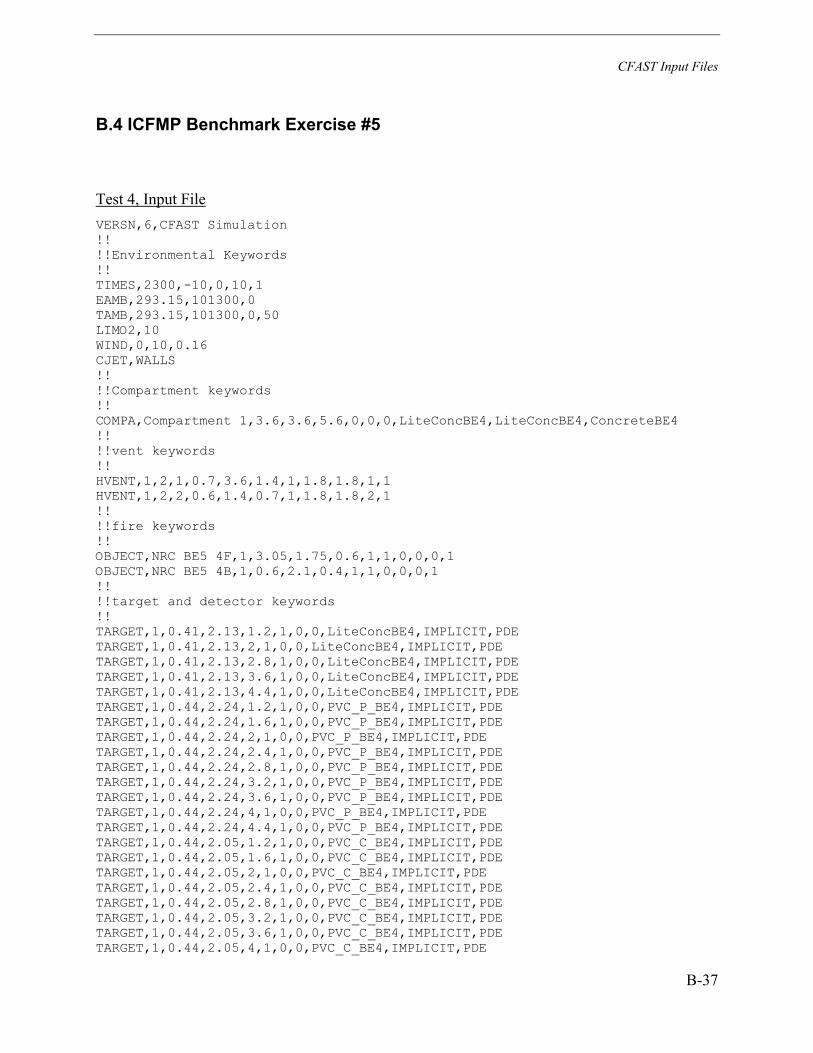
CFAST Input Files
B-37
B.4 ICFMP Benchmark Exercise #5
Test 4, Input File VERSN,6,CFAST Simulation !! !!Environmental Keywords !! TIMES,2300,-10,0,10,1 EAMB,293.15,101300,0 TAMB,293.15,101300,0,50 LIMO2,10 WIND,0,10,0.16 CJET,WALLS !! !!Compartment keywords !! COMPA,Compartment 1,3.6,3.6,5.6,0,0,0,LiteConcBE4,LiteConcBE4,ConcreteBE4 !! !!vent keywords !! HVENT,1,2,1,0.7,3.6,1.4,1,1.8,1.8,1,1 HVENT,1,2,2,0.6,1.4,0.7,1,1.8,1.8,2,1 !! !!fire keywords !! OBJECT,NRC BE5 4F,1,3.05,1.75,0.6,1,1,0,0,0,1 OBJECT,NRC BE5 4B,1,0.6,2.1,0.4,1,1,0,0,0,1 !! !!target and detector keywords !! TARGET,1,0.41,2.13,1.2,1,0,0,LiteConcBE4,IMPLICIT,PDE TARGET,1,0.41,2.13,2,1,0,0,LiteConcBE4,IMPLICIT,PDE TARGET,1,0.41,2.13,2.8,1,0,0,LiteConcBE4,IMPLICIT,PDE TARGET,1,0.41,2.13,3.6,1,0,0,LiteConcBE4,IMPLICIT,PDE TARGET,1,0.41,2.13,4.4,1,0,0,LiteConcBE4,IMPLICIT,PDE TARGET,1,0.44,2.24,1.2,1,0,0,PVC_P_BE4,IMPLICIT,PDE TARGET,1,0.44,2.24,1.6,1,0,0,PVC_P_BE4,IMPLICIT,PDE TARGET,1,0.44,2.24,2,1,0,0,PVC_P_BE4,IMPLICIT,PDE TARGET,1,0.44,2.24,2.4,1,0,0,PVC_P_BE4,IMPLICIT,PDE TARGET,1,0.44,2.24,2.8,1,0,0,PVC_P_BE4,IMPLICIT,PDE TARGET,1,0.44,2.24,3.2,1,0,0,PVC_P_BE4,IMPLICIT,PDE TARGET,1,0.44,2.24,3.6,1,0,0,PVC_P_BE4,IMPLICIT,PDE TARGET,1,0.44,2.24,4,1,0,0,PVC_P_BE4,IMPLICIT,PDE TARGET,1,0.44,2.24,4.4,1,0,0,PVC_P_BE4,IMPLICIT,PDE TARGET,1,0.44,2.05,1.2,1,0,0,PVC_C_BE4,IMPLICIT,PDE TARGET,1,0.44,2.05,1.6,1,0,0,PVC_C_BE4,IMPLICIT,PDE TARGET,1,0.44,2.05,2,1,0,0,PVC_C_BE4,IMPLICIT,PDE TARGET,1,0.44,2.05,2.4,1,0,0,PVC_C_BE4,IMPLICIT,PDE TARGET,1,0.44,2.05,2.8,1,0,0,PVC_C_BE4,IMPLICIT,PDE TARGET,1,0.44,2.05,3.2,1,0,0,PVC_C_BE4,IMPLICIT,PDE TARGET,1,0.44,2.05,3.6,1,0,0,PVC_C_BE4,IMPLICIT,PDE TARGET,1,0.44,2.05,4,1,0,0,PVC_C_BE4,IMPLICIT,PDE
CFAST Input Files
B-38
TARGET,1,0.44,2.05,4.4,1,0,0,PVC_C_BE4,IMPLICIT,PDE TARGET,1,2.6,3.6,0.4,0,-1,0,ConcreteBE4,IMPLICIT,PDE TARGET,1,2.6,3.6,2.8,0,-1,0,ConcreteBE4,IMPLICIT,PDE TARGET,1,2.6,3.6,5.2,0,-1,0,ConcreteBE4,IMPLICIT,PDE TARGET,1,0,2.2,0.4,1,0,0,ConcreteBE4,IMPLICIT,PDE TARGET,1,0,2.2,2.8,1,0,0,ConcreteBE4,IMPLICIT,PDE TARGET,1,0,2.2,5.2,1,0,0,ConcreteBE4,IMPLICIT,PDE
Test 4, Fire Definition Files NRC BE5 4F 12,0,0,0,0,0,0,0.18,0.0026,0.0049,0,0,0 0.046,60,120000,0.003921569,0,0.49,0,0.18,0.0026,0.0049,0,0,0 395.15,120,220000,0.007189543,0,0.49,0,0.18,0.0026,0.0049,0,0,0 295.15,180,280000,0.009150327,0,0.49,0,0.18,0.0026,0.0049,0,0,0 0,240,290000,0.009477125,0,0.49,0,0.18,0.0026,0.0049,0,0,0 0.2,300,300000,0.009803922,0,0.49,0,0.18,0.0026,0.0049,0,0,0 10000,480,320000,0.01045752,0,0.49,0,0.18,0.0026,0.0049,0,0,0 0.7,600,330000,0.01078431,0,0.49,0,0.18,0.0026,0.0049,0,0,0 0.7,900,340000,0.01111111,0,0.49,0,0.18,0.0026,0.0049,0,0,0 0.1,1800,360000,0.01176471,0,0.49,0,0.18,0.0026,0.0049,0,0,0 3.06E+07,2299,360000,0.01176471,0,0.49,0,0.18,0.0026,0.0049,0,0,0 METHANE,2300,0,0,0,0,0,0.18,0.0026,0.0049,0,0,0
NRC BE5 4B 7,0,0,0,0,0,0,0.18,0.0026,0.0049,0,0,0 0.165,1200,0,0,0,0,0,0.18,0.0026,0.0049,0,0,0 395.15,1201,50000,0.001168224,0,0.09,0,0.18,0.0026,0.0049,0,0,0 295.15,2100,50000,0.001168224,0,0.09,0,0.18,0.0026,0.0049,0,0,0 0,2120,100000,0.002336449,0,0.09,0,0.18,0.0026,0.0049,0,0,0 0.35,2280,100000,0.002336449,0,0.09,0,0.18,0.0026,0.0049,0,0,0 10000,2300,0,0,0,0,0,0.18,0.0026,0.0049,0,0,0 0.3 0.3 0.4 4.28E+07 METHANE
CFAST Input Files
B-39
B.5 FM / SNL Test Series
Test 4, Input File VERSN,6,FM Test 4 !! !!Environmental Keywords !! TIMES,1200,-50,0,10,1 EAMB,288.15,101300,0 TAMB,288.15,101300,0,50 LIMO2,10 WIND,0,10,0.16 CJET,WALLS !! !!Compartment keywords !! COMPA,Compartment 1,18.3,12.2,6.1,0,0,0,MariniteFM,ConcreteFM,MariniteFM !! !!vent keywords !! VVENT,2,1,1.08,2,1 MVENT,2,1,1,H,4.9,0.66,H,4.9,0.66,0.38,200,300,1 !! !!fire keywords !! OBJECT,FM SNL 4,1,12,6.1,0,1,1,0,0,0,1
Test 4, Fire Definition File FM SNL 4 11,0,0,0,0,1,0,0.19,0.0026,0.0049,0,0,0 0.1002,30,7968.75,0.0001770833,0,1,0,0.19,0.0026,0.0049,0,0,0 395.15,60,31875,0.0007083333,0,1,0,0.19,0.0026,0.0049,0,0,0 295.15,90,71718.75,0.00159375,0,1,0,0.19,0.0026,0.0049,0,0,0 0,120,127500,0.002833333,0,1,0,0.19,0.0026,0.0049,0,0,0 0.35,150,199218.8,0.004427084,0,1,0,0.19,0.0026,0.0049,0,0,0 10000,180,286875,0.006375,0,1,0,0.19,0.0026,0.0049,0,0,0 1,210,390468.8,0.008677085,0,1,0,0.19,0.0026,0.0049,0,0,0 1,240,510000,0.01133333,0,1,0,0.19,0.0026,0.0049,0,0,0 0.25,600,510000,0.01133333,0,1,0,0.19,0.0026,0.0049,0,0,0 4.5E+07,601,0,0,0,0,0,0.19,0.0026,0.0049,0,0,0 METHANE
CFAST Input Files
B-40
Test 5, Input File VERSN,6,FM Test 5 !! !!Environmental Keywords !! TIMES,900,-50,0,10,1 EAMB,293.15,101300,0 TAMB,293.15,101300,0,50 LIMO2,10 WIND,0,10,0.16 CJET,WALLS !! !!Compartment keywords !! COMPA,Compartment 1,18.3,12.2,6.1,0,0,0,MariniteFM,ConcreteFM,MariniteFM !! !!vent keywords !! VVENT,2,1,1.08,2,1 MVENT,2,1,1,H,4.9,0.66,H,4.9,0.66,3.78,200,300,1 EVENT,M,2,1,1,540,0,1 !! !!fire keywords !! OBJECT,FM SNL 5,1,12,6.1,0,1,1,0,0,0,1
Test 5, Fire Definition File FM SNL 5 4,0,0,0,0,1,0,0.19,0.0026,0.0049,0,0,0 0.1002,240,480000,0.01066667,0,1,0,0.19,0.0026,0.0049,0,0,0 395.15,540,480000,0.01066667,0,1,0,0.19,0.0026,0.0049,0,0,0 295.15,541,0,0,0,1,0,0.19,0.0026,0.0049,0,0,0 0 0.35 10000 1 1 0.25 4.5E+07 METHANE
CFAST Input Files
B-41
Test 21, Input File VERSN,6,FM Test 21 !! !!Environmental Keywords !! TIMES,1800,-50,0,10,1 EAMB,288.15,101300,0 TAMB,288.15,101300,0,50 LIMO2,10 WIND,0,10,0.16 CJET,WALLS !! !!Compartment keywords !! COMPA,Compartment 1,18.3,12.2,6.1,0,0,0,MariniteFM,ConcreteFM,MariniteFM !! !!vent keywords !! VVENT,2,1,1.08,2,1 MVENT,2,1,1,H,4.9,0.66,H,4.9,0.66,0.38,200,300,1 !! !!fire keywords !! OBJECT,FM SNL 21,1,12,6.1,0,1,1,0,0,0,1
Test 21, Fire Definition File FM SNL 21 4,0,0,0,0,1,0,0.19,0.0026,0.0049,0,0,0 0.1002,240,470000,0.01044444,0,1,0,0.19,0.0026,0.0049,0,0,0 395.15,1140,470000,0.01044444,0,1,0,0.19,0.0026,0.0049,0,0,0 295.15,1141,0,0,0,1,0,0.19,0.0026,0.0049,0,0,0 0 0.35 10000 1 1 0.25 4.5E+07 METHANE
CFAST Input Files
B-42
B.6 NBS Test Series
Test MV100A, Input File VERSN,6,"NBS Test MV100A, Open Corridor Door, No Target Room" !! !!Environmental Keywords !! TIMES,1500,-10,0,10,1 EAMB,296.15,101300,0 TAMB,296.15,101300,0,45 LIMO2,10 WIND,0,10,0.16 CJET,WALLS !! !!Compartment keywords !! COMPA,Fire Room,2.34,2.34,2.16,9.85,0,0,CeramicNBS,FireBrickNBS,CeramicNBS COMPA,Entry to Fire Room,1.03,1.02,2,11.16,2.34,0,MariniteNBS,GypsumNBS,MariniteNBS COMPA,Corridor,12.19,2.44,2.44,0,3.36,0,MariniteNBS,GypsumNBS,MariniteNBS COMPA,Target Room,2.22,2.24,2.43,2.07,0.33,0,GypsumNBS,ConcreteNBS,GypsumNBS COMPA,Entry to Target Room,0.94,0.79,2.04,2.07,2.57,0,GypsumNBS,ConcreteNBS,GypsumNBS !! !!vent keywords !! HVENT,1,2,1,0.81,1.6,0,1,1.42,0,3,1 HVENT,2,3,1,0.81,1.6,0,1,0.11,0,3,1 HVENT,3,6,1,0.76,2.03,0,1,0.84,0,4,1 HVENT,3,5,1,0.79,2.04,0,1,2.14,0,1,0 HVENT,4,5,1,0.79,2.04,0,1,0.075,0,3,0 !! !!fire keywords !! OBJECT,NBS MV100A,1,1.17,0,0,1,1,0,0,0,1
Test MV100A, Fire Definition File NBS MV100A 4,0,0,0,0,0.1156,0,0,0.07,0,0,0,0 0.016,10,110000,0.0022,0,0.1156,0,0,0.07,0,0,0,0 493,890,110000,0.0022,0,0.1156,0,0,0.07,0,0,0,0 300,900,0,0,0,0.1156,0,0,0.07,0,0,0,0 0 0.2 5 0.4 0.4 0.65

CFAST Input Files
B-43
5E+07 METHANE
CFAST Input Files
B-44
Test MV100O, Input File VERSN,6,"NBS Test MV100O, Closed Corridor Door, No Target Room" !! !!Environmental Keywords !! TIMES,1500,-10,0,10,1 EAMB,293.15,101300,0 TAMB,293.15,101300,0,45 LIMO2,10 WIND,0,10,0.16 CJET,WALLS !! !!Compartment keywords !! COMPA,Fire Room,2.34,2.34,2.16,9.85,0,0,CeramicNBS,FireBrickNBS,CeramicNBS COMPA,Entry to Fire Room,1.03,1.02,2,11.16,2.34,0,MariniteNBS,GypsumNBS,MariniteNBS COMPA,Corridor,12.19,2.44,2.44,0,3.36,0,MariniteNBS,GypsumNBS,MariniteNBS COMPA,Target Room,2.22,2.24,2.43,2.07,0.33,0,GypsumNBS,ConcreteNBS,GypsumNBS COMPA,Entry to Target Room,0.94,0.79,2.04,2.07,2.57,0,GypsumNBS,ConcreteNBS,GypsumNBS !! !!vent keywords !! HVENT,1,2,1,0.81,1.6,0,1,1.42,0,3,1 HVENT,2,3,1,0.81,1.6,0,1,0.11,0,3,1 HVENT,3,6,1,0.76,2.44,2.43,1,0.84,0,4,1 HVENT,3,5,1,0.79,2.04,0,1,2.14,0,1,0 HVENT,4,5,1,0.79,2.04,0,1,0.075,0,3,0 !! !!fire keywords !! OBJECT,NBS MV100O,1,1.17,0,0,1,1,0,0,0,1
Test MV100O, Fire Definition File NBS MV100O 4,0,0,0,0,0.1156,0,0,0.07,0,0,0,0 0.016,10,110000,0.0022,0,0.1156,0,0,0.07,0,0,0,0 493,890,110000,0.0022,0,0.1156,0,0,0.07,0,0,0,0 300,900,0,0,0,0.1156,0,0,0.07,0,0,0,0 0 0.3 5 0.4 0.4 0.65 5E+07 METHANE
CFAST Input Files
B-45
Test MV100Z, Input File VERSN,6,"NBS Test MV100Z, Open Corridor Door, Open Target Room" !! !!Environmental Keywords !! TIMES,1500,-10,0,10,1 EAMB,295.15,101300,0 TAMB,295.15,101300,0,62 LIMO2,10 WIND,0,10,0.16 CJET,WALLS !! !!Compartment keywords !! COMPA,Fire Room,2.34,2.34,2.16,9.85,0,0,CeramicNBS,FireBrickNBS,CeramicNBS COMPA,Entry to Fire Room,1.03,1.02,2,11.16,2.34,0,MariniteNBS,GypsumNBS,MariniteNBS COMPA,Corridor,12.19,2.44,2.44,0,3.36,0,MariniteNBS,GypsumNBS,MariniteNBS COMPA,Target Room,2.22,2.24,2.43,2.07,0.33,0,GypsumNBS,ConcreteNBS,GypsumNBS COMPA,Entry to Target Room,0.94,0.79,2.04,2.07,2.57,0,GypsumNBS,ConcreteNBS,GypsumNBS !! !!vent keywords !! HVENT,1,2,1,0.81,1.6,0,1,1.42,0,3,1 HVENT,2,3,1,0.81,1.6,0,1,0.11,0,3,1 HVENT,3,6,1,0.76,2.03,0,1,0.84,0,4,1 HVENT,3,5,1,0.79,2.04,0,1,2.14,0,1,1 HVENT,4,5,1,0.79,2.04,0,1,0.075,0,3,1 !! !!fire keywords !! OBJECT,NBS MV100Z,1,1.17,0,0,1,1,0,0,0,1
Test MV100Z, Fire Definition File NBS MV100Z 4,0,0,0,0,0.1156,0,0,0.07,0,0,0,0 0.016,10,110000,0.0022,0,0.1156,0,0,0.07,0,0,0,0 493,890,110000,0.0022,0,0.1156,0,0,0.07,0,0,0,0 300,900,0,0,0,0.1156,0,0,0.07,0,0,0,0 0 0.3 5 0.4 0.4 0.65 5E+07 METHANE


![Data Validation and Verification [Autosaved] · ON IP DATA VALIDATION, VERIFICATION AND EXCHANGE DATA VALIDATION AND VERIFICATION USING IPOBSD’S TOOLS. Data Quality Vicious Cycle](https://img.pdfslide.us/doc/110x75/5e9d0eaef4fa863d2d614a6c/data-validation-and-verification-autosaved-on-ip-data-validation-verification.jpg)