Embed Size (px)
Citation preview
1
Veresdale Scrub State School
2016 ANNUAL REPORT
Queensland State School Reporting
Inspiring minds. Creating opportunities. Shaping Queensland’s future. Every student succeeding. State Schools Strategy 2016-2020
Department of Education and Training
2
Contact Information
Postal address: 354 Veresdale Scrub School Road Veresdale Scrub 4285
Phone: (07) 5543 1227
Fax: (07) 5543 2226
Email: [email protected]
Webpages: Additional reporting information pertaining to Queensland state schools is located on the My School website and the Queensland Government data website.
Contact Person: Mrs Viviene Simpson
School Overview
Veresdale Scrub State School is committed to meeting the diverse needs of students at our small rural school. We strive daily to provide quality teaching and learning with student improvement as a whole school focus. Staff value students, parents and community. Veresdale Scrub is a Band 6 school and has served the community of Veresdale Scrub for 117 years. The local community is rural, with continuous development of land, resulting in a steady growth in enrolments over the last four years.The school offers a challenging curriculum for Prep to Year 6 in multi-age classes. The students wear the school uniform with pride and are well-behaved and courteous. The school has an excellent community reputation and a large body of parents who participate in school activities. The principles of effective teaching, learning and assessment underpin Veresdale's educational programs from Prep to Year 6, delivered by experienced teachers. The school focuses on the provision of an inclusive, nurturing and challenging learning environment. We encourage all students to maximise their learning by providing additional opportunties (academic,sporting and cultural) for them to develop their full potential.The school expects responsible behaviours from all of its students.
Principal’s Forward
Introduction
Welcome to the School Annual Report for 2016 for Veresdale Scrub State School. This School Annual Report is published and uploaded to our school webpage in June each year. Information included is relative to the previous school year and outlines the profile of our school for 2016, including the progress made, as well as outlining a further perspective of priorities and directions for 2017. The report highlights key academic achievements, the curriculum offered and other information of interest to the school community and the wider community in general. At Veresdale Scrub State School we encourage our students to become life-long learners through the provision of a quality education and provide opportunities for students to participate fully in all community activities available. The school has an excellent reputation for academic and sporting achievements and a commitment to community consultation and involvement.
Throughout 2016, Veresdale Scrub State School staff have continued to focus on literacy and numeracy opportunities for all students. Our aim is to continue improving quality educational
3
experiences for every child attending our school. Students are supported by passionate, supportive, professional and caring staff members. Students are also supported through the purchase of equipment to upgrade and maintain current facilities, thereby allowing further opportunities within learning as well as supporting aspects of socialisation. During 2016, the school catered to students from Prep to year 6 in a multi -age setting. This grouping allowed students to be catered for in whole class, age level, ability level or in individualised lessons. Student learning is further supported through involvement in excursions, camp, visiting artists and community members.
School Progress towards its goals in 2016
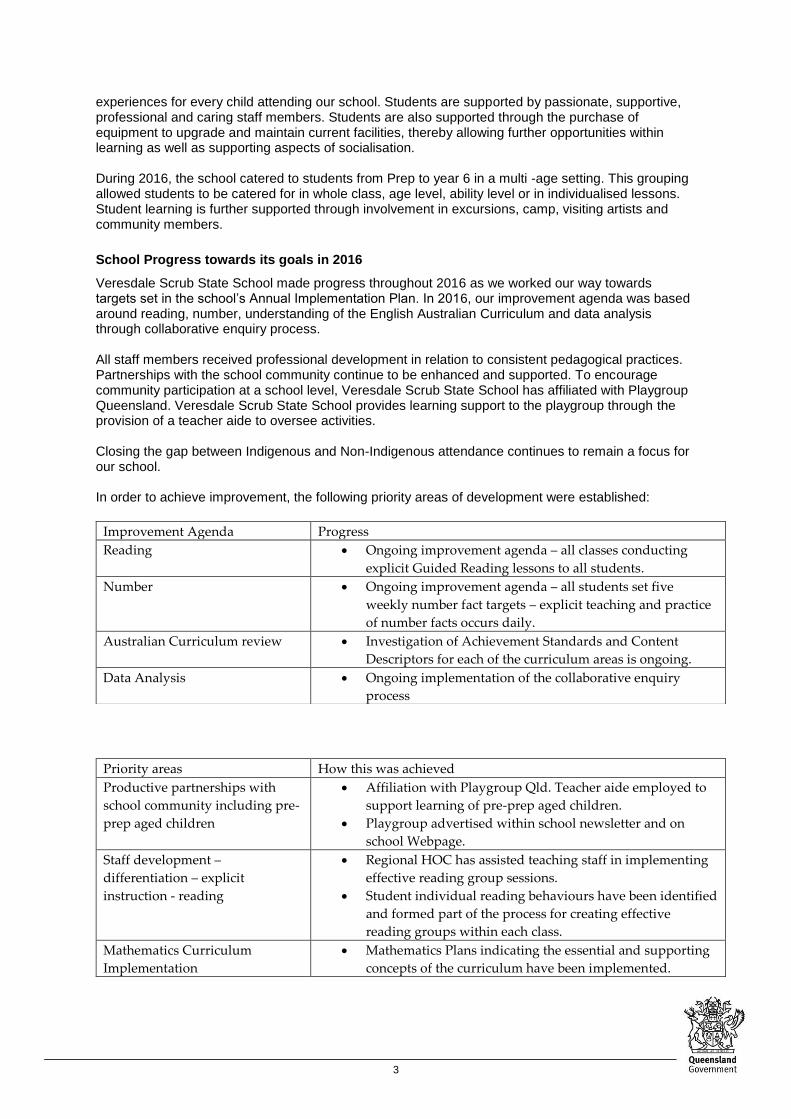
Veresdale Scrub State School made progress throughout 2016 as we worked our way towards targets set in the school’s Annual Implementation Plan. In 2016, our improvement agenda was based around reading, number, understanding of the English Australian Curriculum and data analysis through collaborative enquiry process. All staff members received professional development in relation to consistent pedagogical practices. Partnerships with the school community continue to be enhanced and supported. To encourage community participation at a school level, Veresdale Scrub State School has affiliated with Playgroup Queensland. Veresdale Scrub State School provides learning support to the playgroup through the provision of a teacher aide to oversee activities. Closing the gap between Indigenous and Non-Indigenous attendance continues to remain a focus for our school. In order to achieve improvement, the following priority areas of development were established:
Priority areas How this was achieved
Productive partnerships with
school community including pre-
prep aged children
Affiliation with Playgroup Qld. Teacher aide employed to
support learning of pre-prep aged children.
Playgroup advertised within school newsletter and on
school Webpage.
Staff development –
differentiation – explicit
instruction - reading
Regional HOC has assisted teaching staff in implementing
effective reading group sessions.
Student individual reading behaviours have been identified
and formed part of the process for creating effective
reading groups within each class.
Mathematics Curriculum
Implementation
Mathematics Plans indicating the essential and supporting
concepts of the curriculum have been implemented.
Improvement Agenda Progress
Reading Ongoing improvement agenda – all classes conducting
explicit Guided Reading lessons to all students.
Number Ongoing improvement agenda – all students set five
weekly number fact targets – explicit teaching and practice
of number facts occurs daily.
Australian Curriculum review Investigation of Achievement Standards and Content
Descriptors for each of the curriculum areas is ongoing.
Data Analysis Ongoing implementation of the collaborative enquiry
process
4
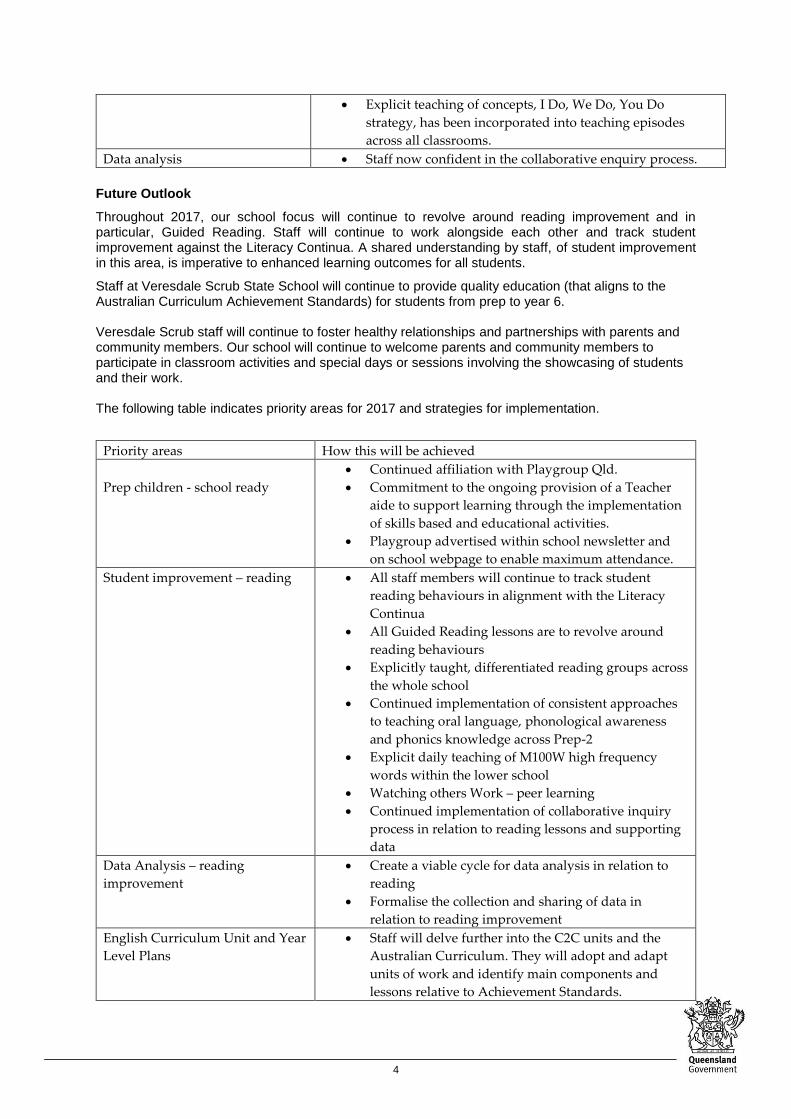
Explicit teaching of concepts, I Do, We Do, You Do
strategy, has been incorporated into teaching episodes
across all classrooms.
Data analysis Staff now confident in the collaborative enquiry process.
Future Outlook
Throughout 2017, our school focus will continue to revolve around reading improvement and in particular, Guided Reading. Staff will continue to work alongside each other and track student improvement against the Literacy Continua. A shared understanding by staff, of student improvement in this area, is imperative to enhanced learning outcomes for all students.
Staff at Veresdale Scrub State School will continue to provide quality education (that aligns to the Australian Curriculum Achievement Standards) for students from prep to year 6. Veresdale Scrub staff will continue to foster healthy relationships and partnerships with parents and community members. Our school will continue to welcome parents and community members to participate in classroom activities and special days or sessions involving the showcasing of students and their work. The following table indicates priority areas for 2017 and strategies for implementation.
Priority areas How this will be achieved
Prep children - school ready
Continued affiliation with Playgroup Qld.
Commitment to the ongoing provision of a Teacher
aide to support learning through the implementation
of skills based and educational activities.
Playgroup advertised within school newsletter and
on school webpage to enable maximum attendance.
Student improvement – reading All staff members will continue to track student
reading behaviours in alignment with the Literacy
Continua
All Guided Reading lessons are to revolve around
reading behaviours
Explicitly taught, differentiated reading groups across
the whole school
Continued implementation of consistent approaches
to teaching oral language, phonological awareness
and phonics knowledge across Prep-2
Explicit daily teaching of M100W high frequency
words within the lower school
Watching others Work – peer learning
Continued implementation of collaborative inquiry
process in relation to reading lessons and supporting
data
Data Analysis – reading
improvement
Create a viable cycle for data analysis in relation to
reading
Formalise the collection and sharing of data in
relation to reading improvement
English Curriculum Unit and Year
Level Plans
Staff will delve further into the C2C units and the
Australian Curriculum. They will adopt and adapt
units of work and identify main components and
lessons relative to Achievement Standards.
5
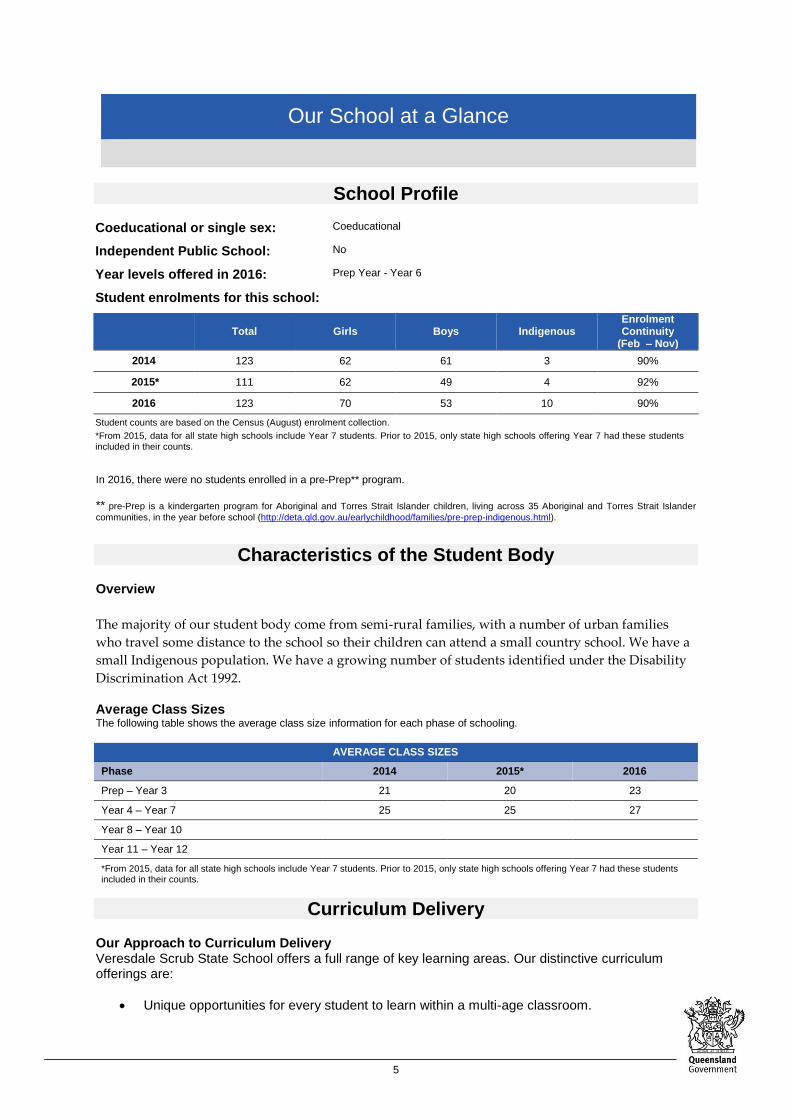
Our School at a Glance
School Profile
Coeducational or single sex: Coeducational
Independent Public School: No
Year levels offered in 2016: Prep Year - Year 6
Student enrolments for this school:
Total Girls Boys Indigenous
Enrolment Continuity
(Feb – Nov)
2014 123 62 61 3 90%
2015* 111 62 49 4 92%
2016 123 70 53 10 90%
Student counts are based on the Census (August) enrolment collection.
*From 2015, data for all state high schools include Year 7 students. Prior to 2015, only state high schools offering Year 7 had these students included in their counts.
In 2016, there were no students enrolled in a pre-Prep** program.
** pre-Prep is a kindergarten program for Aboriginal and Torres Strait Islander children, living across 35 Aboriginal and Torres Strait Islander
communities, in the year before school (http://deta.qld.gov.au/earlychildhood/families/pre-prep-indigenous.html).
Characteristics of the Student Body
Overview
The majority of our student body come from semi-rural families, with a number of urban families
who travel some distance to the school so their children can attend a small country school. We have a
small Indigenous population. We have a growing number of students identified under the Disability
Discrimination Act 1992. Average Class Sizes The following table shows the average class size information for each phase of schooling.
AVERAGE CLASS SIZES
Phase 2014 2015* 2016
Prep – Year 3 21 20 23
Year 4 – Year 7 25 25 27
Year 8 – Year 10
Year 11 – Year 12
*From 2015, data for all state high schools include Year 7 students. Prior to 2015, only state high schools offering Year 7 had these students included in their counts.
Curriculum Delivery
Our Approach to Curriculum Delivery Veresdale Scrub State School offers a full range of key learning areas. Our distinctive curriculum offerings are:
Unique opportunities for every student to learn within a multi-age classroom.
6
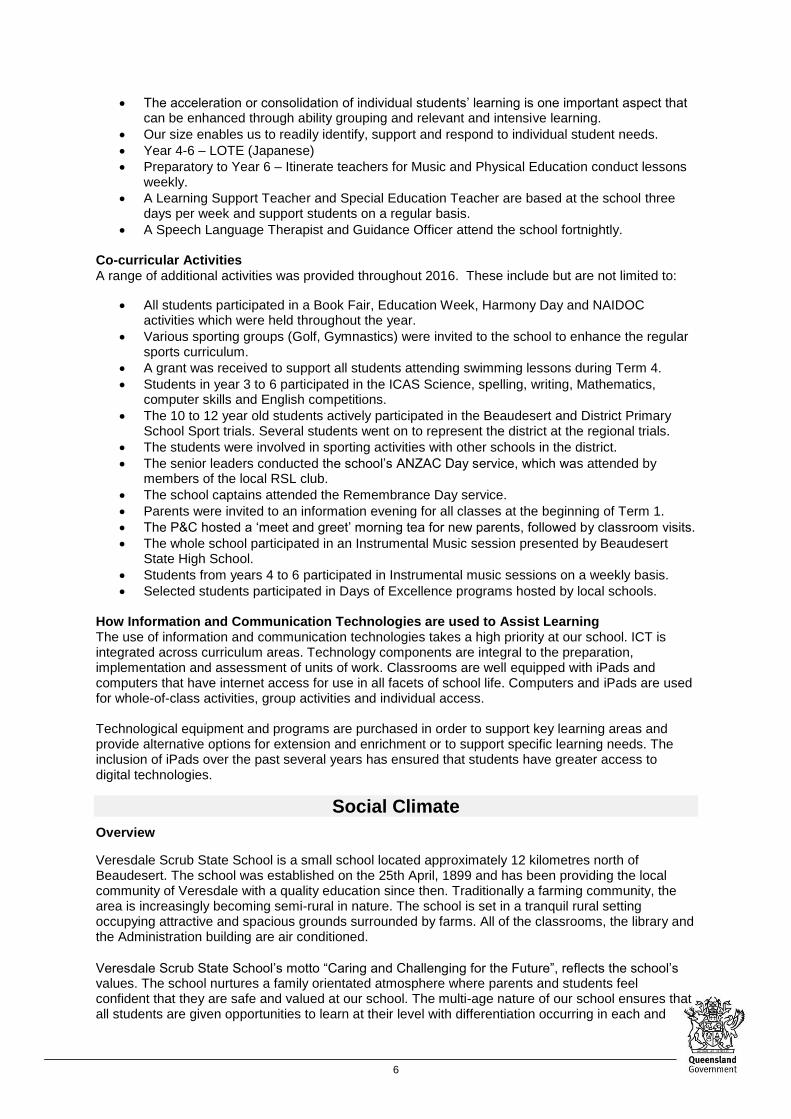
The acceleration or consolidation of individual students’ learning is one important aspect that can be enhanced through ability grouping and relevant and intensive learning.
Our size enables us to readily identify, support and respond to individual student needs.
Year 4-6 – LOTE (Japanese)
Preparatory to Year 6 – Itinerate teachers for Music and Physical Education conduct lessons weekly.
A Learning Support Teacher and Special Education Teacher are based at the school three days per week and support students on a regular basis.
A Speech Language Therapist and Guidance Officer attend the school fortnightly.
Co-curricular Activities
A range of additional activities was provided throughout 2016. These include but are not limited to:
All students participated in a Book Fair, Education Week, Harmony Day and NAIDOC activities which were held throughout the year.
Various sporting groups (Golf, Gymnastics) were invited to the school to enhance the regular sports curriculum.
A grant was received to support all students attending swimming lessons during Term 4.
Students in year 3 to 6 participated in the ICAS Science, spelling, writing, Mathematics, computer skills and English competitions.
The 10 to 12 year old students actively participated in the Beaudesert and District Primary School Sport trials. Several students went on to represent the district at the regional trials.
The students were involved in sporting activities with other schools in the district.
The senior leaders conducted the school’s ANZAC Day service, which was attended by members of the local RSL club.
The school captains attended the Remembrance Day service.
Parents were invited to an information evening for all classes at the beginning of Term 1.
The P&C hosted a ‘meet and greet’ morning tea for new parents, followed by classroom visits.
The whole school participated in an Instrumental Music session presented by Beaudesert State High School.
Students from years 4 to 6 participated in Instrumental music sessions on a weekly basis.
Selected students participated in Days of Excellence programs hosted by local schools. How Information and Communication Technologies are used to Assist Learning The use of information and communication technologies takes a high priority at our school. ICT is integrated across curriculum areas. Technology components are integral to the preparation, implementation and assessment of units of work. Classrooms are well equipped with iPads and computers that have internet access for use in all facets of school life. Computers and iPads are used for whole-of-class activities, group activities and individual access. Technological equipment and programs are purchased in order to support key learning areas and provide alternative options for extension and enrichment or to support specific learning needs. The inclusion of iPads over the past several years has ensured that students have greater access to digital technologies.
Social Climate
Overview
Veresdale Scrub State School is a small school located approximately 12 kilometres north of Beaudesert. The school was established on the 25th April, 1899 and has been providing the local community of Veresdale with a quality education since then. Traditionally a farming community, the area is increasingly becoming semi-rural in nature. The school is set in a tranquil rural setting occupying attractive and spacious grounds surrounded by farms. All of the classrooms, the library and the Administration building are air conditioned.
Veresdale Scrub State School’s motto “Caring and Challenging for the Future”, reflects the school’s values. The school nurtures a family orientated atmosphere where parents and students feel confident that they are safe and valued at our school. The multi-age nature of our school ensures that all students are given opportunities to learn at their level with differentiation occurring in each and
7
every classroom. Indigenous students, students with identified disabilities and particular learning needs and students with English as a second language form part of the diverse range of students
attending Veresdale Scrub State School.
Our school is a Positive Behaviour and Learning (PBL) school. Behaviour expectations are clear with positive behaviours reflective of our three school rules, Be Respectful, Be a Learner and Be Safe.
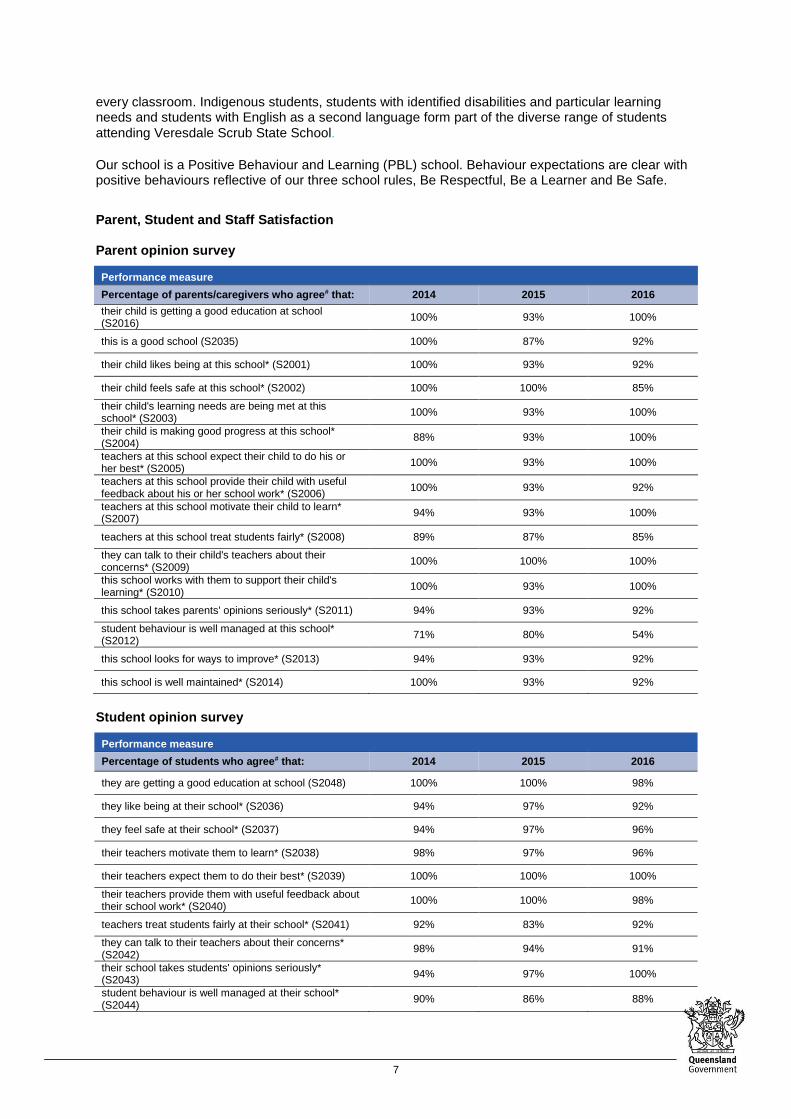
Parent, Student and Staff Satisfaction Parent opinion survey
Performance measure
Percentage of parents/caregivers who agree# that: 2014 2015 2016
their child is getting a good education at school (S2016)
100% 93% 100%
this is a good school (S2035) 100% 87% 92%
their child likes being at this school* (S2001) 100% 93% 92%
their child feels safe at this school* (S2002) 100% 100% 85%
their child's learning needs are being met at this school* (S2003)
100% 93% 100%
their child is making good progress at this school* (S2004)
88% 93% 100%
teachers at this school expect their child to do his or her best* (S2005)
100% 93% 100%
teachers at this school provide their child with useful feedback about his or her school work* (S2006)
100% 93% 92%
teachers at this school motivate their child to learn* (S2007)
94% 93% 100%
teachers at this school treat students fairly* (S2008) 89% 87% 85%
they can talk to their child's teachers about their concerns* (S2009)
100% 100% 100%
this school works with them to support their child's learning* (S2010)
100% 93% 100%
this school takes parents' opinions seriously* (S2011) 94% 93% 92%
student behaviour is well managed at this school* (S2012)
71% 80% 54%
this school looks for ways to improve* (S2013) 94% 93% 92%
this school is well maintained* (S2014) 100% 93% 92%
Student opinion survey
Performance measure
Percentage of students who agree# that: 2014 2015 2016
they are getting a good education at school (S2048) 100% 100% 98%
they like being at their school* (S2036) 94% 97% 92%
they feel safe at their school* (S2037) 94% 97% 96%
their teachers motivate them to learn* (S2038) 98% 97% 96%
their teachers expect them to do their best* (S2039) 100% 100% 100%
their teachers provide them with useful feedback about their school work* (S2040)
100% 100% 98%
teachers treat students fairly at their school* (S2041) 92% 83% 92%
they can talk to their teachers about their concerns* (S2042)
98% 94% 91%
their school takes students' opinions seriously* (S2043)
94% 97% 100%
student behaviour is well managed at their school* (S2044)
90% 86% 88%
8
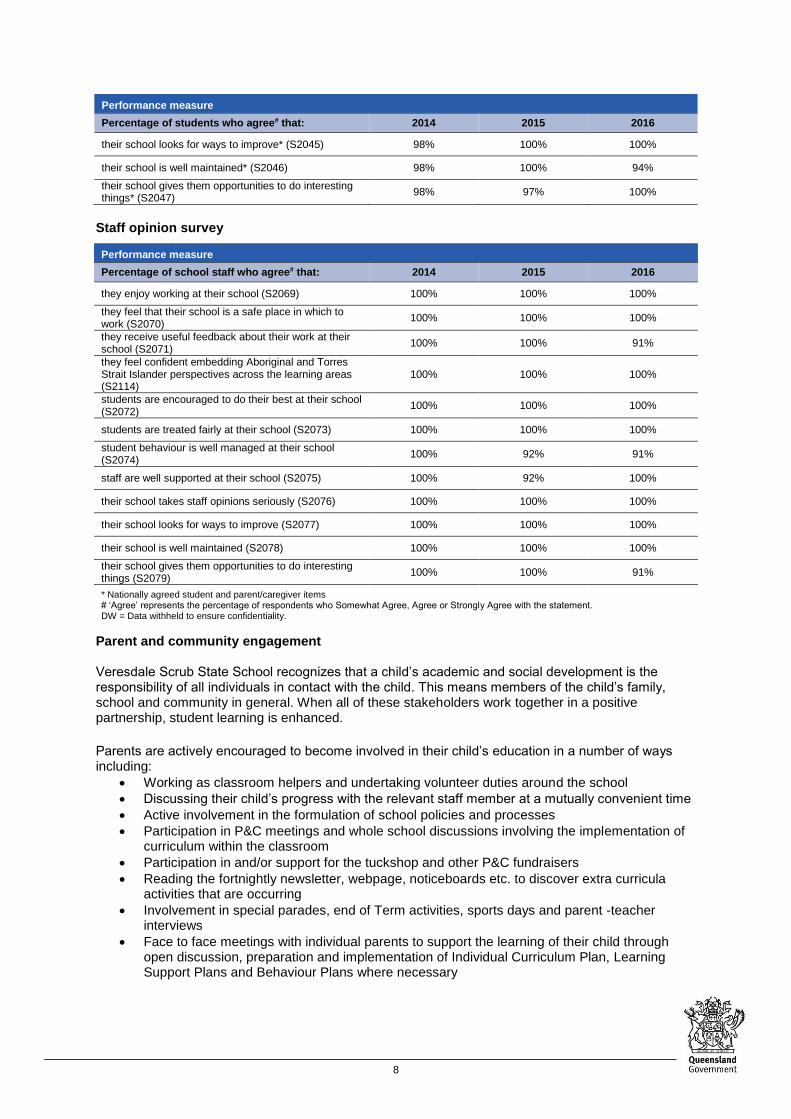
Performance measure
Percentage of students who agree# that: 2014 2015 2016
their school looks for ways to improve* (S2045) 98% 100% 100%
their school is well maintained* (S2046) 98% 100% 94%
their school gives them opportunities to do interesting things* (S2047)
98% 97% 100%
Staff opinion survey
Performance measure
Percentage of school staff who agree# that: 2014 2015 2016
they enjoy working at their school (S2069) 100% 100% 100%
they feel that their school is a safe place in which to work (S2070)
100% 100% 100%
they receive useful feedback about their work at their school (S2071)
100% 100% 91%
they feel confident embedding Aboriginal and Torres Strait Islander perspectives across the learning areas (S2114)
100% 100% 100%
students are encouraged to do their best at their school (S2072)
100% 100% 100%
students are treated fairly at their school (S2073) 100% 100% 100%
student behaviour is well managed at their school (S2074)
100% 92% 91%
staff are well supported at their school (S2075) 100% 92% 100%
their school takes staff opinions seriously (S2076) 100% 100% 100%
their school looks for ways to improve (S2077) 100% 100% 100%
their school is well maintained (S2078) 100% 100% 100%
their school gives them opportunities to do interesting things (S2079)
100% 100% 91%
* Nationally agreed student and parent/caregiver items # ‘Agree’ represents the percentage of respondents who Somewhat Agree, Agree or Strongly Agree with the statement. DW = Data withheld to ensure confidentiality.
Parent and community engagement Veresdale Scrub State School recognizes that a child’s academic and social development is the responsibility of all individuals in contact with the child. This means members of the child’s family, school and community in general. When all of these stakeholders work together in a positive partnership, student learning is enhanced.
Parents are actively encouraged to become involved in their child’s education in a number of ways including:
Working as classroom helpers and undertaking volunteer duties around the school
Discussing their child’s progress with the relevant staff member at a mutually convenient time
Active involvement in the formulation of school policies and processes
Participation in P&C meetings and whole school discussions involving the implementation of curriculum within the classroom
Participation in and/or support for the tuckshop and other P&C fundraisers
Reading the fortnightly newsletter, webpage, noticeboards etc. to discover extra curricula activities that are occurring
Involvement in special parades, end of Term activities, sports days and parent -teacher interviews
Face to face meetings with individual parents to support the learning of their child through open discussion, preparation and implementation of Individual Curriculum Plan, Learning Support Plans and Behaviour Plans where necessary
9
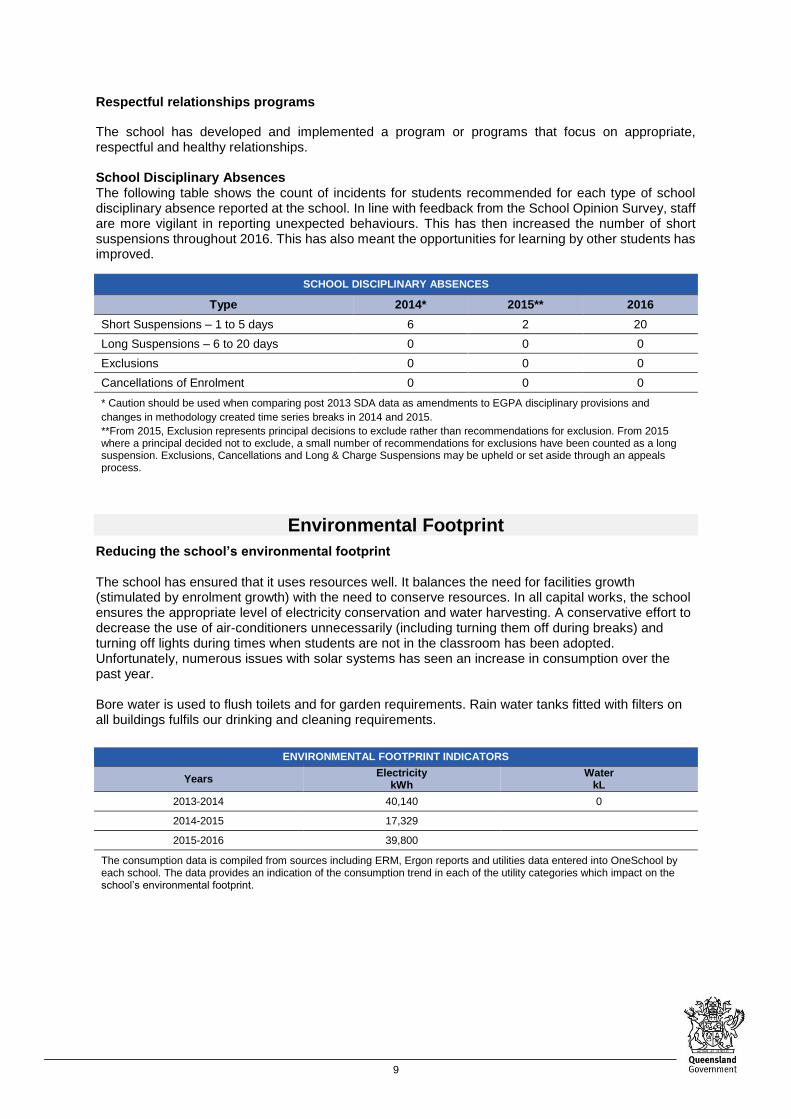
Respectful relationships programs
The school has developed and implemented a program or programs that focus on appropriate, respectful and healthy relationships. School Disciplinary Absences The following table shows the count of incidents for students recommended for each type of school disciplinary absence reported at the school. In line with feedback from the School Opinion Survey, staff are more vigilant in reporting unexpected behaviours. This has then increased the number of short suspensions throughout 2016. This has also meant the opportunities for learning by other students has improved.
SCHOOL DISCIPLINARY ABSENCES
Type 2014* 2015** 2016
Short Suspensions – 1 to 5 days 6 2 20
Long Suspensions – 6 to 20 days 0 0 0
Exclusions 0 0 0
Cancellations of Enrolment 0 0 0
* Caution should be used when comparing post 2013 SDA data as amendments to EGPA disciplinary provisions and
changes in methodology created time series breaks in 2014 and 2015.
**From 2015, Exclusion represents principal decisions to exclude rather than recommendations for exclusion. From 2015 where a principal decided not to exclude, a small number of recommendations for exclusions have been counted as a long suspension. Exclusions, Cancellations and Long & Charge Suspensions may be upheld or set aside through an appeals process.
Environmental Footprint
Reducing the school’s environmental footprint The school has ensured that it uses resources well. It balances the need for facilities growth (stimulated by enrolment growth) with the need to conserve resources. In all capital works, the school ensures the appropriate level of electricity conservation and water harvesting. A conservative effort to decrease the use of air-conditioners unnecessarily (including turning them off during breaks) and turning off lights during times when students are not in the classroom has been adopted. Unfortunately, numerous issues with solar systems has seen an increase in consumption over the past year. Bore water is used to flush toilets and for garden requirements. Rain water tanks fitted with filters on all buildings fulfils our drinking and cleaning requirements.
ENVIRONMENTAL FOOTPRINT INDICATORS
Years Electricity
kWh Water
kL
2013-2014 40,140 0
2014-2015 17,329
2015-2016 39,800
The consumption data is compiled from sources including ERM, Ergon reports and utilities data entered into OneSchool by each school. The data provides an indication of the consumption trend in each of the utility categories which impact on the school’s environmental footprint.
10
School Funding
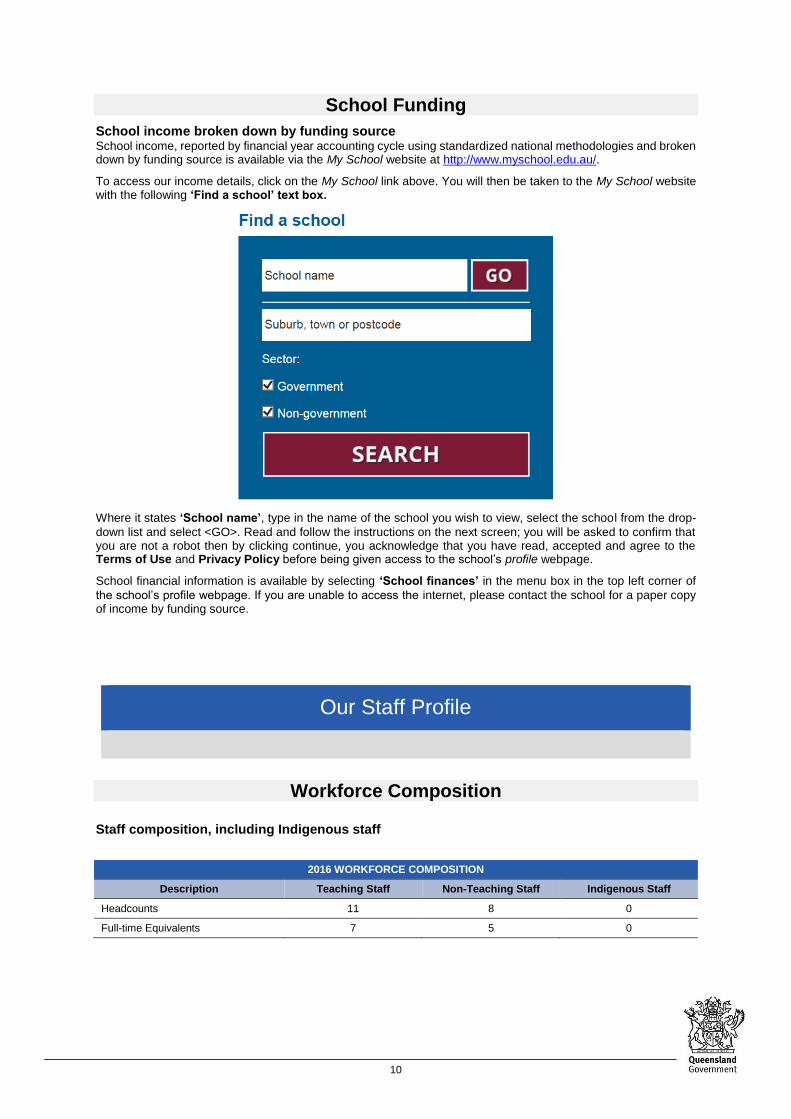
School income broken down by funding source School income, reported by financial year accounting cycle using standardized national methodologies and broken down by funding source is available via the My School website at http://www.myschool.edu.au/.
To access our income details, click on the My School link above. You will then be taken to the My School website with the following ‘Find a school’ text box.
Where it states ‘School name’, type in the name of the school you wish to view, select the school from the drop-
down list and select <GO>. Read and follow the instructions on the next screen; you will be asked to confirm that you are not a robot then by clicking continue, you acknowledge that you have read, accepted and agree to the Terms of Use and Privacy Policy before being given access to the school’s profile webpage.
School financial information is available by selecting ‘School finances’ in the menu box in the top left corner of
the school’s profile webpage. If you are unable to access the internet, please contact the school for a paper copy of income by funding source.
Our Staff Profile
Workforce Composition
Staff composition, including Indigenous staff
2016 WORKFORCE COMPOSITION
Description Teaching Staff Non-Teaching Staff Indigenous Staff
Headcounts 11 8 0
Full-time Equivalents 7 5 0
11
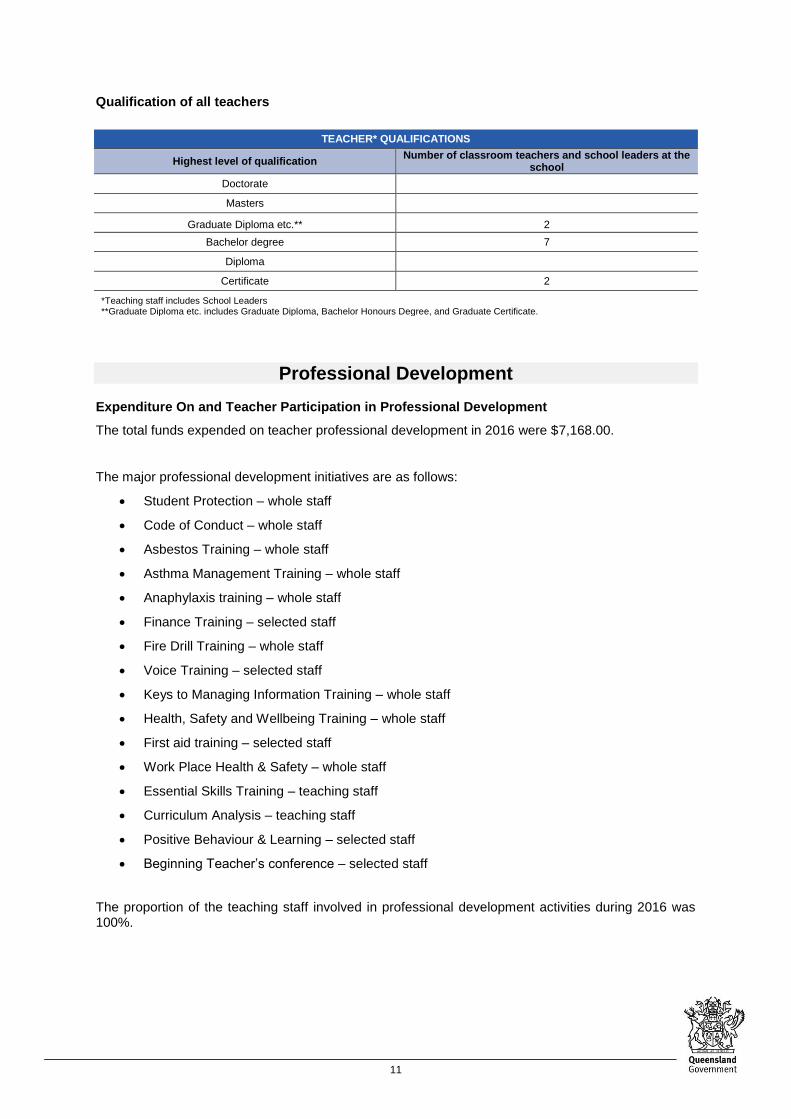
Qualification of all teachers
TEACHER* QUALIFICATIONS
Highest level of qualification Number of classroom teachers and school leaders at the
school
Doctorate
Masters
Graduate Diploma etc.** 2
Bachelor degree 7
Diploma
Certificate 2
*Teaching staff includes School Leaders **Graduate Diploma etc. includes Graduate Diploma, Bachelor Honours Degree, and Graduate Certificate.
Professional Development Expenditure On and Teacher Participation in Professional Development
The total funds expended on teacher professional development in 2016 were $7,168.00.
The major professional development initiatives are as follows:
Student Protection – whole staff
Code of Conduct – whole staff
Asbestos Training – whole staff
Asthma Management Training – whole staff
Anaphylaxis training – whole staff
Finance Training – selected staff
Fire Drill Training – whole staff
Voice Training – selected staff
Keys to Managing Information Training – whole staff
Health, Safety and Wellbeing Training – whole staff
First aid training – selected staff
Work Place Health & Safety – whole staff
Essential Skills Training – teaching staff
Curriculum Analysis – teaching staff
Positive Behaviour & Learning – selected staff
Beginning Teacher’s conference – selected staff
The proportion of the teaching staff involved in professional development activities during 2016 was 100%.
12
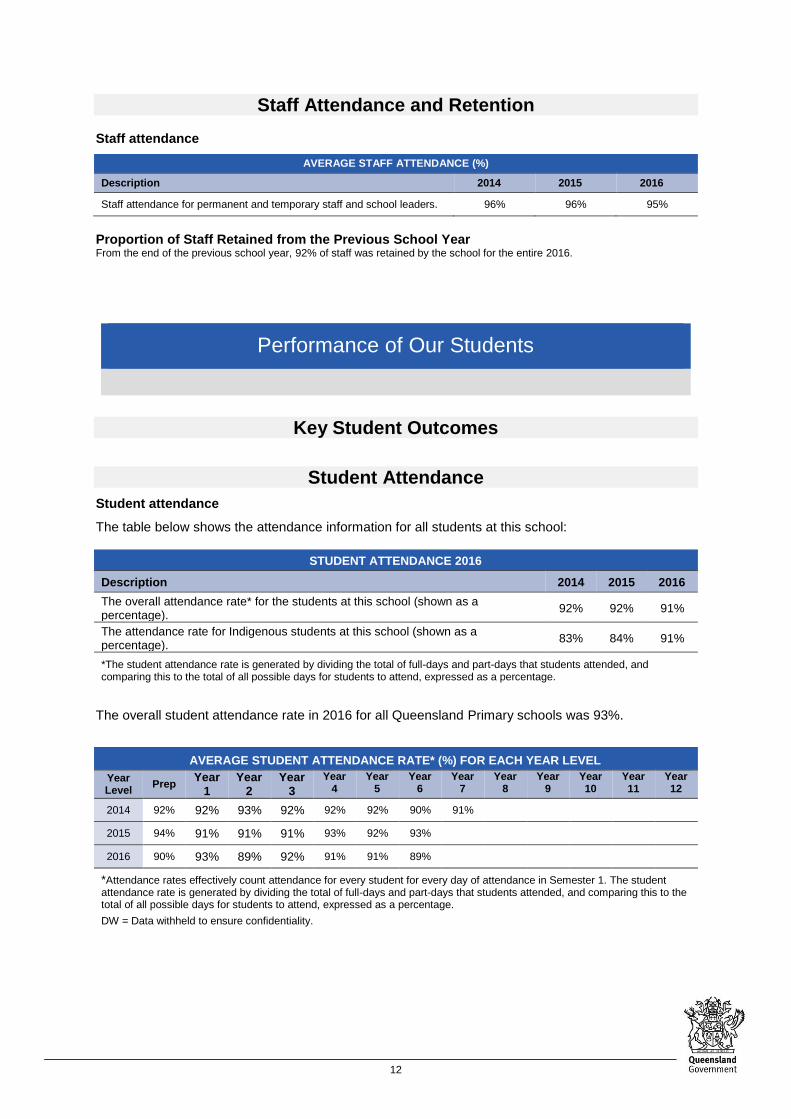
Staff Attendance and Retention Staff attendance
AVERAGE STAFF ATTENDANCE (%)
Description 2014 2015 2016
Staff attendance for permanent and temporary staff and school leaders. 96% 96% 95%
Proportion of Staff Retained from the Previous School Year From the end of the previous school year, 92% of staff was retained by the school for the entire 2016.
Performance of Our Students
Key Student Outcomes
Student Attendance
Student attendance
The table below shows the attendance information for all students at this school:
STUDENT ATTENDANCE 2016
Description 2014 2015 2016
The overall attendance rate* for the students at this school (shown as a percentage).
92% 92% 91%
The attendance rate for Indigenous students at this school (shown as a percentage).
83% 84% 91%
*The student attendance rate is generated by dividing the total of full-days and part-days that students attended, and comparing this to the total of all possible days for students to attend, expressed as a percentage.
The overall student attendance rate in 2016 for all Queensland Primary schools was 93%.
AVERAGE STUDENT ATTENDANCE RATE* (%) FOR EACH YEAR LEVEL
Year Level
Prep Year
1 Year
2 Year
3
Year 4
Year 5
Year 6
Year 7
Year 8
Year 9
Year 10
Year 11
Year 12
2014 92% 92% 93% 92% 92% 92% 90% 91%
2015 94% 91% 91% 91% 93% 92% 93%
2016 90% 93% 89% 92% 91% 91% 89%
*Attendance rates effectively count attendance for every student for every day of attendance in Semester 1. The student attendance rate is generated by dividing the total of full-days and part-days that students attended, and comparing this to the total of all possible days for students to attend, expressed as a percentage.
DW = Data withheld to ensure confidentiality.
13
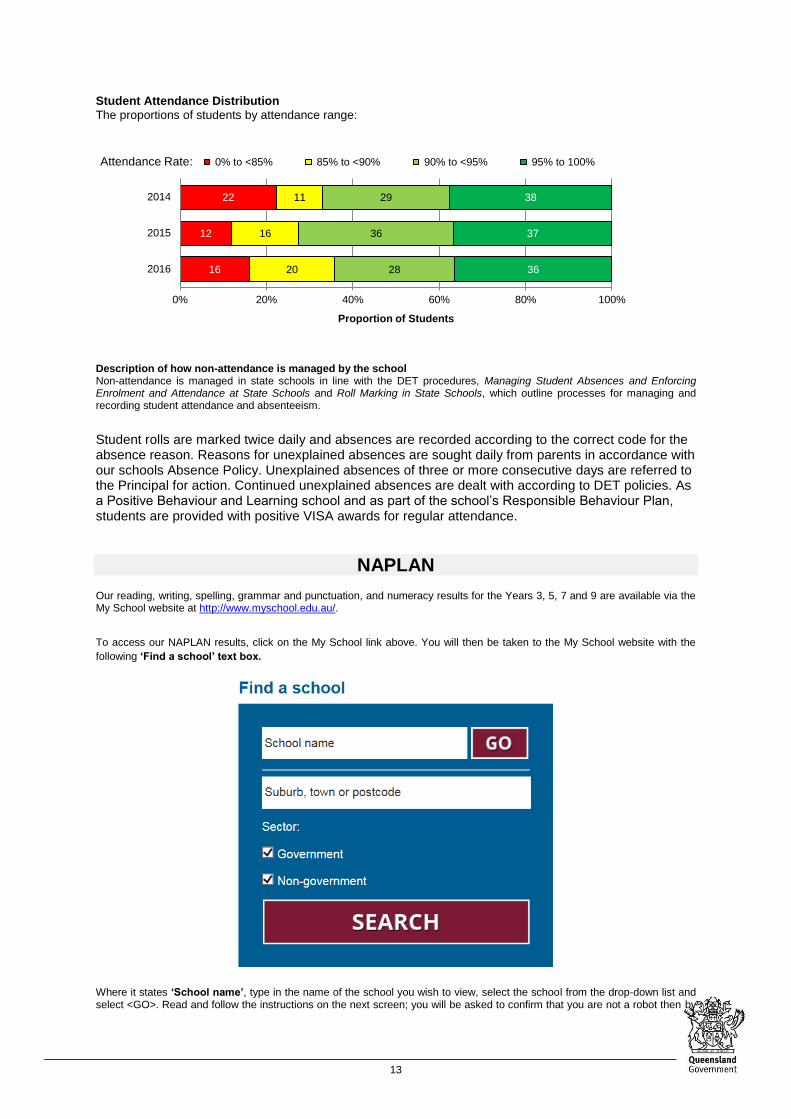
Student Attendance Distribution
The proportions of students by attendance range:
Description of how non-attendance is managed by the school Non-attendance is managed in state schools in line with the DET procedures, Managing Student Absences and Enforcing Enrolment and Attendance at State Schools and Roll Marking in State Schools, which outline processes for managing and recording student attendance and absenteeism.
Student rolls are marked twice daily and absences are recorded according to the correct code for the absence reason. Reasons for unexplained absences are sought daily from parents in accordance with our schools Absence Policy. Unexplained absences of three or more consecutive days are referred to the Principal for action. Continued unexplained absences are dealt with according to DET policies. As a Positive Behaviour and Learning school and as part of the school’s Responsible Behaviour Plan, students are provided with positive VISA awards for regular attendance.
NAPLAN
Our reading, writing, spelling, grammar and punctuation, and numeracy results for the Years 3, 5, 7 and 9 are available via the My School website at http://www.myschool.edu.au/.
To access our NAPLAN results, click on the My School link above. You will then be taken to the My School website with the
following ‘Find a school’ text box.
Where it states ‘School name’, type in the name of the school you wish to view, select the school from the drop-down list and select <GO>. Read and follow the instructions on the next screen; you will be asked to confirm that you are not a robot then by
16
12
22
20
16
11
28
36
29
36
37
38
0% 20% 40% 60% 80% 100%
2016
2015
2014
Proportion of Students
Attendance Rate: 0% to <85% 85% to <90% 90% to <95% 95% to 100%
14
clicking continue, you acknowledge that you have read, accepted and agree to the Terms of Use and Privacy Policy before being given access to the school’s profile webpage.
School NAPLAN information is available by selecting ‘NAPLAN’ in the menu box in the top left corner of the school’s profile webpage. If you are unable to access the internet, please contact the school for a paper copy of our school’s NAPLAN results.
Conclusion
OPTIONAL - Include a brief conclusion