Embed Size (px)
Citation preview
Veolia Water Outsourcing Ltd. Project Omega - Northern Ireland
Duncrue Sludge Treatment Facility
Energy Audit Report
Duncrue Sludge Treatment Facility Energy Audit Report
2
HISTORY SHEET PROJECT OMEGA
Document Controller
Revision Date Comment Prepared By Checked By Approved By
1.0 31/07/18 Energy Audit Report G. Speers A. Borisova P. O’Kane

Duncrue Sludge Treatment Facility Energy Audit Report
3
Revision Date Page No. Section No. Details of Amendment
Duncrue Sludge Treatment Facility Energy Audit Report
4
Contents
Executive Summary ...................................................................................................................................... 5
1. Site Inspection & Process Overview ......................................................................................................... 6
1.1 Sludge Reception Process Overview ...................................................................................................... 6
1.2 Stream 1 Process Overview ................................................................................................................... 6
1.3 Stream 2 Process Overview ................................................................................................................... 7
1.4 Waste Heat Recovery & Steam Production Overview ............................................................................. 7
1.5 Energy Recovery Overview .................................................................................................................... 7
2. Electrical Measurement Overview ............................................................................................................. 8
3. Electrical Energy Relationship Overview ................................................................................................... 8
3.1 Sludge Received Relationship Overview ................................................................................................ 9
3.2 Sludge Disposed Relationship Overview ................................................................................................ 9
3.3 Energy Recovered Relationship Overview .............................................................................................. 9
4. Energy Audit Overview & Results ........................................................................................................... 10
4.1 Sludge Received Relationship Energy Audit Results ............................................................................ 10
4.2 Sludge Disposed Relationship Energy Audit Results ............................................................................ 11
4.3 Energy Recovered Relationship Energy Audit Results .......................................................................... 11
5. Conclusion & Discussion ........................................................................................................................ 12
Duncrue Sludge Treatment Facility Energy Audit Report
5
Executive Summary
The following report provides information relating to the annual energy consumption, generation and performance of the electrical systems within the IPPC installation boundaries of the Duncrue Sludge Treatment Facility over the last 4 years and following a previous report submitted in 2014. From the report it can be seen that the overall energy consumption for the volume of sludge received and disposed of during this period has reduced by 2949976 KWh when taking into account both energy consumption and energy recovery and as such indicates an improvement in the performance of the processes on this site. It has further been found that as noted in the previous report the relationship for sludge received does not currently accurately predict the anticipated energy consumption for this process due to changes to the odour control for the process. Over this monitoring period a continuously varying annual consumption was witnessed which would indicate a need to gather further data in advance of recommending any adjustment to the currently set baseline.

Duncrue Sludge Treatment Facility Energy Audit Report
6
1. Site Inspection & Process Overview
The Duncrue Sludge Treatment facility consists of two fluidised bed incinerators (denoted as “Stream 1” & “Stream 2”) in addition to a sludge cake store and sludge reception facility which accepts liquid sludge from the various wastewater treatment works within Northern Ireland. The purpose of the incinerators is to transform the sludge created through wastewater treatment processes into an inert ash material which can be placed in landfill in addition to recovering heat energy produced by this process. The Stream 1 incinerator was constructed and commissioned in 1999 and can accept both liquid and cake type sludges. The Stream 2 incinerator was constructed and commissioned in 2008 and treats cake type sludges only.
1.1 Sludge Reception Process Overview
The sludge reception consists of four tanker discharge points, bar screening systems, holding tanks, transfer pumps and an odour control system. Tankers connect to the discharge points from where a measurement of the volume transferred and average sludge density are automatically taken to determine the tonnes of dried solids for each discharge. The liquid sludge cascades into a reception sump from where it passes through a fixed inclined cylindrical bar type screening system prior to transfer through pumping to the four embedded holding tanks. Separately indigenous and Surplus Activated Sludges from the neighbouring Duncrue Waste Water Treatment Works are transferred to the site via Northern Ireland Waters’ own site treatment process. As with the imports process the volume and average dried solids content of this flow is measured to determine the tonnes of dried solids transferred.
1.2 Stream 1 Process Overview
Form the holding tanks liquid sludge is transferred through pumping to the Stream 1 Incinerator holding tank from where a process of treatment known as de-watering through a centrifuge process is carried out. As the name suggests the de-watering process removes a proportion of the water from the liquid sludge to create a sludge cake which is suitable for incineration (typically 20 – 25% dried solids content). Following de-watering the cake can be stored within the three embedded silos of Stream1 which can also accept cake imports from off-site de-watering processes or transferred through conveyors to trailers for transport to Stream 2, the sludge cake store or alternative disposal. From the embedded silos conveyors transfer the cake to a sludge drier which is a drum that agitates and pre-warms the sludge using heat derived from the incinerator waste heat system prior to transfer to the incinerator bed. Following drying conveyors transfer the sludge into the fluidised bed where the sludge is exposed to temperatures of 950ᵒC which causes the sludge to fully combust, releasing heat energy and creating a sanitised ash. To maintain the combustion cycle within the incinerator bed a Forced Draft fan operates to force oxygenated air into the furnace with an Induced Draft fan further utilised to remove the de-oxygenated air following combustion. An element within the de-oxygenated air exhausting from the furnace is the ash material created from the sludge incineration process which is drawn through an electrostatic precipitator array that attracts the ash thus separating it from the air. The accumulated ash is then further removed from the precipitator plates via a hammer mechanism from where the ash descends into a hopper and is transferred using an air conveyor system to the embedded ash silo storage. The ash separated air from the incinerator process is then further passed through a scrubber and adsorber arrangement which filters, washes and polishes the air prior to final exhausting to atmosphere through the incinerator stack.
Duncrue Sludge Treatment Facility Energy Audit Report
7
1.3 Stream 2 Process Overview
The embedded cake silo of the stream 2 plant accepts trailer imports through three discharge points from where automated cranes mix the cake to homogenise the material and transfer it to a hopper conveyor system. From the conveyor sludge cake passes into the sludge drier drum for agitation and pre-warming. From the drier conveyors transfer the cake into the fluidised bed where the sludge is exposed to temperatures of 950ᵒC which causes the sludge to fully combust, releasing heat energy and creating a sanitised ash. To maintain the combustion cycle within the incinerator bed a Forced Draft fan operates to force oxygenated air into the furnace with an Induced Draft fan further utilised to remove the de-oxygenated air following combustion. An element within the de-oxygenated air exhausting from the furnace is the ash material created from the sludge incineration process which is drawn through an electrostatic precipitator array that attracts the ash thus separating it from the air. The accumulated ash is then further removed from the precipitator plates via a hammer mechanism from where the ash descends into a hopper and is transferred using an air conveyor system to the embedded ash silo storage. The ash separated air from the incinerator process is then further passed through a scrubber and adsorber arrangement which filters, washes and polishes the air prior to final exhausting to atmosphere through the incinerator stack.
1.4 Waste Heat Recovery & Steam Production Overview
As briefly described in the previous two sections the combustion of sludge cake generates an amount of heat (dependant on calorific content) which is transmitted through the exhausting gas as waste heat. By passing this gas through a force circulated, water filled, coiled pipework it is possible to absorb/recover a proportion of the waste heat generated through the combustion process. The heat energy transferred into the water generates steam which is used for sludge drying, pre-heating and re-heating processes in addition to which it can further be used to generate electricity by way of a turbine generator array. N.B. A turbine generator array is only provided within the stream 2 incinerator due to stipulations placed on the site by NIE which has led to the stream 1 turbine generator being de-commissioned.
1.5 Energy Recovery Overview
The steam created from the waste heat recovery process as described in Section 1.4 exits the waste heat boiler and transfers to a steam drum from where the steam can either transfer to the turbine or the sludge drying, pre-heating and re-heating processes. Dependant on turbine availability the steam will either pass through the turbine and forward to the other processes or bypass the turbine completely when not available. The turbine itself consists of a scroll type rotor which is connected to regulated high pressure steam on one side and a lower pressure exhaust on the opposite side. Due to the pressure differential across the rotor the steam transition from high pressure to a lower pressure induces mechanical rotation of the turbine rotor. The turbine rotor has an integral output shaft which is mechanically connected to an alternator type electrical generator which subsequently rotates through operation of the turbine. The alternator internally consists of a steel squirrel cage type rotor surrounded by static wound copper loops known

Duncrue Sludge Treatment Facility Energy Audit Report
8
as windings which from application of a magnetic field during rotation induces electrical power into the embedded windings in proportion to the rotational speed and magnetic flux strength (excitation). The electrical power generation process of the alternator acts as a mechanical resistance to the rotation of the turbine rotor and similarly the amount of resistance created is proportional to the amount of energy being generated. The alternator operates in a synchronised parallel arrangement with the grid supply with the physical output mirroring the characteristics of the grid which in this way enables seamless and safe coupling of the two power sources.
2. Electrical Measurement Overview
The electrical consumption and production form the various process elements within the Duncrue facility are monitored and measured through the use of embedded electrical energy meters which provide instantaneous and cumulative energy measurements for the systems. All site consumers and producers in excess of 40KW consumption rating are monitored in this manner which provides a high degree of granular information which can be used to assess the operating dynamics of the respective process or asset. During the last four years the electrical consumption and production of the Duncrue facility has been monitored in order to determine the energy consumed/produced by the respective processes of the site. From the initial measurements taken for the previous report a strong baseline for future consumption/production was created which will be used as the measure to identify any changes in consumption/production patterns in addition to overall usage.
The measurement periods from the previous report were compiled annually from weekly readings taken by on site staff with the initial start date being the 13th June 2011 and the final reading being taken on 11th June 2014 however from this time the meters have been integrated into an Historian system which gathers the data automatically so enabling month end cut offs for reporting. As such the periods for each year of this report with the exception of the first year will be taken from 01st June to 31st May of the next year with the first year being taken from 12th June 2014 to 31st May 2015 to provide a continuous record.
3. Electrical Energy Relationship Overview
In order to quantify the energy consumed/produced against a specific process the performance data for the respective processes has been collected and correlated against the energy measurements to provide a direct measure of cumulative energy consumed/produced and cumulative volumetric process units. From this information a series of relationships were developed which provide a means of assessing the volumetric units processed in relation to the electrical energy units consumed or generated. From this assessment a specific energy performance indicator is derived which can be used to predict the future consumption/production based on a theoretical number of units that will be processed in addition to providing a useful comparison for trending of annual consumption/production. The relationships as defined have been set out using a single process and consumption/production metric so that the relationships derived can be directly compared without the need for further calculation. In respect of the Duncrue facility the site processes have been split into three distinct relationships which are Sludge Received, Sludge Disposed and Energy Recovered.

Duncrue Sludge Treatment Facility Energy Audit Report
9
3.1 Sludge Received Relationship Overview
As described in Section 1.1 liquid sludge is imported into the site through tanker and indigenous transfers with the volume measured in terms of tonnes dried solids which is a function of liquid volume multiplied by the sludge density of the import. As such from division of the electrical energy consumed by the dried solids received an indicator of the consumption required to perform this process element is derived as shown below.
From the previous audit report a measure of the anticipated performance was derived from the average of the first three years of results with it being found that the site process consumed 33.74 KWh/TTDS however it was noted that the value may need further review due to changes to the site odour control system which may lead to the measure not being accurate in the future. As such this value will be used initially as the comparative measure with an appraisal of its’ future suitability included.
3.2 Sludge Disposed Relationship Overview
As described in Sections 1.2 & 1.3 sludge cake is combusted within the two incinerators to create an inert ash which can be inserted into landfill. As such from division of the electrical energy consumed by the dried solids disposed an indicator of the consumption required to perform this process element is derived as shown below.
From the previous audit report a measure of the anticipated performance was derived from the average of the first three years of results with it being found that the site process consumed 460.88 KWh/TTDS. This value will be used as a baseline to compare against the performance of the process over the subsequent years. 3.3 Energy Recovered Relationship Overview
From the energy recovery processes described within Sections 1.4 & 1.5 waste heat energy resulting from the combustion of sludge is passed through a turbine generator array in order to recover a proportion of this energy. As such from the division of the energy produced by the turbine generator by the dried solids disposed an indicator of the energy produced by this process element is derived as shown below.
From the previous audit report a measure of the anticipated performance was derived from the average of the first three years of results with it being found that the site process consumed 25.67 KWh/TTDS. This value will be used as a baseline to compare against the performance of the process over the subsequent years.
Sludge Dsiposed Relationship =Energy Consumed (KWh)
KWh / TTDSSludge Volume Disposed (TTDS)
Sludge Received Relationship =Energy Consumed (KWh)
Sludge Volume Received (TTDS)KWh / TTDS
Energy Recovered Relationship =Energy Produced (KWh)
KWh / TTDSSludge Volume Disposed (TTDS)
Duncrue Sludge Treatment Facility Energy Audit Report
10
4. Energy Audit Overview & Results
From the relationships described in Section 3 an energy audit was undertaken to confirm the annual consumption and production against the relationships defined. The audits have been compiled based on the annual results as described in Section 2. 4.1 Sludge Received Relationship Energy Audit Results
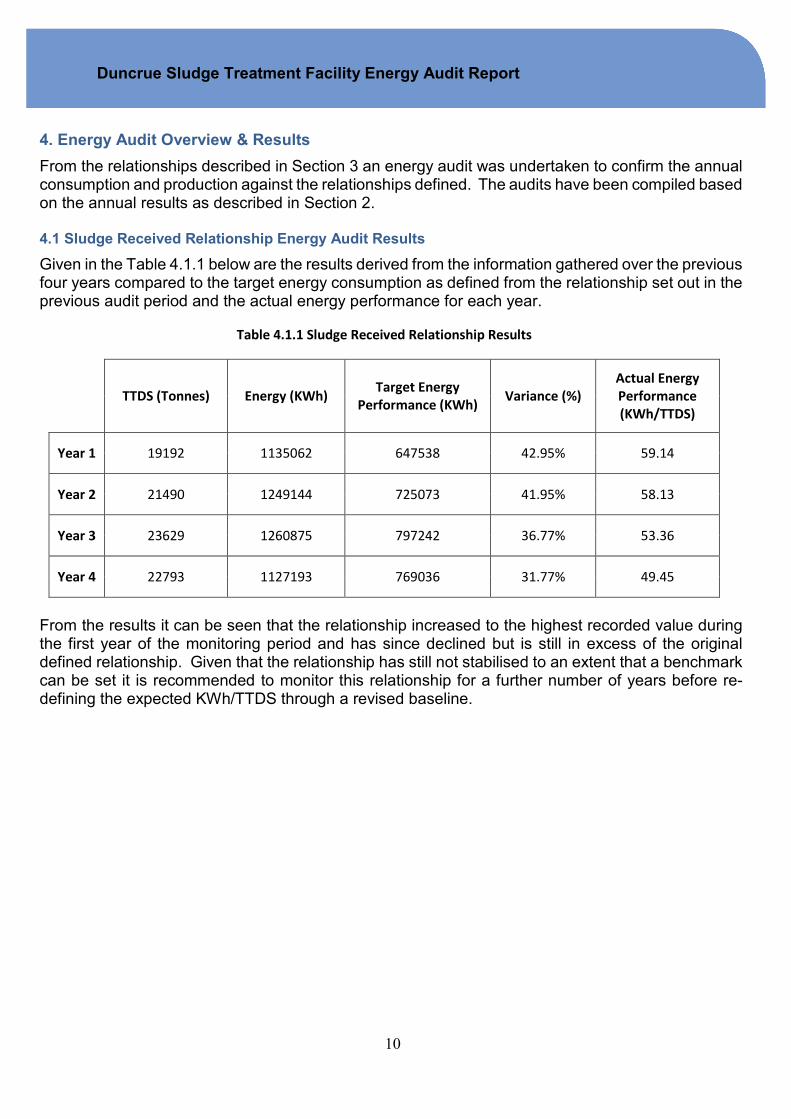
Given in the Table 4.1.1 below are the results derived from the information gathered over the previous four years compared to the target energy consumption as defined from the relationship set out in the previous audit period and the actual energy performance for each year.
Table 4.1.1 Sludge Received Relationship Results
TTDS (Tonnes) Energy (KWh) Target Energy
Performance (KWh) Variance (%)
Actual Energy
Performance
(KWh/TTDS)
Year 1 19192 1135062 647538 42.95% 59.14
Year 2 21490 1249144 725073 41.95% 58.13
Year 3 23629 1260875 797242 36.77% 53.36
Year 4 22793 1127193 769036 31.77% 49.45
From the results it can be seen that the relationship increased to the highest recorded value during the first year of the monitoring period and has since declined but is still in excess of the original defined relationship. Given that the relationship has still not stabilised to an extent that a benchmark can be set it is recommended to monitor this relationship for a further number of years before re-defining the expected KWh/TTDS through a revised baseline.
Duncrue Sludge Treatment Facility Energy Audit Report
11
4.2 Sludge Disposed Relationship Energy Audit Results
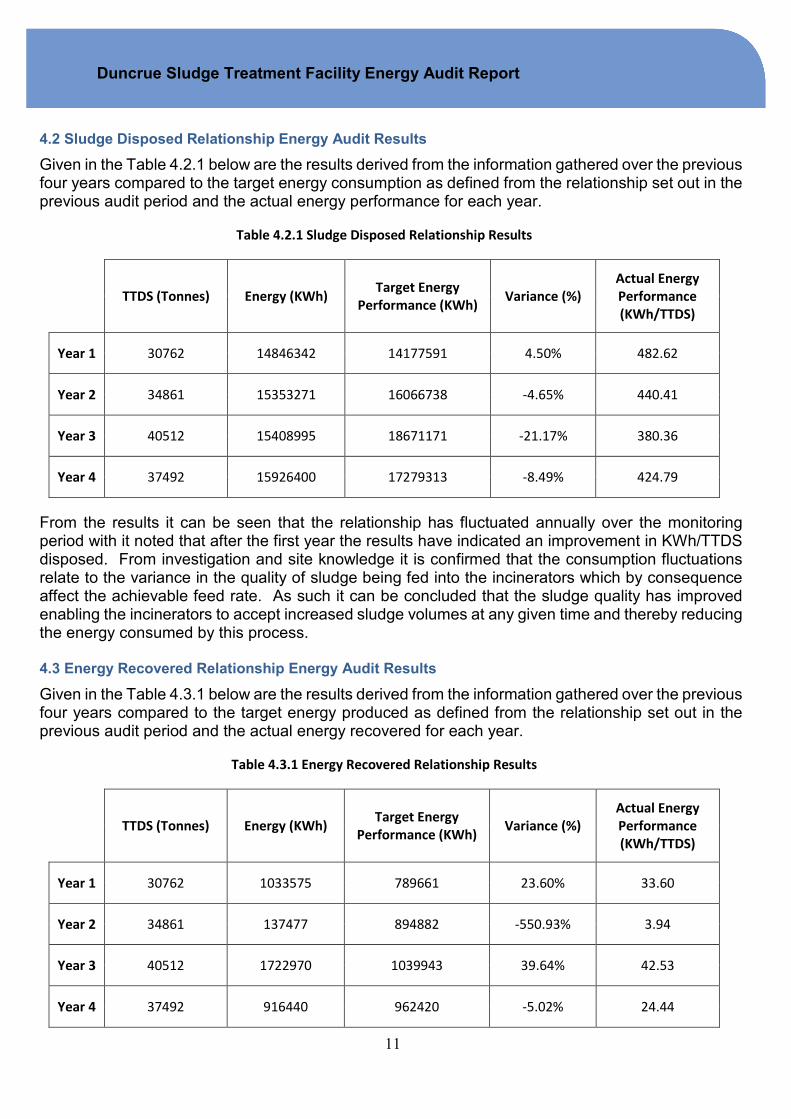
Given in the Table 4.2.1 below are the results derived from the information gathered over the previous four years compared to the target energy consumption as defined from the relationship set out in the previous audit period and the actual energy performance for each year.
Table 4.2.1 Sludge Disposed Relationship Results
TTDS (Tonnes) Energy (KWh) Target Energy
Performance (KWh) Variance (%)
Actual Energy
Performance
(KWh/TTDS)
Year 1 30762 14846342 14177591 4.50% 482.62
Year 2 34861 15353271 16066738 -4.65% 440.41
Year 3 40512 15408995 18671171 -21.17% 380.36
Year 4 37492 15926400 17279313 -8.49% 424.79
From the results it can be seen that the relationship has fluctuated annually over the monitoring period with it noted that after the first year the results have indicated an improvement in KWh/TTDS disposed. From investigation and site knowledge it is confirmed that the consumption fluctuations relate to the variance in the quality of sludge being fed into the incinerators which by consequence affect the achievable feed rate. As such it can be concluded that the sludge quality has improved enabling the incinerators to accept increased sludge volumes at any given time and thereby reducing the energy consumed by this process. 4.3 Energy Recovered Relationship Energy Audit Results
Given in the Table 4.3.1 below are the results derived from the information gathered over the previous four years compared to the target energy produced as defined from the relationship set out in the previous audit period and the actual energy recovered for each year.
Table 4.3.1 Energy Recovered Relationship Results
TTDS (Tonnes) Energy (KWh) Target Energy
Performance (KWh) Variance (%)
Actual Energy
Performance
(KWh/TTDS)
Year 1 30762 1033575 789661 23.60% 33.60
Year 2 34861 137477 894882 -550.93% 3.94
Year 3 40512 1722970 1039943 39.64% 42.53
Year 4 37492 916440 962420 -5.02% 24.44

Duncrue Sludge Treatment Facility Energy Audit Report
12
From the results it can be seen that during Year 2 of the monitoring period a sharp reduction in energy recovered was observed while Years 1 & 3 exhibited better than expected results and Year 4 indicating a marginally below target output. From investigation and site knowledge it is confirmed that the energy recovery decrease in Year 2 was the result of a failure of the turbine that required the asset to be sent to Germany for repair which led to a significant period of time where there was no energy recovery on the site.
5. Conclusion & Discussion
From the data collected it can be seen that the Duncrue Street processes covered under this audit
consumed 66307282 KWh against a benchmark target consumption of 69133701 KW indicating an
energy reduction of 2826419 KWh for the volume of sludge received and disposed of during this
period.
Additionally energy amounting to 3810462 KWh was recovered against a target production of
3686905 KWh indicating an increase of 123557 KWh in energy recovered for the volume of sludge
received and disposed of during this period.
Therefore overall the Duncrue Street processes have consumed 2949976 KWh less for the volume
of sludge received and disposed of during this period in comparison to previous period when
measured against the EPI’s defined in the previous report.
It is recognised that the sludge received relationship will need amending however due to the
continued variance in the annual figures it is recommended that more data is gathered in advance of
adjusting the relationship metric.
Based on the findings of this report it is advised that the audit should be undertaken in a further three
years from this time.