Embed Size (px)
Citation preview
ARTICLE IN PRESS
0304-405X/$ - s
doi:10.1016/j.jfi
$We thank
assistance. We
American Econ
Research, the U
Research and t�Correspond
USA. Tel.: +1
E-mail addr
Journal of Financial Economics 87 (2008) 1–23
www.elsevier.com/locate/jfec
Venture capital investment cycles:The impact of public markets$
Paul Gompersa,b, Anna Kovnera,Josh Lernera,b,�, David Scharfsteina,b
aHarvard Business School, Graduate School of Business Administration, Rock Center 214, Boston, MA 02163, USAbNational Bureau of Economic Research, Cambridge, MA, USA
Received 8 July 2005; received in revised form 6 November 2006; accepted 11 December 2006
Available online 1 August 2007
Abstract
It is well documented that the venture capital industry is highly volatile and that much of this volatility is associated with
shifting valuations and activity in public equity markets. This paper examines how changes in public market signals
affected venture capital investing between 1975 and 1998. We find that venture capitalists with the most industry
experience increase their investments the most when public market signals become more favorable. Their reaction to an
increase is greater than the reaction of venture capital organizations with relatively little industry experience and those with
considerable experience but in other industries. The increase in investment rates does not affect the success of these
transactions adversely to a significant extent. These findings are consistent with the view that venture capitalists rationally
respond to attractive investment opportunities signaled by public market shifts.
r 2007 Elsevier B.V. All rights reserved.
JEL classification: G24; G32
Keywords: Private equity; Initial public offering; Market cycles
1. Introduction
The high volatility of the venture capital industry is well documented. This volatility manifests itself in anumber of ways: the funds flowing to venture capital firms, the investments firms make in portfolio companies,and the financial performance of portfolio companies and venture capital firms (Gompers and Lerner, 2004).
ee front matter r 2007 Elsevier B.V. All rights reserved.
neco.2006.12.002
Vanessa Broussard, Daniel Goodman, Leif Holtzman, Alex Lee, Miriam Tawil, and Chenling Zhang for their research
also thank Raffi Amit, Bob Gibbons, Ed Rock, Bill Schwert, an anonymous referee, and seminar participants at the
omic Association, Harvard University, the National Bureau of Economic Research, the Stockholm Institute for Financial
niversity of Chicago, and the University of Pennsylvania for helpful comments. Harvard Business School’s Division of
he National Science Foundation provided financial assistance. All errors and omissions are our own.
ing author. Harvard Business School, Graduate School of Business Administration, Rock Center 214, Boston, MA, 02163,
617 495 6065; fax: +1 617 495 3817.
ess: [email protected] (J. Lerner).
ARTICLE IN PRESSP. Gompers et al. / Journal of Financial Economics 87 (2008) 1–232
Much of this volatility appears to be tied to valuations in public equity markets. An increase in initial publicoffering (IPO) valuations leads venture capital firms to raise more funds (Gompers and Lerner, 1998b; Jengand Wells, 2000), an effect that is particularly strong among younger venture capital firms (Kaplan andSchoar, 2005). Moreover, returns of venture capital funds appear to be highly correlated with the returns onthe market as a whole (Cochrane, 2005; Kaplan and Schoar, 2005; Ljungqvist and Richardson, 2003).
Many industry observers (see, for instance, Gupta, 2000) argue that the volatility of the venture capital industryis a symptom of overreaction by venture capitalists and entrepreneurs to perceived investment opportunities.These swings result in periods in which too many competing companies are funded, followed by ones in which notenough companies have access to capital. The booms of 1969–1972, 1981–1983, and 1998–2000 provide extremeillustrations of these problems. Investments during these years grew dramatically and were concentrated in a fewareas. Considerable sums were devoted to supporting very similar firms: e.g., scientific instrument companies inthe 1960s, personal computer hardware manufacturers in the 1980s, and Internet retailers and telecommunica-tions concerns in the late 1990s. Meanwhile, many apparently promising areas languished unfunded during theseperiods as venture capitalists raced to focus on the most visible and popular investment areas.
This alleged overreaction may have its roots in the behavioral biases of venture capitalists that irrationallyassociate past investment successes with future investment opportunities. Or it may stem from venturecapitalists who feel compelled to follow the herd out of concern for the reputation consequences of beingcontrarians (Scharfstein and Stein, 1990). Indeed, in 1999, even private equity firms with investment mandatesto invest in leveraged buyouts felt compelled to back Internet startups.
A contrasting view is that the volatility of the venture capital industry stems not from overreaction, butfrom the inherent volatility of fundamentals. According to this view, fluctuation in venture capital investmentactivity is simply a response to changes in investment opportunities. For instance, there may be shocks to theinvestment opportunities of existing entrepreneurial firms or entry by new entrepreneurs, both of whichincrease the demand for capital.
This paper takes a step towards distinguishing between the ‘‘overreaction view’’ and the ‘‘fundamentalsview’’ by examining the responses of different classes of venture investors. We start with the observation (andempirically document) that the most experienced venture capital firms generally record the best performance(Sorensen, 2004). We then examine how these investors respond to public market signals of investmentopportunities. Are the most experienced investors more likely to increase their investments when the marketheats ups? And, how well do they do with these investments relative to less experienced venture capitalists? If wefind that the most experienced investors are more likely to increase their investment levels when the market heatsup, this would suggest that shifts in fundamentals are an important component of venture capital investing. Thisinterpretation would find further support if there is also little degradation in their performance. If we observeinstead that the least experienced venture capitalists are most likely to increase their investment activity duringhot markets, this would lend more credibility to the view that overreaction is a more important cause ofvolatility in the venture capital industry.
Our empirical results indicate that investment by the most experienced venture capital firms—notably, thosewith the most industry experience—are most responsive to public market signals of investment opportunities.We start by showing that venture capital investment activity at the industry level is very sensitive to publicmarket signals of industry attractiveness when Tobin’s Q is used; a shift from the bottom to the top quartile inQ increases the number of investments by more than 15%. There is no significant pattern, however, when weuse IPO activity as our measure of public market signals.
We then show that this relationship is driven largely by venture capital firms with the most experience doingdeals in the industry. Overall experience (across all industries) has no effect on investment sensitivity toindustry Q and IPO activity once we control for industry experience. Moreover, although the success rate fordeals associated with a hot market is lower than that for deals associated with a cold market, the difference issmall. Experienced venture capital firms perform slightly better in hot markets, while less experienced venturecapital firms do somewhat worse. These findings suggest that an important component of volatility in venturecapital investment activity is driven by volatility of fundamentals.
Of independent interest is our finding on the importance of industry-specific rather than overall experience.This result points to the importance of industry-specific human capital and suggests that a critical part ofventure capital investing is the network of industry contacts to identify good investment opportunities as well
ARTICLE IN PRESSP. Gompers et al. / Journal of Financial Economics 87 (2008) 1–23 3
as the know-how to manage and add value to these investments. These contacts and know-how come onlyfrom long-standing experience doing deals in an industry.
The broad question examined in this paper—the extent to which cycles in venture capital are driven byoverreaction to public market signals or changes in the industry’s fundamentals—is related to a substantialstream of research in financial economics. While the hypothesis remains controversial (e.g., Fama, 1998), agrowing body of evidence (e.g., DeBondt and Thaler, 1985, 1990) suggests that the stock market overreacts tonews, particularly at horizons greater than one year (Hong and Stein (1999) provide a theoretical frameworkfor understanding these patterns). More recently, corporate investment has also been shown to be affected bythe non-fundamental portion of stock prices (Baker, Stein, and Wurgler, 2003). By way of contrast to much ofthis literature, this analysis suggests that changing public market signals reflects changing fundamentals.1
The rest of the paper is organized as follows. Section 2, describes the construction of the data and providesbasic summary statistics. Section 3 examines the impact of shifts in valuations and IPO activity on venturecapital firm investment activity. In that section, we also look at how investment success depends upon both theinvestment cycle and the characteristics of the venture capital organizations. Section 4 concludes the paper.
2. The data
2.1. Constructing the sample
Our data on venture investments come from Thomson Venture Economics (Venture Economics). Thisdatabase provides information in relation to both venture capital investors and the portfolio companies inwhich they invest. Our analysis focuses on investments from 1975 to 1998, dropping information prior to 1975due to data quality concerns.2 In keeping with industry estimates of a maturation period of three to five yearsfor venture companies, we drop information after 1998 so that the outcome data can be meaningfullyinterpreted. As a result, we do not study investments made at the height of the Internet boom (1999 and 2000)or during the crash that followed.
We consider an investment to be the first time a venture capital firm invests in a particular company. Thisapproach results in a data set with multiple observations for most portfolio companies since several venturecapital firms typically invest in a company. We exclude follow-on investments by a venture capital firm in thesame portfolio company since our main interest is in the relation between public market signals and new firmformation. In addition, to ensure that we are capturing genuine venture capital firms, we limit our sample toventure firms that invested in more than three portfolio companies. Firms are included in the sample only inthe year after their investments exceed a total of three. Thus, we exclude from the sample all observations oforganizations that never made three investments or that only invested in one year. This approach could, inprinciple, introduce some survivorship bias, if, for example, the worst firms are not able to make more thanthree investments.
By applying these selection criteria, we end up with a database of 1,084 venture capital firms that invest in atotal of 13,785 companies between 1975 and 1998. This results in a sample of 32,085 observations of uniqueventure capital firm-portfolio company pairs.
2.2. Critical measures
Before we turn to an analysis of investment cycles, there are three data construction issues we need toaddress.
The first issue is how to classify venture capital industries. Our approach is to assign all investments intonine broad industry classes based on Venture Economics’ classification of the industry. The original sample ofinvestments was classified by Venture Economics into 69 separate industry segments. However, these 69
1At the same time, a substantial literature in accounting, sparked by Lev and Thiagarajan (1993), documents the relation between
fundamentals such as earnings and stock prices. More recently, Jiambalvo, Rajgopal, and Venkatachalam (2002) show that this relation is
stronger for firms with greater institutional holdings.2Gompers and Lerner (2004) discuss the coverage and selection issues in Venture Economics data prior to 1975.

ARTICLE IN PRESSP. Gompers et al. / Journal of Financial Economics 87 (2008) 1–234
industries are too narrowly defined for our purposes, as they do not correspond to lines of specializationwithin or across venture capital firms. These 69 industries are thus combined to arrive at nine broaderindustries. The industries we construct from the narrower definitions are: Internet & Computers,Communications & Electronics, Business & Industrial, Consumer, Energy, Biotechnology & Healthcare,Financial Services, Business Services, and All Others. While any industry classification is somewhat arbitrary,we believe that our classification scheme groups together businesses that are similar in technology andmanagement expertise that would make specialization in such industries meaningful. In addition, this schemereduces the subjectivity associated with classifying firms into narrower industry groupings.
Panel A of Table 1 shows the distribution across the nine broad industries. The first column gives thenumber of companies in each industry. It is no surprise that Internet & Computers is the largest industry with4,146 companies. Biotechnology & Healthcare (2,420), Communications & Electronics (2,256), and Consumer(1,882) are the next largest industries. The other industries are considerably smaller. The overall industrydistribution provides some comfort that our industry classification is meaningful. While there is variation inthe number of observations across industries, there are enough observations in each industry to make ouranalysis feasible. Throughout the analysis, we exclude the industry ‘‘All Others,’’ since this represents anagglomeration of unrelated industries in which the responses to market signals that we look for would not berelevant.
The first panel of Table 1 also reports the number of observations for each industry in our sample; there aremore observations than companies because there are multiple venture capital investors in most of thecompanies in our sample. On average, there are 2.3 venture capital investors in each company.
The second challenge has to do with the measurement of perceived investment opportunities. We use twomeasures of perceived investment opportunities in our analysis, industry Q and IPO activity. Because we donot know whether these measures overstate or understate true investment opportunities, we refer to industry Q
and IPO activity simply as ‘‘public market signals.’’The measurement of Q follows the standard approach in the investment literature. We calculate Q as the
ratio of the market value of the firm to the firm’s book value of assets, where the market value of the firm ismeasured as the book value of assets plus the market value of equity less the book value of equity. Since wecannot observe the Q of private firms that constitute the pool of potential venture capital investments, we usean estimate of Q for public companies as a proxy. However, in order to do so, we need to link the SIC codes ofpublic companies to Venture Economics industries on which our data are based. Our procedure is to identifythe SIC codes of all Venture Economics firms that went public. Because there are multiple SIC codesassociated with each of our eight industries, we construct Q as a weighted average of the industry Q of thepublic companies in those SIC codes, where the weights are the relative fractions of firms that went publicwithin the eight industries. Within the SIC code, Q is calculated by equally weighting all public companies.
Our second, less standard measure is the level of venture capital-backed IPO activity in an industry. We usethis measure for both theoretical and practical reasons. The theoretical rationale is based on the observationthat IPOs are by far the most important (and profitable) means for venture capitalists to exit an investment(Gompers and Lerner, 2004). Thus, an increase in the number of IPOs in a particular sector may makeinvesting in that sector more attractive. In addition, an increase in IPO activity may also attract more potentialentrepreneurs into a sector, thereby increasing the pool of potential investments and the likelihood that aventure capitalist will find an attractive one. The practical rationale for using IPO activity is that our Q
measure may not accurately reflect the shifts in public investors’ appetite for venture capital-backed firms bothbecause it uses data on mature public companies and because it relies on an inexact match between SIC codesand Venture Economics codes. Given the strong link between IPO activity and market valuations (Pagano,Panetta, and Zingales, 1998; Ritter and Welch, 2002), the IPO measure may actually be a better proxy for thepublic market’s perception of the types of investments in our sample.
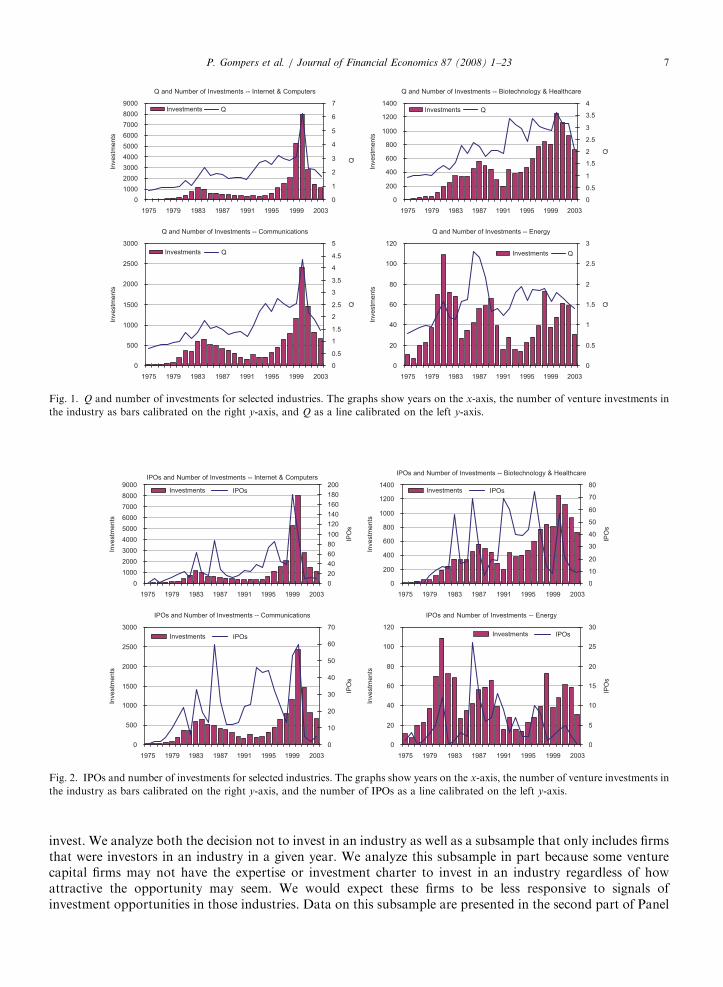
Figs. 1 and 2 depict the relation between industry venture capital investment activity and the two measuresof public market signals for four of the industries in the sample. In Internet and Computers, the correlationbetween Q and investment activity in Fig. 1 appears to be very high throughout the period. This highcorrelation can also be seen in IPO activity in Fig. 2. In other industries, the relation is less pronounced. Forinstance, in both Biotechnology & Healthcare and Energy, the number of investments climbed until 1998,while the number of IPOs peaked in 1996.

ARTICLE IN PRESS
Table 1
Sample characteristics
Panel A: Sample by industry
Industry Companies Obs.
Internet and Computers 4,146 11,148
Biotech and Healthcare 2,420 6,779
Communications and Electronics 2,256 6,412
Consumer 1,882 3,149
Business/Industrial 1,081 1,651
Energy 462 806
Financial Services 509 745
Business Services 413 577
All others 616 818
Total 13,785 32,085
Panel B: Sample characteristics
0.25 0.50 0.75 Mean s.d. N
Industry– Firm– Year Level
Overall Experience 7 15 35 29.91 40.15 81,603
Industry Experience 0 1 3 3.56 8.25 81,603
Specialization 0.00 0.04 0.18 0.11 0.16 81,603
Adjusted Overall Experience 0.27 0.55 1.26 1.00 1.22 81,603
Adjusted Industry Experience 0.00 0.29 1.31 1.00 1.82 81,563
Adjusted Non-Industry Experience 0.27 0.55 1.27 1.00 1.23 81,603
Log Adj. Experience (EXPERIENCE) �1.24 �0.57 0.23 �0.47 0.94 81,603
Log Adj. Industry Experience (INDEXP) �0.88 �0.46 0.17 �0.38 0.85 81,603
Log Adj. Non Industry Experience (NONINDEXP) �1.22 �0.56 0.23 �0.48 0.96 81,603
Industry– Firm– Year Level Conditional on One Investment in Industry-Year
Overall Experience 10 25 58 45.05 55.44 14,816
Industry Experience 1 4 12 9.67 14.74 14,816
Specialization 0.07 0.19 0.32 0.23 0.20 14,816
Adjusted Overall Experience 0.45 0.96 1.97 1.52 1.64 14,816
Adjusted Industry Experience 0.39 1.12 2.57 1.94 2.48 14,812
Adjusted Non-Industry Experience 0.41 0.92 1.95 1.48 1.65 14,816
Log Adj. Experience (EXPERIENCE) �0.7720 �0.0218 0.6893 �0.0295 0.9713 14,816
Log Adj. Industry Experience (INDEXP) �0.5664 0.0965 0.7659 0.0863 0.9508 14,816
Log Adj. Non Industry Experience (NONINDEXP) �0.8707 �0.0793 0.6542 �0.1249 1.0613 14,816
Deal-Level
Overall Experience 13 33 75 58.33 68.77 31,267
Industry Experience 3 9 22 17.25 22.71 31,267
Specialization 0.14 0.26 0.40 0.29 0.21 31,267
Adjusted Overall Experience 0.53 1.28 2.72 1.98 2.09 31,267
Adjusted Industry Experience 0.78 1.91 3.95 2.89 3.11 31,262
Adjusted Non-Industry Experience 0.39 1.07 2.44 1.76 2.02 31,267
Log Adj. Experience (EXPERIENCE) �0.60 0.23 0.97 0.18 1.02 31,267
Log Adj. Industry Experience (INDEXP) �0.20 0.53 1.20 0.48 0.97 31,267
Log Adj. Non Industry Experience (NONINDEXP) �0.77 0.12 0.89 0.02 1.16 30,294
Panel C: Sample characteristics by year
1980
Overall Experience 6 9 16 11.74 8.05 1,167
Adjusted Overall Experience 0.51 0.77 1.36 1.00 0.69 1,167
Industry Experience 0 1 2 1.19 1.90 1,167
Adjusted Industry Experience 0.00 0.39 1.38 1.00 1.61 1,167
Specialization 0.00% 1.61% 14.29% 8.84% 13.61% 1,167
P. Gompers et al. / Journal of Financial Economics 87 (2008) 1–23 5
ARTICLE IN PRESS
1985
Overall Experience 7 12 30 23.11 26.32 3,639
Adjusted Overall Experience 0.30 0.52 1.30 1.00 1.14 3,639
Industry Experience 0 1 3 2.73 5.86 3,639
Adjusted Industry Experience 0.00 0.33 1.30 1.00 1.92 3,639
Specialization 0.00% 3.66% 17.65% 11.35% 16.43% 3,639
1990
Overall Experience 8 18 40 31.88 38.73 4,876
Adjusted Overall Experience 0.25 0.56 1.25 1.00 1.21 4,876
Industry Experience 0 1 4 3.80 8.04 4,876
Adjusted Industry Experience 0.00 0.31 1.44 1.00 1.73 4,876
Specialization 0.00% 4.76% 18.31% 11.69% 16.35% 4,876
1995
Overall Experience 9 19 49 37.29 48.59 5,000
Adjusted Overall Experience 0.24 0.50 1.30 0.99 1.29 5,000
Industry Experience 0 1 4 4.49 9.91 5,000
Adjusted Industry Experience 0.00 0.26 1.28 1.00 1.81 5,000
Specialization 0.00% 4.35% 18.52% 11.77% 16.98% 5,000
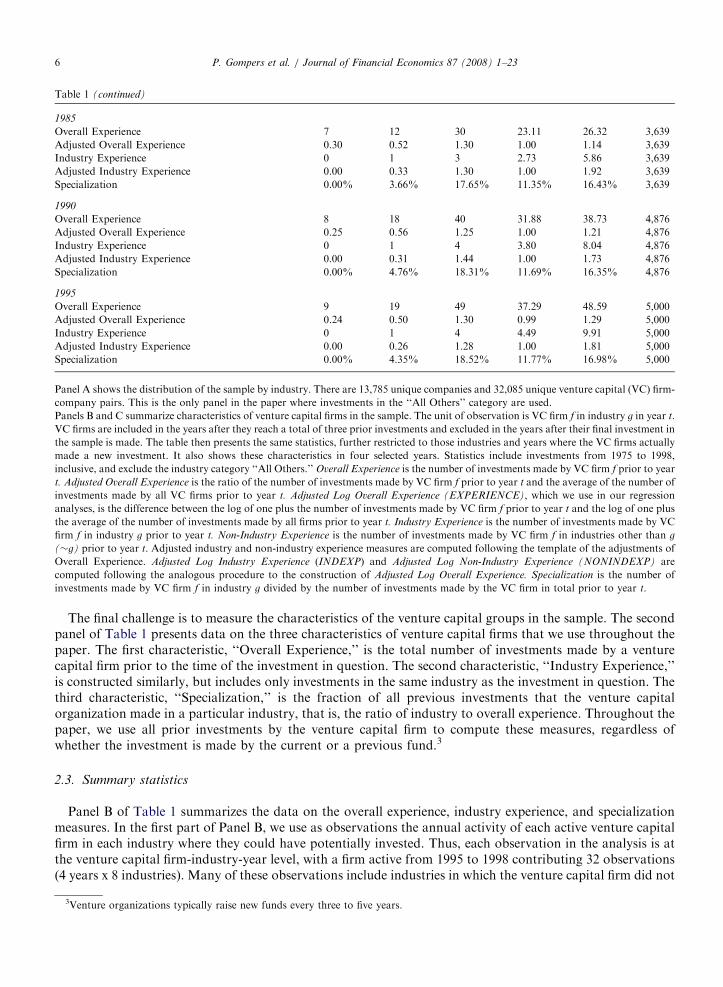
Panel A shows the distribution of the sample by industry. There are 13,785 unique companies and 32,085 unique venture capital (VC) firm-
company pairs. This is the only panel in the paper where investments in the ‘‘All Others’’ category are used.
Panels B and C summarize characteristics of venture capital firms in the sample. The unit of observation is VC firm f in industry g in year t.
VC firms are included in the years after they reach a total of three prior investments and excluded in the years after their final investment in
the sample is made. The table then presents the same statistics, further restricted to those industries and years where the VC firms actually
made a new investment. It also shows these characteristics in four selected years. Statistics include investments from 1975 to 1998,
inclusive, and exclude the industry category ‘‘All Others.’’ Overall Experience is the number of investments made by VC firm f prior to year
t. Adjusted Overall Experience is the ratio of the number of investments made by VC firm f prior to year t and the average of the number of
investments made by all VC firms prior to year t. Adjusted Log Overall Experience (EXPERIENCE), which we use in our regression
analyses, is the difference between the log of one plus the number of investments made by VC firm f prior to year t and the log of one plus
the average of the number of investments made by all firms prior to year t. Industry Experience is the number of investments made by VC
firm f in industry g prior to year t. Non-Industry Experience is the number of investments made by VC firm f in industries other than g
(�g) prior to year t. Adjusted industry and non-industry experience measures are computed following the template of the adjustments of
Overall Experience. Adjusted Log Industry Experience (INDEXP) and Adjusted Log Non-Industry Experience (NONINDEXP) are
computed following the analogous procedure to the construction of Adjusted Log Overall Experience. Specialization is the number of
investments made by VC firm f in industry g divided by the number of investments made by the VC firm in total prior to year t.
Table 1 (continued)
P. Gompers et al. / Journal of Financial Economics 87 (2008) 1–236
The final challenge is to measure the characteristics of the venture capital groups in the sample. The secondpanel of Table 1 presents data on the three characteristics of venture capital firms that we use throughout thepaper. The first characteristic, ‘‘Overall Experience,’’ is the total number of investments made by a venturecapital firm prior to the time of the investment in question. The second characteristic, ‘‘Industry Experience,’’is constructed similarly, but includes only investments in the same industry as the investment in question. Thethird characteristic, ‘‘Specialization,’’ is the fraction of all previous investments that the venture capitalorganization made in a particular industry, that is, the ratio of industry to overall experience. Throughout thepaper, we use all prior investments by the venture capital firm to compute these measures, regardless ofwhether the investment is made by the current or a previous fund.3
2.3. Summary statistics
Panel B of Table 1 summarizes the data on the overall experience, industry experience, and specializationmeasures. In the first part of Panel B, we use as observations the annual activity of each active venture capitalfirm in each industry where they could have potentially invested. Thus, each observation in the analysis is atthe venture capital firm-industry-year level, with a firm active from 1995 to 1998 contributing 32 observations(4 years x 8 industries). Many of these observations include industries in which the venture capital firm did not
3Venture organizations typically raise new funds every three to five years.
ARTICLE IN PRESS
Q and Number of Investments -- Internet & Computers
0
1000
2000
3000
4000
5000
6000
7000
8000
9000
1975 1979 1983 1987 1991 1995 1999 2003
Inve
stm
en
tsIn
vestm
en
ts
Inve
stm
en
tsIn
vestm
en
ts
0
1
2
3
4
5
6
7
Q and Number of Investments -- Biotechnology & Healthcare
0
200
400
600
800
1000
1200
1400
1975 1979 1983 1987 1991 1995 1999 2003
0
0.5
1
1.5
2
2.5
3
3.5
4
Q and Number of Investments -- Communications
0
500
1000
1500
2000
2500
3000
1975 1979 1983 1987 1991 1995 1999 2003
0
0.5
1
1.5
2
2.5
3
3.5
4
4.5
5
Investments Q Investments Q
Investments QInvestments Q
Q and Number of Investments -- Energy
0
20
40
60
80
100
120
1975 1979 1983 1987 1991 1995 1999 2003
0
0.5
1
1.5
2
2.5
3
Fig. 1. Q and number of investments for selected industries. The graphs show years on the x-axis, the number of venture investments in
the industry as bars calibrated on the right y-axis, and Q as a line calibrated on the left y-axis.
IPOs and Number of Investments -- Internet & Computers
0
1000
2000
3000
4000
5000
6000
7000
8000
9000
1975 1979 1983 1987 1991 1995 1999 2003
1975 1979 1983 1987 1991 1995 1999 2003 1975 1979 1983 1987 1991 1995 1999 2003
1975 1979 1983 1987 1991 1995 1999 2003
Investm
ents
Investments
Investm
ents
0
20
40
60
80
100
120
140
160
180
200
IPO
sIP
Os
IPO
s
IPOs Investments IPOs
Investments IPOsInvestments IPOs
IPOs and Number of Investments -- Biotechnology & Healthcare
0
200
400
600
800
1000
1200
1400
Investm
ents
IPO
s
Investm
ents
0
10
20
30
40
50
60
70
80
IPOs and Number of Investments -- Communications
0
500
1000
1500
2000
2500
3000
0
10
20
30
40
50
60
70
IPOs and Number of Investments -- Energy
0
20
40
60
80
100
120
0
5
10
15
20
25
30
Fig. 2. IPOs and number of investments for selected industries. The graphs show years on the x-axis, the number of venture investments in
the industry as bars calibrated on the right y-axis, and the number of IPOs as a line calibrated on the left y-axis.
P. Gompers et al. / Journal of Financial Economics 87 (2008) 1–23 7
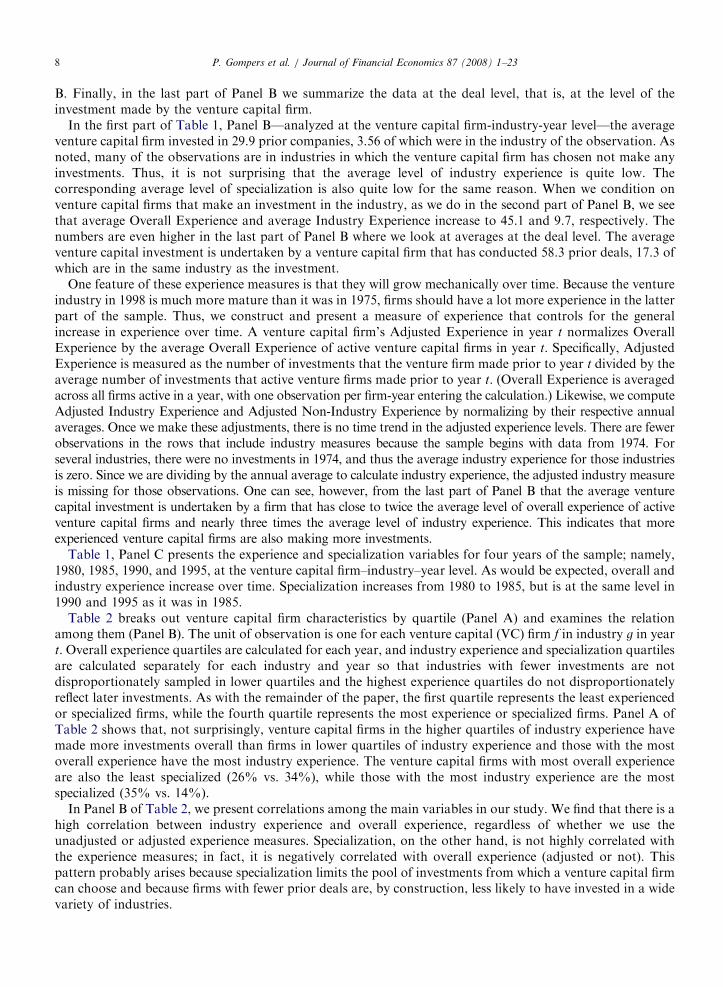
invest. We analyze both the decision not to invest in an industry as well as a subsample that only includes firmsthat were investors in an industry in a given year. We analyze this subsample in part because some venturecapital firms may not have the expertise or investment charter to invest in an industry regardless of howattractive the opportunity may seem. We would expect these firms to be less responsive to signals ofinvestment opportunities in those industries. Data on this subsample are presented in the second part of Panel
ARTICLE IN PRESSP. Gompers et al. / Journal of Financial Economics 87 (2008) 1–238
B. Finally, in the last part of Panel B we summarize the data at the deal level, that is, at the level of theinvestment made by the venture capital firm.
In the first part of Table 1, Panel B—analyzed at the venture capital firm-industry-year level—the averageventure capital firm invested in 29.9 prior companies, 3.56 of which were in the industry of the observation. Asnoted, many of the observations are in industries in which the venture capital firm has chosen not make anyinvestments. Thus, it is not surprising that the average level of industry experience is quite low. Thecorresponding average level of specialization is also quite low for the same reason. When we condition onventure capital firms that make an investment in the industry, as we do in the second part of Panel B, we seethat average Overall Experience and average Industry Experience increase to 45.1 and 9.7, respectively. Thenumbers are even higher in the last part of Panel B where we look at averages at the deal level. The averageventure capital investment is undertaken by a venture capital firm that has conducted 58.3 prior deals, 17.3 ofwhich are in the same industry as the investment.
One feature of these experience measures is that they will grow mechanically over time. Because the ventureindustry in 1998 is much more mature than it was in 1975, firms should have a lot more experience in the latterpart of the sample. Thus, we construct and present a measure of experience that controls for the generalincrease in experience over time. A venture capital firm’s Adjusted Experience in year t normalizes OverallExperience by the average Overall Experience of active venture capital firms in year t. Specifically, AdjustedExperience is measured as the number of investments that the venture firm made prior to year t divided by theaverage number of investments that active venture firms made prior to year t. (Overall Experience is averagedacross all firms active in a year, with one observation per firm-year entering the calculation.) Likewise, we computeAdjusted Industry Experience and Adjusted Non-Industry Experience by normalizing by their respective annualaverages. Once we make these adjustments, there is no time trend in the adjusted experience levels. There are fewerobservations in the rows that include industry measures because the sample begins with data from 1974. Forseveral industries, there were no investments in 1974, and thus the average industry experience for those industriesis zero. Since we are dividing by the annual average to calculate industry experience, the adjusted industry measureis missing for those observations. One can see, however, from the last part of Panel B that the average venturecapital investment is undertaken by a firm that has close to twice the average level of overall experience of activeventure capital firms and nearly three times the average level of industry experience. This indicates that moreexperienced venture capital firms are also making more investments.
Table 1, Panel C presents the experience and specialization variables for four years of the sample; namely,1980, 1985, 1990, and 1995, at the venture capital firm–industry–year level. As would be expected, overall andindustry experience increase over time. Specialization increases from 1980 to 1985, but is at the same level in1990 and 1995 as it was in 1985.
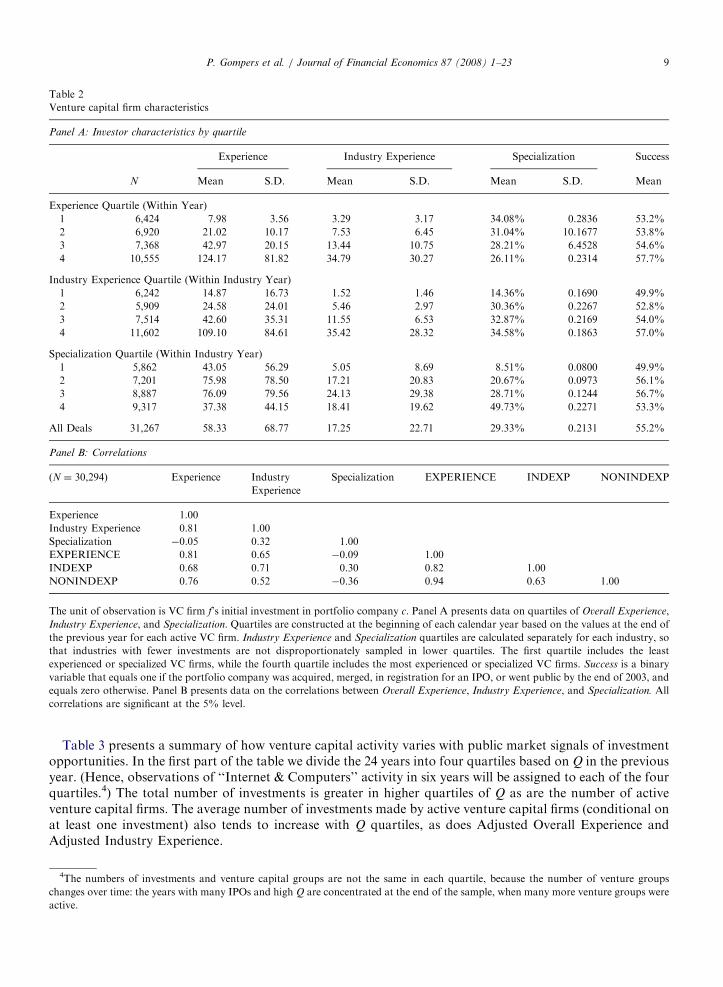
Table 2 breaks out venture capital firm characteristics by quartile (Panel A) and examines the relationamong them (Panel B). The unit of observation is one for each venture capital (VC) firm f in industry g in yeart. Overall experience quartiles are calculated for each year, and industry experience and specialization quartilesare calculated separately for each industry and year so that industries with fewer investments are notdisproportionately sampled in lower quartiles and the highest experience quartiles do not disproportionatelyreflect later investments. As with the remainder of the paper, the first quartile represents the least experiencedor specialized firms, while the fourth quartile represents the most experience or specialized firms. Panel A ofTable 2 shows that, not surprisingly, venture capital firms in the higher quartiles of industry experience havemade more investments overall than firms in lower quartiles of industry experience and those with the mostoverall experience have the most industry experience. The venture capital firms with most overall experienceare also the least specialized (26% vs. 34%), while those with the most industry experience are the mostspecialized (35% vs. 14%).
In Panel B of Table 2, we present correlations among the main variables in our study. We find that there is ahigh correlation between industry experience and overall experience, regardless of whether we use theunadjusted or adjusted experience measures. Specialization, on the other hand, is not highly correlated withthe experience measures; in fact, it is negatively correlated with overall experience (adjusted or not). Thispattern probably arises because specialization limits the pool of investments from which a venture capital firmcan choose and because firms with fewer prior deals are, by construction, less likely to have invested in a widevariety of industries.
ARTICLE IN PRESS
Table 2
Venture capital firm characteristics
Panel A: Investor characteristics by quartile
Experience Industry Experience Specialization Success
N Mean S.D. Mean S.D. Mean S.D. Mean
Experience Quartile (Within Year)
1 6,424 7.98 3.56 3.29 3.17 34.08% 0.2836 53.2%
2 6,920 21.02 10.17 7.53 6.45 31.04% 10.1677 53.8%
3 7,368 42.97 20.15 13.44 10.75 28.21% 6.4528 54.6%
4 10,555 124.17 81.82 34.79 30.27 26.11% 0.2314 57.7%
Industry Experience Quartile (Within Industry Year)
1 6,242 14.87 16.73 1.52 1.46 14.36% 0.1690 49.9%
2 5,909 24.58 24.01 5.46 2.97 30.36% 0.2267 52.8%
3 7,514 42.60 35.31 11.55 6.53 32.87% 0.2169 54.0%
4 11,602 109.10 84.61 35.42 28.32 34.58% 0.1863 57.0%
Specialization Quartile (Within Industry Year)
1 5,862 43.05 56.29 5.05 8.69 8.51% 0.0800 49.9%
2 7,201 75.98 78.50 17.21 20.83 20.67% 0.0973 56.1%
3 8,887 76.09 79.56 24.13 29.38 28.71% 0.1244 56.7%
4 9,317 37.38 44.15 18.41 19.62 49.73% 0.2271 53.3%
All Deals 31,267 58.33 68.77 17.25 22.71 29.33% 0.2131 55.2%
Panel B: Correlations
(N ¼ 30,294) Experience Industry
Experience
Specialization EXPERIENCE INDEXP NONINDEXP
Experience 1.00
Industry Experience 0.81 1.00
Specialization �0.05 0.32 1.00
EXPERIENCE 0.81 0.65 �0.09 1.00
INDEXP 0.68 0.71 0.30 0.82 1.00
NONINDEXP 0.76 0.52 �0.36 0.94 0.63 1.00
The unit of observation is VC firm f’s initial investment in portfolio company c. Panel A presents data on quartiles of Overall Experience,
Industry Experience, and Specialization. Quartiles are constructed at the beginning of each calendar year based on the values at the end of
the previous year for each active VC firm. Industry Experience and Specialization quartiles are calculated separately for each industry, so
that industries with fewer investments are not disproportionately sampled in lower quartiles. The first quartile includes the least
experienced or specialized VC firms, while the fourth quartile includes the most experienced or specialized VC firms. Success is a binary
variable that equals one if the portfolio company was acquired, merged, in registration for an IPO, or went public by the end of 2003, and
equals zero otherwise. Panel B presents data on the correlations between Overall Experience, Industry Experience, and Specialization. All
correlations are significant at the 5% level.
P. Gompers et al. / Journal of Financial Economics 87 (2008) 1–23 9
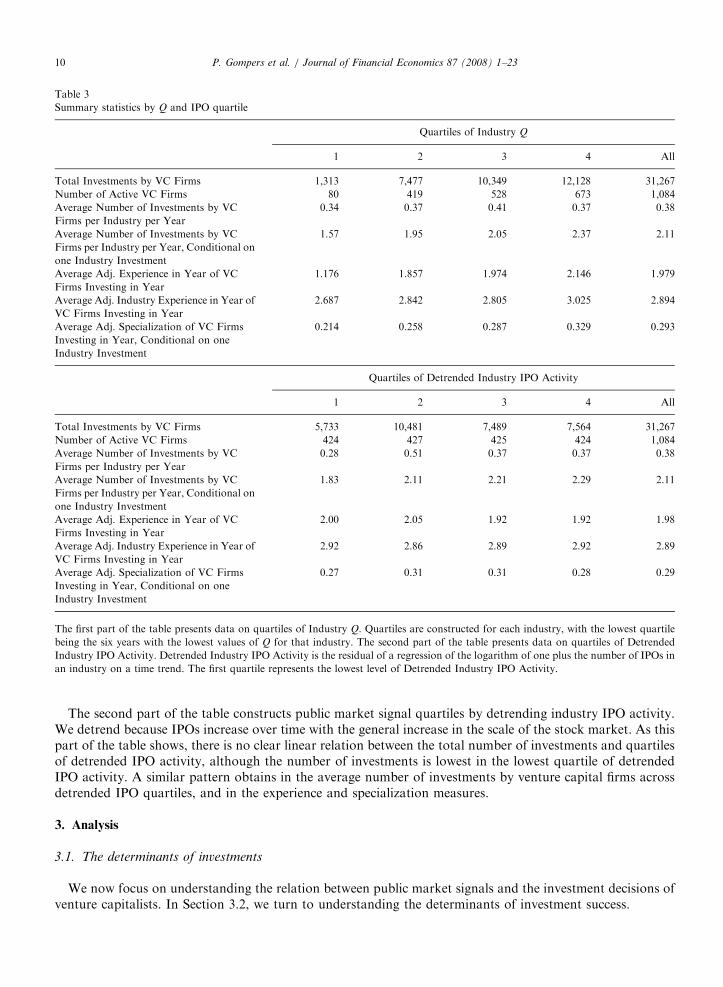
Table 3 presents a summary of how venture capital activity varies with public market signals of investmentopportunities. In the first part of the table we divide the 24 years into four quartiles based on Q in the previousyear. (Hence, observations of ‘‘Internet & Computers’’ activity in six years will be assigned to each of the fourquartiles.4) The total number of investments is greater in higher quartiles of Q as are the number of activeventure capital firms. The average number of investments made by active venture capital firms (conditional onat least one investment) also tends to increase with Q quartiles, as does Adjusted Overall Experience andAdjusted Industry Experience.
4The numbers of investments and venture capital groups are not the same in each quartile, because the number of venture groups
changes over time: the years with many IPOs and high Q are concentrated at the end of the sample, when many more venture groups were
active.
ARTICLE IN PRESS
Table 3
Summary statistics by Q and IPO quartile
Quartiles of Industry Q
1 2 3 4 All
Total Investments by VC Firms 1,313 7,477 10,349 12,128 31,267
Number of Active VC Firms 80 419 528 673 1,084
Average Number of Investments by VC
Firms per Industry per Year
0.34 0.37 0.41 0.37 0.38
Average Number of Investments by VC
Firms per Industry per Year, Conditional on
one Industry Investment
1.57 1.95 2.05 2.37 2.11
Average Adj. Experience in Year of VC
Firms Investing in Year
1.176 1.857 1.974 2.146 1.979
Average Adj. Industry Experience in Year of
VC Firms Investing in Year
2.687 2.842 2.805 3.025 2.894
Average Adj. Specialization of VC Firms
Investing in Year, Conditional on one
Industry Investment
0.214 0.258 0.287 0.329 0.293
Quartiles of Detrended Industry IPO Activity
1 2 3 4 All
Total Investments by VC Firms 5,733 10,481 7,489 7,564 31,267
Number of Active VC Firms 424 427 425 424 1,084
Average Number of Investments by VC
Firms per Industry per Year
0.28 0.51 0.37 0.37 0.38
Average Number of Investments by VC
Firms per Industry per Year, Conditional on
one Industry Investment
1.83 2.11 2.21 2.29 2.11
Average Adj. Experience in Year of VC
Firms Investing in Year
2.00 2.05 1.92 1.92 1.98
Average Adj. Industry Experience in Year of
VC Firms Investing in Year
2.92 2.86 2.89 2.92 2.89
Average Adj. Specialization of VC Firms
Investing in Year, Conditional on one
Industry Investment
0.27 0.31 0.31 0.28 0.29
The first part of the table presents data on quartiles of Industry Q. Quartiles are constructed for each industry, with the lowest quartile
being the six years with the lowest values of Q for that industry. The second part of the table presents data on quartiles of Detrended
Industry IPO Activity. Detrended Industry IPO Activity is the residual of a regression of the logarithm of one plus the number of IPOs in
an industry on a time trend. The first quartile represents the lowest level of Detrended Industry IPO Activity.
P. Gompers et al. / Journal of Financial Economics 87 (2008) 1–2310
The second part of the table constructs public market signal quartiles by detrending industry IPO activity.We detrend because IPOs increase over time with the general increase in the scale of the stock market. As thispart of the table shows, there is no clear linear relation between the total number of investments and quartilesof detrended IPO activity, although the number of investments is lowest in the lowest quartile of detrendedIPO activity. A similar pattern obtains in the average number of investments by venture capital firms acrossdetrended IPO quartiles, and in the experience and specialization measures.
3. Analysis
3.1. The determinants of investments
We now focus on understanding the relation between public market signals and the investment decisions ofventure capitalists. In Section 3.2, we turn to understanding the determinants of investment success.
ARTICLE IN PRESS
Table 4
Impact of public market signals
Dependent variable (1) Industry
Investments
(2) Industry
Investments
(3) Industry
Investments
(4) Industry
Investments
Model Panel regression Corrected for AR (1) OLS OLS
Lagged Q 0.3303 0.1717
[2.81]*** [2.11]**
Lagged IPOs 0.0417 0.0377
[0.93] [0.98]
Lagged Industry Investments 0.6416 0.6516
[12.40]*** [12.14]***
Industry Fixed Effects No No Yes Yes
Year Fixed Effects No No Yes Yes
Adj. R-squared 96.47% 96.39%
N 192 192 184 184
The sample consists of yearly observations with one observation per industry per year for 1975–1998, inclusive. The dependent variable is
the log of the number of investments made by all VC firms in industry g in year t. Lagged IPOs is the log of the number of initial public
offerings (IPOs) of venture-backed companies in industry g in year t�1. Lagged Q is the lagged average ratio of the market value of the
firm to the book value of assets for companies in the same industry. More details on the construction of this variable are provided in the
text. Industry Investments is the dependent variable. Controls in some regressions include industry and year fixed effects. Specifications 1
and 2 fit a general linear model specifying an AR (1) correlation structure for the industry panels.***, **, * Indicate statistical significance at the 1%, 5%, and 10% level, respectively.
P. Gompers et al. / Journal of Financial Economics 87 (2008) 1–23 11
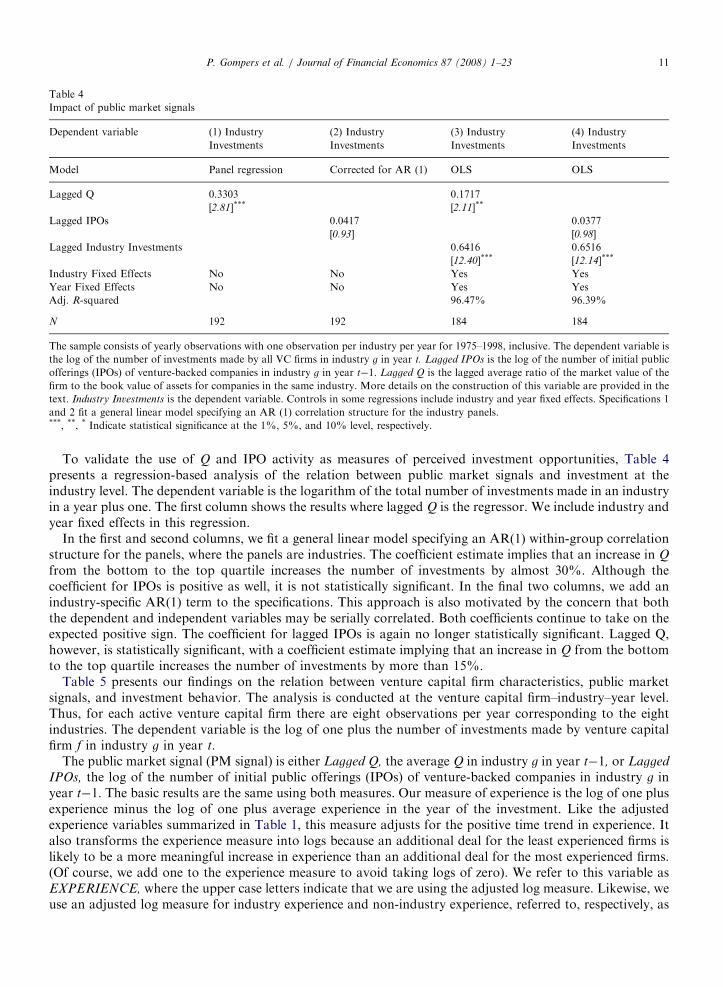
To validate the use of Q and IPO activity as measures of perceived investment opportunities, Table 4presents a regression-based analysis of the relation between public market signals and investment at theindustry level. The dependent variable is the logarithm of the total number of investments made in an industryin a year plus one. The first column shows the results where lagged Q is the regressor. We include industry andyear fixed effects in this regression.
In the first and second columns, we fit a general linear model specifying an AR(1) within-group correlationstructure for the panels, where the panels are industries. The coefficient estimate implies that an increase in Q
from the bottom to the top quartile increases the number of investments by almost 30%. Although thecoefficient for IPOs is positive as well, it is not statistically significant. In the final two columns, we add anindustry-specific AR(1) term to the specifications. This approach is also motivated by the concern that boththe dependent and independent variables may be serially correlated. Both coefficients continue to take on theexpected positive sign. The coefficient for lagged IPOs is again no longer statistically significant. Lagged Q,however, is statistically significant, with a coefficient estimate implying that an increase in Q from the bottomto the top quartile increases the number of investments by more than 15%.
Table 5 presents our findings on the relation between venture capital firm characteristics, public marketsignals, and investment behavior. The analysis is conducted at the venture capital firm–industry–year level.Thus, for each active venture capital firm there are eight observations per year corresponding to the eightindustries. The dependent variable is the log of one plus the number of investments made by venture capitalfirm f in industry g in year t.
The public market signal (PM signal) is either Lagged Q, the average Q in industry g in year t�1, or Lagged
IPOs, the log of the number of initial public offerings (IPOs) of venture-backed companies in industry g inyear t�1. The basic results are the same using both measures. Our measure of experience is the log of one plusexperience minus the log of one plus average experience in the year of the investment. Like the adjustedexperience variables summarized in Table 1, this measure adjusts for the positive time trend in experience. Italso transforms the experience measure into logs because an additional deal for the least experienced firms islikely to be a more meaningful increase in experience than an additional deal for the most experienced firms.(Of course, we add one to the experience measure to avoid taking logs of zero). We refer to this variable asEXPERIENCE, where the upper case letters indicate that we are using the adjusted log measure. Likewise, weuse an adjusted log measure for industry experience and non-industry experience, referred to, respectively, as

ARTICLE IN PRESS
Table 5
Investment patterns (no interactions)
Dependent variable
(1) Firm
Industry
Investment
(2) Firm
Industry
Investment
(3) Firm
Industry
Investment
(4) Firm
Industry
Investment
(5) Firm
Industry
Investment
(6) Firm
Industry
Investment
(7) Firm
Industry
Investment
(8) Firm
Industry
Investment
PM Measure Q Q Q Q Q Q IPOs IPOs
PM Measure 0.0430 0.0430 0.0483 0.0485 0.0430 0.0430 0.0230 0.0200
[8.94]*** [8.70]*** [9.50]*** [8.99]*** [8.94]*** [8.69]*** [11.00]*** [9.84]***
EXPERIENCE 0.0520 0.0523 0.0524
[16.04]*** [16.19]*** [16.20]***
INDEXP 0.0727 0.0852 0.0727
[19.80]*** [23.72]*** [19.85]***
NONINDEXP 0.0133 �0.0200 0.0133
[4.74]*** [8.40]*** [4.73]***
SPECIALIZATION �0.0003 0.0019 0.0019
[0.31] [2.06]** [2.12]**
Lagged Firm Industry
Invest. 0.5236 0.4897 0.4427 0.3936 0.5239 0.4877 0.4418 0.4869
[42.80]*** [47.03]*** [43.51]*** [40.17]*** [41.51]*** [45.86]*** [43.35]*** [45.74]***
Lagged Firm Non
Industry Invest. 0.0752
[28.13]***
Fixed Effects: Industry Industry Industry Industry Industry Industry Industry Industry
Year Year Year Year Year Year Year Year
Adj. R-squared 37.03% 38.19% 38.91% 40.33% 37.03% 38.20% 38.90% 38.18%
N 81,509 81,509 81,509 81,509 81,509 81,509 81,509 81,509
The unit of observation is VC firm f in industry g in year t. The dependent variable is the log of one plus the number of investments made
by VC firm f in industry g in year t. The public market measure (PM Measure) is either Lagged Q or Lagged IPOs. Lagged Q is the lagged
average ratio of the market value of the firm to the book value of assets for companies in the same industry. More details on the
construction of this variable are described in the text. Lagged IPOs is the log of one plus the number of initial public offerings (IPOs) of
venture-backed companies in industry g in year t�1, EXPERIENCE is the difference between the log of one plus the number of
investments made by VC firm f prior to year t and the log of one plus the average of the number of investments made by all firms prior to
year t. INDEXP is the difference between the log of one plus the number of investments made by VC firm f in industry g prior to year t and
the log of one plus the average of the number of investments made by all firms in industry g prior to year t. NONINDEXP is the difference
between the log of one plus the number of investments made by VC firm f outside industry g prior to year t and the log of one plus the
average of the number of investments made by all firms outside industry g prior to year t. SPECIALIZATION is the number of
investments made by VC firm f in industry g divided by the number of investments made by VC firm f in total prior to year t divided by the
average of the same figure for all VC firms in year t. Lagged Firm Industry Invest. is an AR(1) term, which is the firm’s experience in that
industry in the previous year. Similarly, Lagged Firm Industry Non Industry Invest. is the firm’s experience in all other industries in the
previous year. Regressions include industry and year fixed effects. T-statistics in italics below coefficient estimates are based on robust
errors allowing for data clustering by VC firm.***, **, * Indicate statistical significance at the 1%, 5%, and 10% level, respectively.
P. Gompers et al. / Journal of Financial Economics 87 (2008) 1–2312
INDEXP and NONINDEXP. Each specification includes Lagged Firm Industry Investments, an AR(1) termthat is the number of investments made by venture capital firm f in industry g in year t�1. This term adjustsfor autocorrelation, and is also interesting in its own right as it is the firm’s most recent industry experience.Finally, the specialization variable we use in the regressions is adjusted for industry and year effects. Thus, ouradjusted specialization variable subtracts the average level of specialization in an industry and year. Wecall this adjusted specialization variable SPECIALIZATION. These variables are summarized in Panel B ofTable 1.
In all specifications, we include both industry and year fixed effects. The t-statistics are given in italics belowthe coefficient estimates and are based on robust errors allowing for data clustering by venture capitalorganization.
The first column of Table 5 repeats the industry-level regression in Table 4, with the unit of observationbeing VC firm f in industry g in year t. Not surprisingly, the regression indicates that venture capital firms tend
ARTICLE IN PRESSP. Gompers et al. / Journal of Financial Economics 87 (2008) 1–23 13
to increase their investments in years and industries in which lagged Q is high. The coefficient of 0.043, whichis statistically significant, implies that an increase in IPO activity from the 25th percentile to the 75th percentileboosts the venture capital firm’s investment activity in the industry by 3.8%. As the second column of Table 5indicates, there is also a strong positive relation between EXPERIENCE and investment activity. Thecoefficient estimate indicates that at the 75th percentile of EXPERIENCE venture capital firms invest 16%more than at the 25th percentile of EXPERIENCE. The third column breaks out EXPERIENCE intoINDEXP (our adjusted log industry experience variable) and NONINDEXP (our adjusted non-industry logexperience variable). The regression indicates that what drives the relation with EXPERIENCE is actually thecomponent that is related to INDEXP. Prior investment activity outside the industry has a much weakerrelation with within-industry investment activity. The average venture capital firm in the highest quartile ofindustry experience (that is, at the 75th percentile) invests 7.6% more in the industry than a firm in the lowestquartile (at the 25th percentile) of industry experience.5 This difference is understated since it excludes theimpact of the pervious year’s industry experience (the AR(1) term), which has a coefficient of 0.44.
Column 4 adds Lagged Firm Non-Industry Investments, which is the number of investments made by venturecapital firm f in industries other than g in year t�1. Since the firm’s most recent investing experience is highlyrelevant to investments, this measure parallels the AR(1) term but includes only the previous year’s number ofinvestments in other industries. Industry experience continues to be positively related to industry investmentactivity and non-industry experience has a statistically significant negative relation with industry investment.Comparing the coefficients on the previous year’s investments, the effect of industry experience is almost fivetimes that of non-industry experience.
Columns 5 and 6 of Table 5 add industry specialization to the regressions. In column 5, there is no relationbetween future investment in an industry and specialization. Once we control for experience (recall thatspecialized firms tend to be less experienced), however, we observe a significant (if modest) pattern: the resultsin column 6 indicate that an organization in the top industry specialization quartile makes 0.25% moreinvestments in the industry than one in the bottom quartile. Finally, the last two columns of Table 5 replicatethe results in columns 3 and 6 using IPO activity rather than Q as the measure of the public market. The basicpatterns continue to hold in these regressions, and the magnitude of the effects is similar.
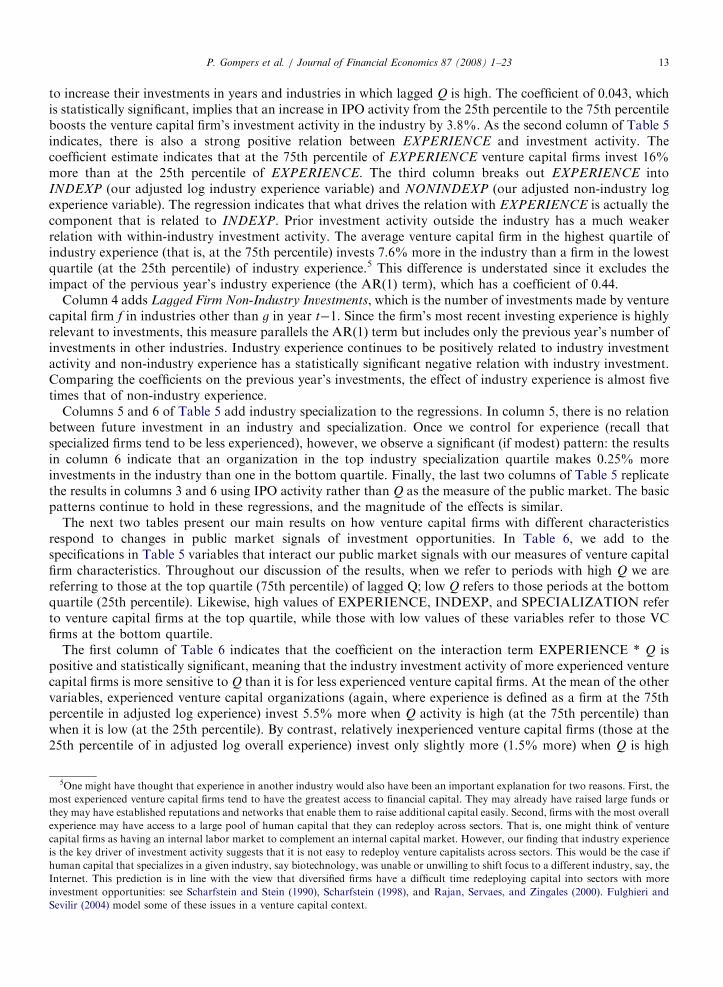
The next two tables present our main results on how venture capital firms with different characteristicsrespond to changes in public market signals of investment opportunities. In Table 6, we add to thespecifications in Table 5 variables that interact our public market signals with our measures of venture capitalfirm characteristics. Throughout our discussion of the results, when we refer to periods with high Q we arereferring to those at the top quartile (75th percentile) of lagged Q; low Q refers to those periods at the bottomquartile (25th percentile). Likewise, high values of EXPERIENCE, INDEXP, and SPECIALIZATION referto venture capital firms at the top quartile, while those with low values of these variables refer to those VCfirms at the bottom quartile.
The first column of Table 6 indicates that the coefficient on the interaction term EXPERIENCE * Q ispositive and statistically significant, meaning that the industry investment activity of more experienced venturecapital firms is more sensitive to Q than it is for less experienced venture capital firms. At the mean of the othervariables, experienced venture capital organizations (again, where experience is defined as a firm at the 75thpercentile in adjusted log experience) invest 5.5% more when Q activity is high (at the 75th percentile) thanwhen it is low (at the 25th percentile). By contrast, relatively inexperienced venture capital firms (those at the25th percentile of in adjusted log overall experience) invest only slightly more (1.5% more) when Q is high
5One might have thought that experience in another industry would also have been an important explanation for two reasons. First, the
most experienced venture capital firms tend to have the greatest access to financial capital. They may already have raised large funds or
they may have established reputations and networks that enable them to raise additional capital easily. Second, firms with the most overall
experience may have access to a large pool of human capital that they can redeploy across sectors. That is, one might think of venture
capital firms as having an internal labor market to complement an internal capital market. However, our finding that industry experience
is the key driver of investment activity suggests that it is not easy to redeploy venture capitalists across sectors. This would be the case if
human capital that specializes in a given industry, say biotechnology, was unable or unwilling to shift focus to a different industry, say, the
Internet. This prediction is in line with the view that diversified firms have a difficult time redeploying capital into sectors with more
investment opportunities: see Scharfstein and Stein (1990), Scharfstein (1998), and Rajan, Servaes, and Zingales (2000). Fulghieri and
Sevilir (2004) model some of these issues in a venture capital context.
ARTIC
LEIN
PRES
STable 6
Investment patterns (includes interactions of IPOs)
Dependent variable (1) Firm
Industry
Investment
(2) Firm
Industry
Investment
(3) Firm
Industry
Investment
(4) Firm
Industry
Investmen
(5) Firm
Industry
Investment
(6) Firm
Industry
Investment
(7) Firm
Industry
Investment
(8) Firm
Industry
Investment
(9) Firm
Industry
Investment
PM Measure Q Q Q Q Q Q Q IPOs IPOs
PM Measure 0.0611 0.0709 0.0531 0.0672 0.0715 0.0297 0.0466 0.0346 0.0274
[10.05]*** [10.85]*** [9.18]*** [10.04]*** [10.39]*** [5.89]*** [7.48]*** [12.58]*** [9.74]***
EXPERIENCE �0.0115 �0.0119 �0.0250
[1.58] [1.62] [5.35]***
INDEXP �0.0012 �0.0252 �0.0120 �0.0405
[0.15] [2.95]*** [1.45] [5.86]***
NONINDEXP 0.0109 0.0396 �0.0090 0.0157
[1.52] [5.42]*** [1.22] [3.60]***
SPECIALIZATION �0.0218 �0.0220 �0.0124
[6.17]*** [6.30]*** [6.11]***
EXPERIENCE * 0.0340 0.0345 0.0308
PM Measure [7.62]*** [7.71]*** [12.30]***
INDEXP * 0.0416 0.0495 0.0490 0.0385
PM Measure [9.57]*** [11.63]*** [11.50]*** [15.09]***
NONINDEXP * 0.0165 �0.0139 �0.0060 �0.0004
PM Measure [3.65]*** [3.26]*** [1.40] [0.18]
SPECIALIZATION * 0.0133 0.0148*** 0.0081***
PM Measure [6.32]*** [7.10] [7.50]
Lagged Firm Industry 0.4871 0.4403 0.5035 0.4429 0.3934 0.5222 0.4828 0.4352 0.4683
Investments [48.12]*** [44.10]*** [47.75]*** [43.75]*** [40.75]*** [41.17]*** [46.71]*** [43.64]*** [46.49]***
Lagged Firm Non 0.0762
Nonindustry Invest. [28.21]***
Controls: Industry
Year
Industry
Year
Industry
Year
Industry
Year
Industry
Year
Industry
Year
Industry
Year
Industry
Year
Industry
Year
Adj. R-squared 38.37% 39.11% 37.91% 39.20% 40.65% 37.10% 38.47% 39.37% 38.75%
N 81,509 81,509 81,509 81,509 81,509 81,509 81,509 81,509 81,509
The unit of observation is VC firm f in industry g in year t. The dependent variable is the log of one plus the number of investments made by VC firm f in industry g in year t. The public
market measure (PMMeasure) is either Lagged Q or Lagged IPOs. Lagged Q is the lagged average ratio of the market value of the firm to the book value of assets for companies in the
same industry. More details on the construction of this variable are described in the text. Lagged IPOs is the log of one plus the number of initial public offerings (IPOs) of venture-
backed companies in industry g in year t�1. EXPERIENCE is the difference between the log of one plus the number of investments made by VC firm f prior to year t and the log of one
plus the average of the number of investments made by all firms prior to year t. INDEXP is the difference between the log of one plus the number of investments made by VC firm f in
industry g prior to year t and the log of one plus the average of the number of investments made by all firms in industry g prior to year t. NONINDEXP is the difference between the log
of one plus the number of investments made by VC firm f outside industry g prior to year t and the log of one plus the average of the number of investments made by all firms outside
industry g prior to year t. SPECIALIZATION is the number of investments made by VC firm f in industry g divided by the number of investments made by VC firm f in total prior to
year t divided by the average of the same figure for all VC firms in year t. Lagged Firm Industry Invest. is an AR(1) term, which is the firm’s experience in that industry in the previous
year. Similarly, Lagged Firm Industry Non Industry Invest. is the firm’s experience in all other industries in the previous year. Regressions include industry and year fixed effects. T-
statistics in italics below coefficient estimates are based on robust errors allowing for data clustering by VC firm.***, **, * Indicate statistical significance at the 1%, 5%, and 10% level, respectively.
P.
Go
mp
erset
al.
/J
ou
rna
lo
fF
ina
ncia
lE
con
om
ics8
7(
20
08
)1
–2
314
ARTICLE IN PRESSP. Gompers et al. / Journal of Financial Economics 87 (2008) 1–23 15
than when it is low. The results also indicate that EXPERIENCE increases the level of investment, not just thesensitivity of investment to Q.
In columns 2–4, we repeat the analysis, but decompose EXPERIENCE into its industry and non-industrycomponents. The results in column 2 indicate that more industry-experienced venture capital firms invest6.2% more when Q is high than when it is low. By contrast, less industry-experienced venture capital firmsinvest 2.7% more. When both experience measures are included, the investment of more industry-experiencedfirms continues to be more sensitive to Q than is the investment of less industry-experienced firms. Experienceoutside the industry appears to reduce the sensitivity to industry Q as implied by the negative coefficient of theinteraction term NONINDEXP * Q.
The fifth column again adds a term with the previous year’s non-industry experience to the specification.The cumulative impact of industry and non-industry experience is muted by the fact that much of the relevantexperience is captured by the previous year’s experience. When Q is high, industry-experienced venture capitalfirms with relatively low experience out of the industry invest 2.0% more than when it is low, while venturecapital firms with high experience out of the industry, but low experience within the industry, invest only 0.8%more when Q is high. Again, these differences are much greater including the impact of the previous year’sindustry and non-industry experience.
The sixth and seventh columns of Table 6 look at the effect of industry specialization on investmentbehavior. Consistent with our findings about industry experience, we find that more specialized venture capitalfirms tend to increase their industry investments by more than less specialized firms when Q increases. Theeffect, however, is small in column 6, implying an increase in investment by 3.8% for specialized firms and2.4% for less specialized firms. When overall experience and specialization are used in column 7, bothinteractions terms continue to be economically and statistically significant.
Finally, the last two columns in Table 6 report the results using IPO activity as an alternative public marketmeasure. Those columns replicate the basic findings in columns 4 and 7 of the table. The magnitude of theeffects is similar to those estimated using Q.
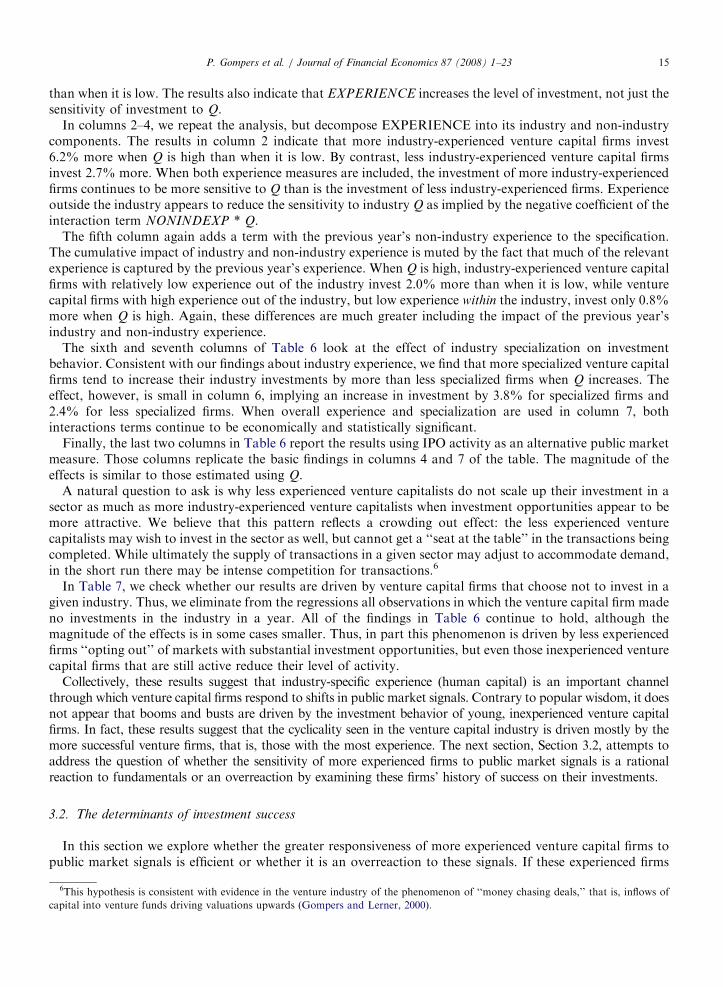
A natural question to ask is why less experienced venture capitalists do not scale up their investment in asector as much as more industry-experienced venture capitalists when investment opportunities appear to bemore attractive. We believe that this pattern reflects a crowding out effect: the less experienced venturecapitalists may wish to invest in the sector as well, but cannot get a ‘‘seat at the table’’ in the transactions beingcompleted. While ultimately the supply of transactions in a given sector may adjust to accommodate demand,in the short run there may be intense competition for transactions.6
In Table 7, we check whether our results are driven by venture capital firms that choose not to invest in agiven industry. Thus, we eliminate from the regressions all observations in which the venture capital firm madeno investments in the industry in a year. All of the findings in Table 6 continue to hold, although themagnitude of the effects is in some cases smaller. Thus, in part this phenomenon is driven by less experiencedfirms ‘‘opting out’’ of markets with substantial investment opportunities, but even those inexperienced venturecapital firms that are still active reduce their level of activity.
Collectively, these results suggest that industry-specific experience (human capital) is an important channelthrough which venture capital firms respond to shifts in public market signals. Contrary to popular wisdom, it doesnot appear that booms and busts are driven by the investment behavior of young, inexperienced venture capitalfirms. In fact, these results suggest that the cyclicality seen in the venture capital industry is driven mostly by themore successful venture firms, that is, those with the most experience. The next section, Section 3.2, attempts toaddress the question of whether the sensitivity of more experienced firms to public market signals is a rationalreaction to fundamentals or an overreaction by examining these firms’ history of success on their investments.
3.2. The determinants of investment success
In this section we explore whether the greater responsiveness of more experienced venture capital firms topublic market signals is efficient or whether it is an overreaction to these signals. If these experienced firms
6This hypothesis is consistent with evidence in the venture industry of the phenomenon of ‘‘money chasing deals,’’ that is, inflows of
capital into venture funds driving valuations upwards (Gompers and Lerner, 2000).
ARTIC
LEIN
PRES
STable 7
Investment patterns for organizations that made investments in that industry in that year
Dependent variable (1) Firm
Industry
Investment
(2) Firm
Industry
Investment
(3) Firm
Industry
Investment
(4) Firm
Industry
Investment
(5) Firm
Industry
Investment
(6) Firm
Industry
Investment
(7) Firm
Industry
Investment
(8) Firm
Industry
Investment
(9) Firm
Industry
Investment
(40) (40) (40) (40) (40) (40) (40) (40) (40)
PM Measure Q Q Q Q Q Q Q IPOs IPOs
PM Measure 0.1432 0.1473 0.1415 0.1410 0.1505 0.1134 0.1130 0.0662 0.0542
[10.94]*** [11.57]*** [10.75]*** [10.97]*** [11.57]*** [8.63]*** [8.50]*** [9.95] [7.82]***
EXPERIENCE 0.0151 0.0121 0.0095
[0.92] [0.73] [0.65]
INDEXP �0.0018 �0.0396 �0.0210 �0.0287
[0.10] [2.35]** [1.26] [1.78]
NONINDEXP 0.0360 0.0604 0.0062 0.0438
[2.51]** [4.24]*** [0.46] [3.36]
SPECIALIZATION �0.0224 �0.0309 �0.0096
[3.71]*** [5.36]*** [2.72]***
EXPERIENCE * 0.0248 0.0301 0.0204
PM Measure [3.13]*** [3.68]*** [4.16]***
INDEXP * 0.0409 0.0547 0.0554 0.0318
PM Measure [4.92]*** [6.70]*** [6.86]*** [6.15]
NONINDEXP * 0.0054 �0.0229 �0.0168 �0.0100
PM Measure [0.79] [3.48]*** [2.60]*** [2.37]
SPECIALIZATION * 0.0155 0.0274 0.0107
PM Measure [3.75]*** [6.95]*** [6.23]***
Lagged Firm Ind. 0.2727 0.2403 0.2907 0.2435 0.2068 0.3041 0.2557 0.2430 0.2536
Invest [26.82]*** [23.21]*** [27.28]*** [22.56]*** [21.59]*** [22.30]*** [23.44]*** [22.49] [23.37]***
Lagged Firm 0.0753
Nonindustry Invest. [10.24]***
Fixed Effects: Industry Industry Industry Industry Industry Industry Industry Industry Industry
Year Year Year Year Year Year Year Year Year
Adj. R-squared 33.28% 33.82% 32.56% 33.96% 35.04% 31.47% 33.73% 33.61% 33.46%
N 14,795 14,795 14,795 14,795 14,795 14,795 14,795 14,795 14,795
The unit of observation is VC firm f in industry g in year t conditional on the VC firm making at least one investment in the industry. The dependent variable is the log of one plus the
number of investments made by VC firm f in industry g in year t. The public market measure (PMMeasure) is either Lagged Q or Lagged IPOs. Lagged Q is the lagged average ratio of
the market value of the firm to the book value of assets for companies in the same industry. More details on the construction of this variable are described in the text. Lagged IPOs is
the log of one plus the number of initial public offerings (IPOs) of venture-backed companies in industry g in year t�1. EXPERIENCE is the difference between the log of one plus the
number of investments made by VC firm f prior to year t and the log of one plus the average of the number of investments made by all firms prior to year t. INDEXP is the difference
between the log of one plus the number of investments made by VC firm f in industry g prior to year t and the log of one plus the average of the number of investments made by all
firms in industry g prior to year t. NONINDEXP is the difference between the log of one plus the number of investments made by VC firm f outside industry g prior to year t and the
log of one plus the average of the number of investments made by all firms outside industry g prior to year t. SPECIALIZATION is the number of investments made by VC firm f in
industry g divided by the number of investments made by VC firm f in total prior to year t divided by the average of the same figure for all VC firms in year t. Lagged Firm Industry
Invest. is an AR(1) term, which is the firm’s experience in that industry in the previous year. Similarly, Lagged Firm Industry Non Industry Invest. is the firm’s experience in all other
industries in the previous year. Regressions include industry and year fixed effects. T-statistics in italics below coefficient estimates are based on robust errors allowing for data
clustering by VC firm.***, **, * Indicate statistical significance at the 1%, 5%, and 10% level, respectively.
P.
Go
mp
erset
al.
/J
ou
rna
lo
fF
ina
ncia
lE
con
om
ics8
7(
20
08
)1
–2
316

ARTICLE IN PRESSP. Gompers et al. / Journal of Financial Economics 87 (2008) 1–23 17
ramp up the number of investments they make in response to public market signals, but suffer a significantdegradation of performance on these investments, their response may, in fact, be an overreaction. In additionto the practitioner accounts alluded to above, there are at least two reasons to believe this might be the case.First, Baker, Stein, and Wurgler (2003) show that industrial firms whose investment is most sensitive to Q havethe lowest subsequent stock returns following periods of heavy investment. A similar effect might be observedamong experienced venture capital firms whose investment is most sensitive to Q and IPO activity. Second, atthe same time that venture capital firms are buying equity in portfolio companies, these companies are, ofcourse, issuing equity. We know from numerous studies, including Loughran and Ritter (1995), that whenfirms (albeit public firms) issue equity, their subsequent stock returns are abnormally low.
To assess this question, we examine the performance of the companies in which the venture capital firmsinvest. Ideally, one would have data on the actual returns on the venture capital firm’s investment.Unfortunately, the best we can do is to determine whether the investment resulted in what would appear to bea profitable exit for the venture capital firm. This is most likely the case if the company went public, registeredfor an IPO (as of the date we collected the data from Venture Economics), or was acquired or merged. VentureEconomics does not collect valuation information for all of the companies that were merged or acquired and itis possible that these outcomes are not as lucrative as those where the company exited with a public offering.However, we characterize these as successes because they are likely to have generated higher returns thaninvestments in which there has not been an exit or the firm has been shut down. (We also repeat the analysisbelow eliminating acquisitions in order to avoid these ambiguities.)
The final column of Table 2 provides some initial indications of the patterns of success by venture capitalfirm characteristics. The tabulations suggest that investments made by venture capital firms with moreoverall—and especially more industry-specific—experience are more successful. The patterns with specializa-tion are not monotonic, with the most and least specialized venture capital firms appearing to be the poorestperformers. However, one must be cautious in interpreting these univariate relations given the lack of controlsfor industry, time period, and (in the specialization analysis) experience.
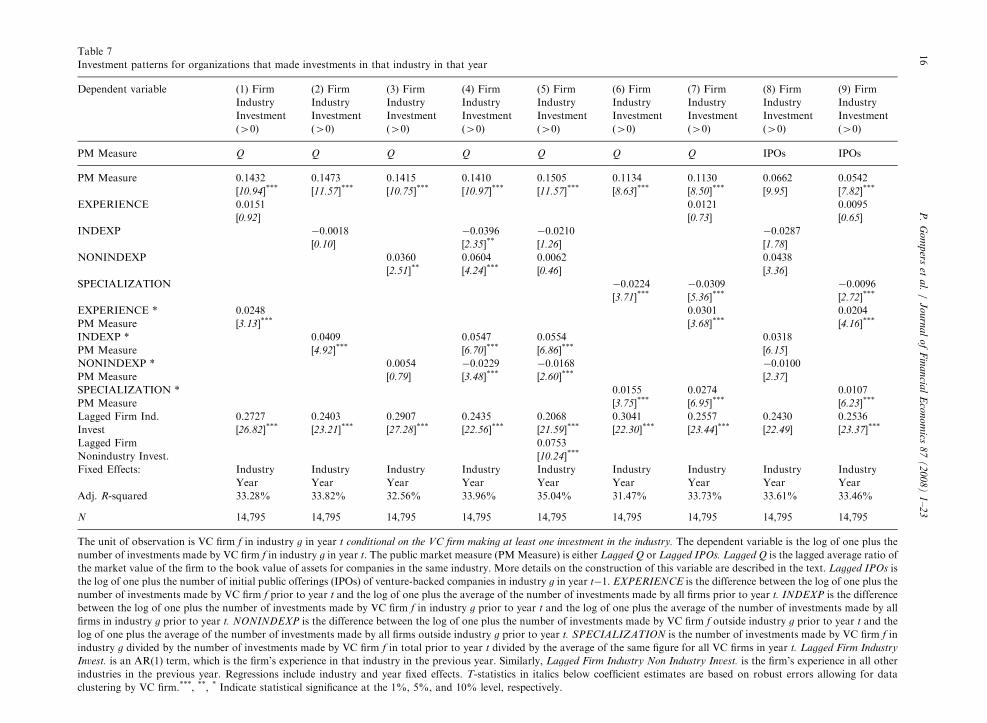
Tables 8 and 9 examine the determinants of success in a regression framework. The dependent variable is adummy variable, which equals one if the company was successful before the end of 2003. In addition to theindustry and year controls used earlier, we also control for the stage of the company and the financing roundat the time of the investment, since more mature firms are closer to an exit. As in our previous regressions, weexclude observations after 1998 in order for the outcomes of the investments to be meaningful. Here we aredoing the analysis at the deal level. Because there are multiple observations for each portfolio company in thesample (due to the fact that multiple venture capital firms invest in the company), we calculate robust standarderrors by clustering at the company level. In the discussion below, we define the high and low levels ofEXPERIENCE, INDEXP, NONINDEXP, and SPECIALIZATION as the quartiles based on values that areon the 25th and 75th percentiles, where the unit of observation is VC firm f’s initial investment in portfoliocompany c.
The first column of Table 8 suggests there is no statistically significant relation between success and Q in thesample as a whole. The second column of Table 8 indicates that more experienced venture capital firms aremore likely to make successful investments. However, the third and fourth columns show that the effect ofexperience is limited to venture capital firms with industry experience. Investments made by venture capitalistswith the top-quartile industry experience are 3% more likely to succeed than those made by the venturecapitalists at the 25th percentile. Given a baseline success rate of 55%, this amounts to a fairly significantincrease in the probability of success. In the regressions with industry specialization in columns 5 and 6,experience remains a critical determinant of success. Columns 7 and 8 replicate the results using IPO activityas our measure of the public market signal and report results of similar statistical significance and economicmagnitude. Column 9 shows that the results are similar when denoting only IPOs as successful outcomes.
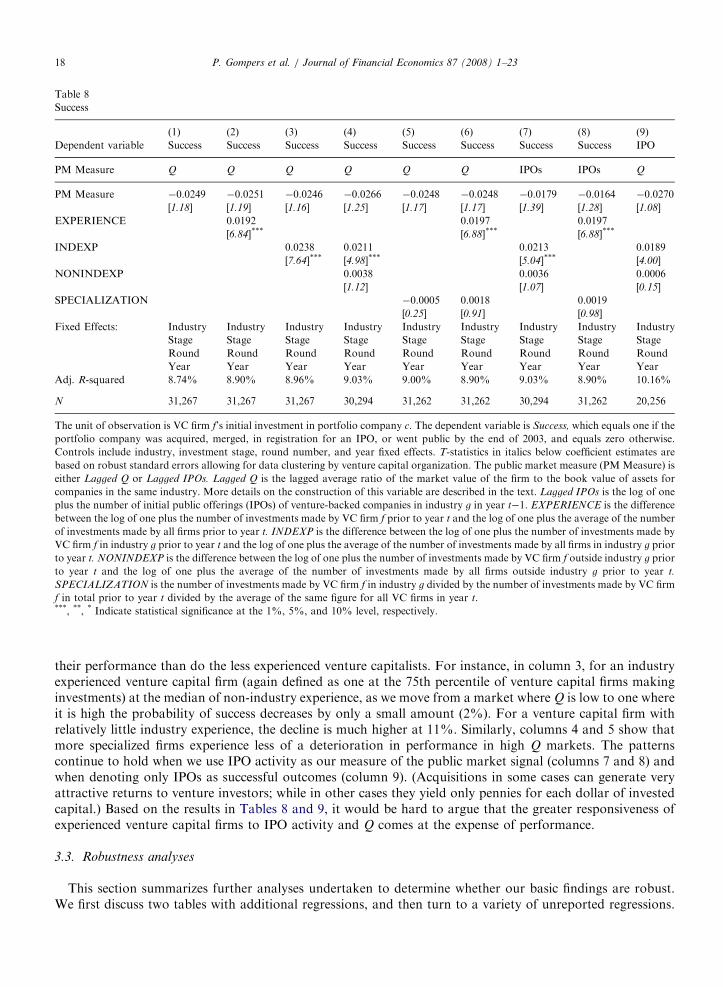
Table 8 makes clear that venture capital firms with industry experience do not perform worse, on average, asa result of being more sensitive to shifts in public market activities. Table 9 digs deeper by investigatingwhether experienced venture capital firms perform worse on the investments they make when industry Q andIPO activity are high. The results indicate that just the opposite is true. Overall, venture capital firms dosomewhat worse on the investments they make when Q and IPO activity are high, although the estimatedeffect is statistically insignificant. However, the more experienced venture capitalists exhibit less degradation in
ARTICLE IN PRESS
Table 8
Success
(1) (2) (3) (4) (5) (6) (7) (8) (9)
Dependent variable Success Success Success Success Success Success Success Success IPO
PM Measure Q Q Q Q Q Q IPOs IPOs Q
PM Measure �0.0249 �0.0251 �0.0246 �0.0266 �0.0248 �0.0248 �0.0179 �0.0164 �0.0270
[1.18] [1.19] [1.16] [1.25] [1.17] [1.17] [1.39] [1.28] [1.08]
EXPERIENCE 0.0192 0.0197 0.0197
[6.84]*** [6.88]*** [6.88]***
INDEXP 0.0238 0.0211 0.0213 0.0189
[7.64]*** [4.98]*** [5.04]*** [4.00]
NONINDEXP 0.0038 0.0036 0.0006
[1.12] [1.07] [0.15]
SPECIALIZATION �0.0005 0.0018 0.0019
[0.25] [0.91] [0.98]
Fixed Effects: Industry Industry Industry Industry Industry Industry Industry Industry Industry
Stage Stage Stage Stage Stage Stage Stage Stage Stage
Round Round Round Round Round Round Round Round Round
Year Year Year Year Year Year Year Year Year
Adj. R-squared 8.74% 8.90% 8.96% 9.03% 9.00% 8.90% 9.03% 8.90% 10.16%
N 31,267 31,267 31,267 30,294 31,262 31,262 30,294 31,262 20,256
The unit of observation is VC firm f’s initial investment in portfolio company c. The dependent variable is Success, which equals one if the
portfolio company was acquired, merged, in registration for an IPO, or went public by the end of 2003, and equals zero otherwise.
Controls include industry, investment stage, round number, and year fixed effects. T-statistics in italics below coefficient estimates are
based on robust standard errors allowing for data clustering by venture capital organization. The public market measure (PM Measure) is
either Lagged Q or Lagged IPOs. Lagged Q is the lagged average ratio of the market value of the firm to the book value of assets for
companies in the same industry. More details on the construction of this variable are described in the text. Lagged IPOs is the log of one
plus the number of initial public offerings (IPOs) of venture-backed companies in industry g in year t�1. EXPERIENCE is the difference
between the log of one plus the number of investments made by VC firm f prior to year t and the log of one plus the average of the number
of investments made by all firms prior to year t. INDEXP is the difference between the log of one plus the number of investments made by
VC firm f in industry g prior to year t and the log of one plus the average of the number of investments made by all firms in industry g prior
to year t. NONINDEXP is the difference between the log of one plus the number of investments made by VC firm f outside industry g prior
to year t and the log of one plus the average of the number of investments made by all firms outside industry g prior to year t.
SPECIALIZATION is the number of investments made by VC firm f in industry g divided by the number of investments made by VC firm
f in total prior to year t divided by the average of the same figure for all VC firms in year t.***, **, * Indicate statistical significance at the 1%, 5%, and 10% level, respectively.
P. Gompers et al. / Journal of Financial Economics 87 (2008) 1–2318
their performance than do the less experienced venture capitalists. For instance, in column 3, for an industryexperienced venture capital firm (again defined as one at the 75th percentile of venture capital firms makinginvestments) at the median of non-industry experience, as we move from a market where Q is low to one whereit is high the probability of success decreases by only a small amount (2%). For a venture capital firm withrelatively little industry experience, the decline is much higher at 11%. Similarly, columns 4 and 5 show thatmore specialized firms experience less of a deterioration in performance in high Q markets. The patternscontinue to hold when we use IPO activity as our measure of the public market signal (columns 7 and 8) andwhen denoting only IPOs as successful outcomes (column 9). (Acquisitions in some cases can generate veryattractive returns to venture investors; while in other cases they yield only pennies for each dollar of investedcapital.) Based on the results in Tables 8 and 9, it would be hard to argue that the greater responsiveness ofexperienced venture capital firms to IPO activity and Q comes at the expense of performance.
3.3. Robustness analyses
This section summarizes further analyses undertaken to determine whether our basic findings are robust.We first discuss two tables with additional regressions, and then turn to a variety of unreported regressions.
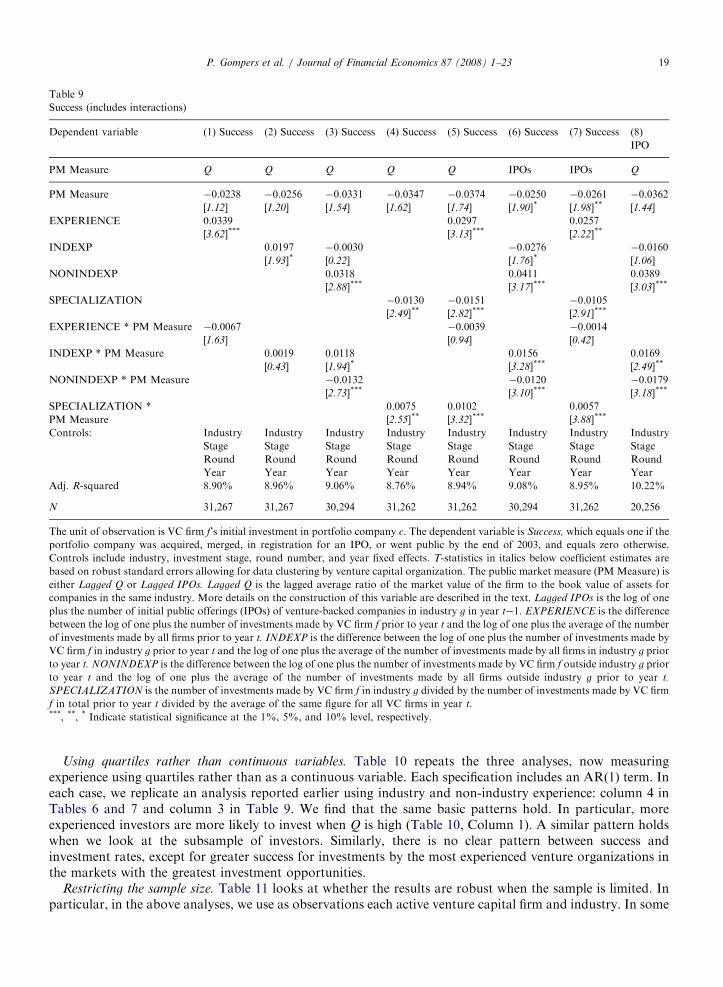
ARTICLE IN PRESS
Table 9
Success (includes interactions)
Dependent variable (1) Success (2) Success (3) Success (4) Success (5) Success (6) Success (7) Success (8)
IPO
PM Measure Q Q Q Q Q IPOs IPOs Q
PM Measure �0.0238 �0.0256 �0.0331 �0.0347 �0.0374 �0.0250 �0.0261 �0.0362
[1.12] [1.20] [1.54] [1.62] [1.74] [1.90]* [1.98]** [1.44]
EXPERIENCE 0.0339 0.0297 0.0257
[3.62]*** [3.13]*** [2.22]**
INDEXP 0.0197 �0.0030 �0.0276 �0.0160
[1.93]* [0.22] [1.76]* [1.06]
NONINDEXP 0.0318 0.0411 0.0389
[2.88]*** [3.17]*** [3.03]***
SPECIALIZATION �0.0130 �0.0151 �0.0105
[2.49]** [2.82]*** [2.91]***
EXPERIENCE * PM Measure �0.0067 �0.0039 �0.0014
[1.63] [0.94] [0.42]
INDEXP * PM Measure 0.0019 0.0118 0.0156 0.0169
[0.43] [1.94]* [3.28]*** [2.49]**
NONINDEXP * PM Measure �0.0132 �0.0120 �0.0179
[2.73]*** [3.10]*** [3.18]***
SPECIALIZATION *
PM Measure
0.0075 0.0102 0.0057
[2.55]** [3.32]*** [3.88]***
Controls: Industry Industry Industry Industry Industry Industry Industry Industry
Stage Stage Stage Stage Stage Stage Stage Stage
Round Round Round Round Round Round Round Round
Year Year Year Year Year Year Year Year
Adj. R-squared 8.90% 8.96% 9.06% 8.76% 8.94% 9.08% 8.95% 10.22%
N 31,267 31,267 30,294 31,262 31,262 30,294 31,262 20,256
The unit of observation is VC firm f’s initial investment in portfolio company c. The dependent variable is Success, which equals one if the
portfolio company was acquired, merged, in registration for an IPO, or went public by the end of 2003, and equals zero otherwise.
Controls include industry, investment stage, round number, and year fixed effects. T-statistics in italics below coefficient estimates are
based on robust standard errors allowing for data clustering by venture capital organization. The public market measure (PM Measure) is
either Lagged Q or Lagged IPOs. Lagged Q is the lagged average ratio of the market value of the firm to the book value of assets for
companies in the same industry. More details on the construction of this variable are described in the text. Lagged IPOs is the log of one
plus the number of initial public offerings (IPOs) of venture-backed companies in industry g in year t�1. EXPERIENCE is the difference
between the log of one plus the number of investments made by VC firm f prior to year t and the log of one plus the average of the number
of investments made by all firms prior to year t. INDEXP is the difference between the log of one plus the number of investments made by
VC firm f in industry g prior to year t and the log of one plus the average of the number of investments made by all firms in industry g prior
to year t. NONINDEXP is the difference between the log of one plus the number of investments made by VC firm f outside industry g prior
to year t and the log of one plus the average of the number of investments made by all firms outside industry g prior to year t.
SPECIALIZATION is the number of investments made by VC firm f in industry g divided by the number of investments made by VC firm
f in total prior to year t divided by the average of the same figure for all VC firms in year t.***, **, * Indicate statistical significance at the 1%, 5%, and 10% level, respectively.
P. Gompers et al. / Journal of Financial Economics 87 (2008) 1–23 19
Using quartiles rather than continuous variables. Table 10 repeats the three analyses, now measuringexperience using quartiles rather than as a continuous variable. Each specification includes an AR(1) term. Ineach case, we replicate an analysis reported earlier using industry and non-industry experience: column 4 inTables 6 and 7 and column 3 in Table 9. We find that the same basic patterns hold. In particular, moreexperienced investors are more likely to invest when Q is high (Table 10, Column 1). A similar pattern holdswhen we look at the subsample of investors. Similarly, there is no clear pattern between success andinvestment rates, except for greater success for investments by the most experienced venture organizations inthe markets with the greatest investment opportunities.
Restricting the sample size. Table 11 looks at whether the results are robust when the sample is limited. Inparticular, in the above analyses, we use as observations each active venture capital firm and industry. In some
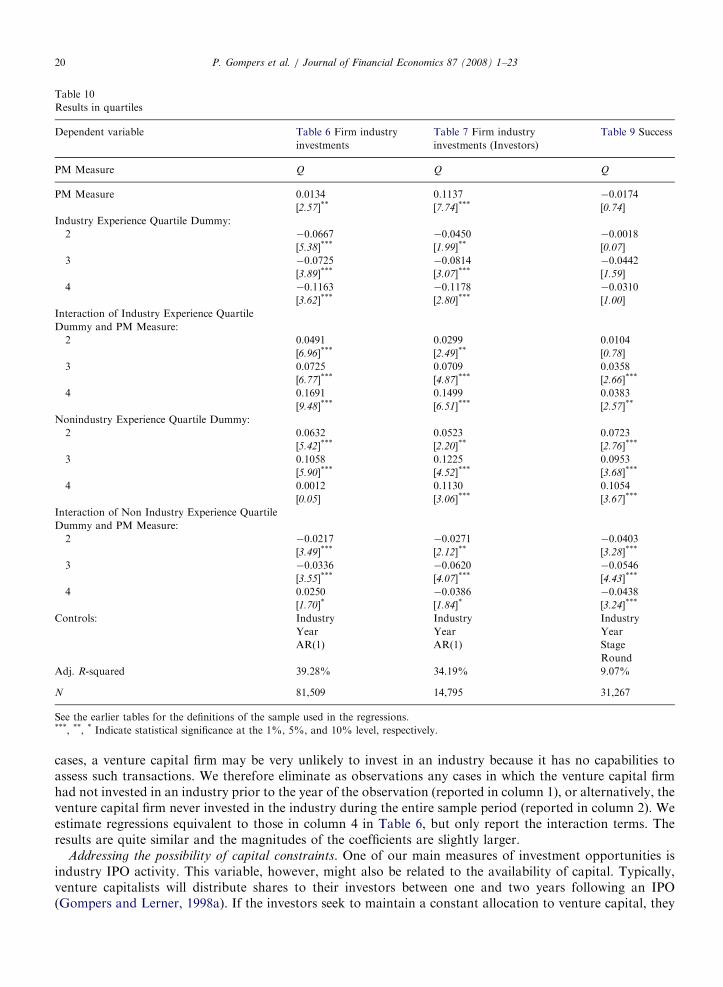
ARTICLE IN PRESS
Table 10
Results in quartiles
Dependent variable Table 6 Firm industry
investments
Table 7 Firm industry
investments (Investors)
Table 9 Success
PM Measure Q Q Q
PM Measure 0.0134 0.1137 �0.0174
[2.57]** [7.74]*** [0.74]
Industry Experience Quartile Dummy:
2 �0.0667 �0.0450 �0.0018
[5.38]*** [1.99]** [0.07]
3 �0.0725 �0.0814 �0.0442
[3.89]*** [3.07]*** [1.59]
4 �0.1163 �0.1178 �0.0310
[3.62]*** [2.80]*** [1.00]
Interaction of Industry Experience Quartile
Dummy and PM Measure:
2 0.0491 0.0299 0.0104
[6.96]*** [2.49]** [0.78]
3 0.0725 0.0709 0.0358
[6.77]*** [4.87]*** [2.66]***
4 0.1691 0.1499 0.0383
[9.48]*** [6.51]*** [2.57]**
Nonindustry Experience Quartile Dummy:
2 0.0632 0.0523 0.0723
[5.42]*** [2.20]** [2.76]***
3 0.1058 0.1225 0.0953
[5.90]*** [4.52]*** [3.68]***
4 0.0012 0.1130 0.1054
[0.05] [3.06]*** [3.67]***
Interaction of Non Industry Experience Quartile
Dummy and PM Measure:
2 �0.0217 �0.0271 �0.0403
[3.49]*** [2.12]** [3.28]***
3 �0.0336 �0.0620 �0.0546
[3.55]*** [4.07]*** [4.43]***
4 0.0250 �0.0386 �0.0438
[1.70]* [1.84]* [3.24]***
Controls: Industry Industry Industry
Year Year Year
AR(1) AR(1) Stage
Round
Adj. R-squared 39.28% 34.19% 9.07%
N 81,509 14,795 31,267
See the earlier tables for the definitions of the sample used in the regressions.***, **, * Indicate statistical significance at the 1%, 5%, and 10% level, respectively.
P. Gompers et al. / Journal of Financial Economics 87 (2008) 1–2320
cases, a venture capital firm may be very unlikely to invest in an industry because it has no capabilities toassess such transactions. We therefore eliminate as observations any cases in which the venture capital firmhad not invested in an industry prior to the year of the observation (reported in column 1), or alternatively, theventure capital firm never invested in the industry during the entire sample period (reported in column 2). Weestimate regressions equivalent to those in column 4 in Table 6, but only report the interaction terms. Theresults are quite similar and the magnitudes of the coefficients are slightly larger.
Addressing the possibility of capital constraints. One of our main measures of investment opportunities isindustry IPO activity. This variable, however, might also be related to the availability of capital. Typically,venture capitalists will distribute shares to their investors between one and two years following an IPO(Gompers and Lerner, 1998a). If the investors seek to maintain a constant allocation to venture capital, they
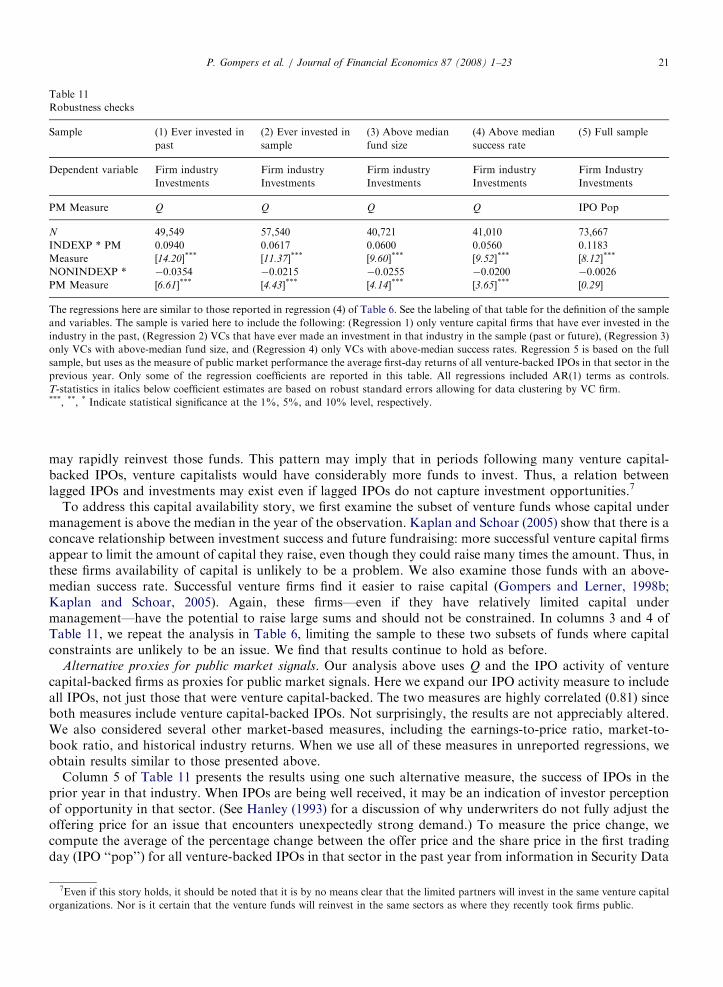
ARTICLE IN PRESS
Table 11
Robustness checks
Sample (1) Ever invested in
past
(2) Ever invested in
sample
(3) Above median
fund size
(4) Above median
success rate
(5) Full sample
Dependent variable Firm industry
Investments
Firm industry
Investments
Firm industry
Investments
Firm industry
Investments
Firm Industry
Investments
PM Measure Q Q Q Q IPO Pop
N 49,549 57,540 40,721 41,010 73,667
INDEXP * PM
Measure
0.0940 0.0617 0.0600 0.0560 0.1183
[14.20]*** [11.37]*** [9.60]*** [9.52]*** [8.12]***
NONINDEXP *
PM Measure
�0.0354 �0.0215 �0.0255 �0.0200 �0.0026
[6.61]*** [4.43]*** [4.14]*** [3.65]*** [0.29]
The regressions here are similar to those reported in regression (4) of Table 6. See the labeling of that table for the definition of the sample
and variables. The sample is varied here to include the following: (Regression 1) only venture capital firms that have ever invested in the
industry in the past, (Regression 2) VCs that have ever made an investment in that industry in the sample (past or future), (Regression 3)
only VCs with above-median fund size, and (Regression 4) only VCs with above-median success rates. Regression 5 is based on the full
sample, but uses as the measure of public market performance the average first-day returns of all venture-backed IPOs in that sector in the
previous year. Only some of the regression coefficients are reported in this table. All regressions included AR(1) terms as controls.
T-statistics in italics below coefficient estimates are based on robust standard errors allowing for data clustering by VC firm.***, **, * Indicate statistical significance at the 1%, 5%, and 10% level, respectively.
P. Gompers et al. / Journal of Financial Economics 87 (2008) 1–23 21
may rapidly reinvest those funds. This pattern may imply that in periods following many venture capital-backed IPOs, venture capitalists would have considerably more funds to invest. Thus, a relation betweenlagged IPOs and investments may exist even if lagged IPOs do not capture investment opportunities.7
To address this capital availability story, we first examine the subset of venture funds whose capital undermanagement is above the median in the year of the observation. Kaplan and Schoar (2005) show that there is aconcave relationship between investment success and future fundraising: more successful venture capital firmsappear to limit the amount of capital they raise, even though they could raise many times the amount. Thus, inthese firms availability of capital is unlikely to be a problem. We also examine those funds with an above-median success rate. Successful venture firms find it easier to raise capital (Gompers and Lerner, 1998b;Kaplan and Schoar, 2005). Again, these firms—even if they have relatively limited capital undermanagement—have the potential to raise large sums and should not be constrained. In columns 3 and 4 ofTable 11, we repeat the analysis in Table 6, limiting the sample to these two subsets of funds where capitalconstraints are unlikely to be an issue. We find that results continue to hold as before.
Alternative proxies for public market signals. Our analysis above uses Q and the IPO activity of venturecapital-backed firms as proxies for public market signals. Here we expand our IPO activity measure to includeall IPOs, not just those that were venture capital-backed. The two measures are highly correlated (0.81) sinceboth measures include venture capital-backed IPOs. Not surprisingly, the results are not appreciably altered.We also considered several other market-based measures, including the earnings-to-price ratio, market-to-book ratio, and historical industry returns. When we use all of these measures in unreported regressions, weobtain results similar to those presented above.
Column 5 of Table 11 presents the results using one such alternative measure, the success of IPOs in theprior year in that industry. When IPOs are being well received, it may be an indication of investor perceptionof opportunity in that sector. (See Hanley (1993) for a discussion of why underwriters do not fully adjust theoffering price for an issue that encounters unexpectedly strong demand.) To measure the price change, wecompute the average of the percentage change between the offer price and the share price in the first tradingday (IPO ‘‘pop’’) for all venture-backed IPOs in that sector in the past year from information in Security Data
7Even if this story holds, it should be noted that it is by no means clear that the limited partners will invest in the same venture capital
organizations. Nor is it certain that the venture funds will reinvest in the same sectors as where they recently took firms public.
ARTICLE IN PRESSP. Gompers et al. / Journal of Financial Economics 87 (2008) 1–2322
Company’s Corporate New Issues database and the Center for Research in Security Prices pricing data.8 Theresults show that the interaction terms are positive, and the coefficient on industry experience is larger thanthat on non-industry experience. However, the results are less robust, becoming insignificant when we use 30-day returns as our measure of IPO market performance. The IPO pop is perhaps less likely to serve as a signalof fundamental opportunities in a sector, since it may be measuring something fundamentally different, suchas market sentiment or underwriter market power.
One observation per company. Since the data set includes multiple observations on the same portfoliocompanies, each outcome reflects not only a given venture capital firm’s characteristics, but also those of theother venture capitalists invested in the company. As an additional robustness check to the relations amongexperience, industry experience, specialization, and success, we use a sample with one observation for eachportfolio company and the average levels of each variable for the venture capitalists investing in the company.In these specifications, both industry and non-industry experience are positively associated with success, as isspecialization, although the coefficient on specialization is not significantly different from zero. In the absenceof more information about the specific roles that each venture capital organization plays in the selection anddevelopment of the company, it is difficult to draw any conclusions from the interactions of the differentventure capitalists invested in the company. This remains a rich topic for future research.
4. Conclusions
The venture capital industry is a highly volatile one, as dramatic fluctuations in fundraising and investmentactivity over the past few years demonstrate. These fluctuations seem to be related to changes in public marketvaluations and activity. Practitioner accounts and the academic literature suggest that it would be valuable tounderstand the impact of this volatility on the success of venture capital investments in particular; do publicmarket shifts lead venture capitalists to make poor investment choices or do they provide valuableinformation to investors? We address this question by examining the determinants and success of investmentsby the venture industry as a whole, as well as by subclasses of firms with different levels of experience andspecialization.
We analyze over 30,000 venture capital investment decisions over the past two decades. We find that thegreatest response to shifts in the public markets is not by new or inexperienced venture capital firms, but ratherby specialized organizations with considerable industry experience. These experienced venture capital firmsincrease their investments during market booms with no real degradation in their performance. Our resultssuggest that shifts in public markets provide information, whether directly to the venture investors or else toindividuals who then seek venture financing. However, not all venture capital firms are able to take advantageof this information: the critical factor appears to be human capital. As noted in the introduction, thefundamental pattern seen here—that the changing public market signals seems to reflect shiftingfundamentals—runs counter to much of the recent work in financial economics on investor overreaction.
The greater investment sensitivity is associated with industry, but not non-industry, investment experience.Whether that effect is from greater knowledge of the industry or better networks that allow for recruitment ofsenior management, customers, and strategic partners needs further exploration.
A variety of open issues remain for future research. First, as we acknowledge above, the precise mechanismsbehind the relative performance of more industry experienced and specialized organizations remain unclear.For instance, is it possible to disentangle the relative importance of superior investment selection and ability toadd value from the ability to persuade entrepreneurs to accept ones’ capital? (While Kaplan and Stromberg(2004) present an intriguing initial look at the venture capital decision-making process, many open questionsremain. Sorensen (2004) represents another important step in untangling these issues.) Second, because weseek to examine investment outcomes, our analysis only extends through 1998; we do not analyze the events of1999 and 2000. While the venture capital market has seen many cycles in the past, the magnitude of the boomand bust during this period was second to none. Understanding whether the patterns delineated above
8Based on discussions with practitioners, we expect that it is absolute rather than relative performance that matters the most in
evaluating the success of IPOs. We run similar analyses adjusting the returns for market performance, measuring the market both with
NASDAQ and the S&P 500, and obtain similar results.

ARTICLE IN PRESSP. Gompers et al. / Journal of Financial Economics 87 (2008) 1–23 23
continued to hold during that most dramatic of cycles is an important question for future researchers toexamine.
References
Baker, M., Stein, J.C., Wurgler, S., 2003. When does the market matter? Stock prices and the investment of equity-dependent firms.
Quarterly Journal of Economics 118, 969–1005.
Cochrane, J.H., 2005. The risk and return of venture capital. Journal of Financial Economics 75, 3–52.
DeBondt, W.F.M., Thaler, R.H., 1985. Does the stock market overreact? Journal of Finance 40, 793–805.
DeBondt, W.F.M., Thaler, R.H., 1990. Do security analysts overreact? American Economic Review Papers and Proceedings 80, 52–57.
Fama, E.F., 1998. Market efficiency, long-term returns, and behavioral finance. Journal of Financial Economics 49, 283–306.
Fulghieri, P., Sevilir, M., 2004. Size and focus of venture capital portfolios. Working paper. University of North Carolina.
Gompers, P.A., Lerner, J., 1998a. Venture capital distributions: short-run and long-run reactions. Journal of Finance 53, 2161–2183.
Gompers, P.A., Lerner, J., 1998b. What drives venture capital fundraising? Brookings Proceedings on Microeconomic Activity 149–204.
Gompers, P.A., Lerner, J., 2000. Money chasing deals?: the impact of fund inflows on the valuation of private equity investments. Journal
of Financial Economics 55, 281–325.
Gompers, P.A., Lerner, J., 2004. The Venture Capital Cycle. MIT Press, Cambridge, MA and London.
Gupta, U., 2000. Done Deals: Venture Capitalists Tell Their Stories. Harvard Business School Press, Boston.
Hanley, K.W., 1993. The underpricing of initial public offerings and the partial adjustment phenomenon. Journal of Financial Economics
34, 231–250.
Hong, H., Stein, J.C., 1999. A unified theory of underreaction, momentum trading, and overreaction in asset markets. Journal of Finance
54, 2143–2184.
Jeng, L.A., Wells, P.C., 2000. The determinants of venture capital funding: evidence across countries. Journal of Corporate Finance 6,
241–289.
Jiambalvo, J., Rajgopal, S., Venkatachalam, M., 2002. Institutional ownership and the extent to which stock prices reflect future earnings.
Contemporary Accounting Research 19, 117–145.
Kaplan, S.N., Schoar, A., 2005. Private equity performance: returns, persistence and capital. Journal of Finance 60, 1791–1823.
Kaplan, S.N., Stromberg, P., 2004. Characteristics, contracts, and actions: evidence from venture capitalist analyses. Journal of Finance
59, 2177–2210.
Lev, B., Thiagarajan, R.S., 1993. Fundamental information analysis. Journal of Accounting Research 31, 190–215.
Ljungqvist, A., Richardson, M.P., 2003. The cash flow, return and risk characteristics of private equity. Unpublished working paper. New
York University.
Loughran, T., Ritter, J., 1995. The new issues puzzle. Journal of Finance 50, 23–51.
Pagano, M., Panetta, F., Zingales, L., 1998. Why do companies go public? An empirical analysis. Journal of Finance 53, 27–64.
Rajan, R.G., Servaes, H., Zingales, L., 2000. The Cost of diversity: diversification discount and inefficient investment. Journal of Finance
55, 35–80.
Ritter, J.R., Welch, I., 2002. A review of IPO activity, pricing, and allocations. Journal of Finance 57, 1795–1828.
Scharfstein, D.S., 1998. The dark side of internal capital markets ii: evidence from diversified conglomerates. Working paper. National
Bureau of Economic Research Working Paper 6352.
Scharfstein, D.S., Stein, J.C., 1990. Herd behavior and investment. American Economic Review 80, 465–479.
Sorensen, M., 2004. How smart is smart money? An empirical two-sided matching model of venture capital. Unpublished working paper.
University of Chicago.