Embed Size (px)
Citation preview

Ventral striatal gamma oscillations are highly variable from trial to trial,dominated by behavioral state, and only weakly influenced by outcome value
Authors: Sushant Malhotra1,2, Rob W. Cross1, Anqi Zhang3, Matthijs A. A. van der Meer1,4*
1Department of Biology and Centre for Theoretical Neuroscience, University of Waterloo, Ontario, Canada
2Systems Design Engineering, University of Waterloo
3Program in Neuroscience, McGill University
4Department of Psychological and Brain Sciences, Dartmouth College, USA
*Correspondence should be addressed to MvdM. Current address: Department of Psychological and Brain
Sciences, Dartmouth College, Hanover, NH 03755. E-mail: [email protected].
Accepted manuscript, European Journal of Neuroscience
Running title: Ventral striatal gamma oscillations
1

Abstract
The human and rodent ventral striatal local field potential exhibits striking oscillations in the gamma band
(∼40-100Hz), which have been linked to aspects of behavior such as reward anticipation and delivery, move-
ment initiation, learning from feedback, and decision-making. These oscillations exhibit rich temporal or-
ganization, whose relationship to behavioral variables is not well understood. Here, we show that in rats
performing a conditioned approach task, low- and high-gamma oscillations during an immobile reward
anticipation epoch were largely insensitive to outcome value, even though rats distinguished behaviorally
between different outcomes, and single units encoded outcome value. Behavior was highly stereotyped,
yet we observed large variability from trial to trial in the occurrence and timing of these oscillations. Fur-
thermore, higher-order features such as high-gamma leading low-gamma, and phase-amplitude coupling to
lower frequency bands, were only marginally modulated by outcome value. Moreover, these patterns closely
resembled those found during off-task rest periods in which no rewards could be earned. These observations
suggest a new interpretation of ventral striatal gamma oscillations as reflecting a default or resting state, with
only minor and highly variable modulation by specific task-related variables.
Keywords: striatum, nucleus accumbens, local field potential, value, phase-amplitude coupling
2
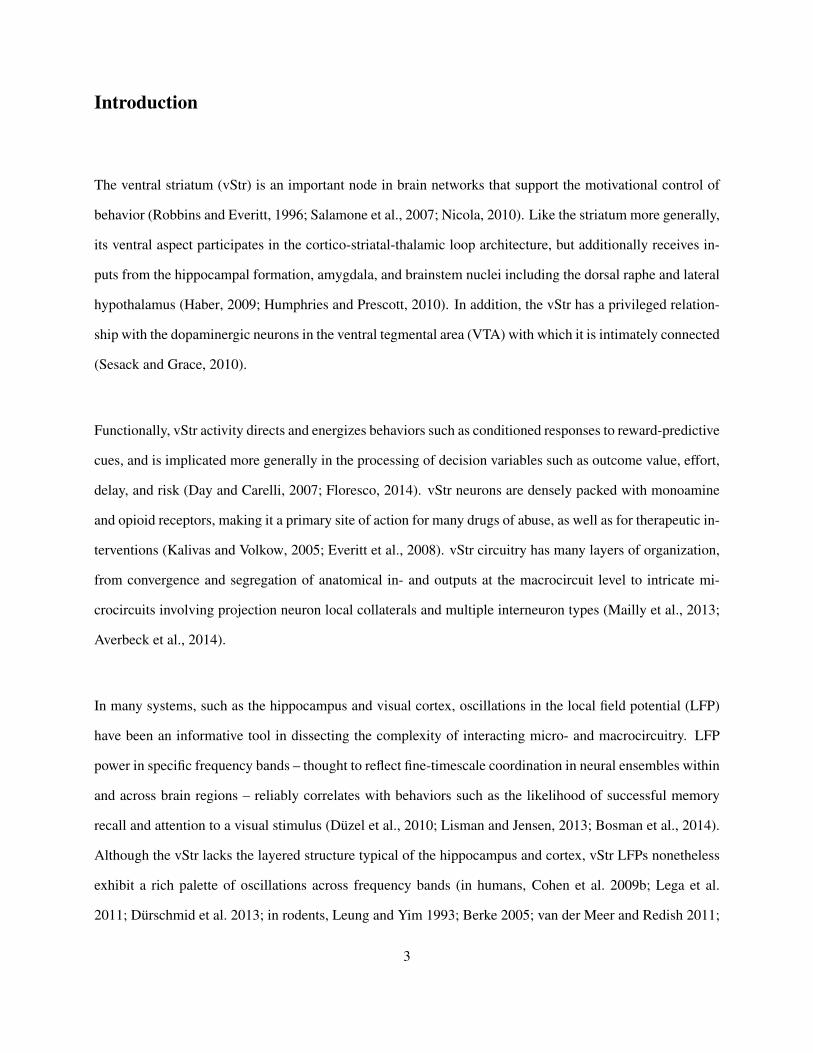
Introduction
The ventral striatum (vStr) is an important node in brain networks that support the motivational control of
behavior (Robbins and Everitt, 1996; Salamone et al., 2007; Nicola, 2010). Like the striatum more generally,
its ventral aspect participates in the cortico-striatal-thalamic loop architecture, but additionally receives in-
puts from the hippocampal formation, amygdala, and brainstem nuclei including the dorsal raphe and lateral
hypothalamus (Haber, 2009; Humphries and Prescott, 2010). In addition, the vStr has a privileged relation-
ship with the dopaminergic neurons in the ventral tegmental area (VTA) with which it is intimately connected
(Sesack and Grace, 2010).
Functionally, vStr activity directs and energizes behaviors such as conditioned responses to reward-predictive
cues, and is implicated more generally in the processing of decision variables such as outcome value, effort,
delay, and risk (Day and Carelli, 2007; Floresco, 2014). vStr neurons are densely packed with monoamine
and opioid receptors, making it a primary site of action for many drugs of abuse, as well as for therapeutic in-
terventions (Kalivas and Volkow, 2005; Everitt et al., 2008). vStr circuitry has many layers of organization,
from convergence and segregation of anatomical in- and outputs at the macrocircuit level to intricate mi-
crocircuits involving projection neuron local collaterals and multiple interneuron types (Mailly et al., 2013;
Averbeck et al., 2014).
In many systems, such as the hippocampus and visual cortex, oscillations in the local field potential (LFP)
have been an informative tool in dissecting the complexity of interacting micro- and macrocircuitry. LFP
power in specific frequency bands – thought to reflect fine-timescale coordination in neural ensembles within
and across brain regions – reliably correlates with behaviors such as the likelihood of successful memory
recall and attention to a visual stimulus (Duzel et al., 2010; Lisman and Jensen, 2013; Bosman et al., 2014).
Although the vStr lacks the layered structure typical of the hippocampus and cortex, vStr LFPs nonetheless
exhibit a rich palette of oscillations across frequency bands (in humans, Cohen et al. 2009b; Lega et al.
2011; Durschmid et al. 2013; in rodents, Leung and Yim 1993; Berke 2005; van der Meer and Redish 2011;
3

Leventhal et al. 2012). Moreover, the spike timing of some vStr neurons, and that of putative fast- spiking
interneurons (FSIs) in particular, is systematically related to LFP phase, suggesting that these oscillations are
locally relevant (Berke, 2009; van der Meer and Redish, 2009; Kalenscher et al., 2010; Howe et al., 2011;
Morra et al., 2012).
However, not much is known about the behavioral conditions that generate specific vStr oscillations. Initial
reports of vStr oscillations in behaving rats suggested that low-gamma (∼50Hz) and high-gamma (∼80Hz)
power were differentially modulated upon approach to and receipt of reward (van der Meer and Redish, 2009;
Berke, 2009; Howe et al., 2011). The relationship between aspects of reward processing and vStr gamma
is further substantiated by the apparent influence of dopaminergic and cannabinoid drugs on vStr gamma
power (Berke, 2009; Morra et al., 2012; Goda et al., 2013).
Yet, these studies only allow for limited inferences regarding the relationship between vStr gamma and
behavior. For instance, these studies did not systematically vary decision variables such as outcome value,
and no behavioral read-out of the incentive value assigned to the outcomes was available. Moreover, precise
timing to dissociate the time of arrival, occurrence of reward-predictive cues, and contact with reward per se
was not available (but see Donnelly et al. 2014 for a recent exception).
To address these limitations, we recorded vStr LFPs from rats performing a conditioned approach task. Rats
shuttled back and forth on a linear track with reward sites at both ends; at the center of each run, one of three
audio cues was presented which predicted the subsequent delivery of 1, 3 or 5 food reward pellets. To obtain
reward, rats had to hold a nosepoke into the reward receptacle for a fixed amount of time. These features
of the task design enable analysis of the relationship of vStr gamma oscillations to outcome value during
controlled task epochs.
4

Methods
Overview and timeline
Four male Long-Evans rats (Harlan; Mississauga, Canada), 6-10 months old at the beginning of behavioral
training, were first habituated to wearing a LED backpack, used for video tracking during behavioral ses-
sions. During this first week, rats were food- restricted such that they gradually approached approximately
90%, but never less than 85%, of their free-feeding weight. Next, rats were introduced to the apparatus,
an elevated linear track 1.8m in length with food pellet reward receptacles at both ends (Figure 1). On this
track, different audio cues were associated with different reward outcome distributions (described in detail
in the next section). Reward receptacles were equipped with photobeams, such that delays could be imposed
between rats nosepoking into the receptacle and the time of reward delivery. As rats learned the task, this
delay was gradually increased to 500ms.
Once rats reliably ran >100 trials in a daily 40-minute session (average 11.25 daily sessions from start of
track training, range 5-21 sessions), they were surgically implanted with an array of tetrodes targeting the
ventral striatum. Following recovery, rats were re-trained on the task. Once they were running >100 trials
reliably and recording electrodes reached their targets, neural data acquisition during behavior commenced
(average 11.5 sessions after surgery, range 6-18 sessions); at this stage video tracking relied on LEDs at-
tached to the recording headstage rather than the backpack.
Recording sessions with (1) at least one recording electrode in the vStr, and (2) in which rats ran at least
100 trials, were eligible for initial behavioral analysis (25 sessions total: 3 from R014, 7 from R016, 8
from R018, and 7 from R020, where R014-020 are subject IDs). As described in the Results, in 16 of
these 25 sessions there was behavioral evidence for successful discrimination between the reward-predictive
cues; neural data from these sessions only was analyzed further. All procedures were pre-approved by the
5

University of Waterloo Animal Care Committee, and performed in accordance with Canadian Council for
Animal Care (CCAC) guidelines.
Behavioral task
The behavioral task design had two objectives: first, to elicit behavioral evidence that rats distinguished
between different reward outcomes, and second, to include a stereotyped period during which neural signals
could be compared without confounding overt behavioral differences. To accomplish both in a setting in
which vStr gamma oscillations have been previously found, we constructed an elevated linear track from
wood, painted matte black, 1.8m in length and 10cm wide. The ends of the linear track were equipped with
custom-built food pellet reward receptacles, into which rats could nosepoke to break an infrared photobeam
(Coulbourn; Figure 1A).
To trigger reward delivery, rats had to hold the nosepoke for 500ms, at which point an automated pellet
dispenser (Coulbourn) released a number of food pellets (described below; pellets are 45mg Test Diet 5TUL).
The first pellet arrived in the receptacle between 750 and 1000ms after reward delivery is triggered, resulting
in a period of at least 1250ms during which rats await reward delivery while stationary at the reward sites.
A run from one receptacle to the other was defined as a trial, which could be correct (if nosepoke held for
at least 500ms) or incorrect (no nosepoke made, or withdrawn before 500ms; no reward dispensed). Only
correct trials were included for analysis.
[Figure 1 about here.]
The number of pellets delivered on a given trial was signaled by one of five audio cues, triggered when rats
entered the center zone of the track (Figure 1A). Random jitter between +15 to -15cm was added to the cue
presentation trigger zone on each trial, to prevent cue onset from being predictable by the rats. The five audio
6

cues were:
• Cue 1: 2kHz tone, turning on/off at 10Hz
• Cue 2: 15kHz tone
• Cue 3: white noise
• Cue 4: 8kHz tone, amplitude-modulated with a 2Hz sine wave
• Cue 5: 3 different mixed tones (1, 2 and 4kHz) alternating at 15Hz
Cues were played from a speaker placed behind the currently armed receptacle, such that the average sound
intensity at the center of the track was measured at 75 dB. Cues remained on until either (1) an unsuccessful
(early unpoke) nosepoke was made, (2) one second after a successful nosepoke, or (3) the rat re-entering the
trigger zone in the center of the track. Each cue was associated with a different reward outcome distribution:
• Outcome 1: 1 pellet (100% of trials)
• Outcome 2: 3 pellets (100%)
• Outcome 3: 5 pellets (100%)
• Outcome 4: 2 pellets (50%) or 4 pellets (50%)
7

• Outcome 5: 1 pellet (50%) or 5 pellets (50%)
The mapping between audio cues to outcome distributions was pseudorandomized between subjects to en-
sure that differences in behavior between cues could not be the result of intrinsic salience or unconditioned
responding to specific cues. To determine if rats learned the association between cue and outcome distribu-
tion, we computed their running speed in the ”run” epoch between cue onset and nosepoke; based on classic
results (e.g. Crespi 1942) we expected rats to run faster in response to the 5-pellet cue than to the 1-pellet
cue.
Daily training and recording sessions included two 20-minute blocks: a ”value” block and a ”risk” block.
During the ”value” block, outcomes with certain reward of 1 (low value), 3 and 5 (high value) pellets were
pseudorandomly assigned to trials with a frequency of 0.4, 0.2 and 0.4 respectively (i.e. of 100 total trials, 40
are 1-pellet, 20 are 3-pellet, and 40 are 5-pellet) such that the same cue could not occur more than twice in
succession. Similarly, the ”risk” block consisted of low risk (2 or 4 pellets, frequency 0.4), no- risk (certain 3
pellets, frequency 0.2) and high risk (1 or 5 pellets, frequency 0.4). The certain 3-pellet cue was included in
both blocks to provide a consistent reference point for tracking possible changes in behavior across blocks.
Recording sessions additionally included 5 minutes of ”off-task” recording in a separate container (a terra
cotta flower pot filled with towels) before and after running on the track.
Data acquisition and experimental control
Electrode arrays. Arrays with independently drivable tetrodes were constructed from a 3D-printed drive
body (Shapeways Frosted Ultra Detail; initial design graciously provided by Loren Frank, UCSF) into which
30Ga stainless steel tubing was threaded to form two bundles targeting the ventral striatum (4 tetrodes) and
the dorsal hippocampus (2 tetrodes; data not analyzed here). Tetrodes were made from 17µm platinum-
iridium wire (California Fine Wire) and glued to glass capillaries (King Precision Glass) which could be
8

lowered into the 30Ga tubing by turning a nut along a threaded rod (0-80) attached to the drive body. Tetrodes
were attached to 0.050” pitch connector (MillMax) which could accept a 24-channel headstage (Neuralynx
HS-27, see below for details).
Surgery. Surgical procedures for chronic implantation of the electrode array were generally similar to those
described in detail elsewhere (Kloosterman et al., 2009; van der Meer and Redish, 2011; Vandecasteele et al.,
2012). Briefly, rats were anesthetized with isoflurane and mounted on a stereotactic frame. After topical
application of lidocaine and epinephrine, an incision was made to expose the skull, into which jeweler’s
screws (00-90 1/4” and 000-120 3/32”) were installed. Craniotomies were made above the intended targets
(ventral striatum, 1.8mm anterior and 1.5mm right-lateral to bregma; dorsal hippocampus, 3.8mm posterior
and 2.5mm right-lateral to bregma), the dura removed, and the electrode array lowered such that the bottom
of the 30Ga tubing just touched the brain surface. Craniotomies were sealed with Kwik-sil (World Precision
Instruments) and the array secured with dental cement (Parkell Metabond and Jet Acrylic). Before surgery,
rats were given Ketoprofen (Anafen, 3 mg/kg s.c. in 3 ml saline) and Duplo-cillin (30,000 IU i.m.). Following
surgery, rats had access to ibuprofen (approx. 15mg/kg Children’s Advil, in ad libitum drinking water) and
were given daily Anafen (3 mg/kg s.c. in 3 ml saline) and Baytril (2.5 mg/kg s.c.) for another 2 days, as well
as ad libitum access to food for at least 4 days.
Data acquisition. Neural data was acquired with a Digital Lynx SX system (Neuralynx) equipped with a
motorized commutator (PSR-36-3, Neuralynx) and integrated video tracker module. Neural signals were
buffered by a Neuralynx HS-27 unity-gain headstage, then amplified and digitized by the Digital Lynx main-
box at a rate of 32kHz. Spiking data was bandpass-filtered by the Digital Lynx system between 0.6 and 6kHz,
stored in 1ms snapshots when the signal exceeded an experimenter-set threshold (typically 50µV), and sorted
into putative single units offline (MClust 3.5, AD Redish). Local field potential data from all channels was
bandpass-filtered by the Digital Lynx system between 1 and 425Hz, and downsampled to 2kHz before being
saved to disk. All ventral striatal signals were referenced against an intracranial reference tetrode (enabled
by a DRS-36 reference board, Neuralynx) located in or near the overlying corpus callosum. We also acquired
9

data referenced to animal ground to verify that oscillations of interest could not be attributed to the reference.
Video tracking data from the overhead-mounted camera was collected at 30 frames per second. Timestamps
from photobeam breaks and pellet delivery were recorded with sub-microsecond precision through the Neu-
ralynx digital I/O ports. Timestamps for audio cue on- and offset were signaled to the Neuralynx software
through a NetCom interface with MATLAB (see below).
Experimental control. A custom-written MATLAB script accessed video tracking data and photobeam
status through the NetCom interface and software (Neuralynx), such that audio cues and rewards could be
delivered according to the experimental design. Data buffering and operating system delays resulted in a
small, variable delay in the exact timing of audio cue presentation and reward delivery; we estimated these
to be between 20-50ms. However, given that we purposely added jitter to audio cue onset, and there is
much larger inherent variability in the time it takes for a food pellet to make it from the feeder to the reward
receptacle, we judged the impact of these processing delays on behavior and neural data analysis to be
minimal.
Histology. After completion of recording experiments, small lesions to mark recording locations were made
by passing 10µA current through the tetrodes for 10s each. One rat (R014) did not undergo this gliosis pro-
cedure because of premature detachment of the electrode array. Three days following gliosis, rats were anes-
thetized with isoflurane, asphyxiated and perfused intracardially with 10% formalin. Brains were extracted
and stored in formalin with 30% sucrose before being cut in 50µm sections using a freezing microtome.
Sections were mounted on gelatin-coated slides, stained with metachromatic thionin and coverslipped for
localization of recording locations.
Data analysis
Behavior. To determine if rats discriminated behaviorally between the different audio cues, we estimated the
10

rats’ speed as a function of time using the adaptive windowing algorithm by Janabi-Sharifi et al. (2000) and
constructed peri-event averages centered on the time of cue presentation. For the complete data set (all 25
sessions) we then compared across different outcomes the average speed in the 1-second window following
cue presentation using a likelihood ratio test between linear mixed models in R (R Core Development Team,
2013), described below.
Statistical modeling and analysis. Our main hypotheses centered on the effects of outcome value (number
of food pellets predicted by the audio cues) on running speed and features of the local field potential. In order
to estimate accurately the effects of outcome value against a backdrop of other factors which may influence
our dependent variables of interest, we constructed linear mixed models in R using the lmer4 package
(Bates et al., 2014). Specifically, for each test, we first determined the best linear mixed model without our
explanatory variable of interest (typically outcome value) based on Akaike’s information criterion (AIC) and
visual inspection of the residuals. We allowed both subject-specific intercepts and subject-specific slopes for
each regressor (Barr et al., 2013). The best-fitting baseline model was then compared to the model with the
explanatory variable of interest added, using a likelihood ratio test (Barr et al., 2013). As possible regressors
for the baseline models we included the following: (1) time elapsed since the beginning of the task, (2) time
elapsed since the previous reward was received, (3) time elapsed since leaving the previous reward site, (4)
the outcome received on the previous trial, (5) the distance to the reward site at the time of cue onset, (6-9)
average and peak running speed 1 second before and after cue onset.
Spectral analysis. For each recording session, one recording channel with confirmed recording location
in the ventral striatum and good quality recording was selected for analysis. Overall, we used two spectral
methods with complementary strengths, described below.
First, for overall characterization of the signal across frequencies, such as power spectral densities and time-
frequency spectrograms, we used the freely available FieldTrip toolbox (Oostenveld et al., 2011) with custom
data loading and trial functions. Power spectral densities in Figure 3 were computed using the FieldTrip func-
11

tion ft freqanalysis() with the mtmfft method and a Hanning window. Spectrograms underlying
the analyses in Figures 5-6 were obtained using a frequency-dependent time window of 19 cycles multiplied
by a Hanning window. Our main hypotheses were tested with three main time windows of interest: pre-cue
(-0.5 to 0 s to cue onset), post-cue (0 to 0.5 s from cue onset) and nosepoke (0 to 1.25 s following nosepoke
onset); any deviations from these windows for exploratory purposes are explicitly noted in the text. Statisti-
cal comparisons of signal power (pre- versus post-cue and nosepoke; 1-pellet cue versus 5-pellet trials) were
performed with likelihood ratio tests between linear mixed models inR; see Results for model specifications.
Figures and statistical comparisons used signal power normalized relative to pre-cue baseline (-0.5 to 0 s) on
a trial-by-trial basis; we additionally verified that the each statistical comparison was not affected when we
used average signal power across the recording session as the baseline instead.
Second, for analyses that required fine temporal resolution (cross-correlations and phase-amplitude coupling,
Figures 8-11) we extracted instantaneous signal power and phase from the Hilbert transform of the bandpass-
filtered signal. Signals were filtered using MATLAB’s filtfilt() function to ensure a phase lag of
zero, using fourth-order Butterworth filters with a passband of 50-65 Hz for ”low-gamma”, 70-85 Hz for
”high-gamma”, 3-5 Hz for ”delta”, 7-9 Hz for ”theta” and 8-12 Hz for ”alpha”. All filters were designed
with the fdesign.bandpass() and design() functions in the MATLAB Signal Processing Toolbox;
frequencies were specified as cutoffs for the point 3dB below the passband value.
Power cross-correlations between low-gamma and high-gamma (Figures 8 and 11A) were computed using
the MATLAB function xcov() on rank-transformed power time series (Cohen, 2014). Statistical signif-
icance was assessed by comparing observed cross-correlations with a distribution of correlations resulting
from 1000 bootstrap samples in which the two power time series were circularly shifted (within the time win-
dow of interest for each individual trial) relative to one another by a random time. Power cross-correlations
were computed first using an inclusive time window (-1 to 3 seconds relative to nosepoke onset) and subse-
quently during the pre-reward nosepoke period only (0 to 1.25s from nosepoke onset).
12

Phase-amplitude coupling was assessed by comparing the mean vector length of the amplitude distribution
as a function of phase to a distribution of vector lengths obtained from 1000 bootstrap samples to yield a
z-score (Cohen, 2014). For each bootstrap sample we first circularly shifted the power and phase time series
by an independent, random amount for each trial. These time series were then concatenated to yielded a
single shuffled vector length data point to the shuffled distribution which forms the basis for the final PACz
measure of phase-amplitude coupling. As with power cross-correlations, we first used a time window of -1
to 3 s relative to nosepoke onset, followed by a more restricted analysis to the pre-reward nosepoke period
only (0 to 1.25 s). To test directly for differences in PACz between different experimental conditions (1-
and 5-pellet outcomes), observed differences in PACz between conditions were compared to distributions of
1000 surrogate PACz values for which the experimental condition labels were randomly shuffled. Finally, to
visualize the time course of any changes in PACz, we used a 1.25s moving window (time step: 100ms) for
Figure 10.
Results
Behavior
We trained rats (n = 4) to shuttle back and forth on a 1.8m linear track, on which different audio cues
predicted the number of food pellets received at the end of each trial (Figure 1A). To trigger reward delivery,
rats were required to hold a nosepoke into the reward receptacle for 0.5 seconds, upon which an automated
pellet dispenser released food pellets, taking a minimum of 0.75 seconds to reach the receptacle (Figure 1B).
This resulted in a 1.25s window during which rats were relatively immobile, awaiting the upcoming reward
delivery. Audio cues mapped onto different reward outcomes (pseudorandomized across rats) such that in
daily sessions, the ”value” block contained cues predicting 1, 3 and 5 food pellets, and the ”risk” block cues
predicting certain 3 pellets (i.e. no risk), 2 or 4 pellets at 50% probability (low-risk), and 1 or 5 pellets at
13

50% probability (high-risk).
To determine if rats discriminated between the cues, we plotted their running speed as a function of time in
the time window surrounding cue presentation (Figure 2). On average, as well as in each rat individually,
running speeds were higher following the 5-pellet cue compared to the 1-pellet cue (mean ± S.E.M. z-
scored speed in the 1-second window following cue presentation across all sessions, 1-pellet: 1.27 ± 0.31
(725 trials), 5-pellet, 1.63 ± 0.21 (727 trials); likelihood ratio test of best-fit mixed models with and without
cue identity, χ2(1) = 67.97, p < 2.2 ∗ 10-16). The best-fitting baseline model for running speed included
intercepts for subject as a random effect, and time elapsed, identity of the reward received on the previous
trial, and distance to reward at the time of the cue as fixed effects. Neither model was improved by the
inclusion of random slopes (Barr et al., 2013) for any of the fixed effects.
[Figure 2 about here.]
Running speeds to the 3-pellet cue were variable, with some rats treating this cue similar to the 1-pellet cue,
and others to the 5-pellet cue (Figure 2B). However, as a group, rats behaved rationally in that their average
running speeds increased with the number of signaled pellets. For all subsequent analyses, we only included
sessions in which rats ran faster for the 5-pellet compared to the 1-pellet cue (16/25 sessions selected) in order
to maximize the possibility of detecting neural signals that discriminate between these outcomes. Although
error trials were rare in these sessions (12 out of 965 1- and 5-pellet trials, or 1.2%) errors were more likely
to occur on 1-pellet trials (1-pellet: 10 errors out of 480 total trials; 5-pellet, 2 errors out of 485 total trials,
χ2 = 5.48, p = 0.019), further demonstrating that rats discriminated between the cues. Running speeds to the
risk cues were distinctly mixed, with some rats running faster to the low-risk compared to the high-risk cue,
and others the opposite (data not shown); therefore we did not analyze data from these trials specifically.
14

General properties of ventral striatal gamma oscillations
Local field potentials were recorded using chronically implanted tetrode arrays aimed at the dorsal hip-
pocampus (data not analyzed here) and the ventral striatum. Data from one recording channel per session,
histologically confirmed to lie in the ventral striatum (core of the nucleus accumbens; Figure 3A), were an-
alyzed. As in previous studies (Leung and Yim 1993; Berke et al. 2004, see van der Meer et al. 2010 for
review) clear gamma oscillations were apparent in the ventral striatal LFP. Consistent with previous obser-
vations, these oscillations spanned a range from approximately 50 to 100 Hz, with distinct clustering into
low-gamma (50-65 Hz) and high-gamma bands (van der Meer and Redish, 2009; Berke, 2009; Howe et al.,
2011). This distinction is clearly visible in the power spectra of LFPs recorded from each individual rat (Fig-
ure 3B). In line with previous work, we also found evidence of delta (3-5 Hz) and theta (7-9 Hz) frequencies,
although the power of these bands was more variable between animals (Figure 3C).
[Figure 3 about here.]
Thus, the general characteristics of the vStr gamma oscillations we recorded were broadly similar to those
reported previously. However, examining individual trials revealed a striking amount of variability from trial
to trial, with some trials eliciting clear, almost stereotyped gamma oscillation patterns, and others eliciting
no notable gamma power (Figure 4). For instance, Figure 4A shows 5-pellet outcome trials taken from a
single session. For illustration purposes only, epochs with significant high-gamma power (>2 SDs above
the mean) are highlighted in green, and significant low-gamma power in red. There was a clear tendency
for high-gamma events to occur first, aligned to the time of the nosepoke onset (time 0); yet this occurred
only on some trials, not on others. Similarly, example trials from a different rat (Figure 4B) showed a similar
tendency for high-gamma to occur first, followed by low-gamma; yet again clear gamma events appeared on
some trials, not others.
[Figure 4 about here.]
15

Event-triggered increases in gamma power to cues and nosepokes
To examine the dynamics of ventral striatal gamma oscillations more closely, we plotted low- and high-
gamma power aligned to the cue and nosepoke times (Figure 5; pooled data across all animals and cues,
1886 correct trials total). When viewed as raw power aligned to the time of the cue (presented in the middle
of the linear track), the time courses of low- and high-gamma power showed a pattern in line with previous
reports: on average, low-gamma gradually decreased as animals approach a reward site, while high-gamma
gradually increased (Figure 5A, van der Meer and Redish 2009; Howe et al. 2011).
When baseline-normalizing on a trial-by-trial basis against the 0.5s window immediately preceding cue pre-
sentation, increases in mean power were apparent for both low- and high-gamma (low-gamma mean 1.07 ±
0.30, high-gamma mean 1.18 ± 0.36; Figure 5B). However, further inspection revealed that for low-gamma,
this increase in the mean was driven by a long tail in the power distribution arising from the normaliza-
tion procedure, while the median in fact decreased (low-gamma median 0.93, IQR 0.67-1.30; high-gamma
median 1.04, IQR 0.74-1.44). Accordingly, mixed-model comparisons against a model with intercepts as a
per-subject random effect and elapsed time as a fixed effect confirmed a significant increase in high-gamma
power in the 0.5s window following the cue compared to that preceding the cue; this was the case both when
normalizing against the pre-cue window and when normalizing against the mean high-gamma power for the
entire session (pre-cue normalization χ2(1) = 138.48, p < 2.2 ∗ 10-16; session normalization χ2(1) = 5.07, p
= 0.024). In contrast, the same comparisons for low-gamma power only showed an increase for the pre-cue
window normalization (χ2(1) = 19.71, p = 9.02 ∗ 10-6), but a decrease for session normalization (χ2(1) =
21.79, p = 3.05 ∗ 10-6), more in line with the raw data (Figure 5A). Because these cue-aligned changes were
small, and sensitive to the normalization method used, they were not analyzed further.
[Figure 5 about here.]
Aligning the data to the time of the nosepoke, a larger and more robust increase in both bands could be seen
16

(Figure 5C-D): relative to the 0.5s pre-nosepoke baseline, this increase was highly significant for both bands
(1.25s window starting at nosepoke onset, low-gamma: 1.59 ± 0.42, likelihood ratio test between models
with and without pre/post, χ2(1) = 806.32, p < 2.2 ∗ 10-16, high-gamma: 1.50 ± 0.43, χ2(1) = 550.16, p <
2.2 ∗ 10-16). Normalizing to the session average yielded comparable results (model comparison p’s < 2.2 ∗
10-16). Models used for comparison included subject-specific intercepts (random effect) and the following
fixed effects: elapsed time, post-cue running speed, distance to reward at the time of the cue, and the identity
of the previous reward received. Model fits were not improved by modeling the slope of these regressors on
a subject-by-subject basis, although the final model fit better by allowing the slope of the pre/post-nosepoke
regressor to depend on subject.
Beyond this overall increase in power in the nosepoke period compared to running, several other features
of Figure 5C-D are worth noting. First, high-gamma power reliably precedes low-gamma power around the
time of nosepoke onset, and low-gamma power persists beyond high-gamma power. This ordering was previ-
ously reported by van der Meer and Redish (2009) and also found by Howe et al. (2011). Here, however, the
increased temporal control afforded by the nosepoke period reveals that the onset of gamma-band increases
is not aligned to reward delivery, which occurs at ∼1.25s following nosepoke onset, but rather is associated
with the nosepoke period itself. Thus, low- and high-gamma power are both modulated in a manner aligned
to the nosepoke period, as evident in the averages despite relatively large trial-to-trial variability.
Effects of expected outcome on ventral striatal gamma oscillations
Having replicated and extended previous findings that gamma-band oscillations occur before and around the
time of reward delivery, we next asked if these signals reflected the rats’ behaviorally reported expectation
of different outcomes. We compared low- and high-gamma power during the nosepoke period preceding
1- and 5-pellet rewards, which the rats reliably distinguished through their running speed (Figure 2). As
shown in Figure 6, the modulation around the nosepoke time in either frequency band was similar between
17

the two conditions. Comparing raw or baseline-corrected gamma power during the nosepoke period yielded
no significant differences (low-gamma raw, 482 1-pellet trials, mean ± S.E.M. 72.74 ± 22.36, 470 5-pellet
trials, 74.98 ± 23.46; baseline-corrected 1p 1.14 ± 0.31, 5p 1.20 ± 0.34; high-gamma raw, 1p 65.55 ± 18.18,
5p 67.09 ± 23.83; baseline-corrected 1p 1.42 ± 0.39, 5p 1.50 ± 0.47; all model comparison likelihood χ2
values < 0.6, p-values > 0.4).
[Figure 6 about here.]
Model comparisons were performed by adding cue value as a fixed effect to the best-fitting comparison
mixed model, which for both gamma bands and normalization method contained subject-specific intercepts,
plus elapsed time and the identity of the previous reward as fixed effects (the models were not improved by
allowing subject-specific slopes). Performing the model comparison on data normalized by session averages
rather than pre-cue baselines further confirmed that cue value did not improve model fits (low-gamma: χ2(1)
= 0.07, p = 0.78, high-gamma: χ2(1) = 0.59, p = 0.44). Importantly, even on this restricted data set of 1-
and 5-pellet trials, the analysis was sufficiently powered to detect a clear and highly significant increase in
gamma power following the nosepoke (low-gamma: χ2(1) = 357.93, p < 2.2 * 10-16, high-gamma: χ2(1)
= 196.95, p < 2.2 * 10-16), a result not affected by the normalization method chosen. Finally, we tested
whether using a smaller moving window size would detect possible temporal windows of sensitivity to cue
outcome; however, likelihood ratio tests for outcome value with 100ms and 250ms nonoverlapping windows
failed to improve model fits, even without correcting for multiple comparisons.
In contrast to the lack of modulation of gamma power by outcome value, single units showed clear firing
rate differences related to outcome value at multiple stages of the task, including during the pre-reward
nosepoke period (Figure 7), and in general agreement with previous results (Roesch et al., 2009; Day et al.,
2011; Ito and Doya, 2015). Although relatively few single units were recorded (23 units across 7 sessions
from 2 rats with behavioral discrimination between the 1 and 5 pellet cues), 8 out of these 23 units (35%)
differentiated between the 1 and 5 pellet cues in a 3-second time window centered on nosepoke initiation
18

(Wilcoxon rank-sum test on spike counts, p < 0.05).
[Figure 7 about here.]
Thus, we found no statistical evidence that outcome value reliably affected gamma power during the pre-
reward nosepoke period, even though there were clear differences in signal power between nosepoke and
pre-nosepoke baseline (Figure 5), rats discriminated behaviorally between the cues (Figure 2), and individual
single units exhibited different firing rates depending on outcome value during the same pre-reward nosepoke
period (Figure 7). However, a slight trend towards increased gamma power for the 5-pellet cue was apparent
in both low- and high-gamma bands (Figure 6C) so it is possible that with additional data a small effect
would be detected.
Cross-frequency coupling effects
Although we found no difference in overall signal power, vStr gamma oscillations have several higher-order
features that could in principle be modulated without a change in power. To address this possibility, we
first quantified the apparent tendency for high-gamma to precede low-gamma power by computing the cross-
correlation function of high-gamma power relative to low- gamma power, and comparing it to the distribution
of cross-correlation values obtained from 1000 random time-shifts between the two power time series.
Across all conditions and using an inclusive time window (from 1s before to 3s after nosepoke onset) high-
gamma power was significantly elevated slightly before, but not after, low-gamma power (cross-correlation
peak for high-gamma at -56 ms relative to low-gamma; observed peak Spearman rank correlation of 0.054
is >15 SDs above the mean cross-correlation obtained from the time-shifted samples; Figure 8A). This
asymmetric cross-correlation function was highly robust, with similar shapes for the nosepoke period only
(inset) and with no difference between 1-pellet and 5-pellet trials, again when only data from the nosepoke
19

period was included (both>2 SDs above the mean of the shuffled cross-correlation distributions; Figure 8B).
[Figure 8 about here.]
Next, we quantified the phase-amplitude coupling (PAC) of low- and high-gamma power to the phase of
lower frequencies. Based on previous reports (Leung and Yim, 1993; ?; Cohen et al., 2009a; Lopez-Azcarate
et al., 2013; Donnelly et al., 2014; von Nicolai et al., 2014) we had a priori expectations of PAC to delta
(3-5 Hz), theta (7-9 Hz) and alpha (8-12 Hz) frequency bands (of which delta and theta were apparent as
peaks in the PSDs, Figure 3C). Indeed, using an inclusive time window across all trial conditions, low-
and high-gamma power were modestly but significantly modulated by the phase of delta, theta, and alpha
rhythms (mean power modulations of up to ± 10%, mean vector lengths all z > 2.5, p < 0.003 compared
to time-shuffled distributions of 1000 bootstrap samples; Figure 9). For each low-frequency band, low- and
high-gamma had clearly distinct preferred phases, indicating that these effects do not arise from spurious
relationships to a non-oscillatory transient. Furthermore, preferred phases for both low- and high-gamma
reversed between the delta band on the one hand, and theta and alpha on the other, further demonstrating that
low- and high-gamma power are differentially modulated by lower-frequency rhythms.
[Figure 9 about here.]
To determine if the above phase-amplitude coupling was related to aspects of reward, we separately analyzed
1- and 5-pellet trials specifically during the pre-reward nosepoke period. Because PAC was similar for theta
and alpha rhythms, we only plotted results for the delta and theta bands in this analysis. Relative to delta
phase (3-5 Hz), low-gamma power was significantly phase-locked during 1-pellet trials, but not 5-pellet
trials (1-pellet PACz, 1.87; p = 0.031, 5-pellet PACz, 1.20; p = 0.116). In contrast, high-gamma power was
significantly phase-locked to delta phase during 5-pellet trials, but not 1-pellet trials (1-pellet PACz, 0.91; p
= 0.182, 5-pellet PACz, 1.83; p = 0.034, Figure 10A, right column). In a direct comparison, delta-gamma
PAC was significantly different between 5- and 1-pellet trials for high-gamma, but not low-gamma (low-
20

gamma PAC difference, z-scored relative to identity-shuffled trials, -1.01, p = 0.16; high-gamma 2.07, p =
0.019; positive z-scores indicate larger PAC for 5 pellet trials. Because mean gamma power did not differ
significantly during this period between 1- and 5-pellet trials (Figure 6), this effect is unlikely to arise from
different overall power in the two gamma bands.
To further examine the robustness of delta-gamma PAC, we plotted PACz for both high- and low-gamma us-
ing a moving window of 1.25s (the length of the pre-reward nosepoke period; Figure 10A, left two columns).
The time course for the 1-pellet low-gamma PACz in particular showed some variation between adjacent time
points in the nosepoke period (blue rectangle), suggesting that choosing a slightly different time window for
analysis would result in similar PACz values for 1- and 5-pellet trials. However, for high-gamma, PACz
values for 5-pellet trials were reliably higher than those for 1-pellet trials. In addition, the moving time win-
dow analysis suggests the possibility of slight phase differences between 1- and 5-pellet trials, although the
statistical significance of this is difficult to assess.
[Figure 10 about here.]
In the theta band (7-9 Hz), there was a trend for the opposite dissociation between high- and low-gamma
when comparing 1- and 5-pellet trials. For low-gamma, PACz was marginally significant in the 5-pellet,
but not 1-pellet condition (1-pellet PACz 1.28, p = 0.101; 5-pellet PACz 1.66, p = 0.048). In contrast, for
high-gamma, PACz was significant in the 1-pellet, but not 5-pellet condition (1-pellet PACz 2.21, p = 0.014;
5-pellet PACz 1.33, p = 0.092; Figure 10B). However, although direct comparison of theta-gamma PAC
between the 5- and 1-pellet trials confirmed the differences to be in opposite directions, these differences
did not reach statistical significance (low-gamma PAC difference, z-scored relative to identity-shuffled trials,
0.97, p = 0.17; high-gamma -1.31, p = 0.095; positive z-scores indicate larger PAC for 5 pellet trials. As with
delta-gamma PAC, slight phase shifts between conditions were apparent (Figure 10B).
To further determine if any aspects of cross-frequency coupling in vStr are related to reward per se, we
21

computed the power cross-correlogram and phase-amplitude coupling histograms for the rest periods which
flanked the task (5 minutes before and after the task; recorded on a terra cotta pot filled with towels). Clear
low- and high-gamma oscillations were present during these periods, and were organized in a broadly similar
manner to on-task nosepoke periods (Figure 11). This pattern was not affected when analysis was restricted
to time windows when the rat was stationary, as determined by a movement threshold on the video tracking
data.
[Figure 11 about here.]
Specifically, the cross-correlation between low- and high-gamma power exhibited a clear high-gamma asym-
metry around time zero, as found during pre- reward nosepokes (Figure 11a, compare Figure 8). Moreover,
phase-amplitude coupling in the delta and theta bands was significant and had similar preferred phases to
that during pre-reward nosepoke periods (compare Figure 9). Thus, taken together, it seems that an immo-
bile ”rest” state, compared to active running, is the first-order determinant of vStr gamma oscillations, both
in terms of signal power and cross-frequency coupling. Any effect of reward expectation, behaviorally ex-
pressed as a difference between 1- and 5-pellet trials, had at best subtle modulations of this overall ”resting
state” pattern.
Discussion
There is current interest in ventral striatal local field potentials (LFPs) in both the human and rodent liter-
atures. Human LFP recordings from such a deep structure are generally only obtained in clinical settings,
typically from small groups of patients being treated for drug-resistant depression (Cohen et al., 2009b; Huff
et al., 2010; Bewernick et al., 2010), although there are also case studies exploring vStr as a clinical target for
treatment of obsessive-compulsive disorder (Bourne et al., 2012; Schlaepfer and Bewernick, 2013). Record-
22
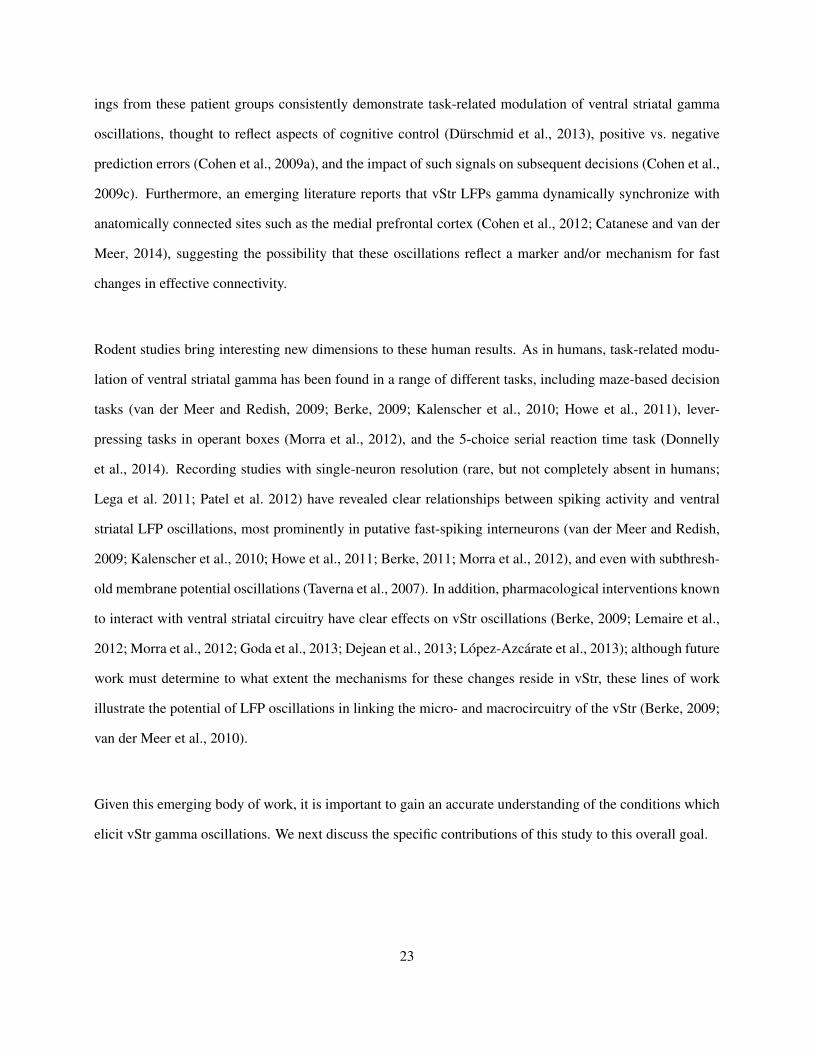
ings from these patient groups consistently demonstrate task-related modulation of ventral striatal gamma
oscillations, thought to reflect aspects of cognitive control (Durschmid et al., 2013), positive vs. negative
prediction errors (Cohen et al., 2009a), and the impact of such signals on subsequent decisions (Cohen et al.,
2009c). Furthermore, an emerging literature reports that vStr LFPs gamma dynamically synchronize with
anatomically connected sites such as the medial prefrontal cortex (Cohen et al., 2012; Catanese and van der
Meer, 2014), suggesting the possibility that these oscillations reflect a marker and/or mechanism for fast
changes in effective connectivity.
Rodent studies bring interesting new dimensions to these human results. As in humans, task-related modu-
lation of ventral striatal gamma has been found in a range of different tasks, including maze-based decision
tasks (van der Meer and Redish, 2009; Berke, 2009; Kalenscher et al., 2010; Howe et al., 2011), lever-
pressing tasks in operant boxes (Morra et al., 2012), and the 5-choice serial reaction time task (Donnelly
et al., 2014). Recording studies with single-neuron resolution (rare, but not completely absent in humans;
Lega et al. 2011; Patel et al. 2012) have revealed clear relationships between spiking activity and ventral
striatal LFP oscillations, most prominently in putative fast-spiking interneurons (van der Meer and Redish,
2009; Kalenscher et al., 2010; Howe et al., 2011; Berke, 2011; Morra et al., 2012), and even with subthresh-
old membrane potential oscillations (Taverna et al., 2007). In addition, pharmacological interventions known
to interact with ventral striatal circuitry have clear effects on vStr oscillations (Berke, 2009; Lemaire et al.,
2012; Morra et al., 2012; Goda et al., 2013; Dejean et al., 2013; Lopez-Azcarate et al., 2013); although future
work must determine to what extent the mechanisms for these changes reside in vStr, these lines of work
illustrate the potential of LFP oscillations in linking the micro- and macrocircuitry of the vStr (Berke, 2009;
van der Meer et al., 2010).
Given this emerging body of work, it is important to gain an accurate understanding of the conditions which
elicit vStr gamma oscillations. We next discuss the specific contributions of this study to this overall goal.
23

Re-examining the behavioral correlates of ventral striatal gamma power changes
Previous rodent studies reported an association of vStr gamma power with reward, based on robust increases
in gamma power around the time of reward delivery, and on differences between rewarded and non-rewarded
trials (van der Meer and Redish, 2009; Berke, 2009; Kalenscher et al., 2010). However, these studies in-
volved freely moving animals running on mazes, and task designs in which contact with reward was highly
correlated with the animal being stationary. In the current study, as in Donnelly et al. (2014), we separated
locomotor/immobility state from reward delivery by inserting a pre-reward nosepoke period. This revealed
that both low- and high-gamma oscillations were prominent during this reward period, aligning to the start
of the nosepoke, which coincides with the animal transitioning from running to being stationary.
Moreover, we found only weak evidence for modulation of gamma-band power by aspects of reward. Rats
exhibited clear behavioral evidence for discriminating between 1-pellet and 5-pellet outcomes prior to arrival
at the reward sites, and we specifically analyzed only those recording sessions in which rats differentiated
behaviorally between these outcomes. Yet, this difference resulted in at best, a non-significant trend when
comparing gamma power during the pre-reward nosepoke in either band between the two reward condi-
tions. In contrast, in either condition separately, we detected a highly significant difference in pre- and
post-nosepoke gamma power, and single units discriminated between the different outcomes. (We did find
small but significant effects of outcome value on phase-amplitude coupling, which are discussed in the next
section.)
Thus, the current results do not support the notion that the clear increases in vStr gamma power observed at
reward sites are in fact reward-related per se. Rather, we suggest that at least in the rodent, rest or immo-
bility is the major factor in stochastically eliciting structured low- and high-gamma oscillations, which can
subsequently be modified in relatively subtle ways by aspects of motivation and reward. This interpretation
is further supported by the similarity of gamma oscillations recorded during off-task rest periods – in the
absence of any reward – to those found during pre-reward nosepokes.
24

A different behavioral correlate of vStr gamma in the literature is associated with movement initiation. Sev-
eral studies have reported elevated striatal low-gamma power before movement initiation (Masimore et al.,
2005; Costa et al., 2006; van der Meer and Redish, 2009). This observation may be consistent with an al-
ternative interpretation that movement is associated with inhibition of gamma oscillations that are free to
occur during immobility or rest, as demonstrated here during the pre-reward nosepoke and off-task periods.
Such a view would be consistent with pathologically elevated gamma oscillations, associated with difficulty
in movement initiation, in Parkinson’s patients (Brown, 2007).
Of course, it is possible that under different conditions, clearer modulation of vStr gamma by reward could
appear. Conditioned responding to reward-predictive cues generally is modulated by vStr in a wide variety
of tasks (Cardinal et al. 2002; Ambroggi et al. 2008; Flagel et al. 2009; although not uniformly across the
vStr, e.g. Ito et al. 2000) however there are also reports that with overtraining, or depending on the nature of
the task, the dependence of conditioned responding on vStr may diminish (Giertler et al., 2004; Clark et al.,
2013; McGinty et al., 2013). Clear examples of outcome value coding in single units (Figure 7), and the
differences in phase-amplitude coupling (Figure 10) further support the interpretation that vStr circuitry was
engaged in a reward-related manner on this task.
Beyond signal power: higher-order properties of ventral striatal gamma
In our results, we did not find significant modulation of gamma power as a function of outcome value
(number of pellets). However, a previous report in humans found that the specific phase coupling of ventral
striatal gamma amplitude to the alpha rhythm signaled the direction of reward prediction errors on a gambling
task (Cohen et al., 2009a). In rodents, gamma amplitude is modulated by theta phase in a manner predictive
of T-maze choice performance (?; in dorsomedial striatum) and related to motor behavior (von Nicolai
et al. 2014; in dorsolateral striatum). Delta-gamma and theta-gamma PAC also occur in the ventral striatum
(Donnelly et al. 2014; earlier anecdotal observations can be seen in Figure 5 in Leung and Yim 1993; Figure
25

1 in Dejean et al. 2013).
In line with these previous results, we found significant PAC of ventral striatal gamma power to the phase
of delta, theta, and alpha rhythms. Overall, high- and low-gamma power had distinct preferred phases, in
line with patterns observed in the hippocampus (Colgin et al., 2009). PAC with the theta and alpha rhythms
was generally similar in magnitude and preferred phase, which was reversed compared to the preferred delta
phase. These results add to the emerging sense that PAC is a ubiquitous feature of cortico-striatal loops
(Lopez-Azcarate et al., 2013) as well as of inputs specific to the ventral striatum. We found statistically
significant differences in the phase-amplitude coupling (PAC) of high-gamma power to the delta rhythm
depending on outcome value. However, the size of this effect was relatively small: first, the overall magnitude
of delta-high gamma PAC was less than 10% of overall gamma power, and the strength of the observed
PAC showed some dependence on the precise choice of time window used for the analysis. Evaluating
the potential significance of these observations would benefit from manipulations of these rhythms during
behavior (see the next section).
Trial-to-trial variability in gamma oscillations and the search for the source
A striking aspect of gamma oscillations on the task was that on the one hand, they appear highly variable,
occurring on one trial but not the next; yet, on the other hand, when they do occur, they do so in a relatively
stereotyped manner, at specific times relative to nosepoke onset. Furthermore, higher-order features such as
the cross-correlation between high- and low-gamma, and coupling of their amplitudes to the phase of lower-
frequency rhythms, were stable. Perhaps most revealingly, these features are also present during off-task rest
periods, in which no specific reward anticipation is present. This is more suggestive of a brain state akin
to the ”default mode network” which as applied to the present task, may be entered stochastically on some
trials, but not others.
26

However, such a view would not explain why high- and low-gamma power appears to change differentially
with experience, both within a session and across sessions (van der Meer and Redish, 2009; Howe et al.,
2011; Lemaire et al., 2012). Perhaps the best way to characterize vStr gamma oscillations at this time
is as a mixture of potentially distinct contributions, of which some can be modified by immediate task
events (witness the small but reliable cue-evoked high-gamma increase during approach), while others are
associated with certain brain states.
In this respect, it is important to note that the sources of gamma oscillations recorded in the vStr have not
been fully determined; in particular, based on the near-zero phase synchrony of vStr gamma with piriform
cortex gamma (Berke, 2009), it is possible at least some gamma is volume-conducted from this known
piriform source (Carmichael and van der Meer, 2015). Nevertheless, several lines of evidence suggest that
this is unlikely to be the full story. Spiking activity of striatal fast-spiking interneurons in particular is
strongly phase-locked in the gamma range (van der Meer et al., 2010), and these oscillations synchronize
with upstream and downstream areas including the medial prefrontal cortex, amygdala, and the pallidum
(Lopez-Azcarate et al., 2013; Dejean et al., 2011, 2013). Finally, the robust gamma oscillations found in the
human vStr against relatively local references are not compatible with volume conduction.
In any case, further work directed at identifying the sources of these potentially distinct components, and
their interactions with anatomically connected regions, neuromodulators, and specific neuron types, will be
required to evaluate whether the study of oscillations can provide new insights into the function of the ventral
striatum.
27

Acknowledgments
We thank Jean Flanagan, Nancy Gibson and Martin Ryan for assistance with animal care and husbandry, and
Andrew Dube, Kronimir Dvorski, Harmen vanderHeide, Jacek Szubra, and Zhenwen Wang for technical
assistance. This work was supported by NSERC, the National Science and Engineering Research Council of
Canada (MvdM: Canada Research Chair and Discovery Grant, SM: Canada Graduate Scholarship - Master’s,
AZ: Undergraduate Student Research Award).
References
Ambroggi, F., Ishikawa, A., Fields, H. L., and Nicola, S. M. (2008). Basolateral amygdala neurons facilitate reward-seeking
behavior by exciting nucleus accumbens neurons. Neuron, 59(4):648–61.
Averbeck, B. B., Lehman, J., Jacobson, M., and Haber, S. N. (2014). Estimates of Projection Overlap and Zones of Convergence
within Frontal-Striatal Circuits. Journal of Neuroscience, 34(29):9497–9505.
Barr, D. J., Levy, R., Scheepers, C., and Tily, H. J. (2013). Random effects structure for confirmatory hypothesis testing: Keep it
maximal. Journal of memory and language, 68(3).
Bates, D., Machler, M., Bolker, B., and Walker, S. (2014). Fitting Linear Mixed-Effects Models using lme4. page 51.
Berke, J. (2005). Participation of striatal neurons in large-scale oscillatory networks. The Basal Ganglia VIII, pages 25–35.
Berke, J. D. (2009). Fast oscillations in cortical-striatal networks switch frequency following rewarding events and stimulant drugs.
European Journal of Neuroscience, 30(5):848–59.
Berke, J. D. (2011). Functional properties of striatal fast-spiking interneurons. Frontiers in Systems Neuroscience, 5(45):1—-7.
Berke, J. D., Okatan, M., Skurski, J., and Eichenbaum, H. B. (2004). Oscillatory Entrainment of Striatal Neurons in Freely-Moving
Rats. Neuron, 43(6):883–896.
Bewernick, B. H., Hurlemann, R., Matusch, A., Kayser, S., Grubert, C., Hadrysiewicz, B., Axmacher, N., Lemke, M., Cooper-
Mahkorn, D., Cohen, M. X., Brockmann, H., Lenartz, D., Sturm, V., and Schlaepfer, T. E. (2010). Nucleus accumbens deep
brain stimulation decreases ratings of depression and anxiety in treatment-resistant depression. Biological psychiatry, 67(2):110–
6.
Bosman, C. A., Lansink, C. S., and Pennartz, C. M. A. (2014). Functions of gamma-band synchronization in cognition: from single
28

circuits to functional diversity across cortical and subcortical systems. European Journal of Neuroscience, pages n/a–n/a.
Bourne, S. K., Eckhardt, C. A., Sheth, S. A., and Eskandar, E. N. (2012). Mechanisms of deep brain stimulation for obsessive
compulsive disorder: effects upon cells and circuits. Frontiers in integrative neuroscience, 6:29.
Brown, P. (2007). Abnormal oscillatory synchronisation in the motor system leads to impaired movement. Current Opinion in
Neurobiology, 17(6):656–664.
Cardinal, R. N., Parkinson, J. A., Hall, J., and Everitt, B. J. (2002). Emotion and motivation: The role of the amygdala, ventral
striatum, and prefrontal cortex. Neuroscience and Biobehavioral Reviews, 26:321–352.
Carmichael, J. and van der Meer, M. A. A. (2015). Unilateral naris occlusion abolishes gamma oscillations in the ventral striatum.
Society for Neuroscience Abstracts.
Catanese, J. and van der Meer, M. A. A. (2014). Cortico-striatal and striato-cortical flow of information are associated with high
and low gamma oscillations respectively. Society for Neuroscience Annual Meeting, Washington D.C.
Clark, J. J., Collins, A. L., Sanford, C. A., and Phillips, P. E. M. (2013). Dopamine encoding of pavlovian incentive stimuli
diminishes with extended training. Journal of Neuroscience, 33(8):3526–32.
Cohen, M. X. (2014). Analyzing Neural Time Series Data. MIT Press, Cambridge, MA.
Cohen, M. X., Axmacher, N., Lenartz, D., Elger, C. E., Sturm, V., and Schlaepfer, T. E. (2009a). Good vibrations: cross-frequency
coupling in the human nucleus accumbens during reward processing. J Cogn Neurosci, 21(5):875–889.
Cohen, M. X., Axmacher, N., Lenartz, D., Elger, C. E., Sturm, V., and Schlaepfer, T. E. (2009b). Neuroelectric signatures of reward
learning and decision-making in the human nucleus accumbens. Neuropsychopharmacology, 34(7):1649–58.
Cohen, M. X., Axmacher, N., Lenartz, D., Elger, C. E., Sturm, V., and Schlaepfer, T. E. (2009c). Nuclei accumbens phase synchrony
predicts decision-making reversals following negative feedback. Journal of Neuroscience, 29(23):7591–8.
Cohen, M. X., Bour, L., Mantione, M., Figee, M., Vink, M., Tijssen, M. A. J., van Rootselaar, A.-F., van den Munckhof, P.,
Schuurman, P. R., and Denys, D. (2012). Top-down-directed synchrony from medial frontal cortex to nucleus accumbens during
reward anticipation. Human brain mapping, 33(1):246–52.
Colgin, L. L., Denninger, T., Fyhn, M., Hafting, T., Bonnevie, T., Jensen, O., Moser, M.-B., and Moser, E. I. (2009). Frequency of
gamma oscillations routes flow of information in the hippocampus. Nature, 462(7271):353–357.
Costa, R. M., Lin, S.-C., Sotnikova, T. D., Cyr, M., Gainetdinov, R. R., Caron, M. G., and Nicolelis, M. A. L. (2006). Rapid
alterations in corticostriatal ensemble coordination during acute dopamine-dependent motor dysfunction. Neuron, 52(2):359–69.
Crespi, L. P. (1942). Quantitative Variation of Incentive and Performance in the White Rat. The American Journal of Psychology,
55(4):467–517.
Day, J. J. and Carelli, R. M. (2007). The nucleus accumbens and Pavlovian reward learning. Neuroscientist, 13(2):148–159.
Day, J. J., Jones, J. L., and Carelli, R. M. (2011). Nucleus accumbens neurons encode predicted and ongoing reward costs in rats.
European journal of neuroscience, 33(2):308–21.
29

Dejean, C., Arbuthnott, G., Wickens, J. R., Le Moine, C., Boraud, T., and Hyland, B. I. (2011). Power fluctuations in beta and
gamma frequencies in rat globus pallidus: association with specific phases of slow oscillations and differential modulation by
dopamine D1 and D2 receptors. Journal of Neuroscience, 31(16):6098–107.
Dejean, C., Boraud, T., and Le Moine, C. (2013). Opiate dependence induces network state shifts in the limbic system. Neurobiology
of disease, 59:220–9.
Donnelly, N. A., Holtzman, T., Rich, P. D., Nevado-Holgado, A. J., Fernando, A. B. P., Van Dijck, G., Holzhammer, T., Paul,
O., Ruther, P., Paulsen, O., Robbins, T. W., and Dalley, J. W. (2014). Oscillatory Activity in the Medial Prefrontal Cortex and
Nucleus Accumbens Correlates with Impulsivity and Reward Outcome. PloS one, 9(10):e111300.
Durschmid, S., Zaehle, T., Kopitzki, K., Voges, J., Schmitt, F. C., Heinze, H.-J., Knight, R. T., and Hinrichs, H. (2013). Phase-
amplitude cross-frequency coupling in the human nucleus accumbens tracks action monitoring during cognitive control. Frontiers
in human neuroscience, 7:635.
Duzel, E., Penny, W. D., and Burgess, N. (2010). Brain oscillations and memory. Current opinion in neurobiology, 20(2):143–9.
Everitt, B. J., Belin, D., Economidou, D., Pelloux, Y., Dalley, J. W., and Robbins, T. W. (2008). Neural mechanisms underlying
the vulnerability to develop compulsive drug-seeking habits and addiction. Philosophical Transactions of the Royal Society of
London B, 363(1507):3125–35.
Flagel, S. B., Akil, H., and Robinson, T. E. (2009). Individual differences in the attribution of incentive salience to reward-related
cues: Implications for addiction. Neuropharmacology, 56 Suppl 1:139–48.
Floresco, S. B. (2014). The Nucleus Accumbens: An Interface Between Cognition, Emotion, and Action. Annual review of
psychology.
Giertler, C., Bohn, I., and Hauber, W. (2004). Transient inactivation of the rat nucleus accumbens does not impair guidance of
instrumental behaviour by stimuli predicting reward magnitude. Behavioural Pharmacology, 15(1):55–63.
Goda, S. A., Piasecka, J., Olszewski, M., Kasicki, S., and Hunt, M. J. (2013). Serotonergic hallucinogens differentially modify
gamma and high frequency oscillations in the rat nucleus accumbens. Psychopharmacology, 228(2):271–82.
Haber, S. N. (2009). Anatomy and connectivity of the reward circuit. In Dreher, J.-C. and Tremblay, L., editors, Handbook of
Reward and Decision Making, pages 3–27. Academic Press.
Howe, M. W., Atallah, H. E., McCool, A., Gibson, D. J., and Graybiel, A. M. (2011). Habit learning is associated with major shifts
in frequencies of oscillatory activity and synchronized spike firing in striatum. Proceedings of the National Academy of Sciences,
108(40):16801–6.
Huff, W., Lenartz, D., Schormann, M., Lee, S.-H., Kuhn, J., Koulousakis, A., Mai, J., Daumann, J., Maarouf, M., Klosterkotter, J.,
and Sturm, V. (2010). Unilateral deep brain stimulation of the nucleus accumbens in patients with treatment-resistant obsessive-
compulsive disorder: Outcomes after one year. Clinical neurology and neurosurgery, 112(2):137–43.
Humphries, M. and Prescott, T. (2010). The ventral basal ganglia, a selection mechanism at the crossroads of space, strategy, and
reward. Progress in Neurobiology, 90(4):385–417.
30

Ito, M. and Doya, K. (2015). Distinct Neural Representation in the Dorsolateral, Dorsomedial, and Ventral Parts of the Striatum
during Fixed- and Free-Choice Tasks. Journal of Neuroscience, 35(8):3499–3514.
Ito, R., Dalley, J. W., Howes, S. R., Robbins, T. W., and Everitt, B. J. (2000). Dissociation in Conditioned Dopamine Release in
the Nucleus Accumbens Core and Shell in Response to Cocaine Cues and during Cocaine-Seeking Behavior in Rats. Journal of
Neuroscience, 20(19):7489–7495.
Janabi-Sharifi, F., Hayward, V., and Chen, C.-S. (2000). Discrete-time adaptive windowing for velocity estimation. IEEE Transac-
tions on Control Systems Technology, 8(6):1003–1009.
Kalenscher, T., Lansink, C. S., Lankelma, J. V., and Pennartz, C. M. A. (2010). Reward-associated gamma oscillations in ventral
striatum are regionally differentiated and modulate local firing activity. Journal of Neurophysiology, 103(3):1658–72.
Kalivas, P. W. and Volkow, N. D. (2005). The Neural Basis of Addiction: A Pathology of Motivation and Choice. Am J Psychiatry,
162:1403–1413.
Kloosterman, F., Davidson, T. J., Gomperts, S. N., Layton, S. P., Hale, G., Nguyen, D. P., and Wilson, M. A. (2009). Micro-drive
array for chronic in vivo recording: drive fabrication. Journal of visualized experiments : JoVE, (26).
Lega, B. C., Kahana, M. J., Jaggi, J., Baltuch, G. H., and Zaghloul, K. (2011). Neuronal and oscillatory activity during reward
processing in the human ventral striatum. Neuroreport, 22(16):795–800.
Lemaire, N., Hernandez, L. F., Hu, D., Kubota, Y., Howe, M. W., and Graybiel, A. M. (2012). Effects of dopamine depletion on
LFP oscillations in striatum are task- and learning-dependent and selectively reversed by L-DOPA. Proceedings of the National
Academy of Sciences of the United States of America, 109(44):18126–31.
Leung, L. S. and Yim, C. Y. (1993). Rhythmic delta-frequency activities in the nucleus accumbens of anesthetized and freely moving
rats. Canadian journal of physiology and pharmacology, 71(5-6):311–20.
Leventhal, D. K., Gage, G. J., Schmidt, R., Pettibone, J. R., Case, A. C., and Berke, J. D. (2012). Basal Ganglia Beta oscillations
accompany cue utilization. Neuron, 73(3):523–36.
Lisman, J. and Jensen, O. (2013). The Theta-Gamma Neural Code. Neuron, 77(6):1002–1016.
Lopez-Azcarate, J., Nicolas, M. J., Cordon, I., Alegre, M., Valencia, M., and Artieda, J. (2013). Delta-mediated cross-frequency
coupling organizes oscillatory activity across the rat cortico-basal ganglia network. Frontiers in neural circuits, 7:155.
Mailly, P., Aliane, V., Groenewegen, H. J., Haber, S. N., and Deniau, J.-M. (2013). The Rat Prefrontostriatal System Analyzed in
3D: Evidence for Multiple Interacting Functional Units. Journal of Neuroscience, 33(13):5718–5727.
Masimore, B., Schmitzer-Torbert, N. C., Kakalios, J., and Redish, A. D. (2005). Transient striatal [gamma] local field potentials
signal movement initiation in rats. NeuroReport, 16(18):2021–2024.
McGinty, V. B., Lardeux, S., Taha, S. A., Kim, J. J., and Nicola, S. M. (2013). Invigoration of reward seeking by cue and proximity
encoding in the nucleus accumbens. Neuron, 78(5):910–22.
Morra, J. T., Glick, S. D., and Cheer, J. F. (2012). Cannabinoid receptors mediate methamphetamine induction of high frequency
31

gamma oscillations in the nucleus accumbens. Neuropharmacology, 63(4):565–74.
Nicola, S. M. (2010). The Flexible Approach Hypothesis: Unification of Effort and Cue-Responding Hypotheses for the Role of
Nucleus Accumbens Dopamine in the Activation of Reward-Seeking Behavior. Journal of Neuroscience, 30(49):16585–16600.
Oostenveld, R., Fries, P., Maris, E., and Schoffelen, J.-M. (2011). FieldTrip: Open source software for advanced analysis of MEG,
EEG, and invasive electrophysiological data. Computational intelligence and neuroscience, 2011:156869.
Patel, S. R., Sheth, S. A., Mian, M. K., Gale, J. T., Greenberg, B. D., Dougherty, D. D., and Eskandar, E. N. (2012). Single-neuron
responses in the human nucleus accumbens during a financial decision-making task. Journal of Neuroscience, 32(21):7311–5.
R Core Development Team (2013). R: A Language and Environment for Statistical Computing.
Robbins, T. W. and Everitt, B. J. (1996). Neurobehavioural mechanisms of reward and motivation. Current opinion in neurobiology,
6(2):228–36.
Roesch, M. R., Singh, T., Brown, P. L., Mullins, S. E., and Schoenbaum, G. (2009). Ventral striatal neurons encode the value of the
chosen action in rats deciding between differently delayed or sized rewards. Journal of Neuroscience, 29(42):13365–13376.
Salamone, J. D., Correa, M., Farrar, A., and Mingote, S. M. (2007). Effort-related functions of nucleus accumbens dopamine and
associated forebrain circuits. Psychopharmacology, 191(3):461–82.
Schlaepfer, T. E. and Bewernick, B. H. (2013). Deep brain stimulation for major depression. Handbook of clinical neurology,
116:235–43.
Sesack, S. R. and Grace, A. A. (2010). Cortico-Basal Ganglia reward network: microcircuitry. Neuropsychopharmacology,
35(1):27–47.
Taverna, S., Canciani, B., and Pennartz, C. M. A. (2007). Membrane properties and synaptic connectivity of fast-spiking interneu-
rons in rat ventral striatum. Brain Res, 1152:49–56.
van der Meer, M. A. A., Kalenscher, T., Lansink, C. S., Pennartz, C. M. A., Berke, J. D., and Redish, A. D. (2010). Integrating early
results on ventral striatal gamma oscillations in the rat. Frontiers in Neuroscience, 4:28.
van der Meer, M. A. A. and Redish, A. D. (2009). Low and High Gamma Oscillations in Rat Ventral Striatum have Distinct Rela-
tionships to Behavior, Reward, and Spiking Activity on a Learned Spatial Decision Task. Frontiers in Integrative Neuroscience,
3:9.
van der Meer, M. A. A. and Redish, A. D. (2011). Theta phase precession in rat ventral striatum links place and reward information.
Journal of Neuroscience, 31(8):2843–2854.
Vandecasteele, M., M, S., Royer, S., Belluscio, M., Berenyi, A., Diba, K., Fujisawa, S., Grosmark, A., Mao, D., Mizuseki, K., Patel,
J., Stark, E., Sullivan, D., Watson, B., and Buzsaki, G. (2012). Large-scale recording of neurons by movable silicon probes in
behaving rodents. Journal of visualized experiments : JoVE, (61):e3568.
von Nicolai, C., Engler, G., Sharott, A., Engel, A. K., Moll, C. K., and Siegel, M. (2014). Corticostriatal coordination through
coherent phase-amplitude coupling. Journal of Neuroscience, 34(17):5938–48.
32

Figure 1: Behavioral apparatus and task epochs. A: Rats shuttled back and forth on an 1.8m lineartrack, with food pellet reward receptacles at each end. To obtain reward, rats were required to holda nosepoke for 500ms. The number of pellets received was signaled by audio cues, presentedwhen rats traversed a specific location near the center of the track (jittered by a random distanceof up to 15 cm on a trial by trial basis, to prevent cue onset from being predictable to the rats),and played from a speaker placed behind the currently rewarded receptacle. B: Data analysiscenters primarily on two task epochs: the time around cue presentation (comparing 0.5s before to0.5s after) and the time of the nosepoke (0 to 1.25s from nosepoke onset). Note that food rewardpellets take a minimum of 0.75s following reward trigger to arrive in the receptacle, resulting in aperiod of at least 1.25s in which rats are relatively immobile, nosepoking into the receptacle withoutmaking contact with the reward or engaging in consummatory responses.
33

Figure 2: Rats successfully discriminated between reward-predictive audio cues as indicated bysystematic differences in running speed. A: Average speed profiles (for all 4 rats, 25 sessions total,value block only) around the time of cue presentation, at t = 0, for the 1-pellet cue (red, 725 trials),3-pellet cue (green, 362 trials) and 5-pellet cue (blue, 727 trials). As a group and individually, ratsran faster in response to the 5-pellet cue than the 1-pellet cue; responses to the 3-pellet cue weremore mixed. Running speeds from each session were z-scored to enable averaging across ratsand sessions with different baseline running speeds. Only sessions in which rats ran faster for the5-pellet cue than the 1-pellet cue were included for further analysis (16/25 sessions). B: Averagespeed profiles for each individual rat. Color key as in (A), number of trials indicated in parentheses.
34

Figure 3: Clear high- and low-gamma oscillations were recorded from the ventral striatum. A:Schematic of final electrode locations (open symbols) and approximate depths from which record-ings were obtained (vertical lines). Most recordings were obtained from the nucleus accumbenscore, and some from the ventral caudate-putamen. Insets show example stained brain sectionswith electrolytic lesions at the electrode tips (arrows). B: Power spectral densities for all four rats,taken during the nosepoke period (0 to 1.25s from nosepoke onset), show robust, distinctive high-and low-gamma peaks above the overall 1/f shape. C: Close-ups of power spectral densities in thelow frequency range (1-15 Hz) for the cue (left, 0.5s before to 0.5s after cue onset) and nosepoke(right) periods. Some evidence for delta (∼4 Hz) and theta (∼8 Hz) can be seen, particularly duringthe cue window (left)
.
35

Figure 4: Example raw local field potential (LFP) traces (top) and spectrograms (bottom) for 5-pellet trials of two representative sessions (from R014, left, and R016, right). Traces are alignedto the time of nosepoking (t = 0). Intervals of time in which signal power exceeded 2 SDs abovethe mean are highlighted in green (for high-gamma, 70-85 Hz) and red (for low-gamma, 50-65 Hz).Spectrograms were computed using a 15-cycle frequency-dependent time window, and normalizedrelative to a baseline window (from -2 to 0 seconds, this level is “1” on the color scale). Note theoverall increase in high- and low-gamma power relative to baseline, the trial-to-trial variability inthe occurrence or lack thereof of gamma oscillations, and the relatively stereotyped timing whenoscillations do occur (around the time of the nosepoke for the left example; in two groups for theright example). Analysis parameters for this figure were chosen for illustration purposes only.
36

Figure 5: Low-gamma (red) and high-gamma power (green) are modulated by cue and nosepokeevents. A: Raw, cue-aligned power shows a gradual decrease in low-gamma power and a gradualincrease in high-gamma power as rats run the track (recall that the cue is presented in the centerof the track). After approximately 1.2 seconds increases in both power bands can be seen whichare associated with the nosepoke, and are more clearly visible in panels C and D. B: baseline-corrected nosepoke-aligned power shows a small but significant (for high-gamma, see main text)increase in response to the cue. Power was normalized by dividing each trial’s data by the averagepower for that trial in the 0.5s preceding cue presentation (thus, this baseline level is “1” on thevertical axis). C: Raw, nosepoke-aligned power shows a larger, specific pattern of phasic increasesin high-gamma power followed by low-gamma power. Note that food pellet reward only arrives at1.25s or later. D: Normalizing by the 0.5s window prior to cue presentation shows a similar timecourse, with the powers rescaled. Shaded areas indicate SEMs, whose large size reflects thelarge trial-by-trial variability inherent in ventral striatal gamma oscillations. All trials (1886 total)were included for this analysis.
37

Figure 6: Low- and high-gamma power are not reliably affected by expectation of 1-pellet com-pared to 5-pellet outcomes. A: Mean low-gamma power, aligned to time of pre-reward nosepokeonset (t = 0), and baseline-normalized to the pre-cue period (-0.5 to 0s) for 1-pellet trials (dashedline, 482 trials) and 5-pellet trials (solid line, 470 trials). Note that despite high variability, the overallshape of modulation is preserved between 1-pellet and 5-pellet trials; average power in the 0-1.25stime window following the nosepoke was slightly higher for 5-pellet than 1-pellet trials (1p 1.14 ±0.31, 5p 1.20 ± 0.34) but this difference was not statistically significant. Shaded area indicatestimes at which rats interacted with reward pellets. B: As in (A), but for high-gamma power. Av-erage power during the nosepoke period was again slightly higher for 5-pellet than 1-pellet trials,without reaching significance (1p 1.42 ± 0.39, 5p 1.50 ± 0.47, n.s.). C: Summary of results in (A)and (B).
38

Figure 7: Single units in ventral striatum discriminate between different outcomes. Three exam-ple units (waveforms across tetrode wires, inset) recorded from two sessions, also included in themain analysis, which showed firing rate differences between 1-pellet (orange) and 5-pellet (blue)outcome trials. Firing rates are binned at 100ms and aligned to the cue (top, dotted line at timezero) or nosepoke (bottom). Grey bars show the average firing rate across all cues in the ses-sion. As shown previously, individual units in the ventral striatum align to different time points inthe task, and may show increases (left, right panels) or decreases (middle panel) with outcomevalue. Units are R016-2012-10-03-TT02-1 (left), R016-2012-10-01-TT03-1 (middle), andR016-2012-10-01-TT05-3 (right).
39

Figure 8: Increases in high-gamma power reliably precede low-gamma power, independent ofexpected outcome. A: Main plot shows the observed cross-correlation function of high-gammapower relative to low-gamma power (blue line) for all trials and a wide time window (-1 to 3s relativeto nosepoke onset; 1886 trials). Both power time series were obtained by squaring the envelope ofthe Hilbert transform and rank-transforming the result to reduce the impact of outliers. To assessthe significance of the observed cross-correlations, the cross-correlation function was compared toa distribution obtained from 1000 time-shifted bootstrap samples (mean and SD, solid and dashedblack lines). The peak at -56ms and the overall asymmetric shape, many SDs away from the meanof the shuffled distribution, indicates that on average, high-gamma power tends to precede, butnot follow, low-gamma power. This asymmetry was robust against the specific time window used:(Inset) shows all trials analyzed during the nosepoke window only (0 to 1.25s relative to nosepokeonset). B: As A, but across trial conditions (blue: 1-pellet, 470 trials; orange: 5-pellet, 482 trials)and during the nosepoke window only.
40

Figure 9: Low- and high-gamma power are modestly, but significantly modulated by the phase ofdelta, theta, and alpha rhythms. Shown are histograms for gamma power (top row: low-gamma;bottom row: high-gamma) as a function of phase in the delta (left column), theta (middle) and alpha(right) frequency bands, computed over a time window from -1 to 3s relative to nosepoke onsetusing all trials (n = 1886). Gamma power in each phase bin was divided by average gamma power,so that the depth of phase modulation can be compared across frequency bands: for instance, avalue of 1.1 indicates power 10% above the mean. Significance was assessed by comparing theobserved mean vector length to the distribution of mean vector lengths obtained from randomlytime-shifting the power and phase time series relative to one another (1000 bootstrap samples) toyield a z-score (PACz, Cohen 2014).
41

Figure 10: Phase-amplitude coupling across 1- and 5-pellet trials. A: Low (red, top) and high-gamma (green, bottom) amplitude relative to delta (3-5 Hz) phase. Left and middle columns showPACz using a moving window of 1.25s, for 1-pellet and 5-pellet trials respectively. Arrows at eachtime point indicate the phase of the mean vector (lengths are all the same), and PACz valuesindicate the strength of the mean relative to a distribution of 1000 randomly shuffled samples.Highlighted rectangles from 0 to 1.25s indicate the nosepoke period (blue: 1-pellet trials; orange:5-pellet trials), for which the full observed phase-amplitude distributions are shown in the rightcolumn. B: As in A, but for theta (7-9 Hz) phase.
42

Figure 11: Cross-frequency coupling of low- and high-gamma during rest is similar to that duringpre-reward nosepoke periods. A: Cross-correlation function of high-gamma power relative to low-gamma, as in Figure 8. Note the characteristic asymmetric shape of high-gamma preceding low-gamma is preserved (peak >3 SDs above the mean obtained from 1000 bootstrap shuffles, p <0.001). B: Phase-amplitude coupling of low-gamma (red, top row) and high-gamma power (green,bottom row) to the delta (left column) and theta (right column) frequency bands; all significantrelative to shuffled distribution. PACz values and preferred phases are similar to those obtainedduring pre-reward nosepokes (compare Figure 9).
43