Embed Size (px)
Citation preview

J Am Acad Audiol 16:747–762 (2005)
747
*Widex Office of Research in Clinical Amplification, Widex Hearing Aid Company
Francis Kuk, Ph.D., Widex Office of Research in Clinical Amplification, 2300 Cabot Drive, Suite 415, Lisle, IL 60532;Phone: 630-245-0025; Fax: 630-245-0141; E-mail: [email protected]
Vent Configurations on Subjective andObjective Occlusion Effect
Francis Kuk*Denise Keenan*Chi-chuen Lau*
Abstract
The current study reexamined the effect of vent diameters on objective andsubjective occlusion effect (OE) while minimizing two possible sources ofvariability. Nine hearing-impaired participants with primarily a high-frequencyhearing loss were evaluated. Laser shell-making technology was used tomake ear inserts of completely-in-the-canal (CIC) hearing aids for the study.This was to minimize any potential slit leakage from the inserts. The ventdimensions were systematically altered during the study. Participants sustained/i/ for 5 sec, and the real-ear occluded response was measured with a custom-made program that performed frequency averaging to reduce responsevariability. Participants also repeated the phrase “Baby Jeannie is teeny tiny”and rated their own voice. The results showed a systematic change in theobjective OE and subjective ratings of OE as the vent diameter was modified.Furthermore, a significant correlation was seen between subjective rating andobjective occlusion effect.
Key Words: Laser shell-making, occlusion effect, reverse horn vent, subjectiveocclusion ratings, vent
Abbreviations: AE = ampclusion effect; CIC = completely in the canal; OE= occlusion effect; REORvoc = real-ear occluded response during vocalization;REURvoc = real-ear unoccluded response during vocalization; RMS = root meansquare
Sumario
El actual estudio re-examinó el efecto de los diferentes diámetros en el orificiode ventilación sobre el efecto de oclusión (OE), objetiva y subjetivamente,minimizando dos posibles fuentes de variabilidad. Se evaluó a nueveparticipantes hipoacúsicos con pérdidas auditivas primariamente en las altasfrecuencias. Se utilizó una tecnología laser de fabricación de conchas paraproducir, para el estudio, dispositivos de inserción de auxiliares auditivoscompletamente en el canal (CIC). Esto se hizo para minimizar cualquier fugade hendidura de los insertos. Las dimensiones de orificio de ventilación fueronsistemáticamente alteradas durante el estudio. Los participantes produjeronuna /i/ sostenida por 5 segundos, y se midieron las respuestas ocluidas deoído real con un programa hecho a la medida que realizaba promediacionesde la frecuencia para reducir la variabilidad en la respuesta. Los participantestambién repitieron la frase “Baby Jeannie is teeny tiny” y calificaron su propiavoz. Los resultados mostraron un cambio sistemático en las apreciacionesobjetivas y subjetivas del OE conforme se modificó el tamaño del orificio deventilación. Más aún, se vio una correlación significativa entre la apreciaciónsubjetiva y el efecto objetivo de oclusión.

Journal of the American Academy of Audiology/Volume 16, Number 9, 2005
748
Ampclusion effect (AE; Painton, 1993),or the perception of hollowness inone’s own voice during vocalization
with hearing aid wear, is a common complaintof hearing aid wearers. The incidence of sucha complaint varied among surveys from 30%(Dillon et al, 1999) to 60% (Lazenby et al,1986). One possible reason for such acomplaint is that the low-frequency soundpressure level (SPL) that is produced duringvocalization remains trapped within the earcanal when it is occluded, thus giving thecomplaints of “hollowness,” “talking througha barrel,” “echoic”—descriptors that arefrequently associated with excessive low-frequency energy (Jenstead et al, 2003).
The portion of the AE that originatesfrom the hearing aid shell that occludes theear canal is termed the occlusion effect (OE).Typically, the OE is measured as thedifference between the real-ear unaidedresponse during vocalization (REURvoc) andthe real-ear occluded response duringvocalization (REORvoc) in the low frequencieswhen the wearer vocalizes (Revit, 1992). Onecommon approach to reducing the OE is toenlarge the vent diameter of the hearing aidshell or earmold. Typically, the performanceof a vent is determined by its acoustic mass(Dillon, 2001), which is directly proportionalto the length of the vent and indirectlyproportional to the square of the ventdiameter. The acoustic effect of thesedimensional changes on hearing aid outputhas been reported on coupler or simulated earmeasures (Valente et al, 2000) and real ears(Tecca, 1992; Kuk, 1994) where standardsignals like sinusoids and speech-shapedcomplex noises are used as the test signals.
On the other hand, reports on the effectof vent dimensions on the occlusion effect(both subjective and objective) had beenmixed. One of the difficulties in studying theocclusion effect was that human vocalizationwas used as the stimulus. During real-ear
occlusion measurements, test subjects wereinstructed to sustain their vocalization for afixed duration. They may differ in their vocalefforts as well as how long they can sustainvocalization. Furthermore, individual subjectsmay show fluctuation in their voice levels.This may have led to conflicting resultsamong studies.
For example, Revit (1992) showed thata 2 mm vent would reduce the occlusion effectat 200 Hz by about 8 dB. Westermann (1987)also showed that a 2 mm vent would reducethe majority of OE. On the other hand, Kampeand Wynne (1996) showed no systematiceffect of vent diameter on the objective OE(measured with Frye 6500 real-ear system)although their ten normal-hearing subjectsreported less occlusion as the vent diameterincreased from 0.79 mm to 2.36 mm. However,no correlation was observed betweensubjective ratings of own voice quality andobjective OE. Similarly, Sweetow and Valla(1997) also reported no correlation betweensubjective ratings of OE and objectivemeasure of OE.
There are at least two other reasonswhy observations on the OE may beinconsistent. One is the potential of slit vent,or unintentional leakage around the hearingaid shell or earmold. In the conventionalshell-making process, an earmold impressionis waxed before it is cast to create the shell.Depending on how long it has been immersedin the wax, the skill of the technicians, etcetera, shells made with the same impressionbut with different thickness of wax wouldresult in shells or earmolds that havedifferent amounts of slit leakage when worn(Cortez et al, 2004). And if the amount of slitis significantly larger than the leakagecreated by the vent diameter, any changes inthe vent diameter may not be evident (i.e., noeffect). For example, consider the effect of a0.05 mm slit between the shell and the earcanal wall. If one assumes that the faceplate
Palabras Clave: Fabricación laser de conchas, efecto de oclusión, orificio deventilación de cuerno inverso, calificaciones subjetivas de oclusión, orificio deventilación
Abreviaturas: AE = efecto de amplificación-oclusión; CIC = completamenteen el canal; OE = efecto de oclusión; REORvoc = respuesta ocluida en oídoreal durante la vocalización; REURvoc = respuesta no ocluida en oído real durantela vocalización; RMS = raíz media cuadrada

749
Vent Configurations on Occlusion Effect/Kuk et al
is circular and the individual’s ear canal hasa diameter of 10 mm, the surface area of theear canal would be π (5)2 or 25 π. A slit ventof 0.05 mm would mean that the surface areaof the faceplate becomes π (4.975)2 or 24.75π. This is a difference of 0.25 π in the surfacearea, or a vent with a radius of about 0.5mm (0.25)0.5 or a diameter of 1.0 mm (twotimes the radius)! Using the same calculation,a slit of 1 mm would have the equivalentresult as a 4.4 mm vent diameter. If thechanges in the vent diameter are smallerthan that of the slit vent, the effect of thosechanges would not be easily observable. Thismay partly explain the between-subjectvariability in the noted OE. Tecca (1991) andPirzanski (1998) also indicatedmanufacturing variability and the presenceof uncontrolled slit leakage as one reason forvariable OE. Thus, it is critical that all theearmolds/shells used for these types of studiesmust not only be identical, but also not allowany unintentional leakage. This criterionmay not have been easily met until recentlywhere laser technology has been applied inhearing aid shell making (Cortez et al, 2004),in which one of the advantages is that theshells made from ear impressions that areprepared for shell fabrication are exact replicaof the ear impressions in all dimensions.Thisoffers an opportunity to reexamine the effectof vent changes.
Measurement error is another possiblereason for the observed variability in themeasured OE. Typically, during OEmeasurement with commercial real-earsystems of the REORvoc and REURvoc, theloudspeaker is turned off, and wearers areasked to maintain their vocalization (of /i/)until the online, instantaneous spectraldisplay on the computer monitor “is relativelystable.” In some commercial units, theinstantaneous overall SPL in the lowfrequencies is displayed. Regardless of thesystems used, the audiologist “freezes” thescreen (i.e., stops the sample-and-displayprocess) when a good or reasonable displayis shown and reports the difference in themagnitude between the REORvoc and theREURvoc as the OE (e.g., Revit 1992; Sweetowand Valla, 1997).
Despite the best attempts in monitoringthe subject’s vocal effort through instructionsand the use of sound level meters as visualmonitors, it is difficult for any human subjectsto maintain the same level of vocal output
during the course of vocalization. It is possiblethat minor fluctuation in the wearer’s voiceoccurs to result in a change in the measuredspectrum or overall low-frequency energy ofthe vocal production. This is especially trueif the vocalization is sustained over a longperiod of time.Voice level monitoring may notbe sufficient to record a reliable (orrepeatable) response if only a sample of theoutput is measured (such as freezing thescreen). Recording of the sample over a periodof time and averaging of the responses wouldbe necessary to obtain a reliable measure. Forexample, Kampe and Wynne (1996) measuredthe OE with a Frye 6500 real-ear analyzer inten normal-hearing subjects during theirvocalization of /i/ and /u/ while they changedthe vent diameter of a lucite skeleton earmoldfrom 0.79 mm to 2.36 mm. The authors frozethe screen once the real-ear spectral displaywas “relatively stable.” Two separaterecordings were averaged for themeasurement. Their subjects also read the“Rainbow passage” and rated their voice ona 1–5 scale. These authors saw largevariability in the measured OE and did notobserve any consistent pattern of occlusionreduction with vent diameters. Althoughtheir subjects reported less hollowness whenthe vent diameter was increased, nocorrelation was found between subjectiverating of occlusion and objective occlusioneffect. The authors raised the possibility thatthe lack of a consistent relationship wasprobably due to their use of commercial real-ear system to “freeze” the response whereassome averaging of the response may improvetheir observation. Any studies of vent effectson occlusion must ensure good repeatabilityof the measured responses.
The purpose of the current study was tostudy the effect of vent dimensions on theobjective (such as measured increase in low-frequency SPL in the ear canal) andsubjective (such as hollowness ratings)occlusion effect while minimizing some ofthe limitations encountered in previousstudies. Specifically, efforts will be made tominimize the variability due to unintentionalleakage and sampling variability. In additionto studying vents with a uniform diameter,vents with multiple sections of varyingdiameters will also be studied in order tounderstand how some vent systems (e.g.,reverse horn vent which increases itsdiameter medially) achieve their functions.

Journal of the American Academy of Audiology/Volume 16, Number 9, 2005
750
Consequently, the objectives of this studywere to determine:
1. The relationship between ventdimensions and occlusion effect whilethe vent diameter of a CIC (completely-in-the-canal) insert that terminated atthe second bend was systematicallychanged from 0 mm to 3 mm throughout,including intermediate configurationsapproximating reverse horn vents ofdifferent dimensions;
2. The relationship between objectiveocclusion effect and subjective rating ofhollowness;
3. The test-retest reliability of objectiveocclusion measurement.
METHOD
Study Participants
Nine adult hearing-impaired listenersparticipated in the study. Their mean agewas 67.9 years (ranged from 55 yr. to 79 yr.).All but one had a mild-to-moderately severebilaterally symmetrical (within 10 dB) high-frequency sensorineural hearing loss. Thisparticipant (#9) had otosclerosis and exhibiteda mild mixed loss (air-bone gap about 15 dBacross frequencies, middle ear compliance of0.6 ml). Because her data were similar tothe other participants’ data, they wereincluded in all subsequent reporting. The
individual audiograms for the right ear ofeach participant are shown in Figure 1. Fivewere experienced hearing aid users (rangedfrom 1 to 3 yr.). All participants had normalmiddle ear functions as verified withtympanometry and middle ear compliancemeasurements (ranging from 0.3 ml to 1.3 ml)using the GSI-38 screening tympanometer.Although no hearing aids were actuallyevaluated in this study, all participants woretwo vented versions of binaural Senso DivaCIC hearing aids home for at least one monthprior to the study. In one version, a uniform1.5 mm diameter vent was used, while theother version had a 1.5 mm diameter on thelateral surface that belled out to a 3–4 mmdiameter on the medial opening. All theparticipants signed an informed consent priorto their enrollment and were blind to thepurpose of the study.
Equipment Setup
The purpose of the study was to measurethe occlusion effect (defined as the increasein low-frequency energy between the open-earand the occluded ear conditions duringvocalization, e.g., Revit, 1992) of differentvent configurations. The Frye 6500 Real-EarSystem was used to transduce the real-earoutput during vocalization. Instead of“freezing” the instantaneous display on theFrye monitor and using that spectral displayfor analysis, the commercial real-ear systemwas used as a conduit to direct the real-earoutput from the remote module of the real-ear system to the “Line In” of a Compaq Evocomputer sound card that had a 16-bitresolution (or a dynamic range of 96 dB).This way, we were able to frequency-averagethe recorded output via a custom MATLABprogram for a more stable measure.
The MATLAB program was written sothat the recorded output was above the noisefloor but did not exceed the upper limit of thesound card so as to create saturationdistortion. The maximum and minimumvalues that could be stored (+/- 32768, or 216/2) were first estimated. The gain settingson the Fonix 6500 remote module and the“Line In” of the computer sound card wereadjusted (and fixed afterwards) so that theoutput of the sound card did not reachsaturation with input as high as 90 dB SPL.Each day prior to data collection, the gainsettings were verified with a calibration
Figure 1. Individual audiograms for the right ear ofstudy participants. Each line is the audiogram of oneparticipant (identified by number).

Vent Configurations on Occlusion Effect/Kuk et al
751
program written in MATLAB. The probemicrophone was placed in the sound booth 50cm from a loudspeaker (Cerwin-Vega). A 60dB HL white noise from a clinical audiometer(GSI 61) was presented. The average RMS(root mean square) of the recording wasmeasured and compared to the RMS level ofthe original calibration.The amplifier settingon the Fonix 6500 remote module wasadjusted until the RMS level was within +/- 0.5 dB.
A custom MATLAB program was writtento capture and analyze the recording. Thisprogram collected the real-ear acousticwaveforms and saved them on the hard drivefor off-line analysis. The MATLAB programwas written to accept 5 sec of the participant’svocal production at a sampling rate of 22kHz and a resolution of 256 bins (andbandwidth of 86 Hz). During the analysis, theprogram discarded the first sec and used themiddle 3 sec for analysis. A Fourier analysiswas first performed on each sampled responsein order to transform the sample into thefrequency domain. The spectra that wereformed were then averaged over the course of the 3 sec to result in one averagedspectrum. Monthly calibration of all testequipment was conducted in addition to dailycalibration checks during the course of thestudy.
Stimuli
Self-vocalization of /i/ was used as thestimulus to examine the effect of ventconfigurations.This vowel was chosen becauseit has the lowest F1 formant frequency, whichwould make it ideal to study the occlusioneffect. For each vent condition, participantsvocalized at a normal vocal effort andsustained /i/ for 5 sec. A Radio Shack soundlevel meter (Model 33-2050) was placed at 12"from the participants’ mouths, and they wereinstructed to maintain their voices around the“0” VU reading. The voice levels of all theparticipants were at least 70 dB SPLmeasured at that distance. All participantspracticed vocal production until they wereable to consistently peak the VU at “0” priorto any data collection. In addition, the testaudiologist also monitored the pitch level ofthe participants’ production. They werealerted to any shifts in their pitch duringthe production; if so, a new recording wasmade for that condition. At the end of eachvocal production, participants also judged
the hollowness of their own voice using a1–10 point scale with “1” reflecting extremelyhollow voice quality and “10” natural voicequality without any hollowness. Participantsrepeated the phrase “Baby Jeannie is teenytiny” as many times as they felt necessary ata normal vocal effort for this subjective ratingtask.
Ear Inserts
Custom ear inserts resembling a CIChearing aid shell were made for eachparticipant.At the initial visit, an impressionof the participant’s right ear was taken usingsilicon impression material. The impressionwas then sent to our shell lab where theinserts were made using Widex’s proprietarylaser shell-making technology (Cortez et al,2004). Briefly, this was a new shell-makingapproach whereby a laser scanner was usedto scan the impression for a “wire-frame” ofthe impression with a precision of 1/10 mm.The image was then saved digitally. It wassubsequently manipulated by a “modeling”technician who designed the layout of thecircuitry within the shell as well as thecharacteristics of the shell including the ventdimensions. The “modeled” shell was thensent to a “printer” that fabricated the shellsusing a method called SLA (StereoLithographic Apparatuses).The advantage ofusing laser technology for shell making overconventional shell making is the precision thistechnology offers. Because of individualtechnician differences, shells made withconventional approaches were more variablethan shells made with laser shell-makingtechnology (see Cortez et al, 2004, for areview). Because the objective of this studywas to study the dimensional effect of ventson the occlusion effect, laser shell-makingwas used in order to minimize the occurrenceof slit vent that may compromise theobservations of the study. Cortez et al (2004)showed that hearing aid shells made with thelaser technology allowed higher availablegain before feedback than shells made withconventional technology.
An insert that had the typical length ofa CIC hearing aid was made for eachparticipant.The lateral surface terminated atabout 8 mm from the tragus, and the medialend terminated at the second bend of the earcanal. The inserts ranged from 13 mm to 18mm with an average length of 15 mm.A 1 mmprobe vent was included near the upper ridge

of the insert to allow probe-tube placement forgreater precision during real-earmeasurements. The probe-tube was markedat the tragus and was inserted to the samedepth in all measurements (approximately 29to 32 mm from the tragus marker) for eachparticipant.A removal line was also installedin the inserts for ease of removal.
Each insert had a 1 mm vent drilledthrough its center. This is the “1 mm (100%)”vent condition. Other vent conditions werederived from this vent by either plugging upthe vent on the lateral and medial ends (“0mm”) or by drilling it from the medial end ina systematic, proportionate manner usingthe appropriate size drill bit. For example,after testing with the “0 mm” and “1 mm”condition, the next vent condition was createdby using a 2 mm drill bit and drilling 60%toward the lateral end of the insert. In this
case, the medial 60% of the length of theinsert had a vent diameter of 2 mm while thelateral 40% had a 1 mm vent diameter. Thiswas labeled as the “2/2/1” vent condition. Bydrilling from the medial end toward thelateral surface in a predetermined manner,we had four more vent conditions. They were“3/2/1,” “3/2/2,” “3/3/2,” and “3 mm (100%).”Thissequence of modification allowed us tosystematically study the change in objectiveOE and subjective rating of occlusion as thephysical dimensions of a vent were graduallymodified from a vent with a uniform diameterto a vent with a gradually increasingdiameter.This systematic enlargement of thevent diameter also allowed us to calculatethe effective acoustic mass of the vent system,as explained later. The sequence of ventconfigurations is shown in Figure 2.
Journal of the American Academy of Audiology/Volume 16, Number 9, 2005
752
Figure 2. Sequence of vent configurations (from top to bottom).

Vent Configurations on Occlusion Effect/Kuk et al
753
Procedure and Test Conditions
All testing was conducted in a 10’ x 10’x 6’6" sound-treated booth. In addition tothe first visit for the ear impression andfitting of the hearing aids, each participantwas seen for at least two visits (test andretest). During each session, the left ear wasoccluded with a foam plug while the right earwas evaluated with the insert. The real-earunaided response during vocalization(REURvoc) was first measured by asking theparticipants to sustain /i/ vocalization for 5sec.
The real-ear occluded response duringvocalization (REORvoc) was measured foreach vent condition on the insert.The “0 mm”vent condition was created by closing off the1 mm vent on the insert medially andlaterally with putty. After the REORvoc wasmeasured, the participants were asked torepeat “Baby Jeannie is teeny tiny” and judgethe hollowness of their voice using the 1(poorest) to 10 (best) scale. Afterwards, theputty from the occluded vent was removed,and participants repeated the testing (i.e.,REORvoc with /i/ and subjective rating) withthe 1 mm vent condition. Modifications tothe vent were made using a Red Wing lathe(model 26A) with the appropriate size drill bitin the sequence described earlier. Themeasurements (REORvoc and subjectiverating) were again repeated for each ventcondition until the final vent condition (3mm [100%]).
Participants returned after two monthsfor a retest on the 0 mm and 3 mm ventdiameter conditions in order to estimate thereliability of the measurement.A retest on theother vent configurations was unavailablebecause the insert had been drilled out.
RESULTS
Effect of Vent Diameter on ObjectiveOcclusion (REORvoc)
The real-ear occluded responses duringvocalization (REORvoc) of /i/ for the differentvent configurations were plotted in Figure 3.
As might have been expected, there wasa general change in the measured REORvocas the vent dimensions were altered. Ingeneral, the occlusion effect, at least for thevowel /i/, was primarily below 800 Hz with thepeak frequency at around 300 Hz with aninsert that terminated at the second bend ofthe ear canal.As the vent diameter increased,the REORvoc below 800 Hz decreased. For
Figure 3. Effect of vent configurations on theaveraged REORvoc.The vent conditions were indicatedin the display. The REURvoc was also included forcomparison.
Table 1. Summary Table Comparing the Significance of the Measured REORvoc among VentConfigurations
1 2/2/1 3/2/1 3/2/2 3/3/2 3
0 -2.54* -2.66* -2.54* -2.66* -2.66* -2.66*
1 -2.66* -2.07* -2.66* -2.66* -2.66*
2/2/1 -1.12 -2.66* -2.42* -2.54*
3/2/1 -2.66* -2.54* -2.54*
3/2/2 -1.36 -0.05
3/3/2 -1.36
Note: Entries with Z-values that were significantly different (p < 0.05) were marked with an asterisk.

example, the peak REORvoc at 258 Hz wasabout 85 dB SPL when the insert was fullyoccluded. It decreased to about 79 dB SPLwith a 1 mm (100%) vent diameter and toabout 70 dB SPL for a 3 mm (100%) ventdiameter. The significant drop in REORvocwhen the insert was changed from 0 mm to1 mm vent diameter suggests that the insertprovided a tight seal; otherwise, a smallerchange will be observed. For an intermediatevent diameter, such as the “3/2/1” ventconfiguration, the REORvoc was about 77 dBSPL. Thus, the REORvoc measured with a 1mm (100%) vent was higher than theREORvoc measured with the “3/2/1” vent andthe 3 mm (100%) vent diameter conditions.The REORvoc of the “3/2/1” vent conditionwas between the 1 mm (100%) vent and the3 mm (100%) vent. This suggests that theamount of objective occlusion effect was notdetermined by the smallest opening of thevent. Nonparametric Wilcoxon Signed Rankstests were used to compare the significanceof the REORvoc differences at 258 Hz observedamong vent configurations. This test wasused to minimize the effect of the largevariability among participants and the smalldB change associated with vent changes.TheZ-statistics were summarized in Table 1below, and differences that were significantwere marked with an asterisk. Many of thecomparisons were significantly different (p <0.05).
Occlusion Effect
The occlusion effect shown in each ventconfiguration was calculated by taking thedifference between the REURvoc and theREORvoc with the particular ventconfiguration. Because the dominant peakon the REORvoc occurred at around 300 Hz(258 Hz was the closest frequency formeasurement) for all participants in the 0 mmvent condition, the individual and theaveraged OE measured at that frequency foreach vent configuration was reported inFigure 4.
There are several observations. First,although the magnitude of the individualOE varied, all participants showed a gradualdecrease in OE as the vent dimensions wereincreased. Second, the average OE was about17 dB with a fully occluding insert (rangedfrom 10 to 27 dB). Third, the average OE forthe 1 mm (1/1/1 or 100%) vent configurationwas about 13 dB. This decreased to about 5
dB for the 3 mm (100% or 3/3/3) ventconfiguration. Although a 2 mm (100% or2/2/2) vent configuration was not available inthe study, it was estimated to be about 10 dB.Fourth, the average OE for the intermediatevent configurations, such as “2/2/1,” “3/2/1,”and “3/3/2,” were intermediate between the“1 mm (100%)” and “3 mm (100%)” ventconfigurations. On the other hand, many ofthe individual OE and the averaged OE forthe “3/2/2” vent and the “3/3/2” vent, orbetween the “2/2/1” vent and the “3/2/1” vent,were similar.The dimensional changes of thevent may not be sufficient to result in ameasurable difference in OE. Lastly, the OEfor the 1 mm (100% or 1/1/1) vent was higherthan that of the “2/2/1” vent and the “3/2/1”vent condition even though all three had alateral vent diameter of 1 mm. This wouldsuggest that the smallest opening on a ventdoes not dictate the OE of the vent.
Relationship between OcclusionEffect and Acoustic Mass
Calculation of Acoustic Mass
In order to determine the physicalrelationship (or lack of it) between OE and
Journal of the American Academy of Audiology/Volume 16, Number 9, 2005
754
Figure 4. Individual occlusion effect under differentvent conditions at 258Hz, with the average OE shownin bold. The notations for the vent conditions weresuch that the first number is the diameter of the ini-tial 30% of the vent length, followed by the second 30%of vent length.The last number is the diameter of thelast 40% of vent length.
Vent Configurations on Occlusion Effect/Kuk et al
755
vent dimensions, the acoustic mass of eachvent configuration was calculated based onDillon’s (2001) formula. The result was thentransformed logarithmically, that is,
Acoustic Mass (Henry, log scale) =log10(1500 x L / D2)
[1]
where L is the length of the vent section (inmm) and D the diameter (in mm). In otherwords, a larger vent diameter or a shortervent length would result in a smaller acousticmass and vice versa.
For a vent system that has multiplediameters like the inserts used in this study,the acoustic mass of the vent system is thesum of the acoustic mass of each section witha specific diameter. Thus, assuming that thelength of the vent system was L, the threesectional lengths would be 0.4L, 0.3L, and0.3L (measured from lateral to medial). Thevent diameters of these sections would beD1, D2, and D3 (from lateral to medial). Thetotal acoustic mass (in log) of this vent systemmay be expressed as:
Acoustic Mass (Henry, log scale) = log10 (1500 x (0.4L/D12+0.3L/D22+0.3L/D32)
[2]
OE against Acoustic Mass
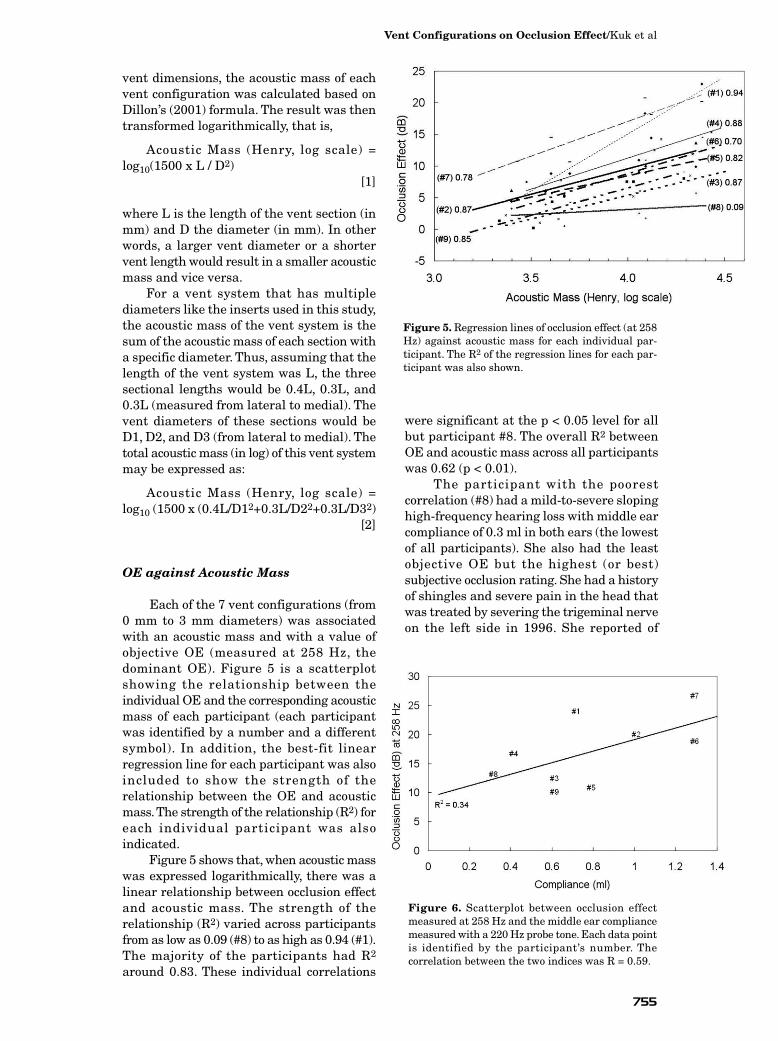
Each of the 7 vent configurations (from0 mm to 3 mm diameters) was associatedwith an acoustic mass and with a value ofobjective OE (measured at 258 Hz, thedominant OE). Figure 5 is a scatterplotshowing the relationship between theindividual OE and the corresponding acousticmass of each participant (each participantwas identified by a number and a differentsymbol). In addition, the best-fit linearregression line for each participant was alsoincluded to show the strength of therelationship between the OE and acousticmass.The strength of the relationship (R2) foreach individual participant was alsoindicated.
Figure 5 shows that, when acoustic masswas expressed logarithmically, there was alinear relationship between occlusion effectand acoustic mass. The strength of therelationship (R2) varied across participantsfrom as low as 0.09 (#8) to as high as 0.94 (#1).The majority of the participants had R2
around 0.83. These individual correlations
were significant at the p < 0.05 level for allbut participant #8. The overall R2 between OE and acoustic mass across all participantswas 0.62 (p < 0.01).
The participant with the poorestcorrelation (#8) had a mild-to-severe slopinghigh-frequency hearing loss with middle earcompliance of 0.3 ml in both ears (the lowestof all participants). She also had the leastobjective OE but the highest (or best)subjective occlusion rating. She had a historyof shingles and severe pain in the head thatwas treated by severing the trigeminal nerveon the left side in 1996. She reported of
Figure 5. Regression lines of occlusion effect (at 258Hz) against acoustic mass for each individual par-ticipant. The R2 of the regression lines for each par-ticipant was also shown.
Figure 6. Scatterplot between occlusion effectmeasured at 258 Hz and the middle ear compliancemeasured with a 220 Hz probe tone. Each data pointis identified by the participant’s number. Thecorrelation between the two indices was R = 0.59.

experiencing a “rushing” tinnitus in the leftear that subsided one month afterwards. Onthe other hand, the subject with the mixedhearing loss (#9) had an R2 of 0.85 betweenOE and acoustic mass. This correlation wasvery similar to those of the other participants’.
When the data from all the participantsand vent configurations were collapsed, onewas able to generate the following regressionequation that relates OE to the ventdimensions (assuming uniform diameter):
OE (258Hz) = 8.3489 [log10(1500* L / D2)]- 23.52
[3]
where L is the length of the vent and D is thediameter of the vent, and 1500*L/D2 is theacoustic mass of the total vent system.
Correlation between OE at 258 Hz andMiddle Ear Compliance
In order to examine if the measuredocclusion effect at 258 Hz may be related tothe middle ear compliance of the participants,we calculated the correlation coefficientsbetween the OE258 Hz measured with variousvent dimensions and middle ear complianceat 220 Hz. Figure 6 is a scatterplot showingthe relationship between the OE measuredwith the occluded insert (i.e., 0 mm ventdiameter) and middle ear compliance. Thecorrelation was calculated to be R = 0.59 (p < 0.05).The correlations measured betweenmiddle ear compliance and OE258 Hz at theother vent conditions were nonsignificant (p > .05).
Correlation between SubjectiveRatings and Objective OcclusionEffect
Subjective Occlusion Rating as aFunction of Vent Conditions
The individual subjective occlusionratings (as well as the median rating) as afunction of vent dimensions were summarizedin Figure 7. All but one participant (#3)showed an expected increase in subjectiveOE ratings as the vent dimensions increased,although the rate at which the subjectiveratings changed varied among participants.For example, participant #2 showed a fairlymonotonic increase as the vent dimensionschanged from 1 mm (100%) to a 3/2/2 ventcondition, whereas participant #8 (participantwith the poorest correlation between OE andacoustic mass) reached the ceiling of “10”when the vent was less than 2 mm (i.e., 2/2/1combination). On the other hand, participant#3’s responses were unpredictable in that noclear pattern between subjective ratings andvent dimensions was discernible.The medianrating, however, was relatively unchangedbeyond a 2/2/1 vent condition.
Another way to examine the group effectof vent configurations on subjective ratingswas to use a cumulative frequencydistribution function that reflects the total
Journal of the American Academy of Audiology/Volume 16, Number 9, 2005
756
Figure 7. Individual subjective occlusion ratings asa function of vent dimensions. The darker, bold lineshows the median subjective rating of all participants.
Figure 8. Cumulative frequency distributionfunctions of subjective rating of own voice as a functionof vent configurations. The vent configurations wereindicated. The horizontal line marked half of theparticipants.

number of participants who provided aspecific rating. For example, Figure 8 showsthe cumulative frequency distributionfunction for the “0 mm or no vent” condition.One participant had a rating of “3” or less, 3had a rating of “5” or less, 6 had a rating of“6” or less, and 9 had a rating of “9” or less.The median response, or the rating chosen byhalf of the participants (as marked by thehorizontal line on Figure 8) was 5.5. In otherwords, half of the participants had a ratinglower than 5.5 for the “0 mm” vent diametercondition.
Figure 8 shows that the median ratingchanged from 5.5 for the 0 mm vent conditionto around 6.2 when a 1 mm vent was used.The median subjective rating increased to7.5 for a 3 mm (100%) vent configuration.Thebiggest increase in subjective rating was alsonoted from the 0 mm vent to 1 mm ventcondition (from 5 to 6).
In general, subjective ratings tended toimprove as the vent configurations movedtoward a larger vent diameter (or greaterportion of a larger diameter). The mostsubstantial increase was from a 0 mmcondition to a 1 mm vent diameter condition.Subsequent increase in vent diameter showeda small, but incremental, increase insubjective rating. This is somewhat similarto the findings reported in Figure 4, whichsuggests that most of the decrease in OEwas from a 0 mm vent to a 1 mm vent. AFriedman related-sample test showed asignificant vent effect (χ2 = 21, df = 6,p = 0.002) in subjective ratings. However,post hoc Wilcoxon Signed Rank test showedthat only the subjective ratings obtained inthe 0 mm vent condition were significantly(p < 0.05) different from the ratings obtainedin the other vent configurations. Othercomparisons were nonsignificant.
Correlation between ObjectiveOcclusion Effect and SubjectiveOcclusion Ratings
Figure 9 is a scatterplot displaying the
relationship between the objective OE at 258Hz and subjective ratings. Severalobservations may be made. First, there wasa wide scatter of objective OE for eachsubjective rating. For example, a rating of“2” showed OE from as little as 1 dB to asmuch as 21 dB, or a 20 dB range. Second, therange of OE was smaller for the higherratings than for the lower ratings. Forexample, the rating of “9” or “10” only showedan OE range of 6 to 10 dB. This wassignificantly smaller than the 20 dB rangeseen with the ratings of “2” or “3.” Third,despite the wide variability, there was ageneral tendency for subjective ratings toimprove (or rated higher) as OE decreased.The strength of the relation (or R2) was 0.33(p < 0.05). Fourth, an average rating of “9” or“10” was assigned even though there were still5–7 dB of OE. This last point suggested thatgood subjective occlusion rating was possibleeven though some (5–7 dB) OE wasmeasured.
One may argue that the observedcorrelations between subjective ratings and
Vent Configurations on Occlusion Effect/Kuk et al
757
Table 2. Summary of Correlation Coefficients between Subjective Ratings and OE and Acoustic MassWhen the Effect of the Other Variable was Controlled
OE OE without Acoustic Mass Acoustic Mass Acoustic Mass without OE
Subjective Rating -0.457** -0.369** -0.326** -0.154
Figure 9. Scatterplot showing the relationshipbetween objective OE measured at 258 Hz andsubjective occlusion ratings.

objective OE may reflect the correlationbetween OE and acoustic mass (or physicaldimensions of vents) and not betweensubjective rating and OE. In order to controlfor the effect of acoustic mass (i.e., ventdimensions) on the correlation (betweensubjective and objective OE), correlationanalyses among subjective ratings, objectiveOE (at 258 Hz), and acoustic mass wereperformed. Partial correlations betweensubjective ratings and objective OE, andbetween subjective ratings and acoustic mass,were determined as well.Table 2 summarizesthe correlations between subjective ratingsand OE and acoustic mass when the effect ofthe other variable was controlled. Correlationsthat were significant (p < 0.01) were markedwith asterisks.
Table 2 shows that both OE and acousticmass were significantly correlated withsubjective ratings when the effect of the othervariable was included. When the effect ofacoustic mass was controlled (i.e., effect ofvent dimensions were controlled), objectiveocclusion effect was still negatively correlatedwith subjective occlusion ratings. However,when the effect of OE was controlled,subjective ratings were not correlated withacoustic mass. This suggests that subjectiverating of occlusion was negatively related tothe OE measured in the wearer’s ear canal.The strength of the relationship, althoughstatistically significant, was mild to moderate,however.
Test-Retest Reliability of OcclusionMeasurements
Figure 10 shows the measured OEbetween test and retest sessions for the 0 mm(10a) and 3 mm (10b) vent conditions.The test-retest difference in measured OE for most of theparticipants was within 2 dB. For both ventconditions, there was always one participantwho showed more variability than the otherparticipants.For example, it was participant #9in the 0 mm vent condition and #5 in the 3 mmvent condition. The standard deviation of thetest and retest difference (between sessions) was2.7 dB and 2.1 dB for the 0 mm and 3 mm ventconditions, respectively,when every participantwas included. The standard deviation of thedifference was reduced to 2.1 and 1.8 for the 0mm and 3 mm vent conditions when the worst(most difference) participant was removed.Typically, the average REORvoc curvesmeasured with the 0 mm (100%) and 3 mm(100%) vent diameter conditions differed byless than 1 dB between sessions.This suggeststhat the OE measurement conducted in thisstudy was relatively reliable for mostparticipants.
DISCUSSION
The present study examined the effect ofvent dimensions on objective occlusion
effect and subjective occlusion ratings whileminimizing the potential confounding effectof slit leakage (with laser shell-making tech-nology) and measurement variability (with
Journal of the American Academy of Audiology/Volume 16, Number 9, 2005
758
Figure 10. Scatterplots of the objective OE at 258 Hz measured during test (x-axis) and retest (y-axis) with a0 mm (a) and a 3 mm (b) diameter vent.

frequency or spectral averaging). Assumingthat both of these variability were suitablycontrolled, the results showed that there wasa systematic relationship between objectiveocclusion effect and vent dimensions as pre-dicted by the acoustic mass of the vent. Fur-thermore, there was a moderate correlationbetween subjective ratings of occlusion andobjective OE, even when the effect of acousticmass was controlled.
Comparison with Previous Studies
The results of this study disagreed withsome studies but agreed with others. Forexample, Kampe and Wynne (1996) reportedno systematic relations between objective OEand vent dimensions (0.79 mm and 2.36 mm)and between subjective occlusion ratings andobjective OE. Pirzanski (1998) made 23 insertsfrom one single ear impression and notedthat the effect of vent diameter (0, 0.9, and 1.15mm) was not predictable. Both of theseresearchers used a commercial real-earanalyzer to measure the occlusion effect. Incontrast, a systematic relation was observedbetween vent dimensions and objective OE(and subjective occlusion ratings) in this study.
On the other hand, Dillon (2001)reported measuring the vent effect on tennormal-hearing subjects and found asystematic change in OE as the vent diameterin an earmold was changed. In general, theymeasured 15 dB of OE with a 0 mm ventthat decreased to about 7–8 dB when thevent diameter was opened to 2 mm. Noreduction of OE was observed with the 1 mmvent diameter (about 4 dB was noted in thisstudy).This may have been the result of a slitleakage in the earmolds used in the Dillonstudy (2001). Approximately 3–4 dB of OEwas observed with a 3 mm vent. The authorsuggested that a 2 mm vent is a good startingpoint for fixing the occlusion problem, butwarned that a vent will have to be widenedto 3 mm to alleviate the problem. A highcorrelation between subjective rating ofocclusion and objective OE was also reported(r = 0.63).
In this study, it was noted that asystematic change in objective OE was seenas the vent diameter was changed. Theaverage occlusion effect was measured to bearound 17 dB in the 0 mm vent conditionthat decreased to 13 dB for the 1 mm vent, 10dB for the 2 mm vent, and 5 dB for the 3 mmvent. Other than the observation seen with the
1 mm vent diameter, the results of this studyare similar to those of Dillon’s (2001). Anydifferences noted between Dillon (2001) andthis study probably originated from the useof different vent lengths and the possibility ofslit leakage that was minimized in this study.
This study also showed a moderatecorrelation between compliance and OE at the0 mm vent condition. Carle et al (2002) alsoshowed that compliance correlatedmoderately with the minimal vent diameternecessary to eliminate the subjective occlusionperception in 82 hearing aid wearers, therationale being that a larger vent diameteris necessary to remove more objective OE.Thesame authors also noted a similar relationbetween OE and compliance in a smallersample of subjects. Of special interest in thisstudy was the observation that only the 0 mmvent diameter condition correlatedsignificantly with compliance; no other ventconditions correlated significantly. Becauseshells fabricated using laser shell-makingtechnology are accurate to 1/10 mm (whichwas extremely form fitting), theseobservations suggest that the correlationbetween middle ear compliance and OE canbe significantly affected by the vent conditionsin which the OE was recorded. Any leakagein the earmold or hearing aid shell wouldreduce the OE and mask the relationshipbetween middle ear compliance and OE. Thecorrelation between OE and compliance mayexplain why participant #8 had negligiblecorrelation between OE and acoustic mass.Her low middle ear compliance (0.3 ml) wouldhave suggested low OE regardless of changesin the acoustic mass of the vent.
Despite the precautions used in thisstudy to minimize slit leakage andmeasurement errors, there are bothcontrollable and uncontrollable variablesthat may have affected the reliability of thecurrent results. First, the effect of the ventdimensional change is dependent on therelative impedance difference between theresidual ear canal and the vent. Despite theknown change in the acoustic mass of thevent, the impedance of the residual ear canalis unknown. This could have affected thestrength of the relationship seen betweenOE and vent dimensions. Secondly, thestability of the stimulus may be improved.Despite our use of frequency averaging andour effort to maintain the participants’ vocalproduction, uncontrollable fluctuations inthe vocal levels (albeit minor) would still
Vent Configurations on Occlusion Effect/Kuk et al
759

occur. Consequently, a signal that isindependent of the participant’s effort, butwould still test the bone-conductionmechanism, may be desirable. Revit (1992)suggested using standard signals deliveredthrough a bone oscillator as an alternative tostudy the dimensional effect of vents onocclusion. This may be an area worthy offurther exploration. Unfortunately, noadditional work has been reported on thispossibility. Finally, all the vent configurationswere hand drilled. Despite the experience of the study audiologist in earmoldmodifications, imprecision in the drilling (forthe sections with different diameters) mayoccur to affect the actual acoustic mass in bothdirections. At the time of this study, the lasershell-making technology did not allow themanufacturing of the vent configurationsused in this study. Future laser shell-makingtechnology would be able to manufactureinserts with the precise specifications.
Clinical Implications
The correlation seen between OE andacoustic mass in Figure 5 suggests that OEis affected by the acoustic mass of the vent.Because acoustic mass of a vent is affected byits diameter and its length, increasing thevent diameter will decrease its acoustic mass.For a fixed residual ear canal volume, thisincreases the relative impedance of the earcanal to that of the vent. Consequently, thelow frequency in the ear canal “leaks” through
the vent; thus, the objective occlusion effectdecreases.
Selection of Vent Dimensions toMinimize Occlusion
The information on the systematicchange in occlusion effect and ventdimensions would allow the selection of“acceptable” vent diameter. Let us assumethat the wearer in question hascharacteristics similar to the participantsused in this study. Let us further assumethat she or he has an average ear canal andthat a hearing aid shell of the typical lengthwas used (terminates at second bend with alength of 16 mm). One may use the regressionequation generated from the present study(Eq. 3) to predict the average occlusion effectas a function of vent diameter. Alternatively,one may use the following figure (Figure 11,generated from Eq. 3) to estimate the optimalvent diameter for an “acceptable” amount ofOE. For example, Figure 11 shows that avent diameter must be at least 2 mm to haveless than 8 dB occlusion effect. Furthermore,it also shows that the most significantdecrease in OE occurs when the vent diameteris changed from 0 (or 0.5 mm) to 1 mm.Progressive increases in vent diameter leadsto a smaller decrease in OE.
What Is an Acceptable OcclusionEffect?
The experience of the participants toamplification and occlusion may be one ofthe reasons that explains the varyingrelationship between subjective ratings andobjective occlusion effect among studies.Someone who had never listened to theirown voice while occluded would probablyreact more negatively to the occludedsensation the first time, while another personwho had worn hearing aids before and wassomewhat accustomed to the occludedperception may be more tolerant of theocclusion effect, even if both had the sameamount of objective occlusion effect. Gettingthe participants to acclimatize to wearingthe hearing aids (and occlusion effect) atleast one month prior to and during the studycertainly could have altered the participants’tolerance to the occlusion effect. This maybe one reason why a correlation was seenbetween subjective ratings and objective
Journal of the American Academy of Audiology/Volume 16, Number 9, 2005
760
Figure 11. Predicted occlusion effect (OE) as afunction of vent diameter calculated from Eq. 3 foran average individual with similar characteristics asthe average participant used in this study and witha hearing aid shell that terminates at the secondbend (length of 16 mm).

occlusion effects in this study whereas nocorrelation was seen in previous studies thatused normal-hearing subjects. The caveat isthat the conclusions drawn in this study mayonly be applicable to “experienced” or currenthearing aid wearers and may not begeneralized to first-time hearing aid wearers.
Figure 9 shows the relationship betweensubjective occlusion ratings and objective OE(R2 = 0.33). As indicated earlier, there weresignificant variations between subjectiveratings and OE. However, there was lessvariability (in the range of OE) for the highersubjective ratings. If one takes a rating of “9”or “10” to reflect acceptability, one would seethat a “9” had OE that ranged from 0 to 10dB whereas a rating of “10” had OE thatranged from 0 to 6 dB. The best fit linearregression line would suggest an OE of 7 dBfor the “9” rating and 5 dB for a “10” rating.And from the companion paper (Kuk et al,2005) that showed that a rating of “9” orabove was viewed as acceptable (“It is hardlynoticeable unless I focus my attention to it”)by most wearers, the average experiencedwearer would probably find 5–7 dB of OEacceptable. If a vent of 16 mm length is used,one may select a vent with a uniformdiameter between 2 and 2.5 mm to meet thecriterion OE. Alternatively, one may select areverse horn vent that has the same acousticmass as this 2 to 2.5 mm vent. Obviously, thisconclusion is based on participants who hadbeen wearing completely-in-the-canal (CIC)hearing aids (with about 1.5 mm uniform-
diameter and reverse horn vents) prior toand during the course of the study. Newwearers may tolerate a lower OE. Thisspeculation should be further explored.
Alternate Vent Systems
Because the OE is related to the acousticmass of the vent, vents that are designed tominimize the acoustic mass may minimize theocclusion effect. One example of an alternatevent system is to gradually increase thediameter of the vent as approximated in thisstudy where the medial diameter of the ventis larger than the lateral diameter (i.e., ventconfigurations like 3/2/1 or 3/2/2). Such avent design is seen in the use of the “reversehorn vent” in custom hearing aids. Becauseof space limitations in CIC hearing aids, thefaceplate of these devices typically does notallow a vent opening larger than 1.5 mm.Such a diameter may only reduce thepotential occlusion effect by 7–8 dB (seeFigure 11). At least 8 to 9 dB of OE may stillexist in the wearer’s ear canal. This is higherthan the 5–7 dB of OE that was seen as“acceptable” in this study. On the other hand,there could be more space near the medial endof the canal where one may install a largervent opening and use the space within thecavity of the hearing aid shell to build ahornlike vent with a 3 to 4 mm opening at themedial end.This could effectively increase thediameter (or lower its acoustic mass) of thevent. Kuk et al (2005) in the companion papershowed the results of such a vent systemimplemented on a CIC style hearing aid.Three decibels less occlusion effect wasreported (and subjective preference as well)for the reverse horn vent than theconventional vent option.
Select-A-Vent (SAV) Use
Another implication from the observationof the dependence of OE on acoustic mass isin the use of Select-A-Vent (SAV). These arevent systems where one may select aparticular vent diameter by choosing a ventplug with the chosen diameter. The idea isthat the smallest opening of a vent governsits performance. On the other hand, in thisstudy it was shown that the performance ofa 3/2/1 vent was quite different from a 1 mmvent (or a 2/2/1 vent). Indeed, depending onthe dimensions of these SAV plugs, the totalacoustic mass of the SAV may be quite
Vent Configurations on Occlusion Effect/Kuk et al
761
Figure 12. Hypothetical acoustic mass of a 3 mmdiameter SAV system plugged with a 1 mm ventplug of various lengths.

different. For example, Figure 12 shows theacoustic mass of a 3 mm SAV system with atypical length of 16.6 mm. Its acoustic masswould be 24,900 H if it had a uniformdiameter of 1 mm. If it were occluded with a1 mm vent plug that was only 3 mm in length,its acoustic mass would be 6767 H, about27% of the 1 mm vent. Using Equation 3,one may calculate that the OE of the 3 mmparallel vent is 5.24 dB and that the OE ofthe 1 mm vent is 13.2 dB. On the other hand,the 1 mm vent plug that is 3 mm in lengthwill have an OE of 8.48 dB, and the 8 mm SAVplug will have an OE of 11 dB. In other words,depending on the length of the SAV plug, thecharacteristics of the vent system will beintermediate between the diameter of thevent plug used and the diameter of theunplugged SAV. If the purpose of the vent plugis to approximate a vent of the specific ventdiameter, then the vent plug should be aslong as the SAV system. On the other hand,if it were to approximate the unplug vent, itshould be as short as possible.
CONCLUSION
The current study showed that ventdimensions affect the amount of objective
occlusion effect in a predictable manneraccording to its length and diameter. Thetotal amount of occlusion is not dependent onthe smallest (or largest) vent diameter but onthe acoustic mass of the whole system (andits relationship to the impedance of theresidual ear canal). Furthermore, themoderate correlation between subjectiveocclusion ratings and objective occlusion effectand OE and acoustic mass suggests thatmethods that decrease the acoustic mass ofthe vent system would decrease the OE, andcould improve subjective ratings. Becausesubjective ratings higher than “9” (which areconsidered “natural” voice) are still associatedwith some degree of OE, it is possible that inmanaging the occlusion complaint, one maynot need to totally eliminate all the occlusioneffect for complete wearer satisfaction.
REFERENCES
Carle R, Laugesen S, Nielsen C. (2002) Observationson the relations among occlusion effect, compliance,and vent size. J Am Acad Audiol 13(1):25–37.
Cortez R, Dinulescu N, Skafte K, Olson B, Keenan D,Kuk F. (2004) Changing with the times: applying dig-ital technology to hearing aid shell manufacturing.Hear Rev 11(3):30–38.
Dillon H. (2001) Hearing aid earmolds, earshells andcoupling systems. In: Hearing Aids. New York:Boomerang Press, 117–157.
Dillon H, Birtles G, Lovegrove R. (1999) Measuringthe outcomes of a national rehabilitation program:normative data for the client oriented scale of improve-ment (COSI) and the hearing aid user’s questionnaire(HAUQ). J Am Acad Audiol 10(2):67–79.
Jenstad L, Van Tasell D, Ewert C. (2003) Hearing aidtroubleshooting based on patients’ descriptions. J AmAcad Audiol 14(7):347–360.
Kampe S, Wynne M. (1996) The influence of ventingon the occlusion effect. Hear J 49(4):59–66.
Kuk F. (1994) Maximum usable insertion gain withvarious earmold configurations. J Am Acad Audiol5:44–51.
Kuk F, Keenan D, Lau C, Dinulescu N, Cortez R, KoeghP. (2005) Real-world performance of a reverse- hornvent. J Am Acad Audiol 16(9):653–661.
Lazenby B, Logan S, Ahlstrom J, Bess F. (1986) Self-assessment questionnaire for the elderly: hearing aiddispensary use. Hear J 39(5):18–21.
Painton S. (1993) Objective measure of low-frequencyamplification reduction in canal hearing aids withadaptive circuitry. J Am Acad Audiol 4(3):152–156.
Pirzanski C. (1998) Diminishing the occlusion effect:clinician/manufacturer factors. Hear J 51(4):66–78.
Revit L. (1992) Two techniques for dealing with theocclusion effect. Hear Instrum 43(12):16–18.
Sweetow R, Valla A. (1997) Effect of electroacousticparameters on ampclusion in CIC hearing instru-ments. Hear Rev 4(9):8–12, 16–18, 22.
Tecca J. (1991) Real ear vent effects in ITE hearinginstrument fittings. Hear Instrum 42(12):10–12.
Tecca J. (1992) Further investigation of ITE venteffects. Hear Instrum 43(2):8–10.
Valente M, Valente M, Potts L, Lybarger E. (2000)Earhooks, tubing, earmolds, and shells. In: ValenteM, Hosford-Dunn H, Roeser R, eds. Audiology:Treatment. New York: Thieme Medical Publishing,59–104.
Westermann S. (1987) The occlusion effect. HearInstrum 38(6):43.
Journal of the American Academy of Audiology/Volume 16, Number 9, 2005
762
![Ä ^FaIK lK> R>loKl0GRaa].../K>IS_Q>o l>IK KuK]0GalK 0o>oK SmolSFpoSa_aP0GRaa]Ä KuK]/K>IS_Q>o l>IK KuK] 000GalK /K>IS_Q>o l>IK KuK],aS_om1>F]K 0GalKÀ ¹ Á© Þ ³ 1ao>]0opIK_om](https://img.pdfslide.us/doc/110x75/60d90fd1ae9246665138e103/-faik-lk-rlokl0graa-kisqo-lik-kuk0galk-0ook-smolsfposaap0graa.jpg)