Embed Size (px)
Citation preview

Banks
www.fitchratings.com February, 2016
Venezuela
Banco Nacional de Credito C.A. Banco Universal Full Rating Report
Key Rating Drivers
Challenging Operating Environment: The operating environment is the key factor
constraining BNC's VR, which drives its IDR and does not take into account state support. Like
all Venezuelan banks, BNC's VR is strongly linked to the creditworthiness of the sovereign,
given the significant level of government intervention, high level of exposure to sovereign
securities and its vulnerability to the government's policy choices and the country's economic
performance.
Manageable Liquidity Risk: BNC's ratings are also heavily influenced by the bank's liquidity
and funding profile. Although most deposits are available upon demand, deposits have been
stable, in part due to the government's capital controls. Furthermore, expansive fiscal and
monetary policies continue to drive deposit growth. BNC has a large negative mismatch
between short-term assets and liabilities, and access to longer-term funding is limited, as is the
case across the Venezuelan banking system.
Growth and Asset Concentration: BNC's loan growth has consistently exceeded that of the
system, while its exposure to the public sector is among the highest compared with other
Venezuelan universal/commercial banks rated by Fitch. However, the bank's corporate focus,
conservative lending policies and low-risk products reduced impaired loan levels, which,
combined with rapid nominal loan growth, has resulted in a consistent improvement in impaired
loan ratios.
Low Loan Loss Reserves: BNC's reserves for impaired loans grew significantly less than
gross loans during 2015, resulting in a sharp decline in its reserves for impaired loans/gross
loans ratio to a level that is well below that of the Venezuelan system and its domestic peers. In
light of loan concentration and the fragility of the economic environment, Fitch views this level
as weak.
Tighten Capitalization: High nominal loan growth has led to tighter capitalization in 2015,
despite stronger profitability, curbs on dividend payments and fresh capital injections. The
bank's tangible common equity to tangible assets ratio was consistent with its Venezuelan
peers at 3Q15. Capital levels are considered weak relative to Latin American peers in highly
speculative countries, particularly in light of the decline in BNC's overall cushion to absorb
unexpected losses.
Profitability Lags Domestic Peers: BNC's profitability continued to lag that of its Venezuelan
peers in 2015. Despite similar margins, the bank's lower efficiency and limited cross-selling
hinders profitability. When adjusted for inflation, the bank reported a loss in 2014, though gains
from the inflation adjustment of common equity more than offset the impact on equity.
Rating Sensitivities
Operating Environment Deterioration: Should Venezuela's macroeconomic/political woes
deepen, as reflected in its sovereign ratings, BNC's ratings could be downgraded. This is the
main downside risk for BNC and the rest of Venezuela's banks.
Limited Upside: BNC's VR and Long-Term IDRs could be upgraded if the operating
environment improves (more stable economic background, less intrusive regulation) and the
bank reduces its exposure to the public sector. A sustained improvement of the bank's financial
profile could be positive for the bank's national ratings.
Ratings
Foreign Currency
Long-Term IDR CCC
Short-Term IDR C
Viability Rating ccc
Support Rating 5
Support Rating Floor NF
Long Term National Rating BBB-(Ven)
Short Term National Rating F3(Ven)
Sovereign Risk
Foreign-Currency Long-Term IDR CCC
Local-Currency Long-Term IDR CCC
Outlooks
Foreign-Currency Long-Term IDR NA
Sovereign Foreign-Currency Long-Term IDR NA
Sovereign Local-Currency Long-Term IDR NA
Financial Data
Banco Nacional de Credito
Sep 2015 Dec 2014
Total Assets (USDb) 19.88 11.51
Total Assets (VEFm) 124,902.8 72,325.7
Total Equity (VEFm) 8,836.7 5,370.8
Operating Profit (VEFm) 2,330.2 1,128.7
Published Net Income (VEFm) 1,900.3 1,137.2
Comprehensive Income (VEFm) 1,900.3 1,041.5
Operating ROAA (%) 3.20 1.95
Operating ROAE (%) 43.33 27.41
Internal Capital Generation (%) 28.75 21.17
Fitch Core Capital/Weighted Risks (%) 13.49 16.06
Tier 1 Ratio (%) N.A. N.A. Source: Audited financial statements, SUDEBAN, Fitch.
Related Research
2016 Outlook: Andean Banks (December 2015)
Analysts Theresa Paiz-Fredel +1 212 908 0534 [email protected]
Larisa Arteaga +809 563 2481 [email protected]

Banks
Banco Nacional de Credito C.A. Banco Universal 2
February, 2016
Operating Environment
Rating Level Affected by Deep Economic Imbalances
Venezuela’s long-term IDRs were downgraded to ‘CCC’ from ‘B’ in December 2014. The
downgrade reflected increased balance of payment and fiscal pressures due to the sharp
decline in oil prices, and the reduced capacity for the Venezuelan economy to respond to this
external shock as a result of low international reserves, which are not entirely liquid, and limited
sources of external financing.
Macroeconomic instability continues to increase in Venezuela, highlighted by spiraling inflation
and deep recessionary conditions in the economy. Growth declined rapidly after the 2012
election to 1.3% in 2013, down from 5.6% in 2012. The economy slipped into recession in 2014,
contracting by an estimated 3.9%, according to Fitch. Fitch expects the economic contraction
to continue, reaching 6.1% in 2015 and 2.4% in 2016, although there are risks of a more
severe contraction given the rapid decline in oil prices. Foreign exchange rationing, price
controls and monetary financing of fiscal deficits have fuelled inflation, which reached 68.5% at
year-end 2014. Fitch expects inflation to exceed 80% in 2015 and 2016.
Inconsistent exchange rate and fiscal and monetary policies have deepened macroeconomic
imbalances. Divisions within the government of President Nicolás Maduro and weak political
capital have delayed necessary policy adjustments to address these rising macroeconomic
imbalances, and the authorities’ room to maneuver is shrinking in light of a drop in oil prices. At
about 9% this year, the unemployment rate is similar to that of countries with sovereign ratings
in the ‘B’ rating category. However, wage increases are not keeping pace with inflation. Private
credit/GDP remains low relative to other emerging markets.
Deposits across the Venezuelan banking system are stable due to capital controls. Deposit
growth remains steady, reflecting expansionary monetary and fiscal policy. In addition, the
banking system is characterized by a high level of liquidity, with “available for sale” securities
and “cash and due from banks” balances accounting for almost 220% of the system’s total
assets at 3Q15, a trend that is likely to continue given continued strong deposit growth.
Nevertheless, Fitch highlights that due to a lack of investment alternatives, most of the banks’
investments are concentrated in Venezuelan public sector debt, which could be less liquid in a
stress scenario.
Company Profile
BNC is a medium-sized bank that mostly focuses on the corporate segment. The bank had a
3.2% market share of assets as of September 30, 2015. The bank was created in 2003 when a
group of experienced professionals acquired the former Banco Tequendama and later merged
it with Stanford bank, a bank that had been intervened upon by regulators. By 3Q15, the bank
had grown its network to 170 branches and an off-shore branch in Curacao. In addition, BNC’s
distribution network included 460 ATMs, internet banking and a call center at the same date.
The bank is controlled by a well-regarded local family, which held about 18% of the shares as
of Sep. 30, 2015. Other key shareholders controlled 64% of the shares, and remaining shares
were widely held at this same date.
BNC has a commercial bank business model with a clear bias toward the corporate segment.
Given regulatory guidelines, about 33% of its loan portfolio was devoted to compulsory lending
at 3Q15. In addition, the high liquidity prevalent in the banking system creates an incentive for
banks to hold substantial balances in securities and cash. Given its modest size and regulatory
limitations, BNC’s corporate structure is relatively simple and includes an off-shore branch. The

Banks
Banco Nacional de Credito C.A. Banco Universal 3
February, 2016
bank cannot provide brokerage services, and its activities and fee structure are tightly
regulated.
Management
BNC’s executive and senior management is experienced and has sufficient depth to navigate
current economic conditions. BNC has consistently attracted well-qualified staff from bigger
banks. The managerial team is organized following business lines with support and control
areas reporting directly to the CEO except for the audit, compliance and risk administration
functions that report to the board.
Local regulations do not specifically address corporate governance rules for private-sector
banks. The board is composed of seven primary board members (including three independent)
and seven alternate board members (including five independent). The board has organized
several committees to steer and oversee BNC’s operations. BNC does not engage in related
third-party credit activities, in line with local regulations. Fitch notes that the bank operates in a
jurisdiction that is not supportive of creditor rights.
The bank’s strategy is to gradually gain market share by growing above the industry average.
The focus has been on expanding the network to widen the customer base and deepen
product penetration, as well as make branches more profitable and improve efficiency.
Nevertheless, execution of strategic objectives is constrained by the operating environment
and regulatory limitations (e.g. interest rate caps and floors).
Risk Appetite
BNC has consolidated its risk management function in a centralized unit that oversees all
aspects of risk management. Accordingly, credit policies and risk management tools have been
overhauled and are regularly being re-examined. Credit analysis is performed by a unit that is
independent from the business areas. Credit approval is delegated to the business units;
however, the risk management unit has veto power. Credit extension is based on a thorough
analysis of the borrower’s payment capacity and when needed covered by eligible collateral.
Consumer lending is based on in-house scoring models that are being updated as the bank
plans to grow into this segment, though without losing its focus on corporate lending.
Credit control and follow up are also independent from the business line. The bank’s ample
expertise in corporate lending and relatively conservative credit policies contribute to the
maintenance of the stability of NPLs in nominal terms. Credit is predominantly short-term with
75% of the loan portfolio maturing within twelve months at 3Q15 and only 25% exceeding one
year. BNC has actively sought to lower loan concentration. While retail lending growth should
help reduce concentration over the medium term, the bank’s risk appetite for this segment is
lower, given the slowdown in economic activity.
BNC’s loan growth is highest of its peer group at Sept. 2015 (85.65% versus a 73% median rate).
Nominal loan growth has been rapid in the last few years (81% in 2014, 66% in 2013) and
when adjusted for inflation (81% in 2014, 56% in 2013) it shows a rapid pace too. Future
growth should remain mostly the same and may continue to be distorted by inflation as the
underlying inflationary pressures (macro imbalances and high liquidity) remain unchanged.
After growing at an even higher pace than the Venezuelan banking system overall in 2014 and
2013, BNC expects to consolidate its position and achieve higher efficiency and profitability
BNC does not engage in active securities trading but holds structural and liquidity investment
portfolios. Like most Venezuelan banks, BNC has acquired a significant exposure to
0.00
10.00
20.00
30.00
40.00
50.00
60.00
70.00
80.00
90.00
sep-15 2014 2013
Track Record of Growth
Assets Gross Loans
Internal Capital Generation Deposits
Source: Banco Nacional de Credito, SUDEBAN

Banks
Banco Nacional de Credito C.A. Banco Universal 4
February, 2016
government securities, some of which can be used to comply with compulsory lending
requirements. The market for domestic securities lacks depth, and banks face a volatile market
that can, in a stress scenario, affect their balance sheet and equity. Despite basic market risk
management tools, the lack of investment options and high monetary liquidity result in an
oversized exposure to the public sector and higher market risk.
Financial Profile Asset Quality
The overall trend of BNC’s impaired loans/gross loans ratio has been declining since YE11,
while loan quality indicators are strong relative to its domestic peers. As is the case with most
Venezuelan banks, BNC boasts very low past-due loan (PDLs) ratios, which are in part due to
inflation-induced rapid loan growth, but also due to the bank’s conservative credit policies,
relatively low-risk products and short-term turnover of the loan portfolio. PDLs stood at 0.06%
of gross loans at 3Q15, down from 0.05% at YE14. Loan loss reserves covered PDLs 30.17x at
September 2015; this is a comfortable level when compared to the very low PDLs, but when
compared to gross loans appear to be relatively weak (1.57%). Fitch expects loan quality ratios
to be challenged over the medium term due to a seasoning of recent loan growth as well as
macroeconomic imbalances and the need for economic adjustment.
BNC has consistently complied with the compulsory lending rules; however, it is increasingly
difficult to meet the government’s specific requirements for obligatory loans by subsector,
particularly for low income mortgage and construction loans for primary residences, tourism
sector loans and for the increase in the number of new borrowers, as is the case with other
Venezuelan banks. As of Sep. 30, 2015, compulsory loans decreased to 33% of BNC’s gross
loans (Dec.31, 2013: 37.5%). Up to now, government officials have understood the limitations
for most banks in terms of meeting some of these requirements. Nevertheless, there is still
significant uncertainty about possible fines or increases in compulsory lending levels.
Given its corporate focus, BNC has a relatively concentrated loan portfolio by obligor and
industry, although it has gradually declined in the past few years due to a sustained effort from
the bank’s management. Loans to the top 20 borrowing groups amounted to 17% of the total
loan portfolio at September 2015, down from 21% at September 2014. In terms of industries,
BNC’s loan portfolio is mainly concentrated in construction (23% of the total loan portfolio at
September 2015), wholesale/retail commerce (18%); agribusiness (12%); services (11%);
manufacturing (9%), among others.
BNC’s investment portfolio accounted for about 15% of total assets at September 2015 and
was almost entirely composed of debt securities from or guaranteed by the public sector. At
3Q15, about 38% of the investment portfolio was classified as held to maturity, and 26% as
Asset Quality Metrics
(%) Sep 2015 2014 2013 2012
Growth of Gross Loans 72.69 70.03 60.95 73.55
Impaired Loans /Gross Loans 0.06 0.05 0.06 0.18
Reserves for Impaired Loans/Impaired Loans 3,175.12 4,582.66 3,081.03 1,469.16
Impaired Loans less Reserves for Impaired Loans/Fitch Core Capital (14.41) (14.44) (11.57) (17.26)
Loan Impairment Charges/Average Gross Loans 1.57 1.74 0.32 2.00
Sources: Audited financial statements, SUDEBAN, Fitch.

Banks
Banco Nacional de Credito C.A. Banco Universal 5
February, 2016
available for sale. The rest was in the form of other investments in government-issued/
guaranteed securities that can be used to comply with compulsory lending. The tenors of these
securities are relatively long, as 79% of the total mature after one year, including 41% that
mature after five years.
Overall, asset quality moderately influences BNC’s ratings given the rapid lending growth, the
loan portfolio’s vulnerability to economic volatility and the investment portfolio’s high public
sector exposure.
Earnings and Profitability
Profitability remains weak versus domestic peers and is not sufficient to support rapid balance
sheet growth. While profitability appears strong in nominal terms, the bank’s net losses in 2014
were up to 12% of average earning assets when adjusted for inflation, according to
supplemental information in BNC’s audited statements.
Given high monetary liquidity, funding costs have consistently declined in recent years. As a
result, BNC’s net interest income/average earning assets ratio increased to 13.95% at 3Q15,
up from less than 10% in 2013. Rapid nominal loan growth has fueled operating revenues, thus
reducing the importance to the bank’s income of the interest revenues generated by the
investment portfolio (12%). As is the case with other Venezuelan banks, non-interest operating
income is modest, accounting for about 6.1% of gross operating revenues at 3Q15, down from
10.1% at YE14. The relative decline of non-interest income reflects regulatory limits on fees
and commissions.
BNC has relatively high operating expenses due to its network expansion, high inflation and the
relatively short loan portfolio turnover that requires a constant business development effort. As
a result, efficiency ratios compare poorly to those of its peers. Management is in the process of
improving efficiency through investments in and a review of all operating processes. While
improvement is possible, asset growth pressures and high inflation could slow progress in this
area.
Following the decline in past-due loans and still good performance of the loan portfolio, loan
and other impairment charges have declined in absolute and relative terms from the 2014 peak,
which in part reflected a more conservative focus toward retail lending. At 3Q15, the ratio of
loan impairment charges to gross loans was 1.57%, well below the previous three-year
average.
As Venezuela’s economic performance remains uncertain, and deep imbalances continue to
distort economic activity, BNC’s profitability — as with most Venezuelan banks — could come
under increased pressure over the medium term due to higher operating and credit costs.
Margins should remain ample given the market’s high liquidity and low funding costs, which
Key Performance Ratios (%)
Sep 2015 2014 2013 2012
Net Interest Income/Average Earning Assets 13.95 10.82 9.96 10.89
Non-interest Expense/Gross Revenues 59.60 67.12 71.64 59.57
Loans and Securities Impairment Charges/Pre-Impairment Operating Profit 20.27 29.76 6.58 26.46
Operating Profit/Average Total Assets 3.20 1.95 2.07 2.75
Operating Profit/Risk-Weighted Assets 4.76 3.25 3.66 4.77
Net Income/Average Equity 35.33 28.71 29.83 42.79
Sources: Audited financial statements, SUDEBAN, Fitch.
0.00
5.00
10.00
15.00
20.00
25.00
30.00
35.00
40.00
45.00
sep-2015 2014 2013 2012
Profitability
ROAA ROAE NIM
Source: Banco Nacional de Credito, SUDEBAN

Banks
Banco Nacional de Credito C.A. Banco Universal 6
February, 2016
could offset some of these pressures. High nominal loan growth, driven by inflation, and the
bank’s relatively conservative credit policies should help maintain a low impaired loan ratio.
Credit costs are likely to pick up as the bank grows into retail lending while inflation could
hinder management’s efforts to improve efficiency. Nevertheless, profitability is expected to
remain positive in nominal terms, though below the average of its peers.
Capitalization and Leverage
BNC has an unencumbered capital base that is entirely composed of Tier I capital and retained
earnings. Sustained profitability, regulatory constraints on dividend distributions and unrealized
gains from the bank’s securities portfolio due to devaluation have resulted in significant internal
capital generation. Additional fresh capital injections also supported the bank’s improving
capitalization.
BNC’s regulatory capital ratio decreased to 13% at 3Q15 from 14.71% at YE14. Even though
BNC’s tangible equity to assets ratio remained at 7.1% at Sep. 2015, it remains low relative to
the bank’s larger domestic peers and similarly rated Latin American peers. A fresh capital
injection pending for approval will improve BNC’s tangible equity to assets ratio to 7.25%.
Nevertheless, Fitch views this level as weak in light of a volatile operating environment and
high exposure to the public sector.
Fitch’s main measure of capital, Fitch core capital (FCC) to risk weighted assets, stood at
about 13.5% at Sep.30, 2015. However, risk weighted assets benefit from a high exposure to
the government, which is weighted at zero, and to the 50% weight assigned to compulsory
loans.
Funding and Liquidity
Capital (%)
Sep 2015 2014 2013 2012
Fitch Core Capital/ Weighted Risks 13.49 16.06 16.40 15.18
Total Regulatory Capital ratio 13.05 14.71 14.50 13.83
Fitch Eligible Capital/Weighted Risks 13.05 14.71 14.50 13.83
Tangible Common Equity/Tangible Assets 7.07 7.43 7.03 6.42
Core Tier 1 Regulatory Capital Ratio N.A. N.A. N.A. N.A.
Internal Capital Generation 28.75 21.17 22.42 30.48
N.A.– Not available. Sources: Audited financial statements, SUDEBAN, Fitch.
Funding and Liquidity (%)
Sep 2015 2014 2013 2012
Loans/Customer Deposits 59.27 54.81 51.65 49.60
Interbank Assets/Interbank Liabilities n.a. n.a. n.a. 0.00
Customer Deposits/Total Funding (Excluding Derivatives) 99.90 99.98 99.71 99.82
N.A.– Not available.
Sources: Audited financial statements, SUDEBAN, Fitch.

Banks
Banco Nacional de Credito C.A. Banco Universal 7
February, 2016
Expansionary fiscal and monetary policies have created a surplus of liquidity in the system and,
given the limited investment options, a low-cost funding source for banks. Deposits have
accounted for over 99% of total funding since 2011 and continue to grow at a brisk pace due to
the system’s excess liquidity. However, most deposits are demand deposits (95%) and time
deposits have short-term maturities (on average 30 days). BNC has a large negative mismatch
between short-term assets and liabilities, and access to longer-term funding is limited, as is the
case across the Venezuelan banking system. Fitch views this structural maturity mismatch as
manageable under the current environment of capital controls, which provides a sufficient
barrier to capital flight. Additionally, there are no signs of a relaxation of such controls.
BCN has a liquid balance sheet, with cash and equivalents accounting for 34.3% of total
deposits and short-term funding. However, most of these investments are government related
and the financial market does not have the depth and ability to absorb these securities,
especially in a stress situation.
Support
Support cannot be relied upon given Venezuela’s speculative-grade rating and lack of a
consistent policy on bank support.
Peer Analysis
BNC’s liquidity was in line with similarly rated domestic and international peers at 3Q15. The
bank’s loan quality compares favorably to peers, though its exposure to the public sector as a
proportion of equity exceeds that of most of its peers. Capitalization, though in line with that of
other mid-sized Venezuelan banks, remains weak compared with that of large Venezuelan
banks (market share of assets greater than 5%) and international peers. BNC’s profitability is
also weak compared with its domestic peers. When adjusting for inflation, profitability materially
lags the bank’s international peers.
Peer Comparison (Sep. 30, 2015)
Issuer Name Banco Nacional de
Credito Banco Exterior Banco del Caribe Banco Provincial Banco Mercantil Banking
Sector Median
Country Venezuela Venezuela Venezuela Venezuela Venezuela Venezuela
Viability Rating ccc ccc ccc b b N.A.
Total Equity/Total Assets 7.07 7.53 7.30 8.25 7.01 7.10
Impaired Loans/Gross Loans 0.06 0.43 0.61 0.27 0.22 0.28
Reserves for Impaired Loans/ Impaired Loans 3,175.12 562.9 404.95 1,138.74 1,466.15 766.68
Deposits/Total Funding 99.90 99.91 99.67 99.38 99.98 99.38
Loans/Customer Deposits 59.27 65.63 64.06 66.71 66.41 63.50
ROAA 2.61 3.68 3.94 3.95 3.21 3.68
N.A. – Not available. Sources: Local superintendencies, audited financial statements, Fitch.
0
20
40
60
80
100
120
sep-2015 2014 2013 2012
Funding EvolutionCurrent Savings Term
%

Banks
Banco Nacional de Credito C.A. Banco Universal 8
February, 2016
Banco Nacional de Credito C.A.
30 Sep 2015 31 Dec 2014 31 Dec 2013 31 Dec 2012
Year End Year End Year End
Year End Year End
USDm VEFm As % of VEFm As % of VEFm As % of VEFm As % of
Earning Assets
Earning Assets
Earning Assets
Earning Assets
Income Statement 1. Interest Income on Loans 1,363.4 8,567.8 13.67 4,481.3 9.10 2,388.5 7.84 1,580.3 8.01
2. Other Interest Income 180.2 1,132.3 1.81 1,874.5 3.81 1,123.8 3.69 701.4 3.55
3. Dividend Income 0.0 0.0 0.00 0.0 0.00 0.0 0.00 n.a. -
4. Gross Interest and Dividend Income 1,543.6 9,700.1 15.47 6,355.8 12.90 3,512.3 11.53 2,281.7 11.56
5. Interest Expense on Customer Deposits 455.8 2,864.3 4.57 2,116.5 4.30 1,128.3 3.70 673.4 3.41
6. Other Interest Expense 6.4 40.5 0.06 15.2 0.03 12.2 0.04 17.4 0.09
7. Total Interest Expense 462.2 2,904.8 4.63 2,131.7 4.33 1,140.5 3.74 690.8 3.50
8. Net Interest Income 1,081.3 6,795.3 10.84 4,224.1 8.58 2,371.8 7.78 1,590.9 8.06
9. Net Gains (Losses) on Trading and Derivatives n.a. n.a. - n.a. - n.a. - 0.0 0.00
10. Net Gains (Losses) on Other Securities n.a. n.a. - n.a. - n.a. - n.a. - 11. Net Gains (Losses) on Assets at FV through Income Statement
n.a. n.a. - n.a. - n.a. - 0.0 0.00
12. Net Insurance Income n.a. n.a. - n.a. - n.a. - n.a. -
13. Net Fees and Commissions n.a. n.a. - n.a. - n.a. - 0.0 0.00
14. Other Operating Income 69.8 438.6 0.70 476.9 0.97 146.8 0.48 205.0 1.04
15. Total Non-Interest Operating Income 69.8 438.6 0.70 476.9 0.97 146.8 0.48 205.0 1.04
16. Personnel Expenses 184.4 1,158.6 1.85 952.3 1.93 484.0 1.59 306.7 1.55
17. Other Operating Expenses 501.7 3,152.8 5.03 2,203.1 4.47 1,320.3 4.33 763.2 3.87
18. Total Non-Interest Expenses 686.1 4,311.4 6.88 3,155.4 6.41 1,804.3 5.92 1,069.9 5.42
19. Equity-accounted Profit/ Loss - Operating n.a. n.a. - n.a. - n.a. - n.a. -
20. Pre-Impairment Operating Profit 465.1 2,922.5 4.66 1,545.6 3.14 714.3 2.34 726.0 3.68
21. Loan Impairment Charge 94.3 592.3 0.94 459.9 0.93 47.0 0.15 192.1 0.97
22. Securities and Other Credit Impairment Charges 0.0 0.0 0.00 0.0 0.00 0.0 0.00 0.0 0.00
23. Operating Profit 370.8 2,330.2 3.72 1,085.7 2.20 667.3 2.19 533.9 2.71
24. Equity-accounted Profit/ Loss - Non-operating n.a. n.a. - n.a. - n.a. - n.a. -
25. Non-recurring Income 6.0 37.6 0.06 65.1 0.13 47.1 0.15 16.8 0.09
26. Non-recurring Expense 2.5 15.7 0.03 11.8 0.02 39.5 0.13 31.6 0.16
27. Change in Fair Value of Own Debt n.a. n.a. - n.a. - n.a. - n.a. -
28. Other Non-operating Income and Expenses n.a. n.a. - n.a. - n.a. - 0.0 0.00
29. Pre-tax Profit 374.3 2,352.1 3.75 1,139.0 2.31 674.9 2.21 519.1 2.63
30. Tax expense 71.9 451.8 0.72 1.8 0.00 4.9 0.02 1.7 0.01
31. Profit/Loss from Discontinued Operations n.a. n.a. - n.a. - n.a. - n.a. -
32. Net Income 302.4 1,900.3 3.03 1,137.2 2.31 670.0 2.20 517.4 2.62
33. Change in Value of AFS Investments n.a. n.a. - 0.0 0.00 0.0 0.00 n.a. -
34. Revaluation of Fixed Assets n.a. n.a. - n.a. - n.a. - n.a. -
35. Currency Translation Differences n.a. n.a. - n.a. - n.a. - n.a. -
36. Remaining OCI Gains/(losses) n.a. n.a. - n.a. - n.a. - n.a. -
37. Fitch Comprehensive Income 302.4 1,900.3 3.03 1,137.2 2.31 670.0 2.20 517.4 2.62
38. Memo: Profit Allocation to Non-controlling Interests n.a. n.a. - n.a. - n.a. - n.a. -
39. Memo: Net Income after Allocation to Non-controlling Interests 302.4 1,900.3 3.03 1,137.2 2.31 670.0 2.20 0.0 0.00
40. Memo: Common Dividends Relating to the Period n.a. n.a. - n.a. - n.a. - n.a. -
41. Memo: Preferred Dividends Related to the Period n.a. n.a. - n.a. - n.a. - n.a. -
Exchange rate USD1 = VEF6.28420 USD1 =
VEF6.28420
USD1 = VEF4.28930
USD1 = VEF4.28930

Banks
Banco Nacional de Credito C.A. Banco Universal 9
February, 2016
Banco Nacional de Credito C.A.
30 Sep 2015 31 Dec 2014 31 Dec 2013 31 Dec 2012
Year End Year End As % of Year End As % of Year End As % of Year End As % of
USDm VEFm Assets VEFm Assets VEFm Assets VEFm Assets
Balance Sheet Assets A. Loans 1. Residential Mortgage Loans 687.0 4,317.0 3.46 2,608.0 3.61 1,734.3 4.08 1,200.0 4.54
2. Other Mortgage Loans n.a. n.a. - n.a. - n.a. - n.a. -
3. Other Consumer/ Retail Loans 601.4 3,779.1 3.03 1,852.0 2.56 751.4 1.77 389.4 1.47
4. Corporate & Commercial Loans 9,346.9 58,738.1 47.03 31,539.6 43.61 17,386.6 40.87 10,407.6 39.38
5. Other Loans 0.0 0.0 0.00 0.0 0.00 n.a. - 0.0 0.00
6. Less: Reserves for Impaired Loans 209.2 1,314.5 1.05 792.8 1.10 357.4 0.84 314.4 1.19
7. Net Loans 10,426.1 65,519.7 52.46 35,206.8 48.68 19,514.9 45.88 11,682.6 44.20
8. Gross Loans 10,635.3 66,834.2 53.51 35,999.6 49.77 19,872.3 46.72 11,997.0 45.39
9. Memo: Impaired Loans included above 6.6 41.4 0.03 17.3 0.02 11.6 0.03 21.4 0.08
10. Memo: Loans at Fair Value included above n.a. n.a. - n.a. - n.a. - n.a. -
B. Other Earning Assets
1. Loans and Advances to Banks n.a. n.a. - 0.0 0.00 n.a. - 0.0 0.00
2. Reverse Repos and Cash Collateral n.a. n.a. - n.a. - n.a. - n.a. -
3. Trading Securities and at FV through Income 0.0 0.0 0.00 0.0 0.00 0.0 0.00 0.0 0.00
4. Derivatives n.a. n.a. - n.a. - n.a. - n.a. -
5. Available for Sale Securities 761.6 4,786.3 3.83 4,612.6 6.38 5,074.8 11.93 3,444.4 13.03
6. Held to Maturity Securities 1,096.6 6,891.2 5.52 5,171.2 7.15 3,290.2 7.73 2,787.1 10.55
7. Equity Investments in Associates 0.0 0.0 0.00 0.0 0.00 0.0 0.00 0.0 0.00
8. Other Securities 1,053.7 6,621.7 5.30 4,261.6 5.89 2,593.9 6.10 1,819.8 6.89
9. Total Securities 2,911.9 18,299.2 14.65 14,045.4 19.42 10,958.9 25.76 8,051.3 30.46
10. Memo: Government Securities included Above n.a. n.a. - n.a. - n.a. - 0.0 0.00
11. Memo: Total Securities Pledged n.a. n.a. - n.a. - n.a. - n.a. -
12. Investments in Property n.a. n.a. - n.a. - n.a. - n.a. -
13. Insurance Assets n.a. n.a. - n.a. - n.a. - n.a. -
14. Other Earning Assets n.a. n.a. - n.a. - n.a. - n.a. -
15. Total Earning Assets 13,338.0 83,818.9 67.11 49,252.2 68.10 30,473.8 71.64 19,733.9 74.67
C. Non-Earning Assets
1. Cash and Due From Banks 5,397.5 33,919.0 27.16 20,462.6 28.29 10,627.4 24.98 5,703.8 21.58
2. Memo: Mandatory Reserves included above 4,467.7 28,076.0 22.48 26,674.9 36.88 8,280.3 19.47 4,350.1 16.46
3. Foreclosed Real Estate 0.0 0.0 0.00 0.0 0.00 22.9 0.05 72.0 0.27
4. Fixed Assets 551.5 3,465.9 2.77 1,153.7 1.60 708.2 1.66 488.1 1.85
5. Goodwill n.a. n.a. - n.a. - n.a. - 0.0 0.00
6. Other Intangibles n.a. n.a. - n.a. - n.a. - 0.0 0.00
7. Current Tax Assets n.a. n.a. - n.a. - n.a. - n.a. -
8. Deferred Tax Assets n.a. n.a. - n.a. - n.a. - 0.0 0.00
9. Discontinued Operations n.a. n.a. - n.a. - n.a. - n.a. -
10. Other Assets 588.6 3,699.0 2.96 1,457.2 2.01 704.8 1.66 431.5 1.63
11. Total Assets 19,875.7 124,902.8 100.00 72,325.7 100.00 42,537.1 100.00 26,429.3 100.00
Exchange rate USD1 = VEF6.28420 USD1 = VEF6.28420 USD1 = VEF6.28420 USD1 = VEF4.28930
Banks
Banco Nacional de Credito C.A. Banco Universal 10
February, 2016
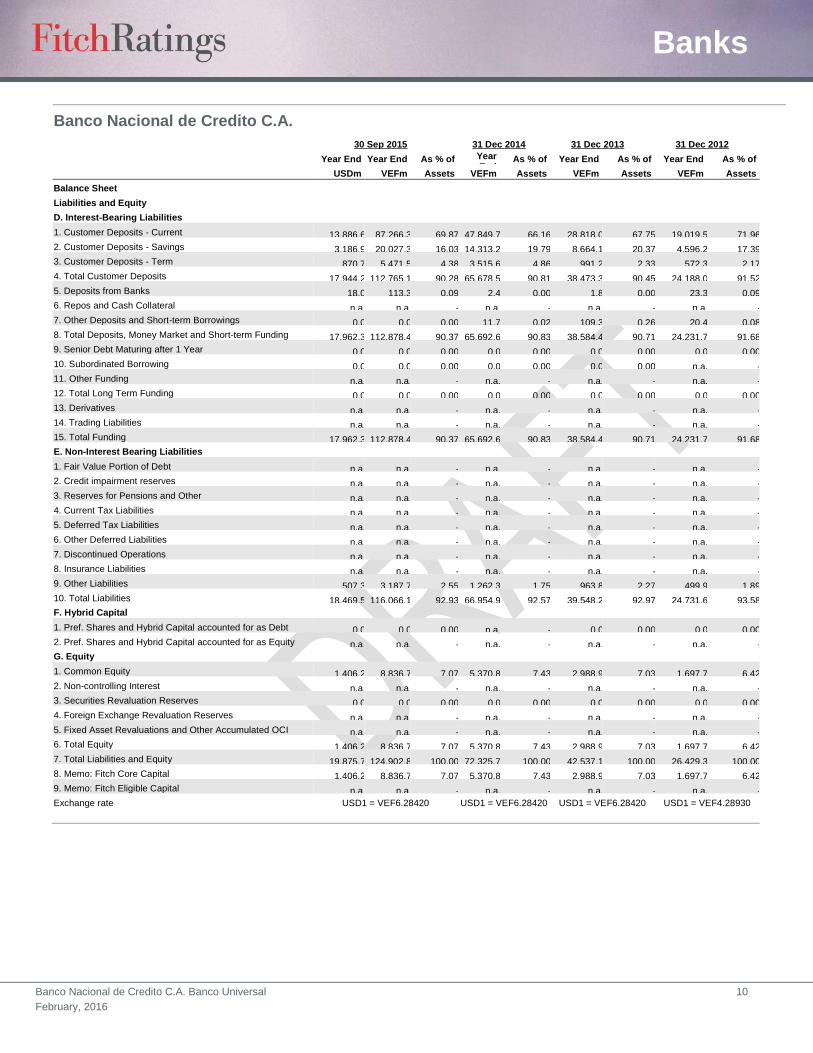
Banco Nacional de Credito C.A.
30 Sep 2015 31 Dec 2014 31 Dec 2013 31 Dec 2012
Year End Year End As % of Year
End As % of Year End As % of Year End As % of
USDm VEFm Assets VEFm Assets VEFm Assets VEFm Assets
Balance Sheet Liabilities and Equity D. Interest-Bearing Liabilities 1. Customer Deposits - Current 13,886.6 87,266.3 69.87 47,849.7 66.16 28,818.0 67.75 19,019.5 71.96
2. Customer Deposits - Savings 3,186.9 20,027.3 16.03 14,313.2 19.79 8,664.1 20.37 4,596.2 17.39
3. Customer Deposits - Term 870.7 5,471.5 4.38 3,515.6 4.86 991.2 2.33 572.3 2.17
4. Total Customer Deposits 17,944.2 112,765.1 90.28 65,678.5 90.81 38,473.3 90.45 24,188.0 91.52
5. Deposits from Banks 18.0 113.3 0.09 2.4 0.00 1.8 0.00 23.3 0.09
6. Repos and Cash Collateral n.a. n.a. - n.a. - n.a. - n.a. -
7. Other Deposits and Short-term Borrowings 0.0 0.0 0.00 11.7 0.02 109.3 0.26 20.4 0.08
8. Total Deposits, Money Market and Short-term Funding 17,962.3 112,878.4 90.37 65,692.6 90.83 38,584.4 90.71 24,231.7 91.68
9. Senior Debt Maturing after 1 Year 0.0 0.0 0.00 0.0 0.00 0.0 0.00 0.0 0.00
10. Subordinated Borrowing 0.0 0.0 0.00 0.0 0.00 0.0 0.00 n.a. -
11. Other Funding n.a. n.a. - n.a. - n.a. - n.a. -
12. Total Long Term Funding 0.0 0.0 0.00 0.0 0.00 0.0 0.00 0.0 0.00
13. Derivatives n.a. n.a. - n.a. - n.a. - n.a. -
14. Trading Liabilities n.a. n.a. - n.a. - n.a. - n.a. -
15. Total Funding 17,962.3 112,878.4 90.37 65,692.6 90.83 38,584.4 90.71 24,231.7 91.68
E. Non-Interest Bearing Liabilities
1. Fair Value Portion of Debt n.a. n.a. - n.a. - n.a. - n.a. -
2. Credit impairment reserves n.a. n.a. - n.a. - n.a. - n.a. -
3. Reserves for Pensions and Other n.a. n.a. - n.a. - n.a. - n.a. -
4. Current Tax Liabilities n.a. n.a. - n.a. - n.a. - n.a. -
5. Deferred Tax Liabilities n.a. n.a. - n.a. - n.a. - n.a. -
6. Other Deferred Liabilities n.a. n.a. - n.a. - n.a. - n.a. -
7. Discontinued Operations n.a. n.a. - n.a. - n.a. - n.a. -
8. Insurance Liabilities n.a. n.a. - n.a. - n.a. - n.a. -
9. Other Liabilities 507.3 3,187.7 2.55 1,262.3 1.75 963.8 2.27 499.9 1.89
10. Total Liabilities 18,469.5 116,066.1 92.93 66,954.9 92.57 39,548.2 92.97 24,731.6 93.58
F. Hybrid Capital
1. Pref. Shares and Hybrid Capital accounted for as Debt 0.0 0.0 0.00 n.a. - 0.0 0.00 0.0 0.00
2. Pref. Shares and Hybrid Capital accounted for as Equity n.a. n.a. - n.a. - n.a. - n.a. -
G. Equity
1. Common Equity 1,406.2 8,836.7 7.07 5,370.8 7.43 2,988.9 7.03 1,697.7 6.42
2. Non-controlling Interest n.a. n.a. - n.a. - n.a. - n.a. -
3. Securities Revaluation Reserves 0.0 0.0 0.00 0.0 0.00 0.0 0.00 0.0 0.00
4. Foreign Exchange Revaluation Reserves n.a. n.a. - n.a. - n.a. - n.a. -
5. Fixed Asset Revaluations and Other Accumulated OCI n.a. n.a. - n.a. - n.a. - n.a. -
6. Total Equity 1,406.2 8,836.7 7.07 5,370.8 7.43 2,988.9 7.03 1,697.7 6.42
7. Total Liabilities and Equity 19,875.7 124,902.8 100.00 72,325.7 100.00 42,537.1 100.00 26,429.3 100.00
8. Memo: Fitch Core Capital 1,406.2 8,836.7 7.07 5,370.8 7.43 2,988.9 7.03 1,697.7 6.42
9. Memo: Fitch Eligible Capital n.a. n.a. - n.a. - n.a. - n.a. -
Exchange rate USD1 = VEF6.28420 USD1 = VEF6.28420 USD1 = VEF6.28420 USD1 = VEF4.28930

Banks
Banco Nacional de Credito C.A. Banco Universal 11
February, 2016
Banco Nacional de Credito C.A.
30 Sep 2015 31 Dec 2014 31 Dec 2013 31 Dec 2012
Year End Year End Year End Year End
Summary Analytics A. Interest Ratios 1. Interest Income on Loans/ Average Gross Loans 22.61 16.95 16.06 16.45
2. Interest Expense on Customer Deposits/ Average Customer Deposits 4.35 4.19 3.85 3.80
3. Interest Income/ Average Earning Assets 19.91 16.29 14.75 15.61
4. Interest Expense/ Average Interest-bearing Liabilities 4.41 4.22 3.88 3.89
5. Net Interest Income/ Average Earning Assets 13.95 10.82 9.96 10.89
6. Net Int. Inc Less Loan Impairment Charges/ Av. Earning Assets 12.73 9.65 9.77 9.57
7. Net Interest Inc Less Preferred Stock Dividend/ Average Earning Assets 13.95 10.82 9.96 10.89
B. Other Operating Profitability Ratios
1. Non-Interest Income/ Gross Revenues 6.06 10.14 5.83 11.41
2. Non-Interest Expense/ Gross Revenues 59.60 67.12 71.64 59.57
3. Non-Interest Expense/ Average Assets 5.92 5.68 5.59 5.51
4. Pre-impairment Op. Profit/ Average Equity 54.34 39.02 31.80 60.04
5. Pre-impairment Op. Profit/ Average Total Assets 4.01 2.78 2.21 3.74
6. Loans and securities impairment charges/ Pre-impairment Op. Profit 20.27 29.76 6.58 26.46
7. Operating Profit/ Average Equity 43.33 27.41 29.71 44.15
8. Operating Profit/ Average Total Assets 3.20 1.95 2.07 2.75
9. Taxes/ Pre-tax Profit n.a. n.a. n.a. n.a.
10. Pre-Impairment Operating Profit / Risk Weighted Assets n.a. n.a. n.a. n.a.
11. Operating Profit / Risk Weighted Assets 4.76 3.25 3.66 4.77
C. Other Profitability Ratios
1. Net Income/ Average Total Equity 35.33 28.71 29.83 42.79
2. Net Income/ Average Total Assets 2.61 2.05 2.07 2.66
3. Fitch Comprehensive Income/ Average Total Equity 35.33 28.71 29.83 42.79
4. Fitch Comprehensive Income/ Average Total Assets 2.61 2.05 2.07 2.66
5. Net Income/ Av. Total Assets plus Av. Managed Securitized Assets 19.21 0.16 0.73 0.33
6. Net Income/ Risk Weighted Assets 3.88 3.40 3.68 4.63
7. Fitch Comprehensive Income/ Risk Weighted Assets n.a. n.a. n.a. n.a.
D. Capitalization
1. Fitch Core Capital/ Risk Weighted Assets 13.49 16.06 16.40 15.18
2. Fitch Eligible Capital/ Risk Weighted Assets n.a. n.a. n.a. n.a.
3. Tangible Common Equity/ Tangible Assets 7.07 7.43 7.03 6.42
4. Tier 1 Regulatory Capital Ratio n.a. n.a. n.a. n.a.
5. Total Regulatory Capital Ratio 13.05 14.71 14.50 13.83
6. Core Tier 1 Regulatory Capital Ratio n.a. n.a. n.a. n.a.
7. Equity/ Total Assets 7.07 7.43 7.03 6.42
8. Cash Dividends Paid & Declared/ Net Income n.a. n.a. n.a. n.a.
9. Cash Dividend Paid & Declared/ Fitch Comprehensive Income n.a. n.a. n.a. n.a.
10. Cash Dividends & Share Repurchase/Net Income n.a. n.a. n.a. n.a.
11. Internal Capital Generation 28.75 21.17 22.42 30.48
E. Loan Quality
1. Growth of Total Assets 72.69 70.03 60.95 73.55
2. Growth of Gross Loans 85.65 81.15 65.64 55.48
3. Impaired Loans/ Gross Loans 0.06 0.05 0.06 0.18
4. Reserves for Impaired Loans/ Gross Loans 1.97 2.20 1.80 2.62
5. Reserves for Impaired Loans/ Impaired Loans 3,175.12 4,582.66 3,081.03 1,469.16
6. Impaired loans less Reserves for Impaired Loans/ Fitch Core Capital (14.41) (14.44) (11.57) (17.26)
7. Impaired Loans less Reserves for Impaired Loans/ Equity (14.41) (14.44) (11.57) (17.26)
8. Loan Impairment Charges/ Average Gross Loans 1.57 1.74 0.32 2.00
9. Net Charge-offs/ Average Gross Loans 0.01 n.a. n.a. 1.86
10. Impaired Loans + Foreclosed Assets/ Gross Loans + Foreclosed Assets 0.06 0.05 0.17 0.77
F. Funding
1. Loans/ Customer Deposits 59.27 54.81 51.65 49.60
2. Interbank Assets/ Interbank Liabilities n.a. n.a. n.a. 0.00
3. Customer Deposits/ Total Funding (excluding derivatives) 99.90 99.98 99.71 99.82

Banks
Banco Nacional de Credito C.A. Banco Universal 12
February, 2016
ALL FITCH CREDIT RATINGS ARE SUBJECT TO CERTAIN LIMITATIONS AND DISCLAIMERS. PLEASE READ THESE LIMITATIONS AND DISCLAIMERS BY FOLLOWING THIS LINK: HTTP://FITCHRATINGS.COM/UNDERSTANDINGCREDITRATINGS. IN ADDITION, RATING DEFINITIONS AND THE TERMS OF USE OF SUCH RATINGS ARE AVAILABLE ON THE AGENCY'S PUBLIC WEB SITE AT WWW.FITCHRATINGS.COM. PUBLISHED RATINGS, CRITERIA, AND METHODOLOGIES ARE AVAILABLE FROM THIS SITE AT ALL TIMES. FITCH'S CODE OF CONDUCT, CONFIDENTIALITY, CONFLICTS OF INTEREST, AFFILIATE FIREWALL, COMPLIANCE, AND OTHER RELEVANT POLICIES AND PROCEDURES ARE ALSO AVAILABLE FROM THE CODE OF CONDUCT SECTION OF THIS SITE. FITCH MAY HAVE PROVIDED ANOTHER PERMISSIBLE SERVICE TO THE RATED ENTITY OR ITS RELATED THIRD PARTIES. DETAILS OF THIS SERVICE FOR RATINGS FOR WHICH THE LEAD ANALYST IS BASED IN AN EU-REGISTERED ENTITY CAN BE FOUND ON THE ENTITY SUMMARY PAGE FOR THIS ISSUER ON THE FITCH WEBSITE.
Copyright © 2016 by Fitch Ratings, Inc., Fitch Ratings Ltd. and its subsidiaries. 33 Whitehall Street, NY, NY 10004.Telephone: 1-800-753-4824, (212) 908-0500. Fax: (212) 480-4435. Reproduction or retransmission in whole or in part is prohibited except by permission. All rights reserved. In issuing and maintaining its ratings, Fitch relies on factual information it receives from issuers and underwriters and from other sources Fitch believes to be credible. Fitch conducts a reasonable investigation of the factual information relied upon by it in accordance with its ratings methodology, and obtains reasonable verification of that information from independent sources, to the extent such sources are available for a given security or in a given jurisdiction. The manner of Fitch’s factual investigation and the scope of the third-party verification it obtains will vary depending on the nature of the rated security and its issuer, the requirements and practices in the jurisdiction in which the rated security is offered and sold and/or the issuer is located, the availability and nature of relevant public information, access to the management of the issuer and its advisers, the availability of pre-existing third-party verifications such as audit reports, agreed-upon procedures letters, appraisals, actuarial reports, engineering reports, legal opinions and other reports provided by third parties, the availability of independent and competent third-party verification sources with respect to the particular security or in the particular jurisdiction of the issuer, and a variety of other factors. Users of Fitch’s ratings should understand that neither an enhanced factual investigation nor any third-party verification can ensure that all of the information Fitch relies on in connection with a rating will be accurate and complete. Ultimately, the issuer and its advisers are responsible for the accuracy of the information they provide to Fitch and to the market in offering documents and other reports. In issuing its ratings Fitch must rely on the work of experts, including independent auditors with respect to financial statements and attorneys with respect to legal and tax matters. Further, ratings are inherently forward-looking and embody assumptions and predictions about future events that by their nature cannot be verified as facts. As a result, despite any verification of current facts, ratings can be affected by future events or conditions that were not anticipated at the time a rating was issued or affirmed.
The information in this report is provided “as is” without any representation or warranty of any kind. A Fitch rating is an opinion as to the creditworthiness of a security. This opinion is based on established criteria and methodologies that Fitch is continuously evaluating and updating. Therefore, ratings are the collective work product of Fitch and no individual, or group of individuals, is solely responsible for a rating. The rating does not address the risk of loss due to risks other than credit risk, unless such risk is specifically mentioned. Fitch is not engaged in the offer or sale of any security. All Fitch reports have shared authorship. Individuals identified in a Fitch report were involved in, but are not solely responsible for, the opinions stated therein. The individuals are named for contact purposes only. A report providing a Fitch rating is neither a prospectus nor a substitute for the information assembled, verified and presented to investors by the issuer and its agents in connection with the sale of the securities. Ratings may be changed or withdrawn at anytime for any reason in the sole discretion of Fitch. Fitch does not provide investment advice of any sort. Ratings are not a recommendation to buy, sell, or hold any security. Ratings do not comment on the adequacy of market price, the suitability of any security for a particular investor, or the tax-exempt nature or taxability of payments made in respect to any security. Fitch receives fees from issuers, insurers, guarantors, other obligors, and underwriters for rating securities. Such fees generally vary from US$1,000 to US$750,000 (or the applicable currency equivalent) per issue. In certain cases, Fitch will rate all or a number of issues issued by a particular issuer, or insured or guaranteed by a particular insurer or guarantor, for a single annual fee. Such fees are expected to vary from US$10,000 to US$1,500,000 (or the applicable currency equivalent). The assignment, publication, or dissemination of a rating by Fitch shall not constitute a consent by Fitch to use its name as an expert in connection with any registration statement filed under the United States securities laws, the Financial Services and Markets Act of 2000 of the United Kingdom, or the securities laws of any particular jurisdiction. Due to the relative efficiency of electronic publishing and distribution, Fitch research may be available to electronic subscribers up to three days earlier than to print subscribers.
The ratings above were solicited by, or on behalf of, the issuer, and therefore, Fitch has been
compensated for the provision of the ratings.