Embed Size (px)
Citation preview
“Venetian Blind” Direct Energy Conversion for Fusion Reactors
By Ralph W. Moir, William L. Barr, Lawrence Livermore Laboratory, University of California, Livermore, CA, United States of America
Contact information as of 2009 for Ralph Moir is Vallecitos Molten Salt Research, <[email protected]>, 607 East Vallecitos Road, Livermore, CA 94550.
This work was performed under the auspices of the US Atomic Energy Commission.
AbstractA new direct energy conversion technique that uses the angular dependent transmission of ribbon grids, which resemble Venetian blinds, to recover the energy of particles leaking out of a fusion reactor is discussed. This converter works well, even to energies as low as 10 keV, because of its excellent space charge handling ability. This low energy operating range makes direct energy conversion possible on closed confinement devices; operation at about 100 keV might be useful on open confinement devices. Energy recovery e ciencies of 60 to 70 are predicted. Examples are presented in which a direct energy converter with e ciencies in this range, when viewed as a topping cycle to a thermal converter, could considerably improve the reactor prospects of both open and closed field line confinement schemes.
1. Introduction The principle of converting the kinetic energy of charged particles directly to electricity has been known for a long time. The first major application has been to recover the unused energy of electrons leaving a traveling wave tube.1 The first seemingly practical application of recovering the energy of the plasma that leaks out of a fusion reactor is the work of Post.2 His scheme has four main steps. First, the plasma is guided through a magnetic expander or nozzle that simultaneously reduces the density and converts the random motion to directed motion. Second, the electrons are separated from the ions. Third, the ions are slowed down by an electric field and separated into energy groups. Finally, the slow ions are collected on high voltage electrodes, thus forming readily usable direct currents at high voltage. For energy separation, Post suggested using periodic electrostatic focusing, which guides the fast parti
cles as they slow down. However, for su ciently slow ions the focusing fails and the particles are diverted into a collector electrode.
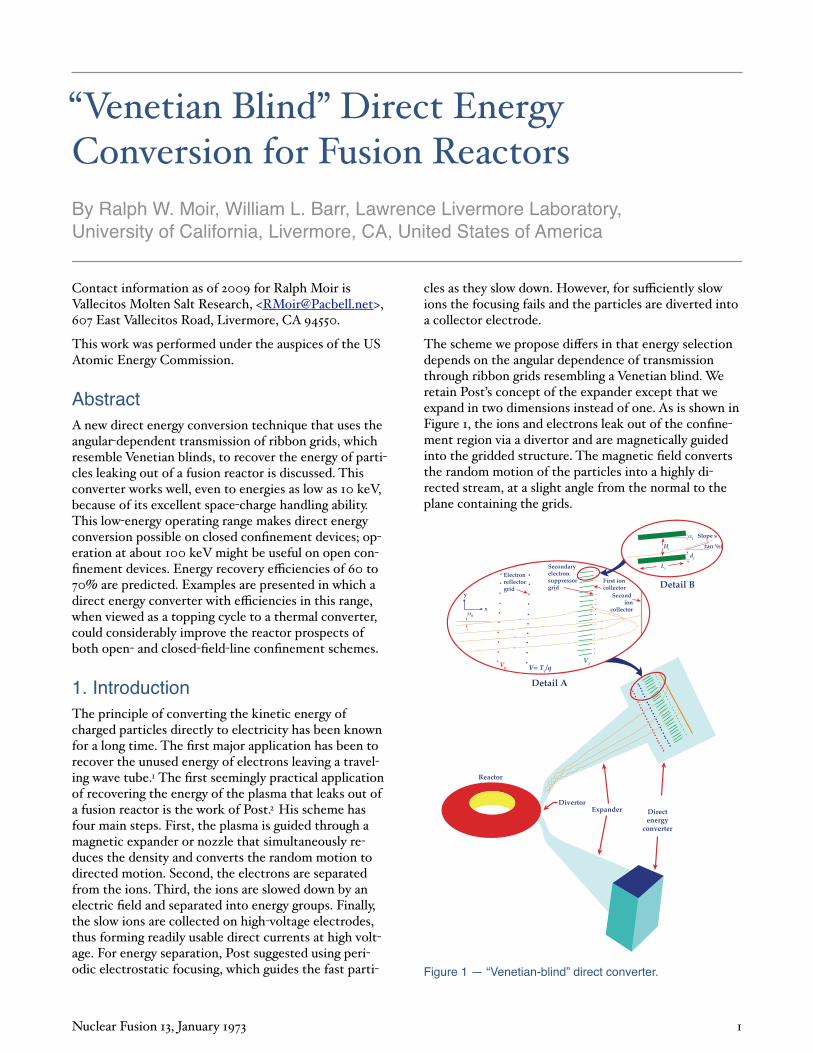
The scheme we propose di ers in that energy selection depends on the angular dependence of transmission through ribbon grids resembling a Venetian blind. We retain Post’s concept of the expander except that we expand in two dimensions instead of one. As is shown in Figure 1, the ions and electrons leak out of the confinement region via a divertor and are magnetically guided into the gridded structure. The magnetic field converts the random motion of the particles into a highly directed stream, at a slight angle from the normal to the plane containing the grids.
Directenergy
converter
ExpanderDivertor
Detail A
Detail B
Secondaryelectronsuppressorgrid
First ioncollector
Second ion
collector
Electronreflectorgrid
V0
V1V= Te/q
Hi
Li
di
i
tan-1(s)
Reactor
y
x0
Slope s
Figure 1 — “Venetian-blind” direct converter.
Nuclear Fusion 13, January 1973 1
The function of the negative grid is to reflect the electrons and allow the ions to pass on toward the positive Venetian blind like ribbon grids. Initially the ions are directed at a slight angle to the applied uniform electric field. Therefore, the trajectories are parabolic, as is shown in Figure 1. A related idea, which also uses parabolic trajectories, is described by Richard Post.3
The incoming ion trajectories are aligned with the ribbons and thus see a rather tenuous grid. However, after the ions have lost their forward motion in the xdirection they turn around and see a rather opaque grid on their return path. The ions that hit the ribbon grid are collected and form a current at the voltage of that grid. The spacing between grids can be quite small a few centimeters . Since the space charge field is in the same direction as the applied field, space charge e ects are minimal, even at energy as as low as 10 keV. To handle large total powers, the area of the collector can be made large in both y and z directions, perpendicular to the directed motion. Since the grid spacings are small compared to the beam width, beam blow up will not occur as a result of space charge.
2.0 Analysis of Collector EfficiencyBefore writing the expressions for e ciency we need to calculate the particle’s trajectory and transmission through the grids. The strength of the expander’s magnetic field is so low at the collector that, although it penetrates the collector structure, its e ects on trajectories in the collector should be negligible. From the conservation of energy we have:
1
2
1
2
1
2
1
2
202
202
mv mv
mv eV x mv
y y
x x
�
� �
and
( )1a
The slope of the particle at x is
S xv
v
v
veV x
m
y
x
y
x
( )( )
/� ���
���
0
0
21 2
2
1b
where the potential is V x . Using the initial angle of the particle 0 and the initial energy W0 we obtain
1
2
1
2
0
0
20
20
20
20
mv W
mv W
y
x
�
�
sin
cos
�
�
and
Eq. 2
Then, we can rewrite S as follows:
S xeV x
W
( )sin
cos( )
/�
����
�
�
�
0
20
0
1 2
3
From Figure 1 we see that the transmission of the grids in the forward direction Tf is
TL S d S
Hf
i i i i i i
ii� �
� � �� �
�11 1
1
sin tan cos tan
cos tan
� �SSi�
4
and in the backward direction is
TL S d S
Hb
i i i i i i
ii� �
� � �� �
�11 1
1
sin tan cos tan
cos tan
� �SSi�
5
The subscript i refers to the i th grid. The symbol Li is the ribbon width, di the thickness, and Hi the ribbon spacing; i is the tilt angle of the ribbon. The expressions for transmission can be simplified, thus giving:
TL
HS
d
HS
T
fi
ii i i
i
ii i ii
� � � � �� 1 sin cos cos sin� � � �
and
bbi
ii i i
i
ii i ii
L
HS
d
HS� � � � �� 1 sin cos cos sin� � � �
5b
Space charge should not a ect the e ciency because the slope of the trajectories, although slightly altered from the parabolic form, depends only on the local potential see Equation 3 , which is una ected by space charge at
the ribbons where the transmission is calculated.
The e ciency is the fraction of the input power that is recovered:
� �� �
�V x Vi ii
current collected on
input power
6
where Vi is the potential on the i th grid. Let the current distribution dI/ dW be given as a function of energy and be normalized so that the input power is unity:
input power � ��
� WdI
dWdW
01
6b
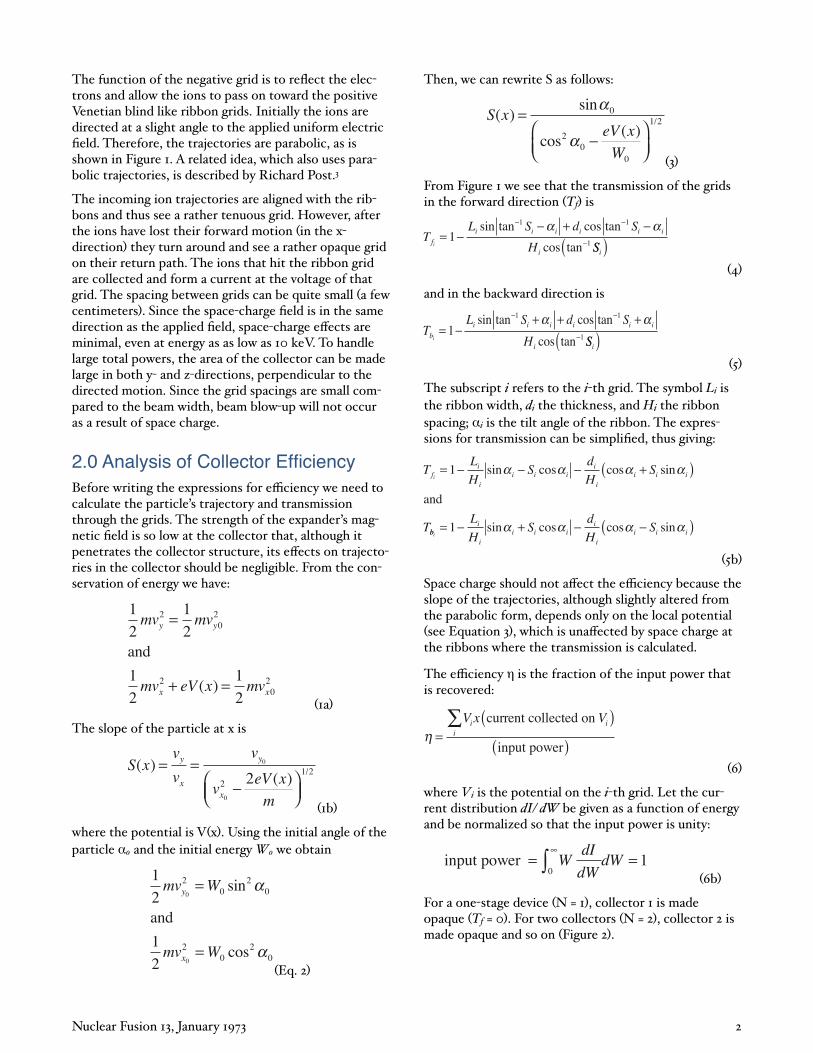
For a one stage device N = 1 , collector 1 is made opaque Tf = 0 . For two collectors N = 2 , collector 2 is made opaque and so on Figure 2 .
Nuclear Fusion 13, January 1973 2
V=0 Vg V1 V2 V3 V4V=0 Vg V1 V2 V3
V=0 Vg V1 V2V=0 Vg V1N = 1 N = 2
N = 3 N = 4
d3
Figure 2 — Electrode configuration for the one-, two-, three-, and four collector devices.
It is interesting that for the one collector device, the configuration and potentials are identical to a vacuumtube triode. The e ciency of a single stage device can be written as:
N V T TdI
dWdW
V T Td
fV f
g f f
g
g
� �
� �� ��
�
�
�
�
1
1 1
1 1
0
01
0
,�
� II
dWdW
V V V T TdI
dWdWg g f
V
b
i
g� �� ��� �� �� �� 1 0 0
16c
where Vi’ is equal to qVi/ cos2 0 and Tf0 and Tfg are the
transmissions of the grounded grid and the negative
grid, respectively, and is the number of secondary electrons produced per ion hitting the grid. The first term gives the energy recovered from ions collected on V1. The second term is negative and represents both the ions hitting the front of the electron reflector grid Vg and the secondary electrons leaving the grid. The last term represents the ions striking the back side of the electron reflector grid and the secondary electrons, which in this case stream to the collector V1 .
For two collectors the e ciency is given as
�2 1 0 1 0 1 11
2
1 1� �� � �� �� ���V T T T T T T Td
f f f f f f bV
V
g g*
* II
dWdW
VT T T V T T TdI
dWf f f f f fV g g� �� ��� ��
�
� 1 20 1 0 12
1*
ddW
V V T T T T V Tf f fg� �� �� � �2 1 11 1
0 1� grid wire grid wiire� �� ��
� ��
�
��
T T TdI
dWdW
V T
f f fV
V
g f
g0 11
2
01 1
0
*
*
� ��� � �� �
���
�
TdI
dWdW
V VL
H
d
H
f
g
g
� � �11
11
1
11sin cos �� � �� �
���
�
���
��
���
�V V V
L
H
d
Hg � � �2 11
11
1
11sin cos��
�� � �� x T T TdI
dWdW T T T T T
dI
dWdf f b f f f b bg g g g0 0 1 1
1 1 WWV
VV
1
21
0 '
**
��������
6d
The last term should be negligible because there are few particles below energy qV1 and Tb1 is near zero.
The expressions for three and four collectors are of the same form but have many more terms.
The terms that appear are of three basic types. Positive terms give the energy recovered from ions. Negative terms proportional to give the energy carried away by secondary electrons. The remaining negative term gives the energy lost as ion current to the negative grid. Any ions that are reflected and escape collection contribute nothing, as if they were collected at zero potential. They are, of course, included in through the normalization of dI/dW.
Just behind each set of collector ribbons is the secondary electron suppression grid whose transmission is Tgridwir . We assume that the secondary electrons formed on the ribbon do not escape, but that each ion hitting
the suppression grid creates secondary electrons which carry away considerable energy.
Two additional assumptions are made in the expression for collection e ciency. The first is that the equipotential surfaces are planar between grids. This is a good approximation, except near grid wires or ribbon edges where distortions will cause focus e ects. The second is that there are no correlations from one grid to the next. This means, for example, that we neglect the e ect of one grid creating a “shadow” on succeeding grids. Both of these e ects should be analyzed further.
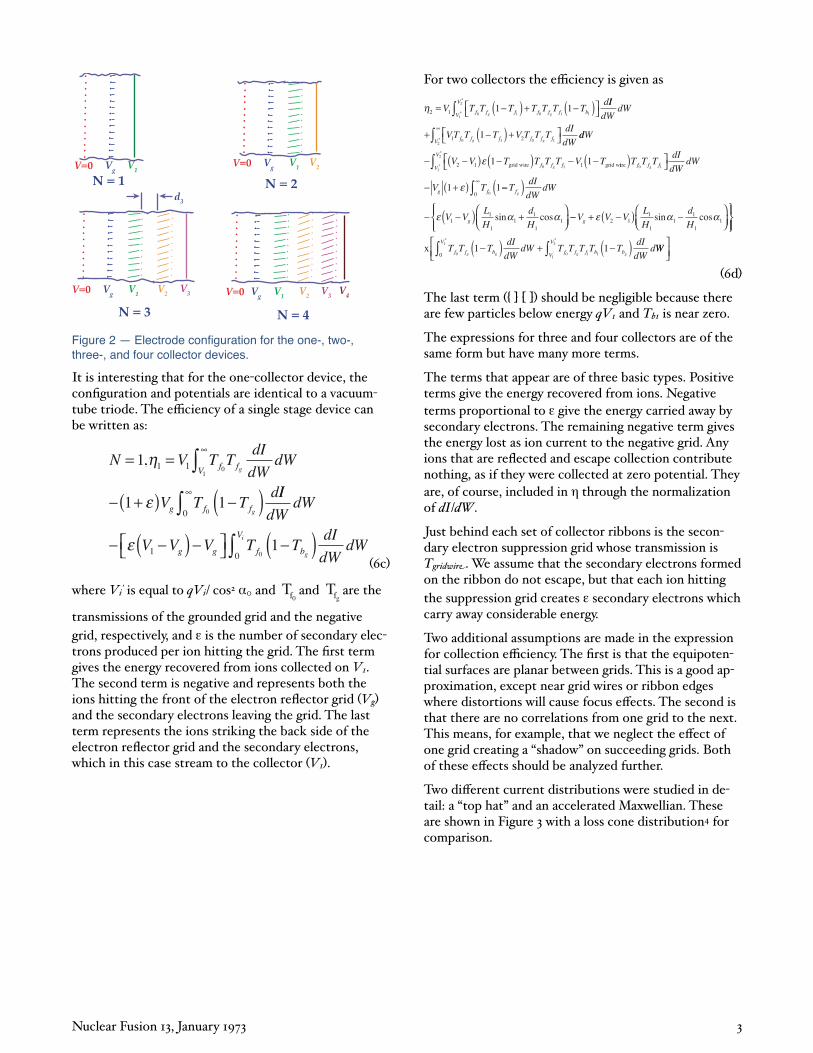
Two di erent current distributions were studied in detail: a “top hat” and an accelerated Maxwellian. These are shown in Figure 3 with a loss cone distribution4 for comparison.
Nuclear Fusion 13, January 1973 3
0.7
0.6
0.5
0.4
0.3
0.2
0.1
0
Accelerated Maxwellian
Top Hat
Loss Cone
0 1 2 3 4 5 6 7 8 9W
dI/dW
Figure 3 — Energy distribution of the ion current for three cases: loss cone appropriate to an open-end device, accel-erated Maxwellian appropriate to a toroidal device, and a simple flat top distribution.
There are no ions having energy below some minima because we assume the plasma ambipolar potential is positive. This positive plasma potential accelerates ions and decelerates electrons. If the plasma potential were negative, the current distribution would extend down to zero energy.
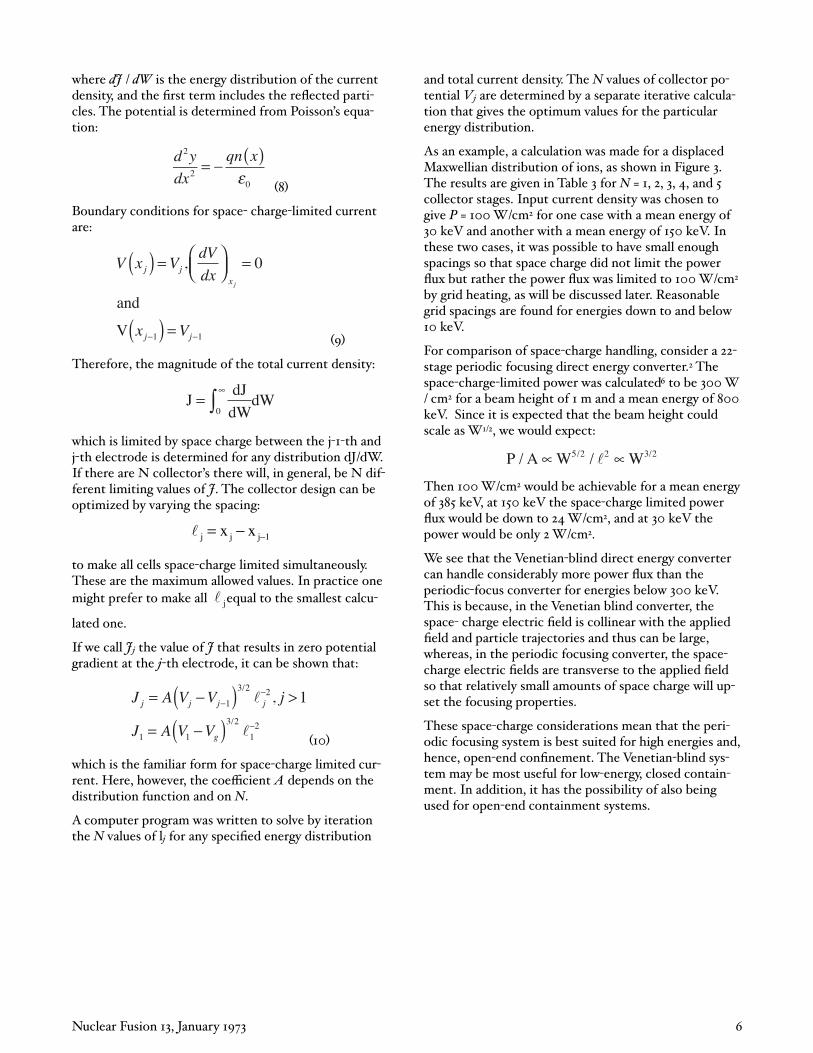
The procedure used to find the optimum e ciency was to choose the entrance angle 0 and then vary each parameter, such as the ribbon dimensions, angles, and spacings, by a small amount so that the e ciency increased. Once the optimum e ciency was found, the
angle 0 was varied to find the best angle. The values of
Tfo, Tfg, and Tbg were 0.99. The potential of the negative grid Vg was always taken to be 0.2 times the minimum
energy or approximately 10 ’0 of the mean energy. The results of this optimization technique for the two distributions are given in Tables 1 and 2.
To see the e ect of finite ribbon width on e ciency, all of the parameters except d/Li were held constant. Then, the e ciency for various values of d/Li was calculated. These results are shown in Figure 4a. Figure 4b shows the e ect of varying the entrance angle, 0. In a real situation the entrance angle would have a spread, perhaps ±0.03 radians. Figure 4c is a plot of e ciency versus number of collectors showing each of these e ects.
We see that the top hat distribution, which had a narrower energy spread, gave a higher e ciency than the accelerated Maxwellian. This suggests a way of improving the e ciency: separate the input beam into groups, each having a smaller spread. From Figure 4 we see that the top hat distribution, including angular spread, finite ribbon width, and secondary electrons, gave e ciencies of 55, 67, 72, and 75 for one, two, three, and four collectors. In all cases the loss of e ciencies as a result of secondary electrons was less than 1 , with Tgridwir = 99 , and = 3.
The overall direct energy conversion e ciency will include losses other than in the collectors e.g. charge exchange and beam interception by support structures . However, it is hoped that the overall e ciency will be close to the collection e ciency.
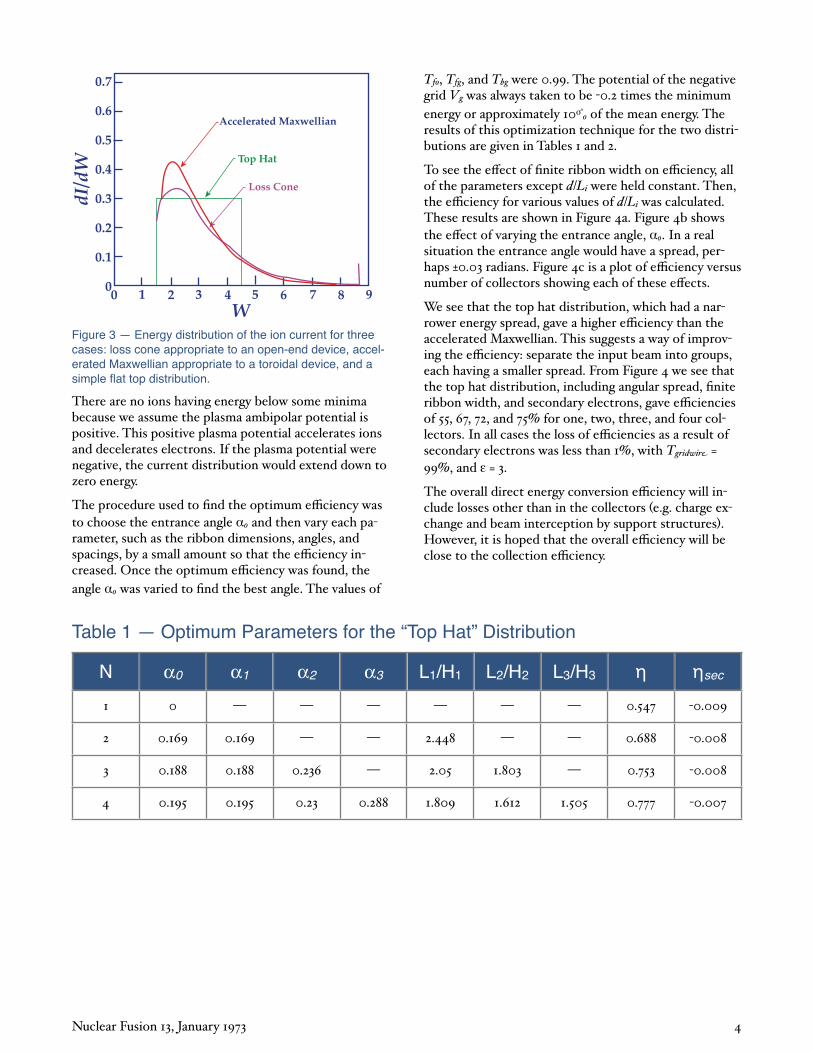
Table 1 — Optimum Parameters for the “Top Hat” Distribution
N 0 1 2 3 L1/H1 L2/H2 L3/H3 sec
1 0 0.547 0.009
2 0.169 0.169 2.448 0.688 0.008
3 0.188 0.188 0.236 2.05 1.803 0.753 0.008
4 0.195 0.195 0.23 0.288 1.809 1.612 1.505 0.777 0.007
Nuclear Fusion 13, January 1973 4
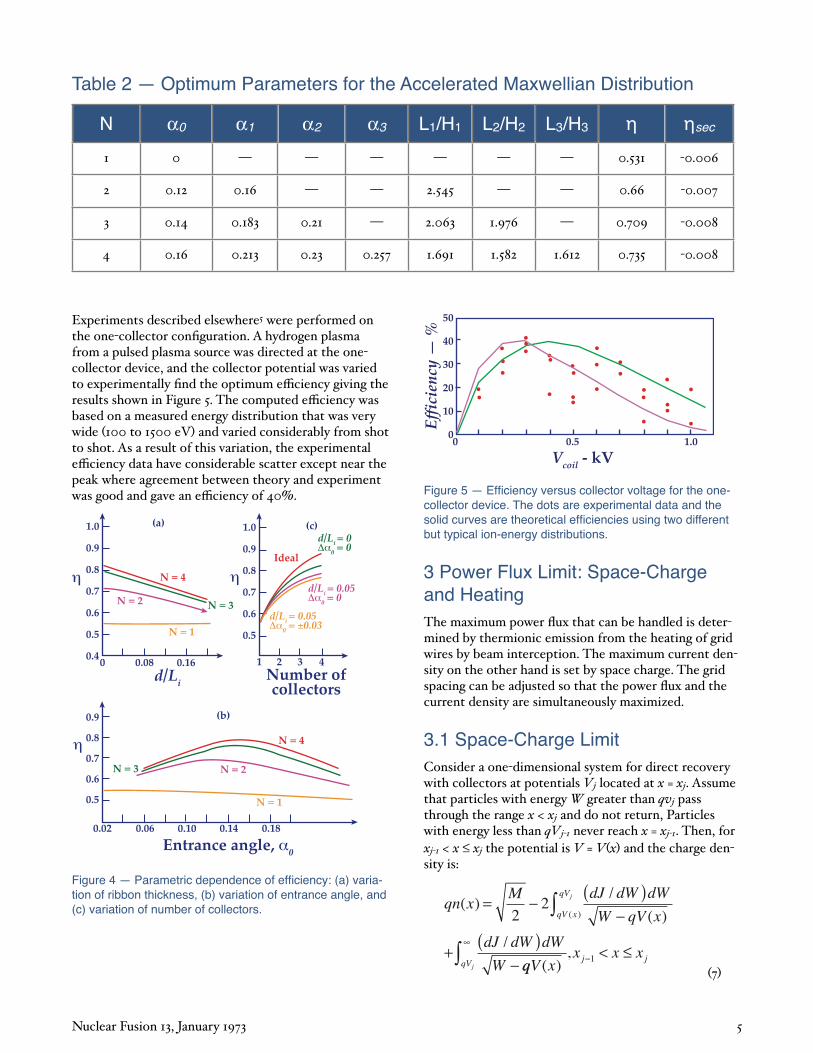
Table 2 — Optimum Parameters for the Accelerated Maxwellian Distribution
N 0 1 2 3 L1/H1 L2/H2 L3/H3 sec
1 0 0.531 0.006
2 0.12 0.16 2.545 0.66 0.007
3 0.14 0.183 0.21 2.063 1.976 0.709 0.008
4 0.16 0.213 0.23 0.257 1.691 1.582 1.612 0.735 0.008
Experiments described elsewhere5 were performed on the one collector configuration. A hydrogen plasma from a pulsed plasma source was directed at the onecollector device, and the collector potential was varied to experimentally find the optimum e ciency giving the results shown in Figure 5. The computed e ciency was based on a measured energy distribution that was very wide 100 to 1500 eV and varied considerably from shot to shot. As a result of this variation, the experimental e ciency data have considerable scatter except near the peak where agreement between theory and experiment was good and gave an e ciency of 40 .
1.0
0.9
0.8
0.7
0.6
0.5
0.40 0.08 0.16
1.0
0.9
0.8
0.7
0.6
0.5
1 3 4
0.9
0.8
0.7
0.6
0.5
0.02 0.06 0.10
2
0.14 0.18
(a) (c)
(b)
N = 4
N = 3N = 2
N = 1
N = 4
N = 3 N = 2
N = 1
d/Li
Entrance angle, 0
Number ofcollectors
d/Li = 00 = 0
d/Li = 0.050 = 0
d/Li = 0.050 = ±0.03
Ideal
Figure 4 — Parametric dependence of efficiency: (a) varia-tion of ribbon thickness, (b) variation of entrance angle, and (c) variation of number of collectors.
Vcoil - kV
Eff
icie
ncy
— %
50
40
30
20
10
00 0.5 1.0
Figure 5 — Efficiency versus collector voltage for the one-collector device. The dots are experimental data and the solid curves are theoretical efficiencies using two different but typical ion-energy distributions.
3 Power Flux Limit: Space-Charge and HeatingThe maximum power flux that can be handled is determined by thermionic emission from the heating of grid wires by beam interception. The maximum current density on the other hand is set by space charge. The grid spacing can be adjusted so that the power flux and the current density are simultaneously maximized.
3.1 Space-Charge Limit Consider a one dimensional system for direct recovery with collectors at potentials Vj located at x = xj. Assume that particles with energy W greater than qvj pass through the range x < xj and do not return, Particles with energy less than qVj 1 never reach x = xj 1. Then, for xj 1 < x xj the potential is V = V x and the charge density is:
qn xM dJ dW dW
W qV x
dJ dW dW
W
qV x
qVj( )
/
( )
/
( )� � �
�
� � �
�22
qqV xx x x
qV j jj ( )
,�
�� !1
7
Nuclear Fusion 13, January 1973 5
where dJ / dW is the energy distribution of the current density, and the first term includes the reflected particles. The potential is determined from Poisson’s equation:
d y
dx
qn x2
20
� � � �
8
Boundary conditions for space charge limited current are:
V x VdV
dx
x V
j jx
j j
j
� � ���
� �
� �� �
, 0
1 1
and
V9
Therefore, the magnitude of the total current density:
J =dJ
dW0dW
which is limited by space charge between the j 1 th and j th electrode is determined for any distribution dJ/dW. If there are N collector’s there will, in general, be N different limiting values of J. The collector design can be optimized by varying the spacing:
j = x j x j 1
to make all cells space charge limited simultaneously. These are the maximum allowed values. In practice one might prefer to make all
jequal to the smallest calcu
lated one.
If we call Jj the value of J that results in zero potential gradient at the j th electrode, it can be shown that:
J A V V j
J A V V
j j j j
g
� �� "
� �� �
�
�
1
3 2 2
1 1
3 2
12
1/
/
,
10
which is the familiar form for space charge limited current. Here, however, the coe cient A depends on the distribution function and on N.
A computer program was written to solve by iteration the N values of lj for any specified energy distribution
and total current density. The N values of collector potential Vj are determined by a separate iterative calculation that gives the optimum values for the particular energy distribution.
As an example, a calculation was made for a displaced Maxwellian distribution of ions, as shown in Figure 3. The results are given in Table 3 for N = 1, 2, 3, 4, and 5 collector stages. Input current density was chosen to give P = 100 W/cm2 for one case with a mean energy of 30 keV and another with a mean energy of 150 keV. In these two cases, it was possible to have small enough spacings so that space charge did not limit the power flux but rather the power flux was limited to 100 W/cm2 by grid heating, as will be discussed later. Reasonable grid spacings are found for energies down to and below 10 keV.
For comparison of space charge handling, consider a 22stage periodic focusing direct energy converter.2 The space charge limited power was calculated6 to be 300 W / cm2 for a beam height of 1 m and a mean energy of 800 keV. Since it is expected that the beam height could scale as W1/2, we would expect:
P / A W5/2 / 2 W3/2
Then 100 W/cm2 would be achievable for a mean energy of 385 keV, at 150 keV the space charge limited power flux would be down to 24 W/cm2, and at 30 keV the power would be only 2 W/cm2.
We see that the Venetian blind direct energy converter can handle considerably more power flux than the periodic focus converter for energies below 300 keV. This is because, in the Venetian blind converter, the space charge electric field is collinear with the applied field and particle trajectories and thus can be large, whereas, in the periodic focusing converter, the spacecharge electric fields are transverse to the applied field so that relatively small amounts of space charge will upset the focusing properties.
These space charge considerations mean that the periodic focusing system is best suited for high energies and, hence, open end confinement. The Venetian blind system may be most useful for low energy, closed containment. In addition, it has the possibility of also being used for open end containment systems.
Nuclear Fusion 13, January 1973 6
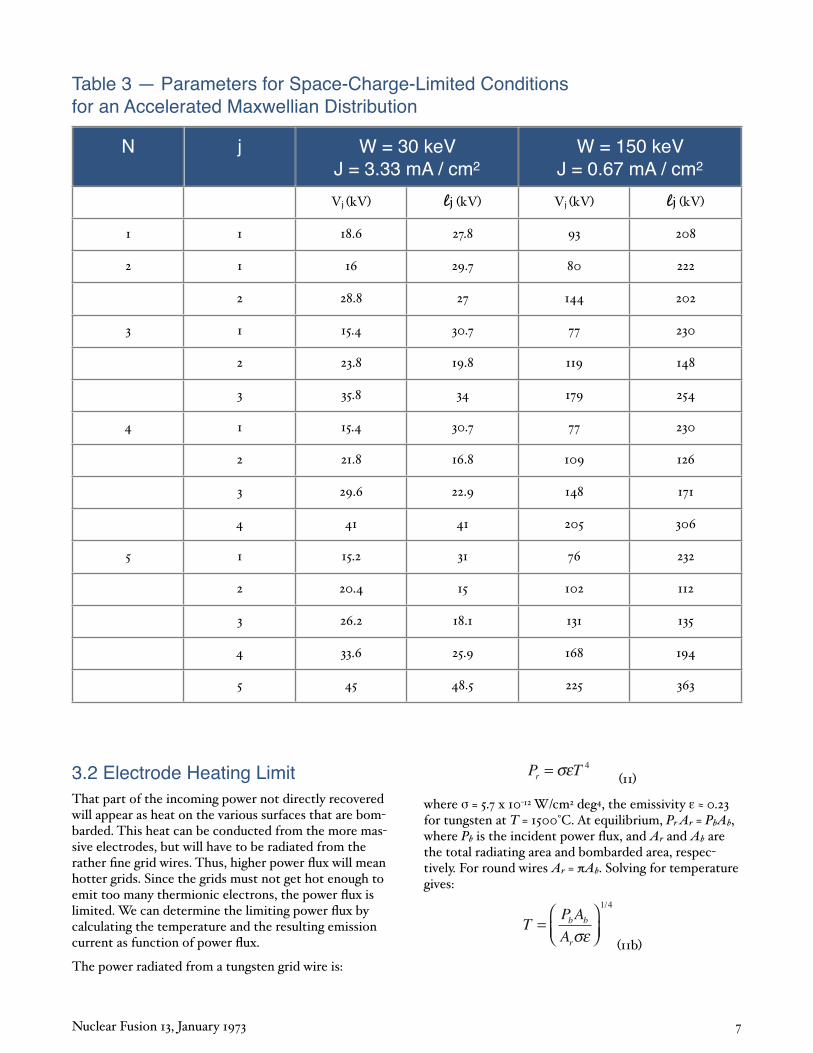
Table 3 — Parameters for Space-Charge-Limited Conditions for an Accelerated Maxwellian Distribution
N j W = 3J = 3.33
30 keVmA / cm2
W = 15J = 0.67
50 keVmA / cm2
Vj kV lj kV Vj kV lj kV
1 1 18.6 27.8 93 208
2 1 16 29.7 80 222
2 28.8 27 144 202
3 1 15.4 30.7 77 230
2 23.8 19.8 119 148
3 35.8 34 179 254
4 1 15.4 30.7 77 230
2 21.8 16.8 109 126
3 29.6 22.9 148 171
4 41 41 205 306
5 1 15.2 31 76 232
2 20.4 15 102 112
3 26.2 18.1 131 135
4 33.6 25.9 168 194
5 45 48.5 225 363
3.2 Electrode Heating LimitThat part of the incoming power not directly recovered will appear as heat on the various surfaces that are bombarded. This heat can be conducted from the more massive electrodes, but will have to be radiated from the rather fine grid wires. Thus, higher power flux will mean hotter grids. Since the grids must not get hot enough to emit too many thermionic electrons, the power flux is limited. We can determine the limiting power flux by calculating the temperature and the resulting emission current as function of power flux.
The power radiated from a tungsten grid wire is:
P Tr � #�4
11
where = 5.7 x 10 12 W/cm2 deg4, the emissivity 0.23 for tungsten at T = 1500°C. At equilibrium, Pr Ar = PbAb, where Pb is the incident power flux, and Ar and Ab are the total radiating area and bombarded area, respectively. For round wires Ar = Ab. Solving for temperature gives:
TP A
Ab b
r
����
�#�
1 4/
11b
Nuclear Fusion 13, January 1973 7
Thermionic emission current at temperature T is given by the Richardson Dushman equation:
J CT e kTe � �2 exp( / )$12
where C = 72 A/cm2 and work function Φ = 4.52 V for
tungsten.
Emission current can probably be tolerated to a current density where, on the average, one electron is emitted for each ion that strikes the grid. This criteria can be stated as follows: With a 99 transmitting grid this one ion would constitute about a 1 loss in e ciency and the electron a fraction of 1 , since it will usually be caught on the nearest positive electrode. Therefore, we put:
J A J Ae r b b�12a
where Jb = Pb e/W is the ion current density for ions of
mean energy W . Thus, the maximum allowable power
flux is
PWJ
e
WJ A
eAbb e r
b
� �13
or
A P
A
e
WJb b
re
���
����
� �
14
But, AbPb/Ar = Pr, therefore the limiting condition is
P
W eJre/
�14b
By using Equations 11 and 12 we can express J as a function of Pr, so that this relationship determines the
maximum Pr and hence Pb for any mean energy W of
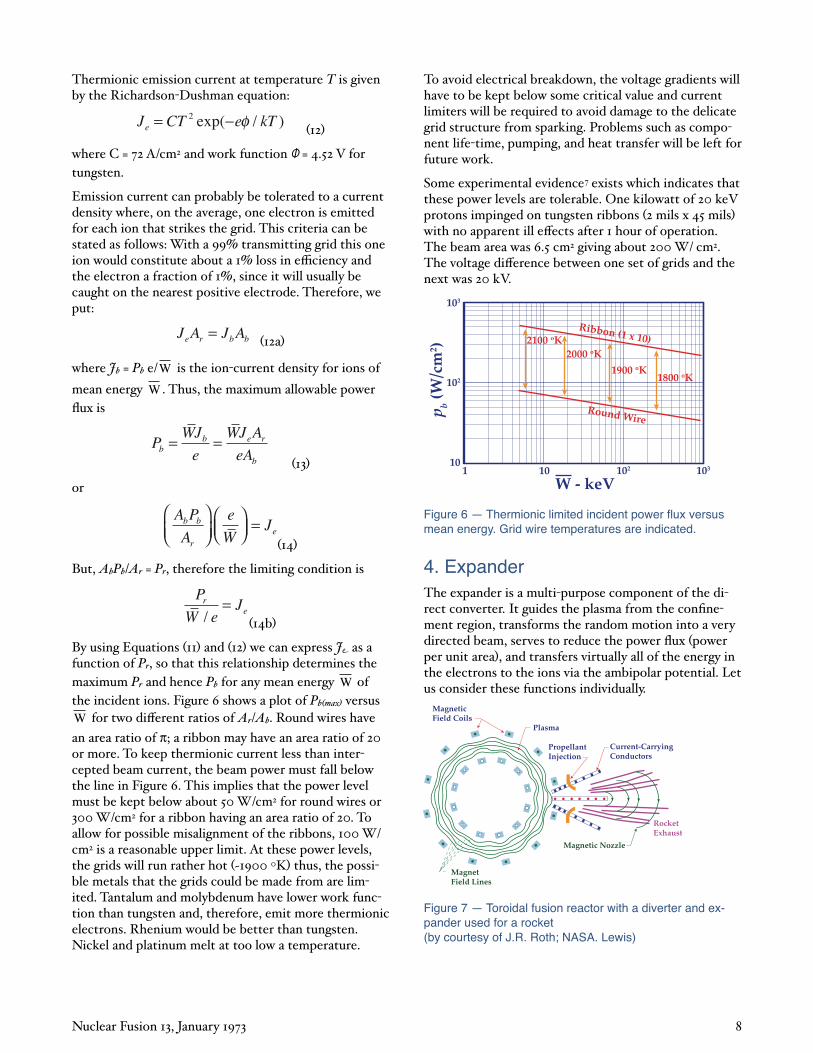
the incident ions. Figure 6 shows a plot of Pb max versus W for two di erent ratios of Ar/Ab. Round wires have
an area ratio of ; a ribbon may have an area ratio of 20 or more. To keep thermionic current less than intercepted beam current, the beam power must fall below the line in Figure 6. This implies that the power level must be kept below about 50 W/cm2 for round wires or 300 W/cm2 for a ribbon having an area ratio of 20. To allow for possible misalignment of the ribbons, 100 W/cm2 is a reasonable upper limit. At these power levels, the grids will run rather hot ~1900 0K thus, the possible metals that the grids could be made from are limited. Tantalum and molybdenum have lower work function than tungsten and, therefore, emit more thermionic electrons. Rhenium would be better than tungsten. Nickel and platinum melt at too low a temperature.
To avoid electrical breakdown, the voltage gradients will have to be kept below some critical value and current limiters will be required to avoid damage to the delicate grid structure from sparking. Problems such as component life time, pumping, and heat transfer will be left for future work.
Some experimental evidence7 exists which indicates that these power levels are tolerable. One kilowatt of 20 keV protons impinged on tungsten ribbons 2 mils x 45 mils with no apparent ill e ects after 1 hour of operation. The beam area was 6.5 cm2 giving about 200 W/ cm2. The voltage di erence between one set of grids and the next was 20 kV.
103
102
101 10310 102
p b (W
/cm
2 )
W - keV
2100 oK2000 oK
1900 oK1800 oK
Ribbon (1 x 10)
Round Wire
Figure 6 — Thermionic limited incident power flux versus mean energy. Grid wire temperatures are indicated.
4. Expander The expander is a multi purpose component of the direct converter. It guides the plasma from the confinement region, transforms the random motion into a very directed beam, serves to reduce the power flux power per unit area , and transfers virtually all of the energy in the electrons to the ions via the ambipolar potential. Let us consider these functions individually.
MagneticField Coils
Plasma
Current-CarryingConductors
RocketExhaust
Magnetic Nozzle
MagnetField Lines
PropellantInjection
Figure 7 — Toroidal fusion reactor with a diverter and ex-pander used for a rocket (by courtesy of J.R. Roth; NASA. Lewis)
Nuclear Fusion 13, January 1973 8
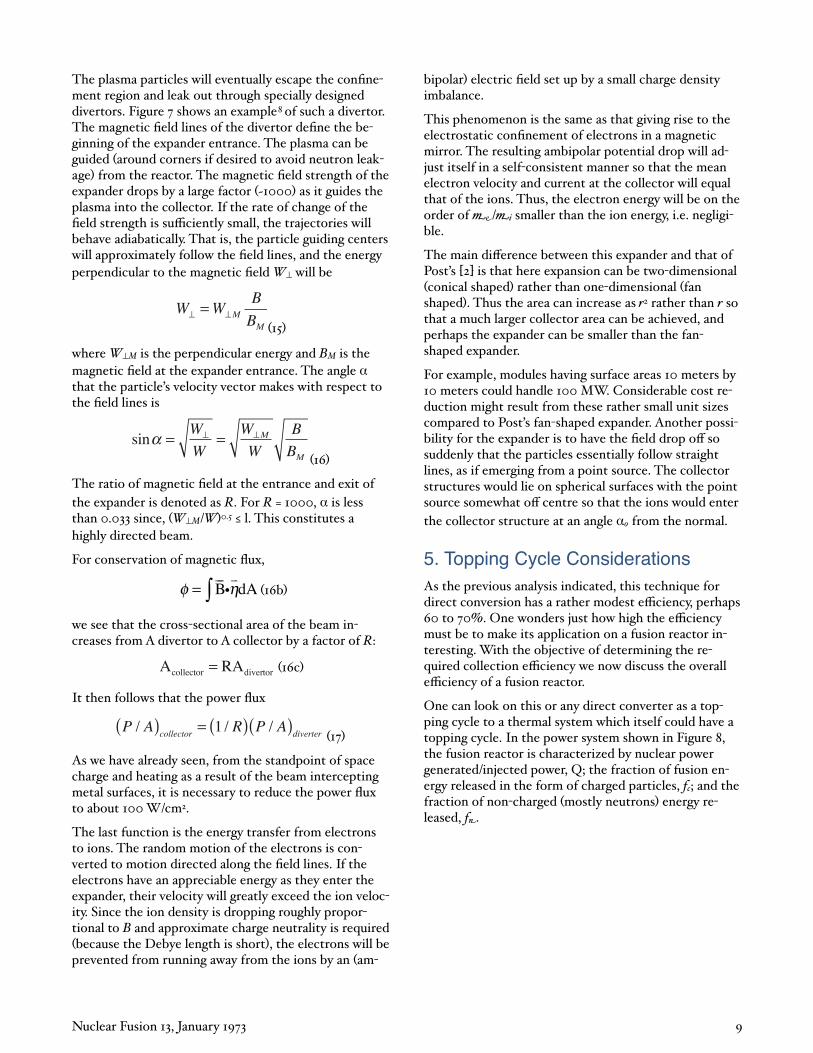
The plasma particles will eventually escape the confinement region and leak out through specially designed divertors. Figure 7 shows an example8 of such a divertor. The magnetic field lines of the divertor define the beginning of the expander entrance. The plasma can be guided around corners if desired to avoid neutron leakage from the reactor. The magnetic field strength of the expander drops by a large factor ~1000 as it guides the plasma into the collector. If the rate of change of the field strength is su ciently small, the trajectories will behave adiabatically. That is, the particle guiding centers will approximately follow the field lines, and the energy perpendicular to the magnetic field W will be
W WB
BMM
% %�15
where W M is the perpendicular energy and BM is the magnetic field at the expander entrance. The angle that the particle’s velocity vector makes with respect to the field lines is
sin� � �% %W
W
W
W
B
BM
M 16
The ratio of magnetic field at the entrance and exit of
the expander is denoted as R. For R = 1000, is less than 0.033 since, W M/W 0.5 l. This constitutes a highly directed beam.
For conservation of magnetic flux,
= Bi dA 16b
we see that the cross sectional area of the beam increases from A divertor to A collector by a factor of R:
Acollector = RAdivertor 16c
It then follows that the power flux
P A R P Acollector diverter
/ / /� � � � 117
As we have already seen, from the standpoint of space charge and heating as a result of the beam intercepting metal surfaces, it is necessary to reduce the power flux to about 100 W/cm2.
The last function is the energy transfer from electrons to ions. The random motion of the electrons is converted to motion directed along the field lines. If the electrons have an appreciable energy as they enter the expander, their velocity will greatly exceed the ion velocity. Since the ion density is dropping roughly proportional to B and approximate charge neutrality is required because the Debye length is short , the electrons will be
prevented from running away from the ions by an am
bipolar electric field set up by a small charge density imbalance.
This phenomenon is the same as that giving rise to the electrostatic confinement of electrons in a magnetic mirror. The resulting ambipolar potential drop will adjust itself in a self consistent manner so that the mean electron velocity and current at the collector will equal that of the ions. Thus, the electron energy will be on the order of / i smaller than the ion energy, i.e. negligible.
The main di erence between this expander and that of Post’s 2 is that here expansion can be two dimensional conical shaped rather than one dimensional fan
shaped . Thus the area can increase as r2 rather than r so that a much larger collector area can be achieved, and perhaps the expander can be smaller than the fan shaped expander.
For example, modules having surface areas 10 meters by 10 meters could handle 100 MW. Considerable cost reduction might result from these rather small unit sizes compared to Post’s fan shaped expander. Another possibility for the expander is to have the field drop o so suddenly that the particles essentially follow straight lines, as if emerging from a point source. The collector structures would lie on spherical surfaces with the point source somewhat o centre so that the ions would enter
the collector structure at an angle 0 from the normal.
5. Topping Cycle Considerations As the previous analysis indicated, this technique for direct conversion has a rather modest e ciency, perhaps 60 to 70 . One wonders just how high the e ciency must be to make its application on a fusion reactor interesting. With the objective of determining the required collection e ciency we now discuss the overall e ciency of a fusion reactor.
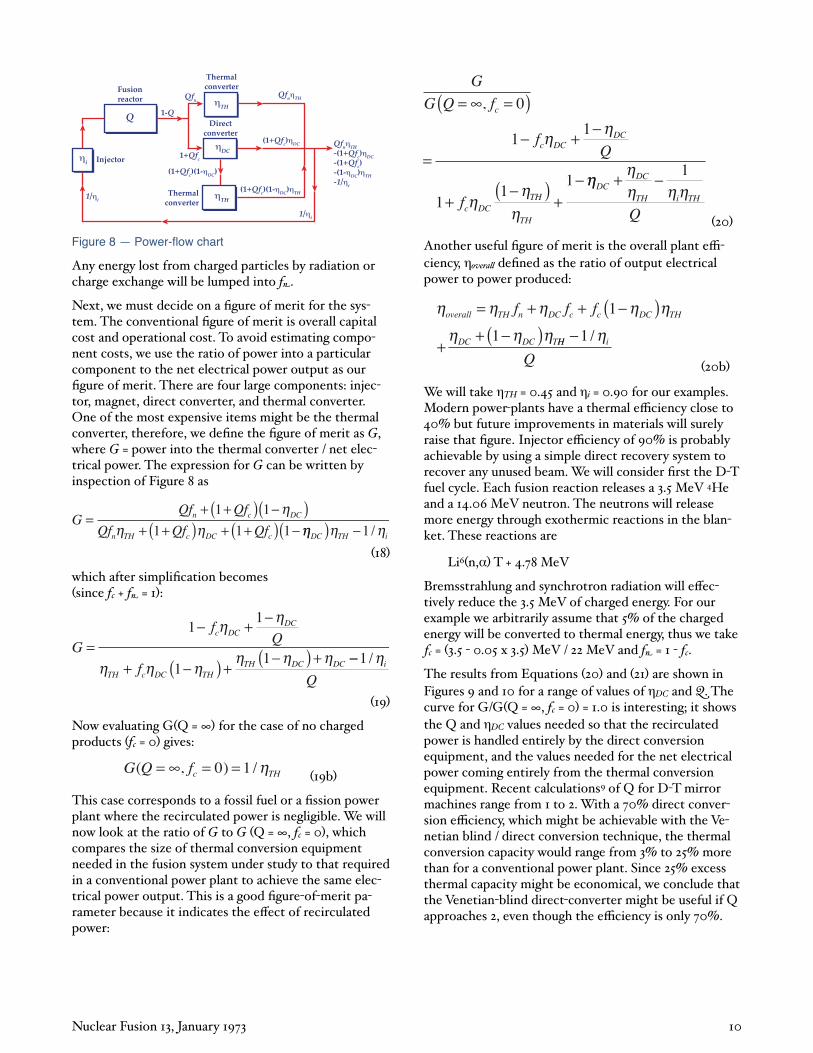
One can look on this or any direct converter as a topping cycle to a thermal system which itself could have a topping cycle. In the power system shown in Figure 8, the fusion reactor is characterized by nuclear power generated/injected power, Q; the fraction of fusion energy released in the form of charged particles, fc; and the fraction of non charged mostly neutrons energy released, f .
Nuclear Fusion 13, January 1973 9
Fusionreactor
Injector
Thermalconverter
Directconverter
Thermalconverter
(1+Qfc)(1- DC)
1/ i
Qfn TH-(1+Qfc) DC-(1+Qfc)-(1- DC) TH-1/ i
(1+Qfc) DC
Qfn THQfn
1+Qfc
(1+Qfc)(1- DC) TH
Q
i
DC
TH
TH
1/ i
1-Q
Figure 8 — Power-flow chart
Any energy lost from charged particles by radiation or charge exchange will be lumped into f .
Next, we must decide on a figure of merit for the system. The conventional figure of merit is overall capital cost and operational cost. To avoid estimating component costs, we use the ratio of power into a particular component to the net electrical power output as our figure of merit. There are four large components: injector, magnet, direct converter, and thermal converter. One of the most expensive items might be the thermal converter, therefore, we define the figure of merit as G, where G = power into the thermal converter / net electrical power. The expression for G can be written by inspection of Figure 8 as
GQf Qf
Qf Qf Qfn c DC
n TH c DC c
�� �� ��
� �� � �� �1 1
1 1 1
�� � �� � �DC TH i� �1 /
18
which after simplification becomes since fc + f = 1 :
Gf
Q
f
c DCDC
TH c DC THTH DC DC
�� � �
� �� � �� �1
1
11
� �
� � �� � � ��1 /�i
Q
19
Now evaluating G Q = for the case of no charged products fc = 0 gives:
G Q fc TH( , ) /� � � �0 1 �19b
This case corresponds to a fossil fuel or a fission power plant where the recirculated power is negligible. We will now look at the ratio of G to G Q = , fc = 0 , which compares the size of thermal conversion equipment needed in the fusion system under study to that required in a conventional power plant to achieve the same electrical power output. This is a good figure of merit parameter because it indicates the e ect of recirculated power:
G
G Q f
fQ
f
c
c DCDC
c DCTH
TH
� � ��
�� � �
��� �
�
, 0
11
11
1
� �
��
�
�� �� ��DCDC
TH i TH
Q
� � 1
20
Another useful figure of merit is the overall plant eciency, overa defined as the ratio of output electrical power to power produced:
� � � � �
� � �overall TH n DC c c DC TH
DC DC T
f f f� � � ��
�� ��
1
1 HH i
Q
�1 /�
20b
We will take TH = 0.45 and i = 0.90 for our examples. Modern power plants have a thermal e ciency close to 40 but future improvements in materials will surely raise that figure. Injector e ciency of 90 is probably achievable by using a simple direct recovery system to recover any unused beam. We will consider first the D T fuel cycle. Each fusion reaction releases a 3.5 MeV 4He and a 14.06 MeV neutron. The neutrons will release more energy through exothermic reactions in the blanket. These reactions are
Li6 n, T + 4.78 MeV
Bremsstrahlung and synchrotron radiation will e ectively reduce the 3.5 MeV of charged energy. For our example we arbitrarily assume that 5 of the charged energy will be converted to thermal energy, thus we take fc = 3.5 0.05 x 3.5 MeV / 22 MeV and f = 1 fc.
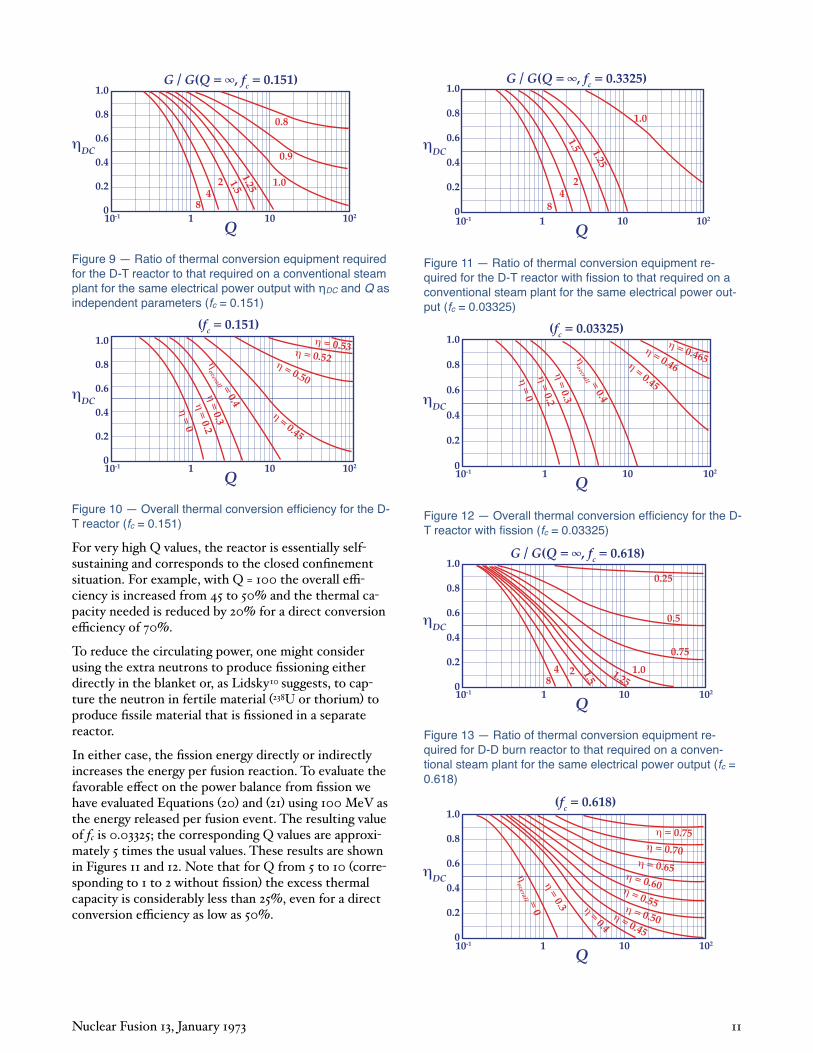
The results from Equations 20 and 21 are shown in Figures 9 and 10 for a range of values of DC and Q. The curve for G/G Q = , fc = 0 = 1.0 is interesting; it shows the Q and DC values needed so that the recirculated power is handled entirely by the direct conversion equipment, and the values needed for the net electrical power coming entirely from the thermal conversion equipment. Recent calculations9 of Q for D T mirror machines range from 1 to 2. With a 70 direct conversion e ciency, which might be achievable with the Venetian blind / direct conversion technique, the thermal conversion capacity would range from 3 to 25 more than for a conventional power plant. Since 25 excess thermal capacity might be economical, we conclude that the Venetian blind direct converter might be useful if Q approaches 2, even though the e ciency is only 70 .
Nuclear Fusion 13, January 1973 10
1.0
0.8
0.6
0.4
0.2
010-1 1021 10
Q
DC
1.0
1.251.524
8
0.8
0.9
G / G(Q = , fc = 0.151)
Figure 9 — Ratio of thermal conversion equipment required for the D-T reactor to that required on a conventional steam plant for the same electrical power output with DC and Q as independent parameters (fc = 0.151)
1.0
0.8
0.6
0.4
0.2
010-1 1021 10
Q
DC
(fc = 0.151)
= 0 = 0.2
= 0.3overall = 0.4
= 0.45
= 0.50
= 0.52 = 0.53
Figure 10 — Overall thermal conversion efficiency for the D-T reactor (fc = 0.151)
For very high Q values, the reactor is essentially selfsustaining and corresponds to the closed confinement situation. For example, with Q = 100 the overall eciency is increased from 45 to 50 and the thermal capacity needed is reduced by 20 for a direct conversion e ciency of 70 .
To reduce the circulating power, one might consider using the extra neutrons to produce fissioning either directly in the blanket or, as Lidsky10 suggests, to capture the neutron in fertile material 238U or thorium to produce fissile material that is fissioned in a separate reactor.
In either case, the fission energy directly or indirectly increases the energy per fusion reaction. To evaluate the favorable e ect on the power balance from fission we have evaluated Equations 20 and 21 using 100 MeV as the energy released per fusion event. The resulting value of fc is 0.03325; the corresponding Q values are approximately 5 times the usual values. These results are shown in Figures 11 and 12. Note that for Q from 5 to 10 corresponding to 1 to 2 without fission the excess thermal capacity is considerably less than 25 , even for a direct conversion e ciency as low as 50 .
1.0
0.8
0.6
0.4
0.2
010-1 1021 10
Q
DC
1.0
1.25
1.5
24
8
G / G(Q = , fc = 0.3325)
Figure 11 — Ratio of thermal conversion equipment re-quired for the D-T reactor with fission to that required on a conventional steam plant for the same electrical power out-put (fc = 0.03325)
1.0
0.8
0.6
0.4
0.2
010-1 1021 10
Q
DC
(fc = 0.03325)
= 0 = 0.2
= 0.3overall = 0.4
= 0.45
= 0.46
= 0.465
Figure 12 — Overall thermal conversion efficiency for the D-T reactor with fission (fc = 0.03325)
1.0
0.8
0.6
0.4
0.2
010-1 1021 10
Q
DC
1.01.25
1.5248
0.25
0.5
G / G(Q = , fc = 0.618)
0.75
Figure 13 — Ratio of thermal conversion equipment re-quired for D-D burn reactor to that required on a conven-tional steam plant for the same electrical power output (fc = 0.618)
1.0
0.8
0.6
0.4
0.2
010-1 1021 10
Q
DC
(fc = 0.618)
overall = 0
= 0.65
= 0.3
= 0.4
= 0.45
= 0.50
= 0.55
= 0.60
= 0.75 = 0.70
Nuclear Fusion 13, January 1973 11
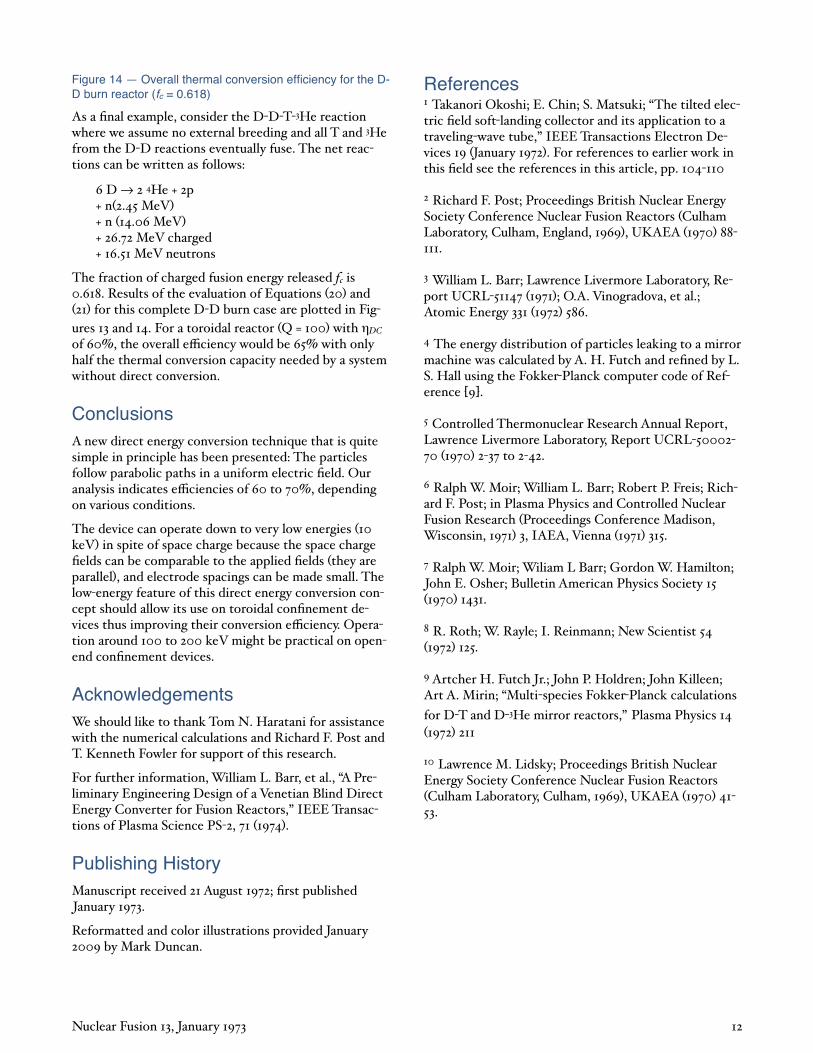
Figure 14 — Overall thermal conversion efficiency for the D-D burn reactor (fc = 0.618)
As a final example, consider the D D T 3He reaction where we assume no external breeding and all T and 3He from the D D reactions eventually fuse. The net reactions can be written as follows:
6 D 2 4He + 2p + n 2.45 MeV + n 14.06 MeV + 26.72 MeV charged + 16.51 MeV neutrons
The fraction of charged fusion energy released fc is 0.618. Results of the evaluation of Equations 20 and 21 for this complete D D burn case are plotted in Fig
ures 13 and 14. For a toroidal reactor Q = 100 with DC of 60 , the overall e ciency would be 65 with only half the thermal conversion capacity needed by a system without direct conversion.
ConclusionsA new direct energy conversion technique that is quite simple in principle has been presented: The particles follow parabolic paths in a uniform electric field. Our analysis indicates e ciencies of 60 to 70 , depending on various conditions.
The device can operate down to very low energies 10 keV in spite of space charge because the space charge fields can be comparable to the applied fields they are parallel , and electrode spacings can be made small. The low energy feature of this direct energy conversion concept should allow its use on toroidal confinement devices thus improving their conversion e ciency. Operation around 100 to 200 keV might be practical on openend confinement devices.
AcknowledgementsWe should like to thank Tom N. Haratani for assistance with the numerical calculations and Richard F. Post and T. Kenneth Fowler for support of this research.
For further information, William L. Barr, et al., “A Preliminary Engineering Design of a Venetian Blind Direct Energy Converter for Fusion Reactors,” IEEE Transactions of Plasma Science PS 2, 71 1974 .
Publishing HistoryManuscript received 21 August 1972; first published January 1973.
Reformatted and color illustrations provided January 2009 by Mark Duncan.
References
Nuclear Fusion 13, January 1973 12
1 Takanori Okoshi; E. Chin; S. Matsuki; “The tilted electric field soft landing collector and its application to a traveling wave tube,” IEEE Transactions Electron Devices 19 January 1972 . For references to earlier work in this field see the references in this article, pp. 104 110
2 Richard F. Post; Proceedings British Nuclear Energy Society Conference Nuclear Fusion Reactors Culham Laboratory, Culham, England, 1969 , UKAEA 1970 88111.
3 William L. Barr; Lawrence Livermore Laboratory, Report UCRL 51147 1971 ; O.A. Vinogradova, et al.; Atomic Energy 331 1972 586.
4 The energy distribution of particles leaking to a mirror machine was calculated by A. H. Futch and refined by L. S. Hall using the Fokker Planck computer code of Reference 9 .
5 Controlled Thermonuclear Research Annual Report, Lawrence Livermore Laboratory, Report UCRL 5000270 1970 2 37 to 2 42.
6 Ralph W. Moir; William L. Barr; Robert P. Freis; Richard F. Post; in Plasma Physics and Controlled Nuclear Fusion Research Proceedings Conference Madison, Wisconsin, 1971 3, IAEA, Vienna 1971 315.
7 Ralph W. Moir; Wiliam L Barr; Gordon W. Hamilton; John E. Osher; Bulletin American Physics Society 15 1970 1431.
8 R. Roth; W. Rayle; I. Reinmann; New Scientist 54 1972 125.
9 Artcher H. Futch Jr.; John P. Holdren; John Killeen; Art A. Mirin; “Multi species Fokker Planck calculations
for D T and D 3He mirror reactors,” Plasma Physics 14 1972 211
10 Lawrence M. Lidsky; Proceedings British Nuclear Energy Society Conference Nuclear Fusion Reactors Culham Laboratory, Culham, 1969 , UKAEA 1970 41
53.