Embed Size (px)
Citation preview

Contents
GSI Water Solutions, Inc. III
Section Page Summary of Findings .............................................................................................................. S-1 Introduction ............................................................................................................................... 1-1 Hydrogeologic Setting ............................................................................................................. 2-1
Project Setting ............................................................................................................... 2-1 Geology .......................................................................................................................... 2-1 Hydrogeology ............................................................................................................... 2-2
Water Supply Well Hydraulic Evaluation ........................................................................... 3-1 Water Quality Evaluation ....................................................................................................... 4-1
Water Quality Monitoring ........................................................................................... 4-1 Bacterial Assesment ..................................................................................................... 4-1 Summary ........................................................................................................................ 4-2
Pump Performance and Motor Evaluation .......................................................................... 5-1 Methodology ................................................................................................................. 5-1
Test Results at Wells 4, 9 and 12 .................................................................... 5-1 Testing of Wells 10 and 11 .............................................................................. 5-2
Well Maintenance and Data Collection ............................................................................... 6-1 System Maintenance .................................................................................................... 6-1 Maintenance Monitoring ............................................................................................. 6-2
Specific Capacity .............................................................................................. 6-2 Pump and Motor Performance ...................................................................... 6-3 Water Quality Monitoring.............................................................................. 6-3 Maintenance Monitoring Schedule ............................................................... 6-3
Preventative Treatment and Well Rehabilitation ..................................................... 6-4 Well Interference and Well Field Expansion ...................................................................... 7-1
Interference Estimates from Numerical Modeling ..................................... 7-1 Future Groundwater Expansion ................................................................... 7-2
Summary of Recommendations ............................................................................................. 8-1 References .................................................................................................................................. 9-1
Appendixes
A City of Veneta Historical Pump Records 2008 B Specific Capacity Test Results C Pump Performance and Motor Evaluation D GSI Groundwater Model Technical Memorandum
Tables
1 City of Veneta Well Summary Table ........................................................................................ 2 Observed Water Quality Parameters ....................................................................................... 3 BART Bacteriological Testing Summary Table ....................................................................... 4 Preventative Maintenance Program ......................................................................................... 5 Generalized Well Redevelopment and Well Rehabilitation .................................................

CONTENTS, CONTINUED
Section Page
GSI Water Solutions, Inc. IV
6 Interference Analysis ..................................................................................................................
Figures
1 Groundwater Supply Development Area ............................................................................... 2 Cross Section A-A’ ...................................................................................................................... 3 Cross Section B-B’........................................................................................................................ 4 Conceptual Model Refinement Well Locations ...................................................................... 5 Thickness of Sand and Gravel Aquifer .................................................................................... 6 Generalized Figure of Redox Front and Bacteriological Populations ................................ 7 Proposed Well Locations ...........................................................................................................

GSI Water Solutions, Inc. S-1
Summary of Findings
The City of Veneta (City) requested that GSI Water Solutions (GSI) evaluate conditions affecting the capacity of the City’s existing groundwater supply system, perform well testing, evaluate water quality and bacteriological populations at the wells, develop a three-dimensional numerical groundwater flow model using Groundwater Vistas™, and identify options for developing additional groundwater source capacity to meet projected future City water demands.
GSI followed the outline in the Scope of Work submitted to the City in August, 2009 which identified three overall tasks
Task 1a – Audit of existing data Task 1b – Operational Data Collection and Performance Monitoring Task 2a – Well Interference Evaluation A brief description of the major activities and goals of each Task and where they are described in the text is provided below Task 1a: Audit of existing data
The purpose of this task was to evaluate existing well data that the City had collected to increase the understanding of how the City operated the wells, their past and current performance, and identify additional data collection needs.
GSI visited the City Wells on October 13, 2009 and made recommendations regarding the well configurations, newly installed SCADA data instrumentation, and baseline testing. The City provided available historical data pumping information, water quality data and pump information during that visit. Historical data is presented in Appendixes A and C.
On the basis of this review several recommendations are made for the City to collect additional well, pump and motor and system information and are at the summarized at the end of this report.
Task 1b: Operational Data Collection and Performance Monitoring
The objectives of this task included.
1. Developing recommendations for instrumentation and data collection parameters for the City’s wells, which are described in Section 6)
2. Assisting the City with identifying appropriate data management tools and techniques, which are also described in Section 6
3. Evaluating baseline well, aquifer and pumping system performance against which to compare future monitoring data. Described in Sections 3, 4 and 5 and supporting data this task is included in Appendix A, B, C

Summary of Findings
GSI Water Solutions, Inc. S-2
Additionally, field water quality parameters were monitored during testing using a multi-parameter meter for the field parameters specific conductance, turbidity, pH, oxidation-reduction potential, and temperature (Section 6) .
Task 2a: Well Interference and Well Site Evaluation
The purpose of this task was to evaluate the potential effects of new well development on the aquifer and existing wells in the vicinity, and assess potential aquifer pumping capacity constraints. The major activities associated with accomplishing this task were:
1. Conceptual model refinement – presented in Section 2 and Appendix D
2. Groundwater flow model development – Appendix D
3. Interference and aquifer pumping capacity analysis – Section 7 and Appendix D
The work completed in 2010 resulted in several recommendations and an improved understanding of the groundwater system and potential for expansion of the City groundwater supply.

GSI Water Solutions, Inc. 1-1
SECTION 1
Introduction
The City of Veneta (City) completed a Water Master Plan update in May 2009 (MSA, 2009) that evaluated the City’s projected water demand and current groundwater supply. The City’s current maximum daily demand (MDD) was determined to exceed the City’s groundwater well capacity by approximately 0.5 million gallons per day (mgd). Available historical pumping records in 2008 indicate that the City is very close to the maximum capacity of its groundwater wellfield during peak demand months.
The City is evaluating the potential for expansion of its groundwater supply to meet projected demand through groundwater expansion within the Urban Growth Boundary (UGB). Previous groundwater supply expansion efforts by the City were not successful in providing sufficient additional capacity to meet the projected MDD during peak usage in the summer. As part of the 2009 Water Master Plan update, GSI Water Solutions, Inc. (GSI) evaluated the available groundwater data and made several recommendations to the City for conducting baseline testing of individual wells, enhancing well field data collection capabilities for the purposes of increasing the reliability of the current well field and to develop a strategy for capacity expansion.
Based on those recommendations, the City requested that GSI evaluate conditions affecting the capacity of the City’s existing groundwater supply system, perform well testing, evaluate water quality and bacteriological populations at the wells, develop a three-dimensional numerical groundwater flow model using Groundwater Vistas™ to evaluate aquifer pumping capacity limitations, and identify options for developing additional groundwater source capacity to meet projected future City water demands.
The results of the 2010 City of Veneta well field evaluation are presented in this report as follows:
• Summary of the hydrogeologic setting of the Veneta area • Groundwater well hydraulic evaluation • Water quality evaluation • Pump evaluation • Well interference and future expansion evaluation • Well maintenance recommendations
Appendix A : 2008 Historical Pumping Data Appendix B : Specific Capacity Test Results Appendix C: Pump Performance and Motor Evaluation Appendix D: GSI Groundwater Model Technical Memorandum
GSI Water Solutions, Inc. 2-1
SECTION 2
Hydrogeologic Setting
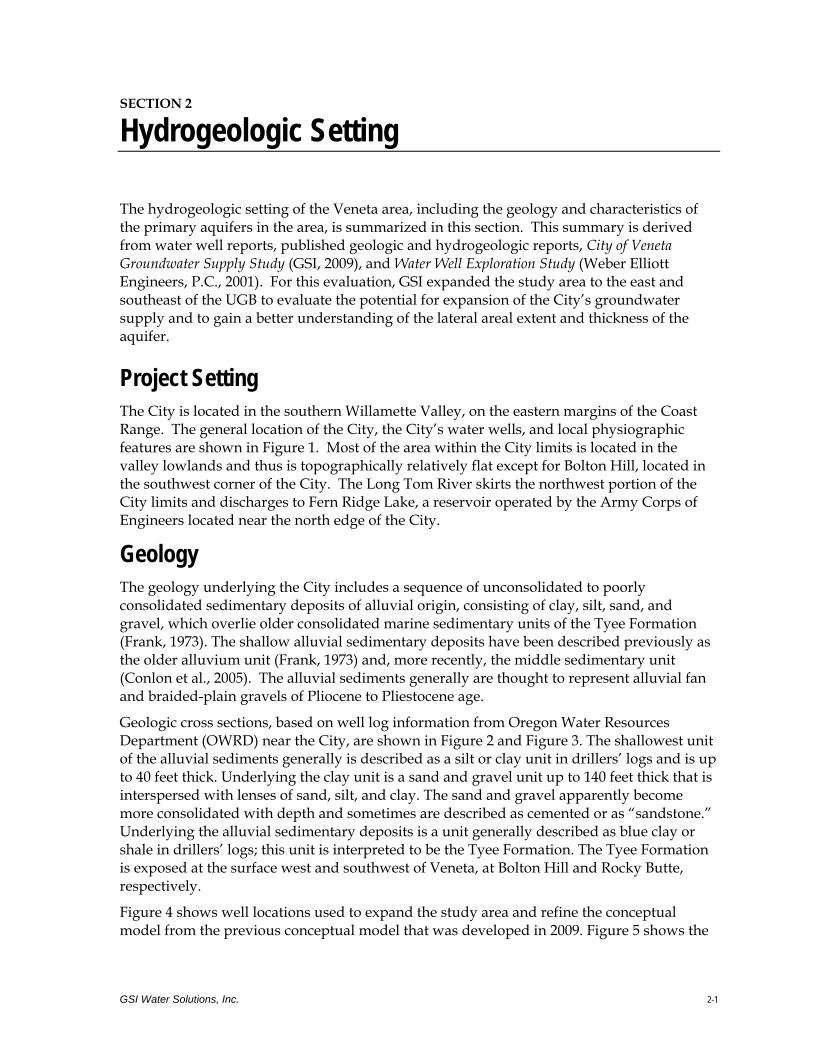
The hydrogeologic setting of the Veneta area, including the geology and characteristics of the primary aquifers in the area, is summarized in this section. This summary is derived from water well reports, published geologic and hydrogeologic reports, City of Veneta Groundwater Supply Study (GSI, 2009), and Water Well Exploration Study (Weber Elliott Engineers, P.C., 2001). For this evaluation, GSI expanded the study area to the east and southeast of the UGB to evaluate the potential for expansion of the City’s groundwater supply and to gain a better understanding of the lateral areal extent and thickness of the aquifer.
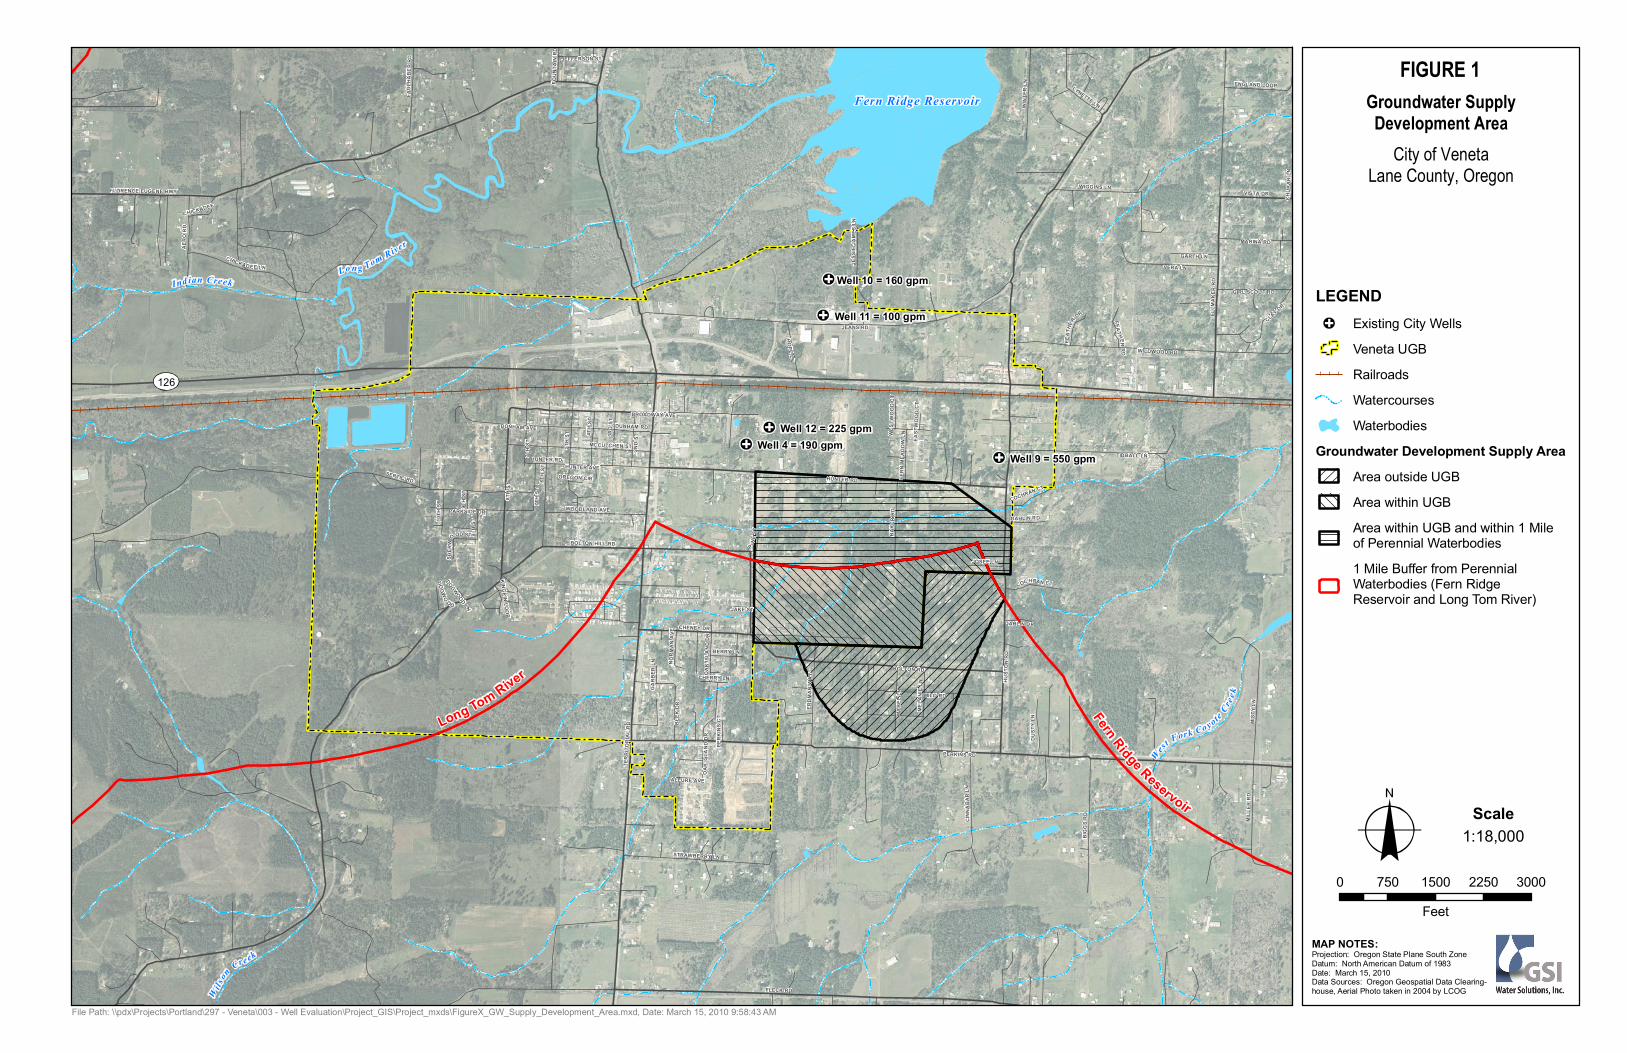
Project Setting The City is located in the southern Willamette Valley, on the eastern margins of the Coast Range. The general location of the City, the City’s water wells, and local physiographic features are shown in Figure 1. Most of the area within the City limits is located in the valley lowlands and thus is topographically relatively flat except for Bolton Hill, located in the southwest corner of the City. The Long Tom River skirts the northwest portion of the City limits and discharges to Fern Ridge Lake, a reservoir operated by the Army Corps of Engineers located near the north edge of the City.
Geology The geology underlying the City includes a sequence of unconsolidated to poorly consolidated sedimentary deposits of alluvial origin, consisting of clay, silt, sand, and gravel, which overlie older consolidated marine sedimentary units of the Tyee Formation (Frank, 1973). The shallow alluvial sedimentary deposits have been described previously as the older alluvium unit (Frank, 1973) and, more recently, the middle sedimentary unit (Conlon et al., 2005). The alluvial sediments generally are thought to represent alluvial fan and braided-plain gravels of Pliocene to Pliestocene age.
Geologic cross sections, based on well log information from Oregon Water Resources Department (OWRD) near the City, are shown in Figure 2 and Figure 3. The shallowest unit of the alluvial sediments generally is described as a silt or clay unit in drillers’ logs and is up to 40 feet thick. Underlying the clay unit is a sand and gravel unit up to 140 feet thick that is interspersed with lenses of sand, silt, and clay. The sand and gravel apparently become more consolidated with depth and sometimes are described as cemented or as “sandstone.” Underlying the alluvial sedimentary deposits is a unit generally described as blue clay or shale in drillers’ logs; this unit is interpreted to be the Tyee Formation. The Tyee Formation is exposed at the surface west and southwest of Veneta, at Bolton Hill and Rocky Butte, respectively.
Figure 4 shows well locations used to expand the study area and refine the conceptual model from the previous conceptual model that was developed in 2009. Figure 5 shows the

City of Veneta Wellfield Evaluation
GSI Water Solutions, Inc. 2-2
approximate thickness of the coarser-grained sand and gravel water-bearing zone in the areas east and southeast of the UGB, based on drillers’ logs. The thickness of the sand and gravel layer shows a sinuous trend from west to east in the study area, likely representing an old drainage system. Based on contouring of descriptions from drillers’ logs, the sand and gravel unit appears to thickest in the southeastern area of the UGB.
Hydrogeology The hydrogeology of the Eugene-Springfield area (including Veneta) previously was described by Frank (1973). GSI reviewed drilling logs of wells to develop a more localized conceptual model of the shallow subsurface geology in the area near Veneta. While some drillers’ logs have noted the occurrence of groundwater in the uppermost silt/clay unit, and the older marine sediments may yield a moderate amount of generally poorer quality water, the saturated alluvial sand and gravel unit described above is the primary groundwater source near the City. The saturated thickness of the sands and gravels comprising this primary alluvial water-bearing unit (hereafter referred to as the alluvial water-bearing unit) ranges from approximately 60 to 140 feet near the City’s existing wells. On the basis of available well log information, the unit thins to the east and southeast of the City (Figure 5).
Based on a review of the drilling logs, groundwater generally is encountered at depths of 40 to 70 feet below ground surface (bgs) in the alluvial water-bearing unit. Static water levels in the unit vary across the study area from approximately 20 to 70 feet bgs. The general groundwater flow direction is toward the east-northeast, based on previous investigations (Frank, 1973; DHS and DEQ, 2000). The observed groundwater flow direction suggests that recharge of the alluvial sediments from infiltration of precipitation and surface runoff occurs in upland areas to the west and south of Veneta. The alluvial sediments also may receive some recharge from the deeper marine Tyee Formation. During drilling, static water levels are observed to rise above the depth where water is first encountered, indicating that the alluvial water-bearing zone is under semi-confined to confined conditions.

GSI Water Solutions, Inc. 3-1
SECTION 3
Water Supply Well Hydraulic Evaluation
During the initial hydrogeologic characterization in 2009, changes in well specific capacity were evaluated on the basis of available City historical records (Appendix A). Based on that evaluation, GSI recommended that the City perform short-duration step-rate tests to provide a baseline to evaluate future well performance.
The City upgraded individual wells with inline flowmeters, SCADA system controls, and pump and motor systems at its existing wells in late 2009 and early 2010. GSI visited the City Wells on October 13, 2009 and made recommendations regarding the well configurations, newly installed SCADA data instrumentation, and baseline testing. The City provided available historical data pumping information, water quality data and pump information during that visit. The baseline testing was completed after the City’s well pumping and control system upgrades.
Prior to baseline testing, all existing wells were shut down for approximately 24 hours to allow synoptic static water levels to be collected on March 22, 2010. Subsequently wells 10 and 11 were run continuously during the testing period (except for minor shutdowns to allow water treatment system backflushing) from March 22 through March 24, 2010 for water quality sampling and to meet City daily water demand.
Short-duration, step-rate pumping tests were performed on the five existing wells (Wells 4, 9, 10, 11, and 12) to estimate specific capacity and aquifer properties. Specific capacity, a measure of well performance, was evaluated at the City wells between March 22 and 26, 2010. The specific capacity of a well is calculated by dividing the discharge rate by the drawdown as follows:
Specific Capacity (SC) = Q/s (in gallons per minute/foot [gpm/ft] of drawdown) Where: Q = the yield (or discharge rate) in gpm s = observed drawdown at that flow rate (static water level – pumping water level) in feet
The higher the specific capacity, the more effective the well is at producing groundwater and the more transmissive the aquifer. Specific capacity typically decreases with increases in the pumping rate. This occurs because of increases in frictional losses in the well. Specific capacity also decreases with duration of pumping because of increased drawdown in the aquifer with time. Individual step-rate field data sheets and plots are included in Appendix A. The results of the specific capacity evaluation are summarized in Table 1.
The specific capacity tests were performed at three different pumping rates to provide a representative estimate of well performance. However, this was not achieved at Wells 10 and 11 because of complications with the distribution system at Well 11 and pump system limitations at Well 10 (this is described in more detail in the section Pump Performance and Motor Evaluation). It also should be noted that the well evaluations were run during what is

City of Veneta Wellfield Evaluation
GSI Water Solutions, Inc. 3-2
typically the period of greatest groundwater recharge, and available drawdown will be less during the drier summer months. Several important observations were made during the step-rate testing and well performance evaluation:
• Under non-pumping conditions, the groundwater flow generally flows from Fern Ridge Lake towards the southwest.
• Transmissivity values estimated from the observed specific capacity ranged from 7,200 gpd/ft to 18,000 gpd/ft.
• The estimated value for storativity is approximately 0.0005 ft/ft, based on the observed response at Wells 4 and 12 during pumping. This storativity value is indicative of a confined aquifer, consistent with water level observations.
• Most wells are being pumped at rates that draw the pumping water level below the top of the uppermost screen interval. Water was audibly cascading from upper screen sections to the pumping water level at Wells 10 and 11 during pumping.
• Well pairs (e.g., Wells 4 and 12) were observed to respond to one another during pumping.
• Wells 10 and 11 have limited capacity because of available drawdown limitations, were observed to affect one another, and have distribution system mechanical issues that need to be addressed.
• Initial recovery of the wells is relatively rapid, but the remaining 5 percent of recovery takes several hours or more.
The limited available drawdown and well construction of the City’s groundwater supply wells likely will require frequent maintenance, redevelopment or rehabilitation of the wells to maintain well performance. Some of the inherent limitations in groundwater well operation could be mitigated by alterations in the well construction. As an example, Well 4 and Well 12 are located relatively close to one another; however, Well 4 has more available drawdown in comparison to Well 12 based on the deeper production casing, allowing it to be pumped at a higher rate. Sleeving the upper portions of the screen sections in some wells may allow higher pumping rates and/or less potential for exposing the screens.
In addition to well construction, the water quality and bacterial populations also may affect well performance. Results of the water quality evaluation are presented in the following section.
GSI Water Solutions, Inc. 4-1
SECTION 4
Water Quality Evaluation
GSI completed a screening level water quality evaluation to assess well bio-fouling potential. Field parameters, total iron and a bacteria sample were collected at each well as part of this evaluation. The results are presented below.
Water Quality Monitoring During the specific capacity test at each well, GSI measured the water quality parameters temperature, pH, specific conductance, dissolved oxygen, and oxidation reduction potential (ORP) were monitored using a YSI 556 multi-parameter water quality meter. A Hach™ colorimetric FerroVer field test kit was used to evaluate concentration of total iron at each well during pumping. Water quality parameters observed at each well during pumping are summarized in Table 2. Manganese was not evaluated as part of the water quality evaluation. The observed parameters indicate that groundwater is generally under slightly anaerobic conditions based on the relatively low ORP values and dissolved oxygen concentrations. Relatively high dissolved oxygen concentrations were measured in water from Well 4; however, the dissolved oxygen values may not be representative of actual conditions because of a damaged sensor membrane discovered after the well testing was completed. Dissolved oxygen concentrations were observed to increase in wells with cascading water after the initiation of cascading conditions during pumping.
The City wells yield water with iron concentrations ranging from 0.1 to 3.7 milligrams per liter (mg/L), which exceed the secondary drinking water standard of 0.3 mg/L. Values observed during the step-rate testing were generally lower than 1.0 mg/L based on colorimetric testing. The observed pH values in the field were slightly acidic ranging from 6.36 to 6.9. In this range of pH values, iron hydroxide precipitate will form after the iron in groundwater is oxidized, commonly coating well screens, casings and pumps. Microbial activity also plays an important role in governing oxidation reduction reactions of iron in groundwater.
Bacterial Assesment Biological populations were suspected to be present in the City’s wells based on anecdotal evidence provided by City staff, review of the well construction, the operational history of the wells, and the presence of elevated iron concentrations in the groundwater. This suspicion was confirmed during the winter of 2010 when the City removed the pump and motor at Well 4 and found the pump column, discharge piping, and flowmeter were coated with an approximately one-half inch of orange-brown scale and slime. The City elected to change out the wellhead systems and installed a new pump and motor at Well 4. Before the pump and motor replacement, Christenson Well Drilling performed a downhole video

City of Veneta Wellfield Evaluation
GSI Water Solutions, Inc. 4-2
survey at Well 4. The results of that video indicated that the biofouling of the City wells is a genuine concern and the likely mechanism for loss of well performance at Well 4. A water quality sample was collected at each well to evaluate biological populations under pumping conditions during hydraulic testing to evaluate the presence and aggressiveness of the bacterial populations in the aquifer.
GSI collected the water samples to evaluate bacterial populations with BART™ test kits manufactured by Dryocon Bioconcepts, Inc. The test kits were designed to evaluate iron related bacteria (IRB), slime forming bacteria (SLYM), and sulfur reducing bacteria (SRB). The BART™ samples provide a qualitative evaluation of the bacterial population based on the observed response and the length of the incubation period until the specific response is observed. Generally, a “casing sample” (i.e., water in the well collected at the beginning of pumping after the well has been idle for 24 hours) is also collected to evaluate the bacterial population. These samples generally have greater concentrations of biological organisms than the aquifer samples because the organisms reside close the redox front in the well (Figure 5). Because the presence of bacteria was indicated by slime and iron oxide staining observed at the discharge piping at most wells, GSI did not collect a casing water quality sample. A water quality sample was collected after the well was pumped for a minimum of 2 hours to evaluate the aggressiveness of the biological communities in the aquifer near the well.
In general, all of the wells tested for IRB were observed to respond within 3 to 4 days, indicating an aggressive population (Table 3). Well 11 was observed to have a consortium of bacteria based on the results from the IRB, SRB, and SLYM testing. The IRB and SLYM tests responses indicated that the bacteria at all of the wells were generally aerobic, based on guidance from the manufacturer. The cascading of groundwater noted during hydraulic testing at several wells provides the oxygen for the opportunistic iron-related bacteria and aerobic slime bacteria. Sulfate bacteria observed at Well 11 are generally anaerobic and are found at greater distances from the well (Figure 6). However, recent research has indicated that sulfate bacteria develop a symbiotic relationship with iron-related bacteria under certain conditions.
Summary Because of the presence of iron in the groundwater over a widespread area within the City, treatment likely will be required for any new groundwater source that is developed. Although the understanding of the distribution of iron in groundwater is limited to the concentrations observed during testing of the City’s wells, available information suggests that iron concentrations may be somewhat lower in the western and southern sections of the City. This type of distribution suggests that iron concentrations are lower in upgradient portions of the flow path, nearer to recharge areas.
On the basis of the observed BART testing, water quality results and well construction in the City wells, bio-fouling of the wells is likely to occur based on continuing operation of the wells. GSI recommends the City consider additional testing of the high priority wells (Wells 4, 9, and 12) for bacteriological assessment using Water Systems Engineering (WSE), Ottowa, Kansas. WSE performs a series of quantitative analyses to identify the

City of Veneta Wellfield Evaluation
GSI Water Solutions, Inc. 4-3
aggressiveness of the bacterial population and individual species present, which is useful in developing initial maintenance and treatment strategies for individual wells.
GSI Water Solutions, Inc. 5-1
SECTION 5
Pump Performance and Motor Evaluation
A pump and motor evaluation was performed concurrently with the hydraulic testing to collect the current pump and motor performance for comparison to the original factory design curve (Appendix C). Pump and motor evaluations were successfully performed at Wells 4, 9, and 12. Complications were encountered at Well 10 and 11 that precluded meaningful pump and motor evaluations.
Methodology To evaluate the pump performance, the total dynamic head (depth to water plus the system backpressure) and flow rate were measured at three different pumping conditions. The City’s pumps are all equipped with variable frequency drive (VFD) motors to allow varying the target pumping rates to meet the system demand. Most factory-provided pump design curves are based on a standard frequency of 60 hertz (Hz). During the pump evaluations, City staff set the VFD to maintain a frequency of 60 hertz during the testing. The voltage and current at each of the three different flow rates were measured to evaluate the motor efficiency. The power factor (the ratio of the actual power used versus the apparent power used [measured voltage x amps]) was not evaluated during testing. Because of the various phase losses in a three-phase induction motor, the actual power factor value always is less than the theoretical value of 1. A range of power factor values between of 0.85 and 0.95 (generally considered “good”) was assumed for the purposes of the motor efficiency calculations.
Test Results at Wells 4, 9 and 12 Those wells appear to reasonably match the available pump curves. The pressure transducer readings at these wells were in general agreement with the manual water level readings. Efficiencies were estimated to be slightly greater than 100 percent. This likely indicates some slight inaccuracy in the discharge measurements or the pressure gage reading observed during testing. Because the City wells are currently not capable of pumping to waste, an independent check of the inline flow meters could not be made; however, these wells appear to be operating within their specifications based on the comparison to the design pump curves. Well 4 and Well 12 are relatively new pumps and motors, so these results were not unexpected. The City should continue to monitor the performance of the pumping systems at these wells since they contribute approximately 85 percent of the well field capacity.

City of Veneta Wellfield Evaluation
GSI Water Solutions, Inc. 5-2
Testing of Wells 10 and 11 Well 10 produced significant backpressures when the pump was run at 60 Hz. The pump and motor installed at Well 10 were oversized for the actual production capacity of the well. As a result of the very high pressures, the chlorine dosimeter system feed valve failed during testing, and began leaking the chlorine solution near the electrical panel. The flow rate was increased in an attempt to alleviate some of the back pressure on the system, but was unsuccessful so testing was interrupted to address this problem. The high pressure exceeded the gage range at Well 10 and therefore the pump and motor evaluation could not be completed. The hydraulic testing of Well 10 was continued until cascading water was audible at the well head. The testing at Well 10 was terminated at this point because the cascading water indicated that the discharge rate had exceeded the well pumping capacity, and thus the hydraulic testing was not likely representative of aquifer properties and a total dynamic head could not be determined. During recovery, water levels at Well 10 and a nearby monitoring well were observed to increase to values greater than pre-test static water levels. City staff determined that the check valve installed in the vault at Well 10 was not functioning properly, and was allowing flow back into Well 10.
Testing at Well 11 also had limited success because of various complications encountered during testing. Testing at Well 11 was complicated by the following factors:
• Observed pressures exceeding the range of the gage installed at Well 11 • Malfunction of a check valve at Well 10 • Improperly installed flowmeter at Well 11
The pressure gage limited testing of the well at the lower range of discharge of the pump design curve. During the next step the flow rate was increased, but not observed to increase on the digital flow meter. The flow was increased again and the drawdown was observed to increase, but not the flow. At this time, City staff observed that Well 10 was reading a negative flow rate during the testing indicating that the check valve was allowing some of the discharge from Well 11 to be diverted. The hydraulic test was continued until the drawdown was observed to exceed the well pumping capacity similar to Well 10. Due to the complications in measuring flow rate at the well, a pump and motor evaluation was not performed.

GSI Water Solutions, Inc. 6-1
SECTION 6
Well Maintenance and Data Collection
Having sufficient information regarding baseline conditions for the pump, motor, well performance, and aquifer are important when diagnosing decreases in well yield. The collection and monitoring of important system information helps to identify trends that may provide an indication of well performance or regional and local aquifer condition changes. Implementation of a preventative maintenance program will allow the City to determine when (or if) well rehabilitation is necessary.
Wells are best maintained by a preventive, rather than reactive, maintenance program. Reactive maintenance (i.e., failure of the pump or well) results in “patches” to get a well back online to maintain system production, which results in future complications and additional work and maintenance costs. A properly implemented preventative maintenance program combines regular monitoring of physical well condition and well performance, system maintenance, and preventative well treatments.
The integral parts of a preventive maintenance program can be summarized as follows:
• System maintenance – Replacement of pump, motor ,distribution system components, and SCADA components to maintain efficient pumping of the well
• Maintenance monitoring – Physical, hydraulic, and water quality monitoring to detect decreases in well capacity and determine whether the decreased capacity is due to deterioration of the well, or conditions in the aquifer (e.g., declining aquifer levels).
• Preventative treatments and rehabilitation – Mechanical redevelopment or chemical treatments applied when decreases in well performance are noted
Well rehabilitation is performed after the preventative maintenance program indicates that deterioration of the well performance is significant and before it is advanced (greater than 25 percent decline in original performance). Implementation of the preventative maintenance program will allow the City to identify changes in well or pump performance before failure and determine when (or if) well rehabilitation is necessary before failure. Despite all preventative maintenance efforts, well rehabilitation may be inevitable in some hydrogeologic settings or under certain groundwater conditions.
System Maintenance The City has made several recent significant system upgrades to better manage its wellfied, improve the understanding of the distribution system capacity, and improve efficiency in operation of the groundwater supply wells. The City now has a SCADA control system for all of the City wells, including an observation well near Well 10. The SCADA system can remotely operate wells, and monitor and record pumping levels and flow rates at individual
City of Veneta Wellfield Evaluation
GSI Water Solutions, Inc. 6-2
wells. As part of the 2010 well evaluation, the City also installed pressure gage and water quality ports at existing wells.
The installation records of the individual pump systems are maintained by the City’s public works department and are stored in individual binders. The City should continue to maintain and update these records as needed.
Maintenance Monitoring Any well maintenance program includes asset management and protection activities. Probably the most important of the maintenance activities includes:
• Record keeping and updating of well construction, pump and motor installation records, and inspection of the wellhead on a routine basis.
• Well performance tracking
• Water quality monitoring
• Rehabilitation and chemical treatment of the wells
The City maintains records of water well usage, iron concentrations, and pumping levels on regular basis (Appendix D). Pump, motor, and well maintenance records are maintained by the City. In addition to the parameters the City currently tracks, GSI recommends the City monitor the following additional parameters:
1. Specific capacity
2. Pump and motor performance (current, amperage, pressure, etc.)
3. Water quality parameters of pH, Eh, conductivity, temperature, and dissolved oxygen
4. General chemistry and bacterial assessment
Collection of the current and proposed maintenance monitoring program data in tandem will allow diagnosis of any observed decrease in well production. A brief description of each of the recommended maintenance monitoring parameters is provided below.
Specific Capacity To evaluate specific capacity, the static water level, the pumping level at a given rate of discharge and time of pumping, and the discharge rate are needed. The static and pumping levels can be used to calculate the drawdown in the well. Under ideal conditions, the specific capacity would be evaluated under “true” static conditions at each well without the potential for well interference. However, during the summer, when the City experiences high water demand, this may not be possible to perform, especially at Wells 4 and 12, and Wells 10 and 11.
The City currently collects the water level and flow information using the SCADA system, and therefore easily can incorporate this information into the existing monitoring. A manual water level measurement of each well also is recommended on a periodic (monthly

City of Veneta Wellfield Evaluation
GSI Water Solutions, Inc. 6-3
to quarterly) basis to evaluate electronic pressure transducer operation and accuracy. Some locations have limited access to the water level port (i.e., Well No. 9), making electronic monitoring the more practical monitoring approach.
Pump and Motor Performance Changes in the pump motor amperage, circuit voltage, and power consumption (kilowatt hours) can be used to detect problems with the pump or motor. Pump performance can be influenced by internal changes (i.e., wear or damage), external changes (i.e., changes in the aquifer or well interference), or changes in the system (i.e., system pressure or valving). Changes in motor performance may indicate wear, power supply issues, or wiring issues. Because of the potential for external aquifer influences, monitoring of the pump and motor performance should be evaluated at the same time as the specific capacity of the well.
The recording of voltage, amperage, system pressure at the well head, and discharge should be performed during the start of the pumping and then again during the run cycle. Increases in the amperage draw during system start up can indicate motor wear or mechanical resistance, while increases during the run cycle may indicate clogging. Because of the potential for accumulation of scale and biofilm, visual inspection of the wellhead, distribution piping, and flowmeters should be performed periodically, especially if an apparent change (decrease or increase) in pump performance is suspected.
Water Quality Monitoring Periodic monitoring of the water quality parameters of pH, Eh, temperature, and conductivity should be performed. The City currently monitors total iron concentrations as part of its water treatment and focuses on the numerical value (i.e., total iron = 0.7 mg/L). However, the changes in water quality are the best indicators of loss of well performance resulting from mineral precipitation or biofouling. Iron (total and dissolved), manganese, and sulfate are the best indicators of biofouling and clogging potential, and are dependent on the pH and Eh conditions and bacterial growth present in the well.
A bacterial assessment method should be implemented on a periodic basis as part of the preventive maintenance monitoring. The methods (BART™ or quantitative lab testing) could be varied at each well depending on the priority or usage of the individual well. The same method should be consistently used to allow identification of changes at each well.
Maintenance Monitoring Schedule The parameters presented above could be collected at the same time but on a less frequent basis than the City’s current program that monitors well usage and iron concentrations at each well as part of the maintenance monitoring program. GSI recommends a more frequent maintenance monitoring schedule in the first year of implementation of the program. After the City has identified well performance trends during the initial monitoring program, the frequency of monitoring can be reduced. A summary of the recommended first year and long-term monitoring programs is presented in Table 4.

City of Veneta Wellfield Evaluation
GSI Water Solutions, Inc. 6-4
Preventative Treatment and Well Rehabilitation The maintenance monitoring program is intended to identify if a significant problem with the pumping system or well performance exists. Typically, pump or motor problems are more easily resolved and can be addressed relatively quickly with minimal system downtime once they are identified. Well performance problems require scheduling of a pump and water well contractor, which may be more difficult, especially during the summer months. The program should allow the City to prioritize and anticipate preventative treatment needs before failure of the pump or well during the summer when water demand is high. In the event a well experiences a problem requiring pump removal, the City should consider the cost-benefits of performing visual inspection of the well and, if necessary, additional well maintenance while the pump system is removed. GSI recommends a downhole video survey be performed whenever sufficient access to the well allows. The cost of a downhole video survey is relatively minor compared to the costs for pulling the pump and can be used to determine if additional preventative treatment of the well is needed at the time the pump is removed. Preventative treatment of the well may include mechanical redevelopment of the well and/or chemical treatment of the well. Mechanical redevelopment is relatively easy to perform and requires the use of surging, jetting, or other tools to agitate and remove sediment, mineral precipitation, or biological plugging of the well screens to increase well performance. At a minimum, the method of mechanical redevelopment should force water both into and out of the screen and filter pack under significant pressure and simultaneously remove the material introduced into the well. If significant loss of well performance or biological growth is present in the well, a rehabilitation program including chemical treatment of the well may be recommended. Chemical treatment removes mineral and biological encrustation that cannot be removed using mechanical redevelopment. Chemical treatment designed for wells uses a combination of strong mineral or organic acids, biocides or oxidizers, penetrants, and dispersants to treat and remove biofilms and encrustation on the well screen, filter pack, and alluvial material. The actual chemicals selected to treat the well will be dependent on the severity of plugging, groundwater chemistry, and biological activity. Chemical treatment of water wells should be performed only by experienced, qualified contractors in conjunction with mechanical redevelopment of the well. The applied chemical treatment should be selected to maximize treatment effectiveness and limit impacts to well materials as some acids are reactive with steel and stainless steel. Table 5 presents typical mechanical and chemical well rehabilitation programs. It should be noted that whether just mechanical methods are used or mechanical and chemical methods are used together, the final step includes super-chlorination of the well. Super-chlorination involves the introduction of a sodium hypochlorite solution approved for water disinfection at concentrations of up to 200 mg/L. Despite historical practice in the water well industry of using doses up to 2,000 mg/L to treat wells, concentrations greater than 200 mg/L are not

City of Veneta Wellfield Evaluation
GSI Water Solutions, Inc. 6-5
recommended. The disinfection solutions should be left in the well for up to 24 hours to maximize the contact time of the solution with well and aquifer materials.

GSI Water Solutions, Inc. 7-1
SECTION 7
Well Interference and Well Field Expansion
In the 2009 hydrogeologic evaluation, the potential for well interference was presented as an additional consideration in the siting of new wells. GSI developed a groundwater model to estimate the potential interference for the City’s existing wells and two additional well locations within the UGB, but more than 1 mile from the surface water features (Figure 7).
New wells ideally would be placed at locations suited to utilize existing water treatment facilities and conveyance because of the high cost to construct separate treatment and conveyance for each additional increment of capacity. Based on this consideration, ideal new well sites would be near existing water treatment facilities at Wells 4, 9, and 10. However, a significant drawback to locating new wells close to existing wells or to each other is the increased potential for excessive well interference drawdowns, which may limit or reduce individual well performance and pumping capacities.
Interference Estimates from Numerical Modeling GSI completed an estimation of potential interference from placement of new wells near existing facilities using a numerical groundwater model (Appendix D). The drawdown in a groundwater wells at any given pumping rate consists of two individual components:
• Aquifer losses, or the drawdown as determined from the aquifer properties of transmissivity and storativity
• Well losses, or additional frictional losses at the well/aquifer interface (well efficiency)
The sum of these two frictional losses is collectively referred to as the well efficiency. Well inefficiency results in additional drawdown greater than what would be expected on the basis of aquifer properties, and results in greater drawdown in the pumping well under “real world” pumping conditions. Numerical groundwater models generally have difficulty integrating the component of well efficiency into the modeled estimates for drawdown of pumping wells. To better estimate the actual pumping conditions, the theoretical interference drawdown at each well was modeled by simulating one well idle and running the other existing City wells at the observed 2010 rates. The theoretical interference drawdown at each idled well then was added to the drawdown observed during step-rate testing at the 2010 reported rate for the well. This results in a more conservative (i.e., realistic) pumping level estimate in each of the existing and proposed wells.
Drawdown estimates were developed for separate pumping scenarios:
Scenario 1 - All five existing wells (five total) Scenario 2 - All five existing wells plus one proposed well in the eastern part of the
UGB. (six total) Scenario 3 - All five existing wells, plus one proposed well in the western portion of the
UGB (six total)
City of Veneta Wellfield Evaluation
GSI Water Solutions, Inc. 7-2
Scenario 4 - All existing and proposed wells (seven total)
The results of the four separate pumping scenarios are summarized in Table 4.
After the modeled potential interference is factored with the limited available drawdown of the shallow alluvial aquifer, it becomes apparent that new water supply wells should be located as far as practicable from existing public water supply wells to minimize interference. Based on that analysis, the potential interference in existing wells that are located in close proximity was determined to be a potentially significant factor in limiting production rates at individual wells.
Future Groundwater Expansion Three additional wells were originally proposed in the Water Master Plan update to meet the City’s near-term MDD. However, subsequent interpretation of hydraulic connection between the alluvial aquifer and surface water by OWRD severely limits the area where new wells can be located. Further refinement of the hydrogeologic conceptual model, and the additional hydraulic testing and interference analysis, has reduced the number of potentially viable well locations within the UBG to approximately two. Although, hydrogeologic conditions also appear to be favorable in an area located outside of the UGB, just to the southeast of the proposed eastern well location (Figure 7), city staff have indicated that domestic wells in this area produce poor quality water.
The remaining two proposed locations used in Scenarios 2 through 4 are located at the southeastern limits of the favorable locations within the UGB that were identified in the Water Master Plan update (Figure 7) The proposed well locations also maximize the distance from Wells 4, 9 and 12, which represent approximately 85 percent of the City’s current production capacity. If the City were to expand its groundwater supply outside of the UGB, it may be able to limit potential well interference at its current high-yielding wells. Additionally, the proposed locations potentially could have slightly better water quality with respect to iron when compared to existing Wells 10 and 11 or areas closer to Fern Ridge Lake.
Exploratory Drilling and Production Well Construction Program The actual hydrogeologic conditions at any particular location within the UGB have associated uncertainty. For example, the bedrock surface of the Tyee Formation is highly irregular across the study area, resulting in variability in the thickness and nature of the overlying alluvial sediments (Figure 5). Consequently, we recommend that the City complete exploratory borings at each potential well site under consideration within the areas described above. Each boring could be abandoned upon completion of data collection or completed as an observation well if a production well was to be installed at the site. We recommend advancing exploratory borings using rotosonic drilling equipment because the technique results in good geologic sample quality, and is well-suited for both hydraulic testing of potentially productive intervals and water quality sampling. The technique allows collection of continuous cores, which provides good control on geologic conditions and may allow pre-design of a screen for a production well drilled at the same site. Also, short duration hydraulic testing of potentially productive intervals within the aquifer can be completed to evaluate aquifer productivity. The hydraulic testing would be accomplished
City of Veneta Wellfield Evaluation
GSI Water Solutions, Inc. 7-3
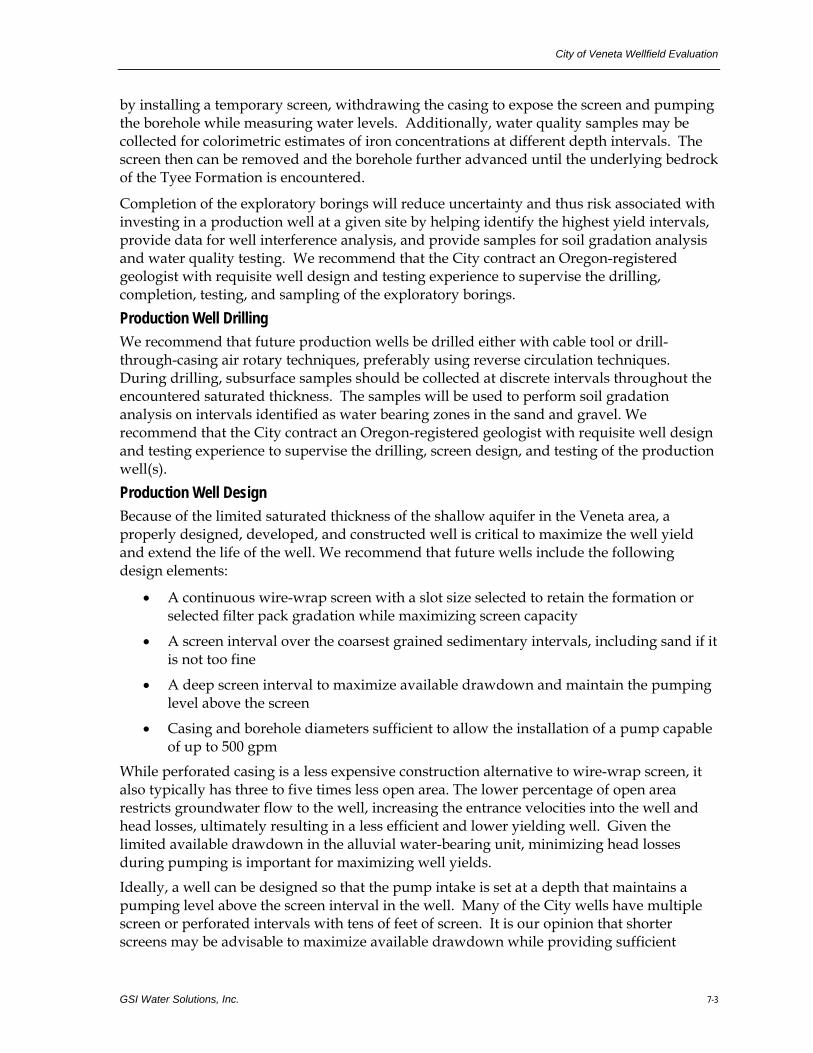
by installing a temporary screen, withdrawing the casing to expose the screen and pumping the borehole while measuring water levels. Additionally, water quality samples may be collected for colorimetric estimates of iron concentrations at different depth intervals. The screen then can be removed and the borehole further advanced until the underlying bedrock of the Tyee Formation is encountered.
Completion of the exploratory borings will reduce uncertainty and thus risk associated with investing in a production well at a given site by helping identify the highest yield intervals, provide data for well interference analysis, and provide samples for soil gradation analysis and water quality testing. We recommend that the City contract an Oregon-registered geologist with requisite well design and testing experience to supervise the drilling, completion, testing, and sampling of the exploratory borings. Production Well Drilling We recommend that future production wells be drilled either with cable tool or drill-through-casing air rotary techniques, preferably using reverse circulation techniques. During drilling, subsurface samples should be collected at discrete intervals throughout the encountered saturated thickness. The samples will be used to perform soil gradation analysis on intervals identified as water bearing zones in the sand and gravel. We recommend that the City contract an Oregon-registered geologist with requisite well design and testing experience to supervise the drilling, screen design, and testing of the production well(s). Production Well Design Because of the limited saturated thickness of the shallow aquifer in the Veneta area, a properly designed, developed, and constructed well is critical to maximize the well yield and extend the life of the well. We recommend that future wells include the following design elements:
• A continuous wire-wrap screen with a slot size selected to retain the formation or selected filter pack gradation while maximizing screen capacity
• A screen interval over the coarsest grained sedimentary intervals, including sand if it is not too fine
• A deep screen interval to maximize available drawdown and maintain the pumping level above the screen
• Casing and borehole diameters sufficient to allow the installation of a pump capable of up to 500 gpm
While perforated casing is a less expensive construction alternative to wire-wrap screen, it also typically has three to five times less open area. The lower percentage of open area restricts groundwater flow to the well, increasing the entrance velocities into the well and head losses, ultimately resulting in a less efficient and lower yielding well. Given the limited available drawdown in the alluvial water-bearing unit, minimizing head losses during pumping is important for maximizing well yields.
Ideally, a well can be designed so that the pump intake is set at a depth that maintains a pumping level above the screen interval in the well. Many of the City wells have multiple screen or perforated intervals with tens of feet of screen. It is our opinion that shorter screens may be advisable to maximize available drawdown while providing sufficient

City of Veneta Wellfield Evaluation
GSI Water Solutions, Inc. 7-4
design flow rates, assuming that adequately productive aquifer materials are present at deeper intervals. For example, based on the observed yields of the City wells, only 5 feet of 0.050 slot wire wrap screen would be required to yield 200 gpm and still maintain entrance velocities below the recommended 0.1 foot/second to 1.5 feet/second (AWWA, 2006). Further, a shorter screen, set at a greater depth, will provide for more available drawdown, thus increasing the sustainable pumping rate of the well, particularly where well interference is an issue. Reducing the length of screen also results in cost savings during construction. Another design consideration would be to install a sump at the bottom of the well and place the pump intake within the sump. This approach has been used to maximize available drawdown in communities with challenges similar to Veneta.

GSI Water Solutions, Inc. 8-1
SECTION 8
Summary of Recommendations
On the basis of the additional data collected during the 2010 evaluation, GSI has developed the following recommendations for operation, maintenance and expansion of the well field:
Operation
• The pump and motor at Well 10 should be resized to better match actual total dynamic head and discharge at the well.
• The City should consider modifying the existing well houses and discharge piping to allow them to pump to waste to minimize the organic detritus introduced in to the distribution, treatment, and reservoir systems which generally is highest at system start up after the well has been idle. This will also allow for independent evaluation of the inline flowmeters.
• Installation of high precision pressure gages • A flowmeter should be reinstalled at Well 11 to provide reliable flow rate
monitoring. • Install distribution system improvements at Well 10 to prevent backflow into Well 10
during pumping at Well 11. • Where and when possible, operate the pumps to maintain the water level above the
screen interval to minimize the introduction of oxygen into the water column • Alternate operation of Well 4 and 12 during low demand periods to minimize well
interference, or if needed, operate them in tandem but maintain the pumping levels above the screen. Maintenance
• Evaluation of Well alteration improving available drawdown. • The City should collect additional pump, motor, well performance, and water
quality data as part of a preventative maintenance program. • Periodic calibration of electronic instrumentation • Submit initial biological assessments to WSE laboratory from the City’s highest
yielding production wells (Wells 4, 9, and 12) to a qualified lab for baseline analysis • Perform periodic biological assessments at all wells using BART testing methods
Expansion
• Numerical groundwater modeling indicates that well interference will likely reduce available drawdown, and thus affect the capacity at the proposed well locations within the UGB and outside of the one-mile buffer of Fern Ridge Lake
City of Veneta Wellfield Evaluation
GSI Water Solutions, Inc. 8-2
• If the City considers expansion of its groundwater system, a focused exploratory drilling program similar to the one described should be pursued in the southeastern area of the UGB near the proposed well locations.Careful consideration of the final well screen design and construction is recommended to maximize available drawdown, well efficiency and the well yield. The screen and filterpack should be designed based on sieve analyses collected during drilling of the production well.

GSI Water Solutions, Inc. 9-1
SECTION 9
References
American Water Works Association. 2006. AWWA Standard for Water Wells, ANSI/AWWA A100-006. Denver, Colorado. August 2006.
Driscoll, F.G. 1986. Groundwater and Wells, Second edition. Johnson Division, St. Paul, Minnestoa. 1089 p.
Frank, F.J., 1973. Groundwater in the Eugene-Springfield Area, South Willamette Valley, Oregon, Geological Survey Water Supply 2018, 65 p.
GSI Water Solutions, Inc. (GSI). 2009. City of Veneta Groundwater Supply Evaluation. POrepared for Murray Smith and Associates, Inc.
Murray Smith and Associates, Inc (MSA). 2009. Water System Master Plan for the City of Veneta
Oregon Department of Human Services Health Division Drinking Water Program (DHS) and Department of Environmental Quality Drinking Water Program (DEQ). 2000. Source Water Assessment Report, City of Veneta PWS ID# 4100920 Veneta, Oregon. 36 p.
Weber Elliot Engineers, PC. 2001. City of Veneta Water Well Exploration Study. Report prepared for Systems West Engineers, Inc.

GSI Water Solutions, Inc.
Figures

GSI Water Solutions, Inc.
Tables

Table 1. City of Veneta Well Summary Table2010 City of Veneta Wellfield Evaluation
Well NumberOWRD Well Designation
Date Constructed
Total Depth (feet bgs)
Coarse-Grained Facies Thickness
(feet)
2010 Reported Average
Pumping Rate
Initial Specific Capacity (gpm/ft)
2010 Specific Capacity (gpm/ft)*
March 2010 Static Water Level (ft bgs)
Open Interval
Available Drawdown (ft)** Comments
Production Wells
4 LANE 13505 1973 166 >57 225 9.7 (24-hr) 6.8 71.24110 - 135, 145 - 156 38.76
Mechanically redeveloped March
2010
9 LANE 2340 1991 180 >119 450 8.3 (1 -hr) 9 36.12
75 - 80, 105 - 110, 150 - 160, 169 -
179 38.88Dewaters nearby wells
in summerCheck valve issue; pump oversized;
10 LANE 65923 2006 92 >24 80 8.5 (1-hr) NA 28.81 40 - 80 11.19
pump oversized; screen 12 feet below
SWL
11 LANE 69818 2008 100 58 80 3.6 (24-hr) 3.6 49.25 63-93 13.75Screen 14 feet below
SWL
12 LANE 68919 2008 160 109 225 9.13 (24-hr) 9.13 73.01 80-152 6.99Screen 7 feet below
SWL
1060
Notes:OWRD = Oregon Water Resources Departmentbgs - below ground surfacegpm = gallons per minuteft = feetft = feetgpm/ft = gallons per minute per foot of drawdown NA = not applicableSWL = static water level* = 2010 specific capacity reported for Spring 2008 daily production data. ** Assumes no well interference in the case of Well pairs 4 and 12; 10 and 11
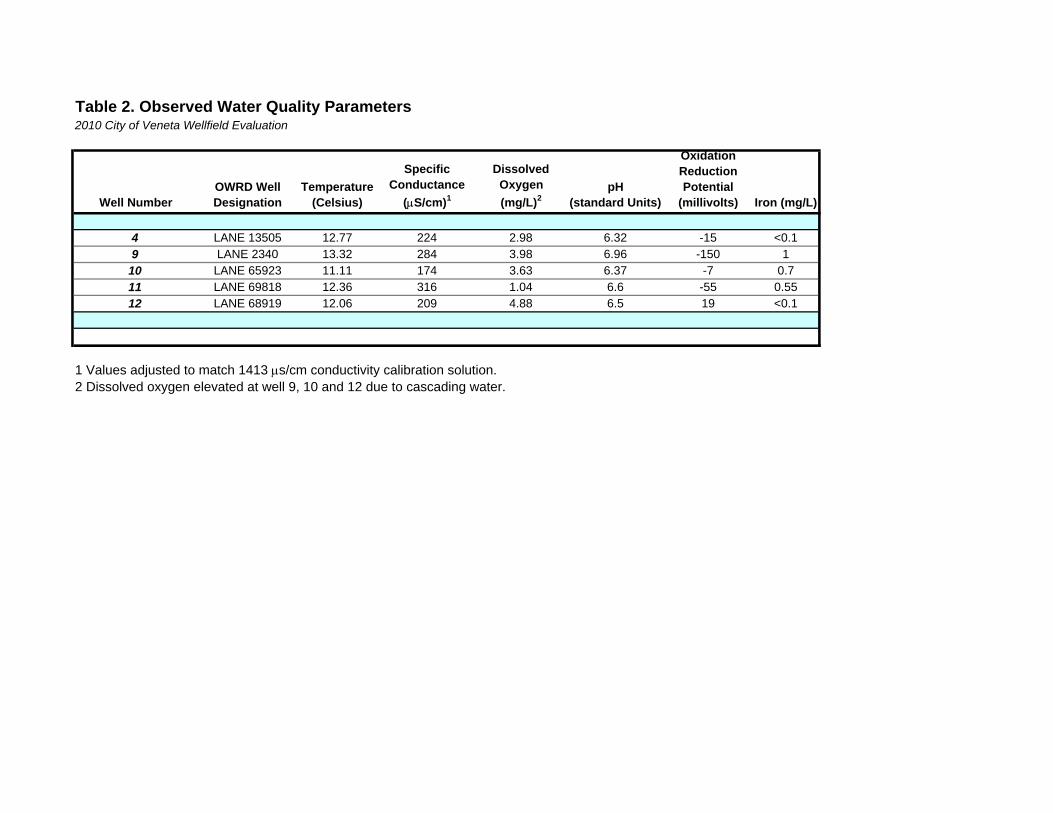
Table 2. Observed Water Quality Parameters2010 City of Veneta Wellfield Evaluation
Well NumberOWRD Well Designation
Temperature (Celsius)
Specific Conductance
(μS/cm)1
Dissolved Oxygen (mg/L)2
pH (standard Units)
Oxidation Reduction Potential
(millivolts) Iron (mg/L)
4 LANE 13505 12.77 224 2.98 6.32 -15 <0.19 LANE 2340 13.32 284 3.98 6.96 -150 1
10 LANE 65923 11.11 174 3.63 6.37 -7 0.711 LANE 69818 12.36 316 1.04 6.6 -55 0.5512 LANE 68919 12.06 209 4.88 6.5 19 <0.1
1 Values adjusted to match 1413 μs/cm conductivity calibration solution. 2 Dissolved oxygen elevated at well 9, 10 and 12 due to cascading water.

Table 3. BART Bacteriological Testing Summary Table2010 City of Veneta Wellfield Evaluation
Well Number
OWRD Well Designation
Total Depth (feet
bgs)
2010 Specific Capacity (gpm/ft)*
Production Wells IRB SLY SRB IRB SLYM SRB4 LANE 13505 166 6.8 P P -- Aggressive Moderate Background9 LANE 2340 180 9 P P -- Aggressive Moderate Background
10 LANE 65923 92 NA P P -- Aggressive Moderate Background11 LANE 69818 100 3.6 P P P Aggressive Aggressive Aggressive12 LANE 68919 160 9.13 P P -- Aggressive Moderate Background
Notes: P = positive-- = not detected above backgroundAggressive, moderate and background designations based on Dryocon Technologies methodology classification
BART Testing Results (Positive/Negative)
BART Testing Results for Bacterialogical Population Aggressiveness

Table 4. Preventative Maintenance Program2010 City of Veneta Wellfield Evaluation
Physical Inspection First Year Frequency Long Term FrequencyFacility Inspection Monthly or whenever visited Monthly or whenever visitedBorehole Video Whenever pump is pulled, annually 1 Whenever pump is pulled, annually 1
Pump Component and Parts Whenever pump is pulled, annually 1 Whenever pump is pulled, annually 1
Hydraulic Testing and Data ReviewDischarge Monthly MonthlyDrawdown Monthly MonthlySpecific Capacity Monthly MonthlyStep Rate Testing Quarterly AnnuallyPump and Motor EvaluationCheck Voltage, Amperage, Ohms Monthly MonthlyInstrument Calibration Annual AnnualPerformance Monitoring (with step test) Quarterly BiannualWater Quality TestingParameters of pH, ORP, eH, temperature and dissolved oxygen Monthly MonthlyTotal Iron Weekly Weekly WSE Bacterial Assessment Biannual Annual (or as needed)General Chemistry Analysis Quarterly BiannualBART kit Quarterly BiannualBART kit Quarterly BiannualTreatment
Mechanical RedevelopmentBefore well performance decreases reach
25%Before well performance decreases
reach 25%
Chemical RedevelopmentBefore well performance decreases reach
25%Before well performance decreases
reach 25%
Notes: 1 Visual inspection of the well and pump should be performed as frequent as practicableThe frequencies may be increased at high priority wells or on the basis of water demand and pumping. Biannual evaluations should be conducted prior to the high water demand and just after the high water demand periods

Table 5. Generalized Well Redevelopment and Well Rehabilitation2010 City of Veneta Wellfield Evaluation
Baseline EvaluationCollect bacteria sampleMeasure specific capacity and pH Mechanical RedevelopmentPull pumpPerform well videoClean well with brushingMechanical rehabilitaiton by surging, jetting, airlifting or Hydropuls™ Bail or airlift wellPerform second well videoRe-test well specific capacityChemical Rehabilitation (after mechanical redevelopment)Chemical treatment Agitation of chemical by surging or Hydropuls™ Bail, airlift, pump the well cleanPerform third well videoRe-test well specific capacityCollect bacteria sample
Notes: Notes: Hydropuls™ is a repetitive fluid impulse generation tool used in well redevelopmentThe technology transmitts the highest percentage of energy into the filter pack and aquifer of the listedtechniques.

Table 6Interference AnalysisCity of Veneta
March 2010 Static Water Level (ft bgs)
Top of Screen (ft bgs)
4 225 35 71.24 110 15.5 50.5 5.2 55.7 4.3 54.8 9.5 60.09 450 50 36.12 75 6.7 56.7 3.6 60.3 4.3 61.0 7.9 64.610 80 53 28.81 40 10.6 63.6 2.0 65.6 1.9 65.5 3.9 67.511 80 32 49 25 63 12 9 44 9 2 6 47 5 2 4 47 3 5 0 49 9
Total Scenarios 1 and 3
Scenario 4 (Influence from Both Proposed
Wells)Total Scenarios
1 and 4
Field Measurements Model-Estimated Drawdown (ft) for Multiple Wells Pumping 1,2
Well
Reported Pumping Rate
(gpm)
Observed Drawdown (ft) at
Reported Pumping Rate
Scenario 1 (Pumping at the 4 other Existing
Wells)Total for
Scenario 1
Scenario 2 (Influence from
a Western Proposed Well)
Total Scenarios 1 and 2
Scenario 3 (Influence from
an Eastern Proposed Well)
11 80 32 49.25 63 12.9 44.9 2.6 47.5 2.4 47.3 5.0 49.912 225 15 73.01 80 16.1 31.1 5.0 36.1 4.3 35.4 9.3 40.4
Notes 1 Bold values indicate that pumping level (drawdown plus static water level ) exceeds the depth to top of screen. 2 Drawdown for the proposed wells are not presented in the table due to uncertainty in well efficiency and actual hydraulic conditions limiting estimation of total drawdown
Fern Ridge Reservoir
Fern Ridge Reservoir
Long Tom River
Well 9 = 550 gpmWell 4 = 190 gpm
Well 12 = 225 gpm
Well 11 = 100 gpm
Well 10 = 160 gpmLo n g Tom River
Wil s
on
Cr eek
Wes
t For k Coyot e
Cr e
e k
Ind ian Creek
126
JEANS RD
PERKINS RD
SERTIC RD
BOLTON HILL RD
FLECK RD
HU
ST
ON
RD
TE
RR
ITO
RIA
L R
D
HUNTER RD
BOLTON RD
8T
H S
T
FLORENCE EUGENE HWY
EL
LM
AK
ER
RD
6T
H S
T
5T
H S
T
MILO RD
WILDWOOD RD
MIS
TY
LN
BROADWAY AVE
TIDBALL LN
BIG
GS
RD
VERA LN
CIN
NA
BA
R L
N
AE
RO
RD
CLAY DR
WIGGINS LN
CHENEY DR
MCCUTCHEN ST
STRAWBERRY LN
DUNHAM AVE
WIN
TE
R L
N
BL
EK
DR
BA
KE
R R
D
MIL
LE
R R
D
4T
H S
T
ER
DM
AN
WA
Y
VISTA DR
2N
D S
T3R
D S
T
CHICKADEE LN
PARKSIDE DR
7T
H S
T
DUNHAM RD
MARINA RD
HO
PE
LN
MA
BE
L L
N
LYNETTE LN
OA
K I
SL
AN
D D
R
FA
UL
HA
BE
R R
D
DU
ST
Y L
N
WOODLAND AVE
10
TH
ST
ENGLAND LOOP
GARTH LN
GIRL SCOUT RD
9T
H S
T
COCHRAN CT
ME
LA
NIE
LN
DAHLIN RD
JOSEE LN
BERRY LN
FE
AT
HE
R R
D
JEFFERSON ST
P
INE
ST
FE
RN
ME
AD
OW
LN
NO
RM
AN
AV
E
DAHLIN DR
FE
AT
HE
R
DR
FO
UN
TA
IN R
D
CH
UK
AR
LN
CHERRY LN
ALLURE AVE
SH
ER
WO
OD ST
KIN
GP
IN L
OO
P
HUNTER AVE
DO
GW
O
OD
CHICKADEE
JAKE ST
WE
ST
WO
OD
CT
PE
RK
INS
CT
JE
SS
IE J
AM
ES
LN
GA
RB
ER
LN
EA
ST
WO
OD
CT
OREGON CIR
DO
GW
OO
D LN
OA
K I
SL
AN
D D
R
HUNTER RD
7T
H S
T
9T
H S
T
COCHRAN CT
Groundwater SupplyDevelopment Area
FIGURE 1
City of VenetaLane County, Oregon
LEGEND
Existing City Wells
Veneta UGB
Railroads
Watercourses
Waterbodies
Groundwater Development Supply Area
Area outside UGB
Area within UGB
Area within UGB and within 1 Mileof Perennial Waterbodies
1 Mile Buffer from PerennialWaterbodies (Fern RidgeReservoir and Long Tom River)
MAP NOTES:Projection: Oregon State Plane South ZoneDatum: North American Datum of 1983Date: March 15, 2010Data Sources: Oregon Geospatial Data Clearing-house, Aerial Photo taken in 2004 by LCOG
0 750 1500 2250 3000
Feet
1:18,000Scale
File Path: \\pdx\Projects\Portland\297 - Veneta\003 - Well Evaluation\Project_GIS\Project_mxds\FigureX_GW_Supply_Development_Area.mxd, Date: March 15, 2010 9:58:43 AM

Cross Section A - A’FIGURE 2
City of VenetaLane County, Oregon
MAP NOTES:Projection: NoneDatum: NoneDate: August 8, 2008Data Sources: USGS, OWRD, City of Veneta
ScaleHorizontal: 1" = 2000’
Vertical: 1" = 50’2000 4000 6000 8000 10000 12000 14000 16000 18000
-200 -200
-100 -100
0 200
100 250
200 300
300 350
400 400 LEGEND
Surface Elevation
A A’
File Path: P:\297 - Veneta (MSA)\001 - GW Supply Evaluation\Project_GIS\Project_mxds\FigureX_Cross_Section_A-A’.mxd, Date: August 8, 2008 11:34:27 AM
Screened Intervalor Perforated
Static GW Level
Sand and Gravel
Clay, Sandy Clay, Silt
Marine Sediments, Tyee Formation
?
Inferred Contact
Estimated Contact
TD
TD
TD
TD
TDTD
TD
TD TD
TD
?
??
?
??
?
Wel
l 10
Wel
l 13
Wel
l 11
Lan
e58
440
Wel
l 9
Lan
e54
209
Lan
e15
23/
1527
Lan
e24
203
Lan
e33
94
Lan
e65
413
?
?
?
?
?
??
?
?
?
?
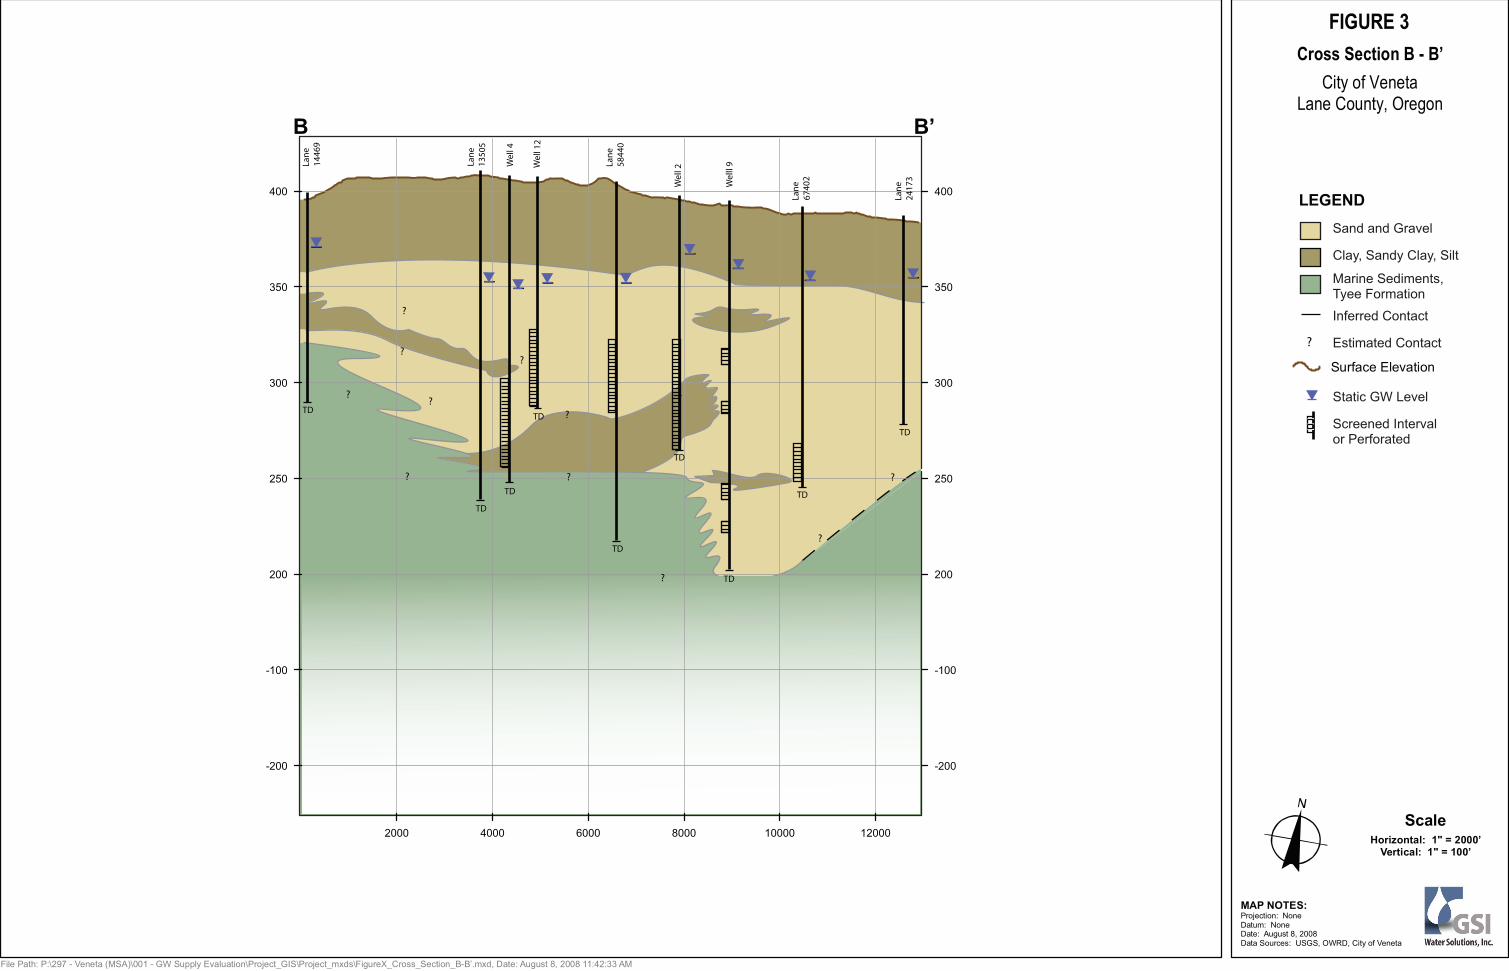
Cross Section B - B’FIGURE 3
City of VenetaLane County, Oregon
MAP NOTES:Projection: NoneDatum: NoneDate: August 8, 2008Data Sources: USGS, OWRD, City of Veneta
’BB
2000 4000 6000 8000 10000 12000
-200 -200
-100 -100
200 200
250 250
300 300
350 350
400 400 LEGEND
Surface Elevation
File Path: P:\297 - Veneta (MSA)\001 - GW Supply Evaluation\Project_GIS\Project_mxds\FigureX_Cross_Section_B-B’.mxd, Date: August 8, 2008 11:42:33 AM
ScaleHorizontal: 1" = 2000’
Vertical: 1" = 100’
TD
TD
TD
TD
TD
TD
TD
TD
TD
?
?
?
?
?
Lan
e14
469
Lan
e13
505
Wel
l 4
Wel
l 12
Lan
e58
440
Wel
l 2
Wel
ll 9
Lan
e67
402
Lan
e24
173
?
?
?
?
?
?
Screened Intervalor Perforated
Static GW Level
Sand and Gravel
Clay, Sandy Clay, Silt
Marine Sediments, Tyee Formation
?
Inferred Contact
Estimated Contact

Figure 4
Well Locations Used for Conceptual Model
Refinement
LEGEND
WELL SYMBOL
Urban Growth Boundary
Fine-grained Alluvium Well
Sand and Gravel Well
Marine Bedrock Well
66611 – OWRD Well ID

10
20
0
30
40
50
60
70
80
-10
-20
90
-30-4
0
100
110
120
50
50
060
20
0
90
50
50
50
20
30
10
0
10
40
40
60
40
10
10
60
0
50
60
0
10
70
60
10
70 8030
100
70
60
60
70
-20
10
10
30
90
-10
0
20
-10
0
0
10
0
0
20
10
7010
40
80
20
20
0
30
50
70
0
0
50
0
30
20
70
Thickness of Sand andSand and Gravel
FIGURE 5
City of VenetaLane County, Oregon
LEGEND
Well Locations
Veneta City Limits
Thickness of Sand andSand and Gravel (feet)
0
>0 - 10
>10 - 20
>20 - 30
>30 - 40
>40 - 50
>50 - 60
>60 - 70
>70 - 80
>80 - 90
>90 - 100
>100 - 110
>110 - 120
>120 - 130
>130
10-foot Contours
MAP NOTES:Projection: Oregon State Plane South ZoneDatum: North American Datum of 1983Date: December 9, 2009Data Sources: OWRD, USGS, Oregon GeospatialData Clearinghouse
0 2000 4000 6000 8000
1 inch equals 4,000 feet
1:48,000Scale
File Path: P:\Portland\297 - Veneta\003 - Well Evaluation\Project_GIS\Project_mxds\FigureX_Thickness_of_Sand_and_Sand_and_Gravel.mxd, Date: December 9, 2009 12:12:21 PM

Generalized Figure of the Redox Front and Bacterial Populations
FIGURE 6
NOTES
Not to ScaleP:\Portland\297 - Veneta\003 - Well Evaluation\Figures
IB AB
Slim
e
SRB
Well
IB - Iron-Fixing BacteriaAB - Aerobic BacteriaSlime - Slime FormingSRB - Sulfate Reducing Bacteria
Redox Front
IB AB
Slim
e
SRB
Sand and Gravel
Clay

Fern Ridge Reservoir
Fern Ridge Reservoir
Long Tom River
Proposed Well West Proposed Well East
Well 9 = 550 gpmWell 4 = 190 gpm
Well 12 = 225 gpm
Well 11 = 100 gpm
Well 10 = 160 gpmLo n g Tom River
Wil s
on
Cr eek
Wes
t For k Coyot e
Cr e
e k
Ind ian Creek
126
JEANS RD
PERKINS RD
SERTIC RD
BOLTON HILL RD
FLECK RD
HU
ST
ON
RD
TE
RR
ITO
RIA
L R
D
HUNTER RD
BOLTON RD
8T
H S
T
FLORENCE EUGENE HWY
EL
LM
AK
ER
RD
6T
H S
T
5T
H S
T
MILO RD
WILDWOOD RD
MIS
TY
LN
BROADWAY AVE
TIDBALL LN
BIG
GS
RD
VERA LN
CIN
NA
BA
R L
N
AE
RO
RD
CLAY DR
WIGGINS LN
CHENEY DR
MCCUTCHEN ST
STRAWBERRY LN
DUNHAM AVE
WIN
TE
R L
N
BL
EK
DR
BA
KE
R R
D
MIL
LE
R R
D
4T
H S
T
ER
DM
AN
WA
Y
VISTA DR
2N
D S
T3R
D S
T
CHICKADEE LN
PARKSIDE DR
7T
H S
T
DUNHAM RD
MARINA RD
HO
PE
LN
MA
BE
L L
N
LYNETTE LN
OA
K I
SL
AN
D D
R
FA
UL
HA
BE
R R
D
DU
ST
Y L
N
WOODLAND AVE
10
TH
ST
ENGLAND LOOP
GARTH LN
GIRL SCOUT RD
9T
H S
T
COCHRAN CT
ME
LA
NIE
LN
DAHLIN RD
JOSEE LN
BERRY LN
FE
AT
HE
R R
D
JEFFERSON ST
P
INE
ST
FE
RN
ME
AD
OW
LN
NO
RM
AN
AV
E
FE
AT
HE
R
DR
FO
UN
TA
IN R
D
CH
UK
AR
LN
CHERRY LN
ALLURE AVE
SH
ER
WO
OD ST
KIN
GP
IN L
OO
P
HUNTER AVE
DO
GW
O
OD
CHICKADEE
JAKE ST
WE
ST
WO
OD
CT
PE
RK
INS
CT
JE
SS
IE J
AM
ES
LN
GA
RB
ER
LN
EA
ST
WO
OD
CT
OREGON CIR
DO
GW
OO
D LN
OA
K I
SL
AN
D D
R
HUNTER RD
7T
H S
T
9T
H S
T
COCHRAN CT
Proposed Well LocationsFIGURE 7
City of VenetaLane County, Oregon
LEGEND
Proposed New Wells
Existing City Wells
Veneta UGB
Railroads
Watercourses
Waterbodies
Groundwater Development Supply Area
Area outside UGB
Area within UGB
Area within UGB and within 1 Mileof Perennial Waterbodies
1 Mile Buffer from PerennialWaterbodies (Fern RidgeReservoir and Long Tom River)
MAP NOTES:Projection: Oregon State Plane South ZoneDatum: North American Datum of 1983Date: June 10, 2010Data Sources: Oregon Geospatial Data Clearing-house, Aerial Photo taken in 2004 by LCOG
0 750 1500 2250 3000
Feet
1:18,000Scale
File Path: P:\Portland\297 - Veneta\003 - Well Evaluation\Project_GIS\Project_mxds\Figure7_GW_Proposed_New_Wells.mxd, Date: June 10, 2010 1:41:50 PM