Embed Size (px)
Citation preview
Info-Tech Research Group 1
Vendor Landscape:Uninterruptible Power Supply (UPS) A consolidating market with few viable vendors and many solutions.
Info-Tech Research Group 2
The UPS market is dominated by few, but many good solutions exist. Choosing the right vendor is as equally important as choosing your UPS products.
Introduction
Data center managers, facilities managers, and building managers seeking to select a solution for a uninterruptible power supply (UPS) solution for the data center.Enterprises that have established their stand-by power strategy and have reached the UPS vendor selection stage of planning.Enterprises of all sizes that are evaluating the market in order to upgrade or refresh double on-line conversion UPS systems. Enterprises with minimum UPS requirements starting between 200KW – 900KW, and that also require a solution that is scalable to support future growth.
This Research Is Designed For: This Research Will Help You:
Identify and rank vendor offerings in the UPS market space.Understand the table stakes and nuanced differences in the product offerings between UPS vendors.Evaluate UPS vendors and products to determine the right fit for your enterprise needs.Select a UPS solution by providing additional scenario-based criteria.
Info-Tech Research Group 3
Executive Summary
• The UPS market is moving towards further consolidation on a global scale. This global outlook means more accessible sales and service teams for customers in previously untapped locations. Additionally, green/efficient products are becoming an important inclusion in vendors’ product offerings. Data centers and server rooms of all sizes face significant threats in availability of electricity, making enterprises more conscious of efficiency. There will be a lack of new power coming on line as new power utilities cease to be built, turning it into a simple economics equation of supply and demand, where electricity prices will continue to rise. In addition, prices and penalties for carbon emissions will also increase. Thus,customers will also begin including ‘green’ criteria in vendor evaluations, whether it’s exploring a flywheels, or intelligent efficiency modes.
• Champions, Liebert/Emerson Network Power and Eaton Powerware, provide innovative stand-by power solutions that follow market trends and address customer needs. Both vendors feature energy-saving modes, and a global customer base, as well as strong sales and support channels.
• When value for money is taken into consideration, Liebert/Emerson Network Power and Eaton Powerware remain the most compelling options, although Gamatronic rises up in rank as a close third. Due to an inability to provide solution pricing, a few vendors received low value indexing.
• Enterprise use cases provide valuable insight for the vendor selection process. In the UPS vendor field, attention should be paid to your organization’s present and future stand-by power size requirements, the vendor’s offerings in terms of efficiency software and intelligent modes, and the global breadth of vendors’ sales and service teams.
Info-Tech Research Group 4
Market Overview
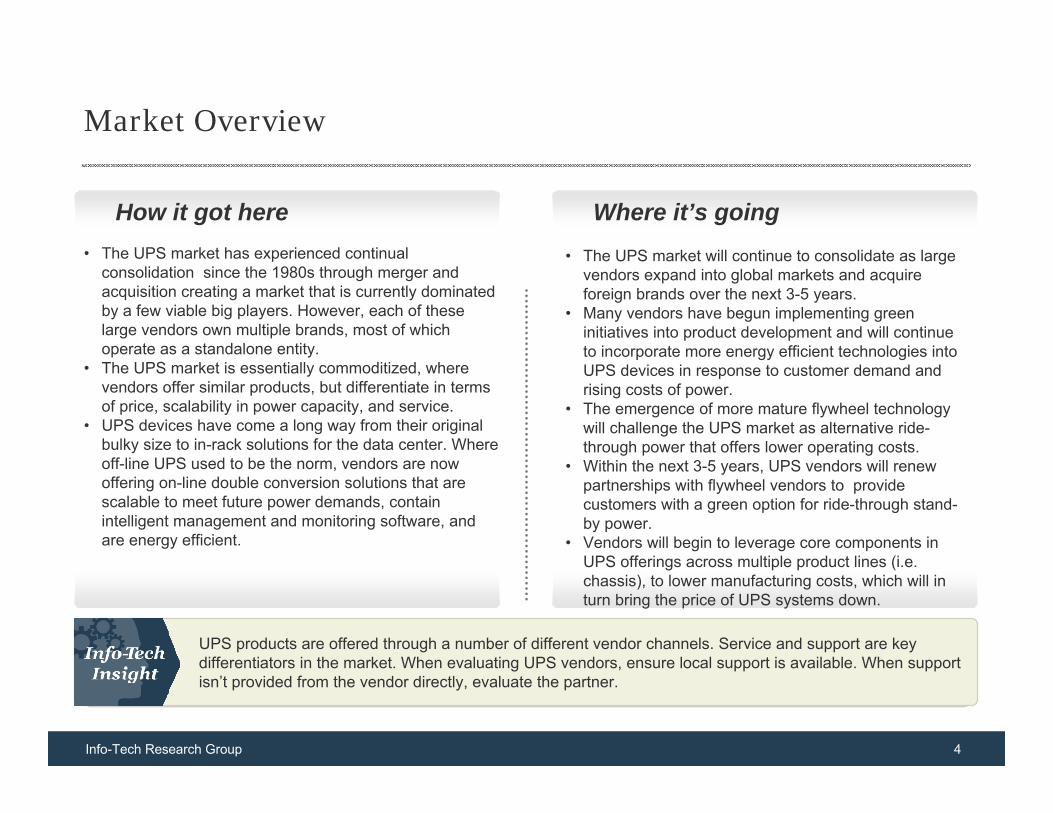
• The UPS market has experienced continual consolidation since the 1980s through merger and acquisition creating a market that is currently dominated by a few viable big players. However, each of these large vendors own multiple brands, most of which operate as a standalone entity.
• The UPS market is essentially commoditized, where vendors offer similar products, but differentiate in terms of price, scalability in power capacity, and service.
• UPS devices have come a long way from their original bulky size to in-rack solutions for the data center. Where off-line UPS used to be the norm, vendors are now offering on-line double conversion solutions that are scalable to meet future power demands, contain intelligent management and monitoring software, and are energy efficient.
• The UPS market will continue to consolidate as large vendors expand into global markets and acquire foreign brands over the next 3-5 years.
• Many vendors have begun implementing green initiatives into product development and will continue to incorporate more energy efficient technologies into UPS devices in response to customer demand and rising costs of power.
• The emergence of more mature flywheel technology will challenge the UPS market as alternative ride-through power that offers lower operating costs.
• Within the next 3-5 years, UPS vendors will renew partnerships with flywheel vendors to provide customers with a green option for ride-through stand-by power.
• Vendors will begin to leverage core components in UPS offerings across multiple product lines (i.e. chassis), to lower manufacturing costs, which will in turn bring the price of UPS systems down.
How it got here Where it’s going
UPS products are offered through a number of different vendor channels. Service and support are key differentiators in the market. When evaluating UPS vendors, ensure local support is available. When support isn’t provided from the vendor directly, evaluate the partner.
Info-Tech Research Group 5
UPS Criteria & Weighting Factors
Features Usability
AffordabilityArchitecture
Product
Vendor
Vendor Evaluation
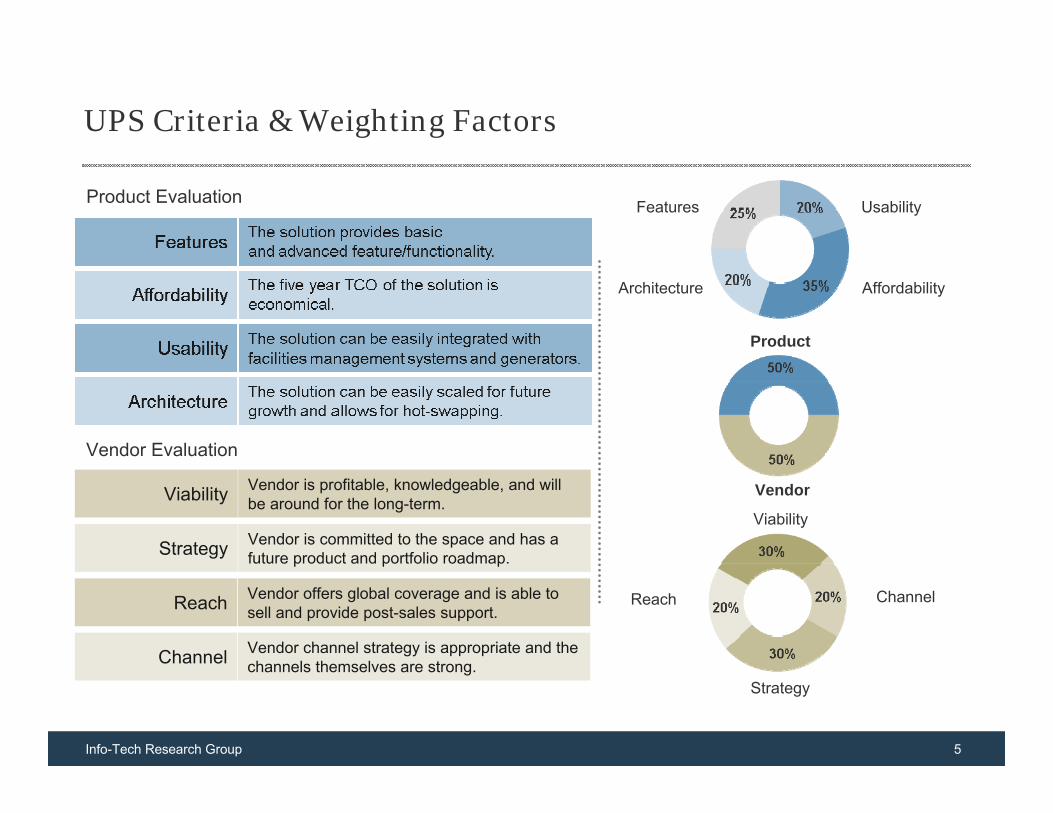
Vendor is committed to the space and has a future product and portfolio roadmap.Strategy
Vendor offers global coverage and is able to sell and provide post-sales support. Reach
Vendor is profitable, knowledgeable, and will be around for the long-term.Viability
Vendor channel strategy is appropriate and the channels themselves are strong. Channel
Product Evaluation
Viability
Channel
Strategy
Reach
Info-Tech Research Group 6
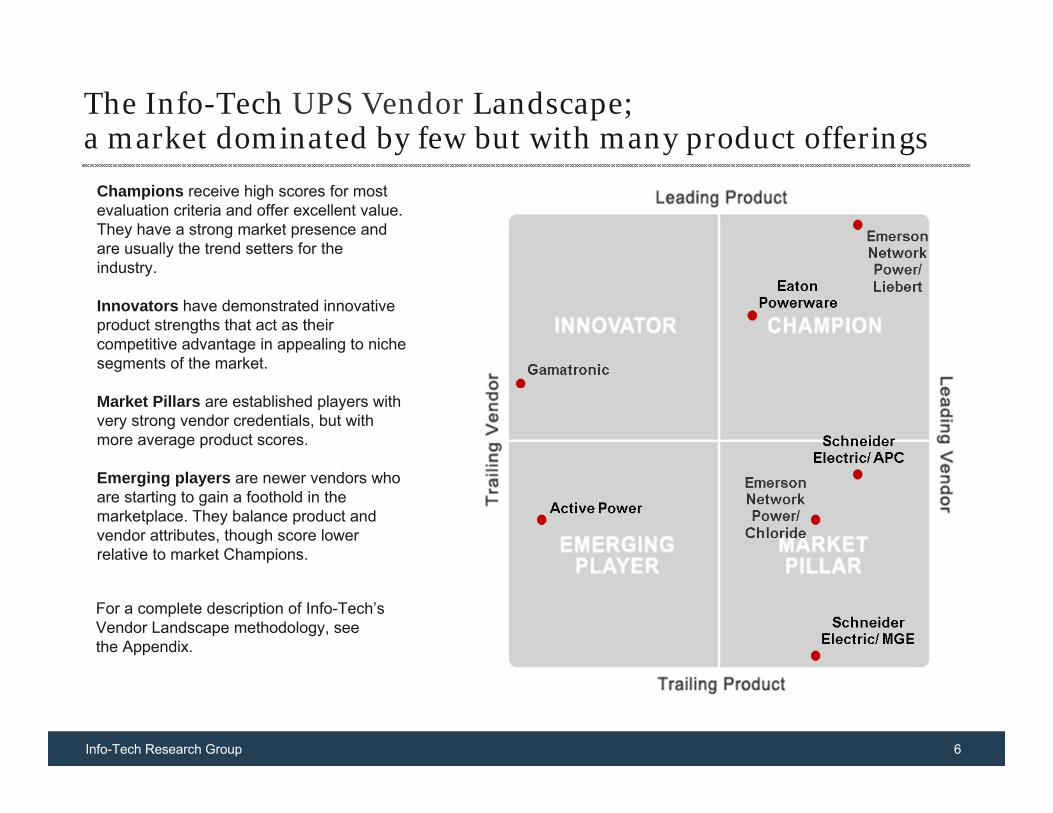
The Info-Tech UPS Vendor Landscape;a market dominated by few but with many product offerings
Champions receive high scores for most evaluation criteria and offer excellent value. They have a strong market presence and are usually the trend setters for the industry.
Innovators have demonstrated innovative product strengths that act as their competitive advantage in appealing to niche segments of the market.
Market Pillars are established players with very strong vendor credentials, but with more average product scores.
Emerging players are newer vendors who are starting to gain a foothold in the marketplace. They balance product and vendor attributes, though score lower relative to market Champions.
For a complete description of Info-Tech’s Vendor Landscape methodology, see the Appendix.
Info-Tech Research Group 7
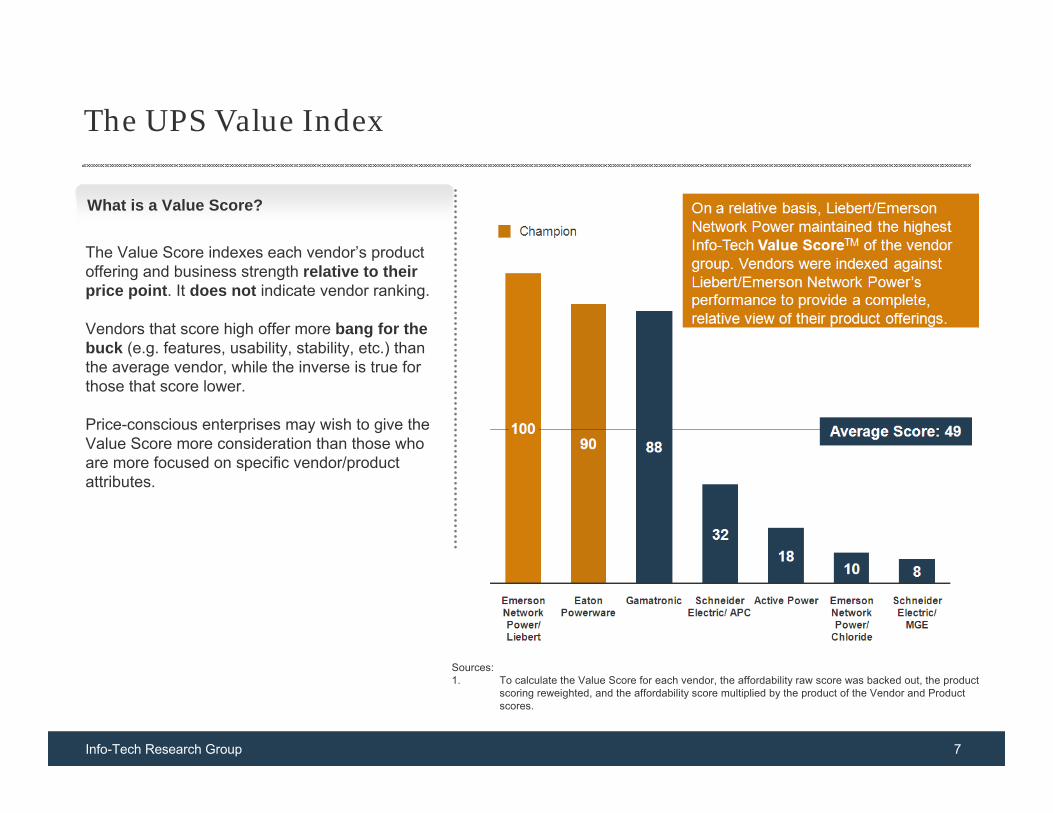
What is a Value Score?
The UPS Value Index
The Value Score indexes each vendor’s product offering and business strength relative to their price point. It does not indicate vendor ranking.
Vendors that score high offer more bang for the buck (e.g. features, usability, stability, etc.) than the average vendor, while the inverse is true for those that score lower.
Price-conscious enterprises may wish to give the Value Score more consideration than those who are more focused on specific vendor/product attributes.
Sources:1. To calculate the Value Score for each vendor, the affordability raw score was backed out, the product
scoring reweighted, and the affordability score multiplied by the product of the Vendor and Product scores.
Info-Tech Research Group 8
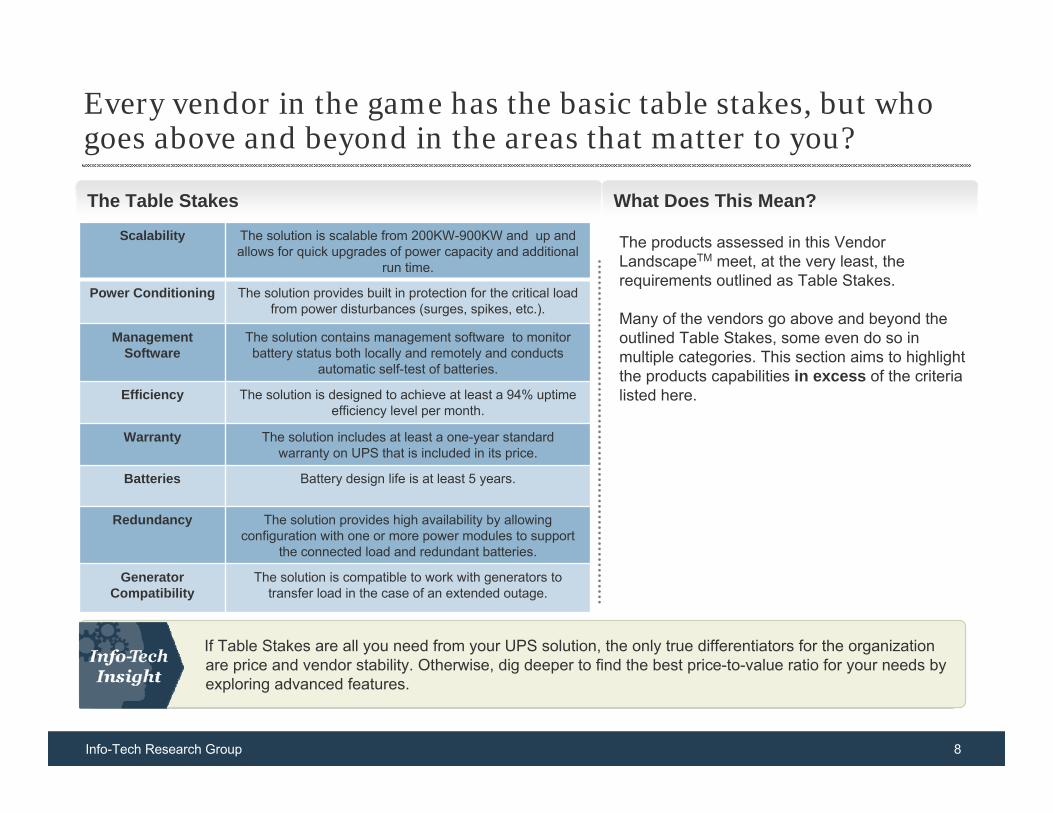
Every vendor in the game has the basic table stakes, but who goes above and beyond in the areas that matter to you?
If Table Stakes are all you need from your UPS solution, the only true differentiators for the organization are price and vendor stability. Otherwise, dig deeper to find the best price-to-value ratio for your needs by exploring advanced features.
The products assessed in this Vendor LandscapeTM meet, at the very least, the requirements outlined as Table Stakes.
Many of the vendors go above and beyond the outlined Table Stakes, some even do so in multiple categories. This section aims to highlight the products capabilities in excess of the criteria listed here.
The Table Stakes What Does This Mean?
Scalability The solution is scalable from 200KW-900KW and up and allows for quick upgrades of power capacity and additional
run time.
Power Conditioning The solution provides built in protection for the critical load from power disturbances (surges, spikes, etc.).
Management Software
The solution contains management software to monitor battery status both locally and remotely and conducts
automatic self-test of batteries.
Efficiency The solution is designed to achieve at least a 94% uptime efficiency level per month.
Warranty The solution includes at least a one-year standard warranty on UPS that is included in its price.
Batteries Battery design life is at least 5 years.
Redundancy The solution provides high availability by allowing configuration with one or more power modules to support
the connected load and redundant batteries.
Generator Compatibility
The solution is compatible to work with generators to transfer load in the case of an extended outage.
Info-Tech Research Group 9
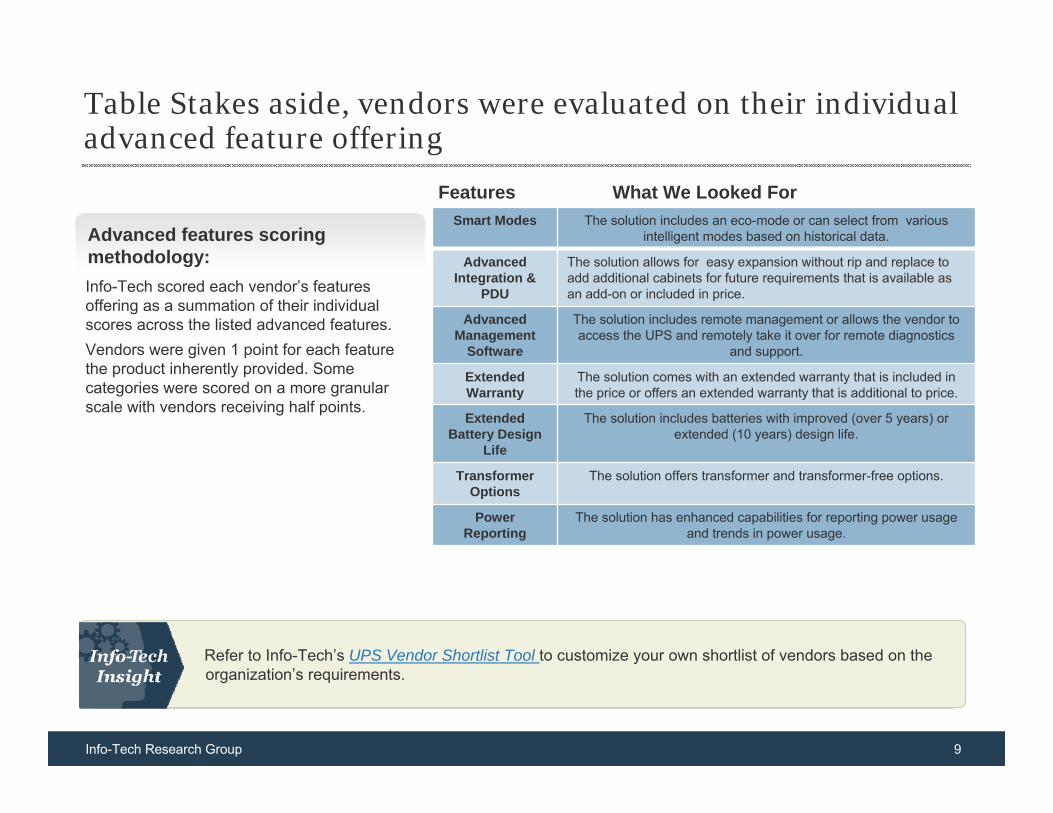
Table Stakes aside, vendors were evaluated on their individual advanced feature offering
What We Looked ForFeaturesSmart Modes The solution includes an eco-mode or can select from various
intelligent modes based on historical data.
Advanced Integration &
PDU
The solution allows for easy expansion without rip and replace to add additional cabinets for future requirements that is available as an add-on or included in price.
Advanced Management
Software
The solution includes remote management or allows the vendor to access the UPS and remotely take it over for remote diagnostics
and support.
Extended Warranty
The solution comes with an extended warranty that is included inthe price or offers an extended warranty that is additional to price.
Extended Battery Design
Life
The solution includes batteries with improved (over 5 years) or extended (10 years) design life.
Transformer Options
The solution offers transformer and transformer-free options.
Power Reporting
The solution has enhanced capabilities for reporting power usageand trends in power usage.
Advanced features scoring methodology:Info-Tech scored each vendor’s features offering as a summation of their individual scores across the listed advanced features. Vendors were given 1 point for each feature the product inherently provided. Some categories were scored on a more granular scale with vendors receiving half points.
Refer to Info-Tech’s UPS Vendor Shortlist Tool to customize your own shortlist of vendors based on the organization’s requirements.
Info-Tech Research Group 10
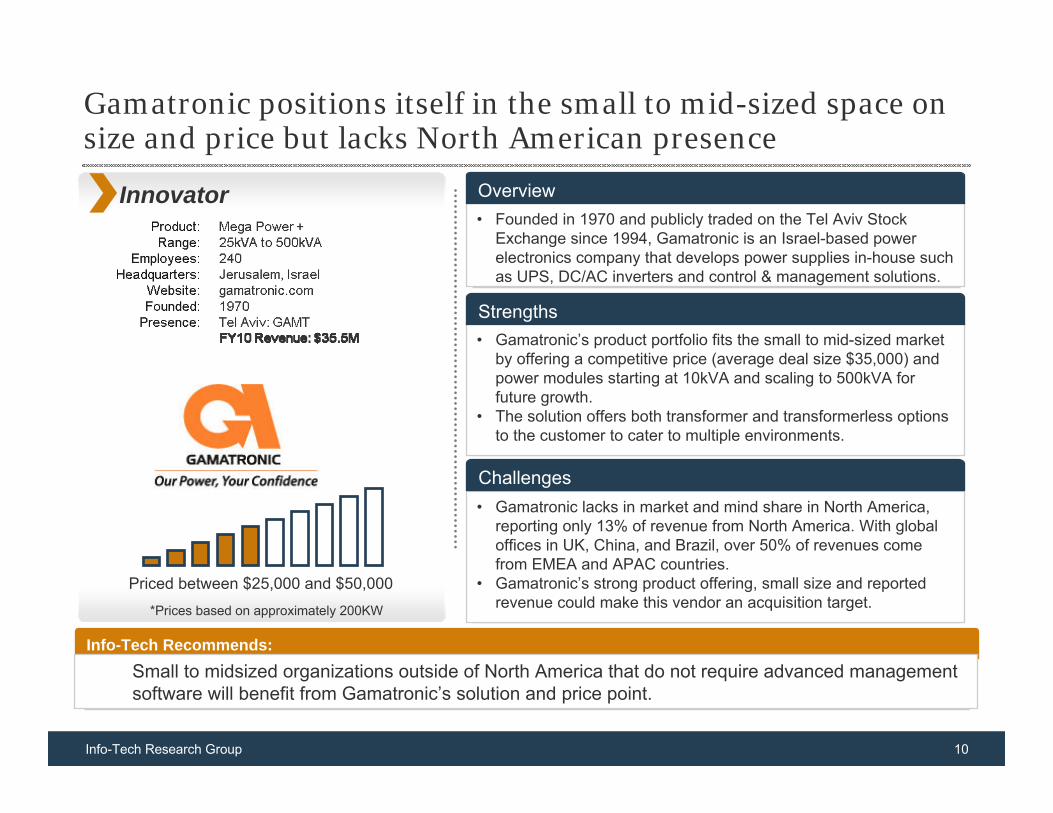
Info-Tech Recommends:Small to midsized organizations outside of North America that do not require advanced management software will benefit from Gamatronic’s solution and price point.
Gamatronic positions itself in the small to mid-sized space on size and price but lacks North American presence
Innovator• Founded in 1970 and publicly traded on the Tel Aviv Stock
Exchange since 1994, Gamatronic is an Israel-based power electronics company that develops power supplies in-house such as UPS, DC/AC inverters and control & management solutions.
Overview
• Gamatronic’s product portfolio fits the small to mid-sized market by offering a competitive price (average deal size $35,000) and power modules starting at 10kVA and scaling to 500kVA for future growth.
• The solution offers both transformer and transformerless options to the customer to cater to multiple environments.
Strengths
• Gamatronic lacks in market and mind share in North America, reporting only 13% of revenue from North America. With global offices in UK, China, and Brazil, over 50% of revenues come from EMEA and APAC countries.
• Gamatronic’s strong product offering, small size and reported revenue could make this vendor an acquisition target.
Challenges
Priced between $25,000 and $50,000*Prices based on approximately 200KW
Info-Tech Research Group 11
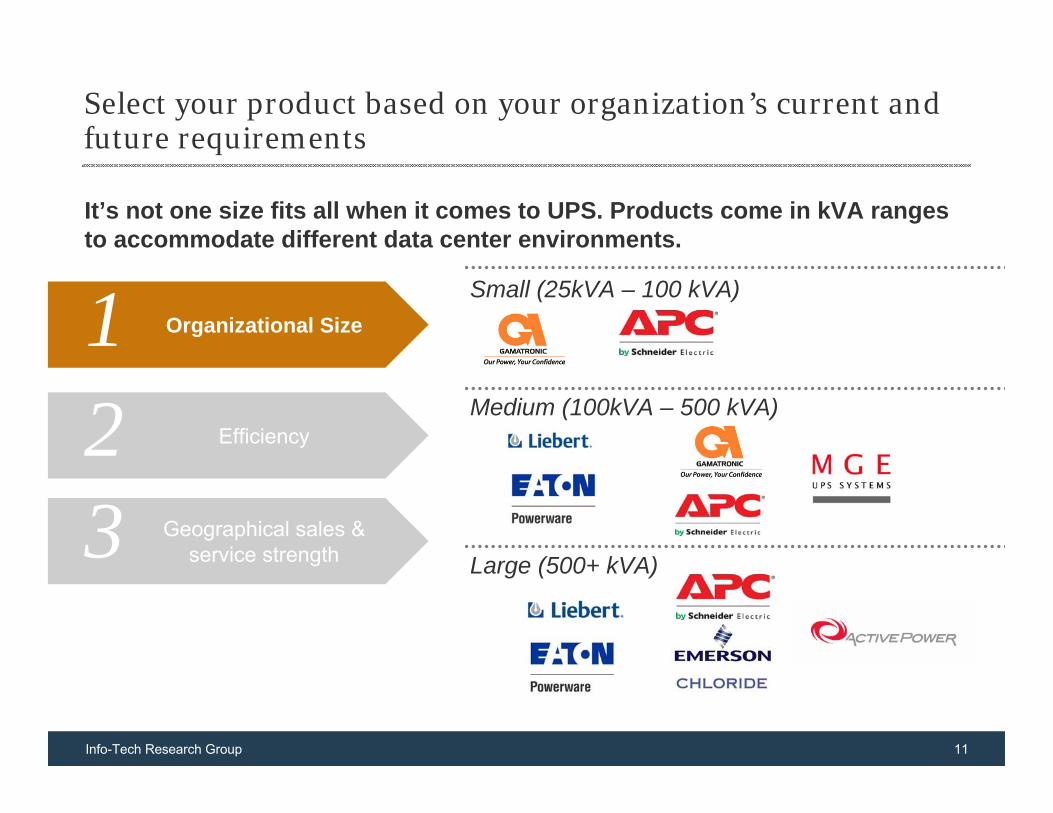
It’s not one size fits all when it comes to UPS. Products come in kVA ranges to accommodate different data center environments.
Select your product based on your organization’s current and future requirements
Organizational Size
Efficiency
Geographical sales & service strength
123
Small (25kVA – 100 kVA)
Medium (100kVA – 500 kVA)
Large (500+ kVA)
4
Info-Tech Research Group 12
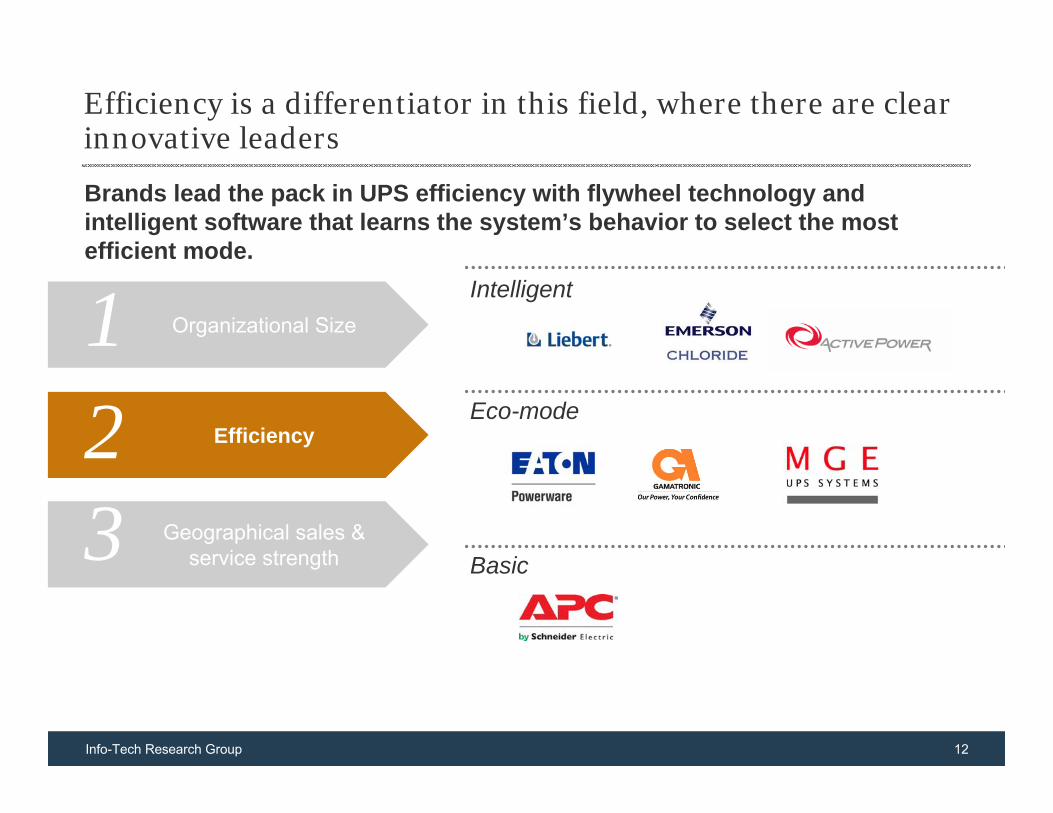
Brands lead the pack in UPS efficiency with flywheel technology and intelligent software that learns the system’s behavior to select the most efficient mode.
Efficiency is a differentiator in this field, where there are clear innovative leaders
Organizational Size
Efficiency
Geographical sales & service strength
123
Intelligent
Eco-mode
Basic
4
Info-Tech Research Group 13
Appendix
A discussion of Info-Tech’s vendor ranking methodologies
Info-Tech Research Group 14
Vendor Evaluation Methodology
Info-Tech Research Group’s Vendor Landscape market evaluations are a part of a larger program of vendor evaluations which includes Solution Sets that provide both Vendor Landscapes and broader Selection Advice.
From the domain experience of our analysts as well as through consultation with our clients, a vendor/product shortlist is established. Product briefings are requested from each of these vendors, asking for information on the company, products, technology, customers, partners, sales models and pricing.
Our analysts then score each vendor and product across a variety of categories, on a scale of 0-10 points. The raw scores for each vendor are then normalized to the other vendors’ scores to provide a sufficient degree of separation for a meaningful comparison. These scores are then weighted according to weighting factors that our analysts believe represent the weight that an average client should apply to each criteria. The weighted scores are then averaged for each of two high level categories: vendor score and product score. A plot of these two resulting scores is generated to place vendors in one of four categories: Champion, Innovator, Market Pillar, and Emerging Player.
For a more granular category by category comparison, analysts convert the individual scores (absolute, non-normalized) for each vendor/product in each evaluated category to a scale of zero to four whereby exceptional performance receives a score of four and poor performance receives a score of zero. These scores are represented with “Harvey Balls”, ranging from an open circle for a score of zero to a filled in circle for a score of four. Harvey Ball scores are indicative of absolute performance by category but are not an exact correlation to overall performance.
Individual scorecards are then sent to the vendors for factual review, and to ensure no information is under embargo. We will make corrections where factual errors exist (e.g. pricing, features, technical specifications). We will consider suggestions concerning benefits, functional quality, value, etc; however, these suggestions must be validated by feedback from our customers. We do not accept changes that are not corroborated by actual client experience or wording changes that are purely part of a vendor’s market messaging or positioning. Any resulting changes to final scores are then made as needed, before publishing the results to Info-Tech clients.
Vendor Landscapes are refreshed every 12 to 24 months, depending upon the dynamics of each individual market.
Info-Tech Research Group 15
Value Index Ranking Methodology
Info-Tech Research Group’s Value Index is part of a larger program of vendor evaluations which includes Solution Sets that provide both Vendor Landscapes and broader Selection Advice.
The Value Index is an indexed ranking of value per dollar as determined by the raw scores given to each vendor by analysts. To perform the calculation, Affordability is removed from the Product score and the entire Product category is reweighted to represent the same proportions. The Product and Vendor scores are then summed, and multiplied by the Affordability raw score to come up with Value Score. Vendors are then indexed to the highest performing vendor by dividing their score into that of the highest scorer, resulting in an indexed ranking with a top score of 100 assigned to the leading vendor.
The Value Index calculation is then repeated on the raw score of each category against Affordability, creating a series of indexes for Features, Usability, Viability, Strategy and Support, with each being indexed against the highest score in that category. The results for each vendor are displayed in tandem with the average score in each category to provide an idea of over and under performance.
The Value Index, where applicable, is refreshed every 12 to 24 months, depending upon the dynamics of each individual market.
Info-Tech Research Group 16
Product Pricing Scenario & Methodology
Info-Tech Research Group provided each vendor with a common pricing scenario to enable normalized scoring of Affordability, calculation of Value Index rankings, and identification of the appropriate solution pricing tier as displayed on each vendor scorecard.
Vendors were asked to provide list costs for SIEM appliances and/or SIEM software licensing to address the needs of a reference organization described in the pricing scenario. For non-appliance solutions (i.e., software-only and virtual appliance architectures), physical or virtual hardware requirements were requested in support of comparing as-installed costs.
Additional consulting, deployment, and training services were explicitly out of scope of the pricing request, as was the cost of enhanced support options, though vendors were encouraged to highlight any such items included with the base product acquisition. The annual software/hardware maintenance rate was also requested, along with clarity on whether or not the first year of maintenance was included in the quoted appliance/software costs, allowing a three-year total acquisition cost to be calculated for each vendor’s SIEM solution. This three-year total acquisition cost is the basis of the solution pricing tier indicated for each vendor.
Finally, the vendors’ three-year total acquisition costs were normalized to produce the Affordability raw scores and calculate Value Index ratings for each solution.
Key elements of the common pricing scenario provided to SIEM vendors included:•A three-site organization with 2200 employees located at a US head office facility, a second US satellite office, and a European satellite office. IT functions , including 3 dedicated IT security professionals, are located primarily at the US head office, with a small proportion of IT staff and systems located at the European site, which also acts as a DR facility.
•The firm is interested in reducing the effort associated with monitoring, alerting, and responding to security events at the Endpoint, Network, and Datacenter levels:◦ The volume & complexity of ad hoc queries against logged and correlated event data is fairly small, driven primarily by incident response efforts
and gaps in canned compliance reports.◦ The SIEM product would be used regularly by four IT staff across the US head office and European satellite site, with additional dashboard-
/report-level access for another four users in compliance/audit and IT management/executive roles.
•200 devices were identified as log data sources for a SIEM solution, including network components, security systems, and both physical and virtual servers. Windows Domain, Oracle databases, MS Exchange and SharePoint, and BES and VOIP environments were explicitly identified in the scenario, and the peak logging volume was specified at 5000 events per second (eps).