Embed Size (px)
Citation preview

1School of Aerospace Engineering, Beijing Institute of Technology, Beijing, People's Republic of China
2Thermo-Fluid Systems UTC, Faculty of Engineering and Physical Science, University of Surrey, Guildford, Surrey, GU2 7XH, UK
Corresponding author:
Debin FU, School of Aerospace Engineering, Beijing Institute of
Technology, No.5, South Avenue, Zhongguancun, Haidian District,
Beijing, China 100081
Email:[email protected]
Velocity Pick-up and Discharge Coefficient for Round Orifices with Cross Flow at
Inlet
Debin Fu1,2, John W. Chew2, Zixiang Sun2
Abstract
This study investigates the flow through round orifices with cross flow at the inlet. Emphasis is placed the
change in tangential velocity component for orifices with low /L D . A definition of velocity pick-up is
developed based on the orifice exit to cross flow tangential velocity ratio. Steady, incompressible and 3D
computational fluid dynamics (CFD) models with the SST k ω− turbulent model are employed to
calculate orifice flows with different geometrical and flow conditions. Stationary orifices and axial
orifices in a rotating disk are considered. CFD solutions are compared with experimental results and
published correlations for discharge coefficients, and good agreement is generally demonstrated. It is
found that the non-dimensional velocity pick-up depends strongly on the ratio of characteristic times for
flow to travel across the orifice in the tangential direction and that for the flow to pass through the orifice.
A correlation of velocity pick-up as a function of this ratio is given.
Keywords
Discharge coefficient, Velocity pick-up, Tangential velocity, Orifice flow, CFD

1 Introduction
The flow through orifices with cross flow at inlet is of interest in flow equipment such as turbines,
compressors, centrifuges, pumps, motors, alternators, and generators. Typically, these orifices occur as
stationary orifices in static structures, radial orifices in rotating shafts, and axial orifices in rotating discs.
Since the equipment performance and component life are influenced by the orifice flow, the prediction of
flow features in these systems and the calculation of the flow distribution are important to the system
design process. In recent decades, the pressure loss in these systems and the mass flow of air through the
orifice, characterized by the discharge coefficient, has been widely considered. Another feature of orifice
flow is the change in the fluid’s tangential velocity as it passes through the orifice. For example, as flow
passes through an orifice in a rotating component its tangential or swirl velocity will change. The
tangential velocity will affect vortex pressure losses and windage heating of the air in the system
downstream of the orifice [1-3]. Thus the “velocity pick-up” of orifice flows is important, but there is
little information available in the literature about how this might be estimated. For long orifices it is
reasonable to assume that the fluid tangential velocity is close to that of the orifice, but this will not be the
case for short orifices with low length to diameter ratios ( /L D ) .
For the estimation of discharge coefficient for orifice flow, geometric and flow parameters have been
considered in detail, including the length to diameter ratio of the hole, hole inclination angle, hole entry or
exit radiusing, pressure ratio, Reynolds number, rotation of the orifice, and presence of cross flow at inlet

3
or outlet. For example, the discharge coefficient for flow through holes normal to a rotating shaft
[4-5], compound-angle conical holes with cross-flow [6], axial orifices in a rotating disk [7], short
orifices with radiused and chamfered inlet [8] are investigated recently. Hay et al [9] gave a review of
discharge coefficient of turbine cooling holes and some methods correlating the discharge
coefficients are reported by some researches [10-12]. In addition to discharge coefficients, some flow
characteristics have been reported to explain orifice flow behaviour or describe specific phenomena.
These involve the vena contracta, saddle-shaped velocity profile in near-field region for orifice flow,
separation and reattachment flow [13-14]. Here we focus on the effect of inlet cross flow for sharp edged
orifices aligned at 90o to the inlet flow. Attention centres on low pressure ratio, high Reynolds number
conditions at which the flow is not sensitive to these parameters.
A brief discussion of some previous studies of the effect of inlet cross-flow on orifice flow is relevant
here. In 1969 Rohde et al. [15] published discharge coefficient measurements for orifices aligned at right
angles to a fully developed mainstream duct flow. The proportion of the duct flow passing through the
orifice could be controlled and results were presented for a range of orifice L/D ratios, sharp edged and
rounded orifice inlets. Rhode et al. presented their data, together with that of Dittrich and Graves [16], as
a discharge coefficient which assumed an inlet pressure equal to the total pressure in the duct plotted
against velocity head ratio (VHR), defined as the difference between duct total pressure and orifice exit
pressure divided by the dynamic pressure in the duct. Other workers have subsequently used experimental

4
data from Rohde et al. and others to produce correlations of discharge coefficient for use in engineering
calculations. For example, McGreehan and Schotsch [17] presented a correlation for use in
turbomachinery internal flow network modeling taking into account inlet edge radius. The definition of
discharge coefficient was based on assuming an orifice inlet pressure equal to the static pressure in the
duct, and corresponds to that used in this paper. The effect of inlet cross flow was correlated through the
ratio of inlet relative tangential velocity to the ideal orifice through flow parameter. In deriving their
correlation McGreehan and Schotsch used data for rotating orifices from Meyfarth and Shine [18] and
Grimm [19], in addition to Rohde et al.’s stationary orifice data.
More recently, computational fluid dynamics (CFD) has been established as a useful tool in estimating
discharge coefficients. For example, Sousek et al. [20] show generally good agreement between CFD,
using the SST k ω− model, for flow through an orifice in a rotating shaft. The maximum discrepancy in
discharge coefficient between CFD and measurement is about 10% over a range of conditions. Also using
the SST k ω− model, Da Soghe and Andreini [21] have studied discharge from a duct through multiple
orifices aligned at right angles to the flow. CFD results from this study and earlier work by the same
authors was used to produce a correlation for orifice discharge coefficient taking into account inlet cross
flow, orifice pressure ratio, and orifice L/D ratio. Reasonable agreement of the correlation with
measurements from Schulz et al. [22] was also demonstrated.
The present research extends previous work by presenting new experimental and CFD data,

5
comparing discharge coefficients from various sources, and considering the tangential velocity “picked
up” or changed by an orifice. Two typical cases, a stationary orifice with cross flow and flow through an
orifice in a rotating disk, are considered. Moreover, an approximate correlation for velocity pick-up is put
forward here. The model problems and detailed definition of velocity pick-up are given in section 2. CFD
solutions are visualized and validated by comparison of discharge coefficients with experiment data and
other workers results in section 3 and section 4. Results for velocity pick-up and some influences are
discussed in section 5. Conclusions are given in section 6.
2 Definitions and models
2.1 Problems considered
Two different orifice configurations, both having cross flow at the inlet, are considered. As shown in
Figure 1(a), the first case is a stationary orifice in a duct side wall. In this case, the relative tangential
velocity at orifice inlet , ,rel i tV is approximately expressed as the duct flow average velocity. The second
case is the flow through an axial orifice in a rotating disk as shown in Figure 1(b). Figure 1 indicates the
relative and absolute orifice outlet velocities for each case. For simplicity, the subscript for absolute
parameters is neglected below. A full list of notation is given in the appendix.
In these cases, orifices are assumed to be of round cross-sectional area with sharp edges, and ratios of
orifice length to diameter in the range from 0.1 to 0.5 are considered. In this research, air at atmospheric
conditions in the working fluid and the magnitude of flow Mach number considered is generally less than
6
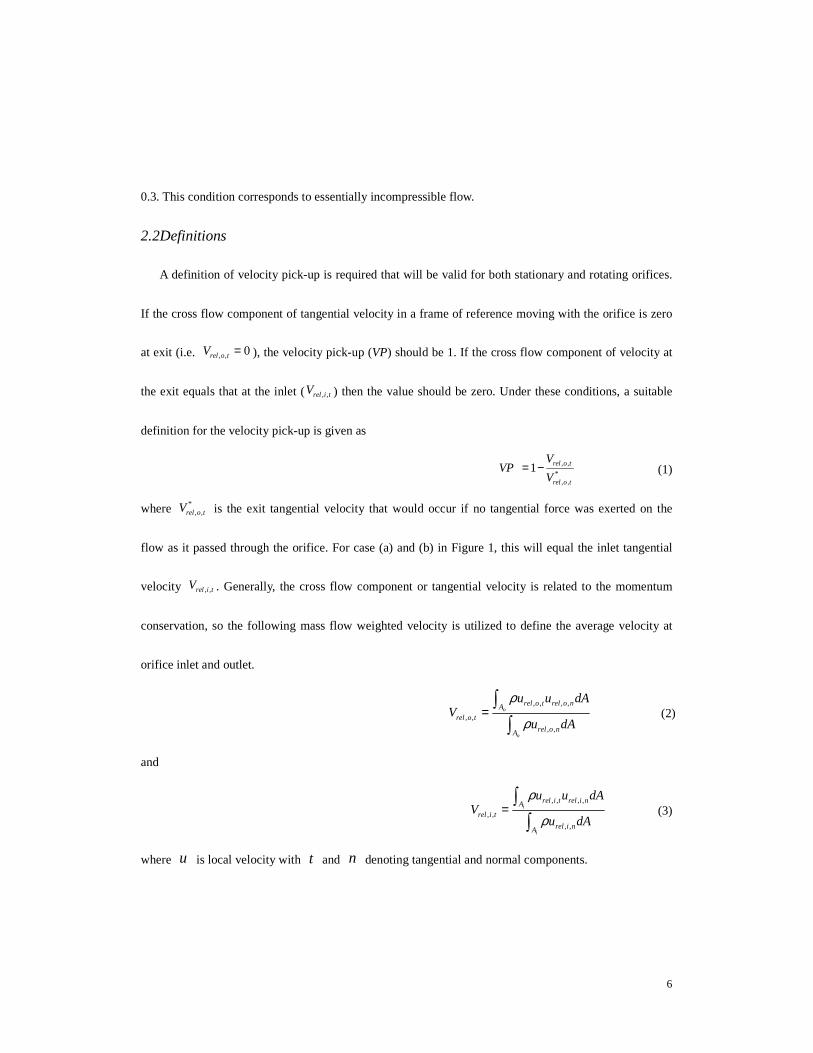
0.3. This condition corresponds to essentially incompressible flow.
2.2Definitions
A definition of velocity pick-up is required that will be valid for both stationary and rotating orifices.
If the cross flow component of tangential velocity in a frame of reference moving with the orifice is zero
at exit (i.e. , , 0rel o tV = ), the velocity pick-up (VP) should be 1. If the cross flow component of velocity at
the exit equals that at the inlet ( , ,rel i tV ) then the value should be zero. Under these conditions, a suitable
definition for the velocity pick-up is given as
, ,
*, ,
1 rel o t
rel o t
VVP
V= − (1)
where *, ,rel o tV is the exit tangential velocity that would occur if no tangential force was exerted on the
flow as it passed through the orifice. For case (a) and (b) in Figure 1, this will equal the inlet tangential
velocity , ,rel i tV . Generally, the cross flow component or tangential velocity is related to the momentum
conservation, so the following mass flow weighted velocity is utilized to define the average velocity at
orifice inlet and outlet.
, , , ,
, ,
, ,
o
o
rel o t rel o nA
rel o t
rel o nA
u u dAV
u dA
ρ
ρ=∫
∫ (2)
and
, , , ,
, ,
, ,
i
i
rel i t rel i nA
rel i t
rel i nA
u u dAV
u dA
ρ
ρ=∫
∫ (3)
where u is local velocity with t and n denoting tangential and normal components.

7
The discharge coefficient is defined as the ratio of the actual flow divided by the flow for the ideal case,
i.e.
actuald
ideal
mC
m=
&
& (4)
The ideal flow mass rate idealm& is calculated from the pressure difference across the orifice using the
incompressible flow relations.
2orificeideal
pm Aρ
ρ∆=& (5)
2.3 Model geometry and computational domain
As stated above, CFD is used to calculate the flow through orifices in this research. Mesh generation
and flow solutions were carried out using the commercial software Gambit and Fluent [23]. Figure 2
shows geometries of CFD models used in the present work. For the purpose of comparison and validation
of these models, most parameters correspond to experiment models.
For the flow through a stationary orifice, a straight square section duct model with an orifice on the
top surface is utilized as shown in Figure 2(a). The geometry in this model corresponds to that studied
experimentally by Glover [24]. The computational domain includes the duct, the orifice and surrounding
region. To reduce the computing effort, symmetry boundaries are applied on the 0z = boundary which
is shown in the figure. No-slip, no penetration boundary conditions have been applied on the duct and
orifice surfaces. The flow inlet lies on the entrance of main duct, and mass flow with uniform velocity is

8
specified here. Uniform pressure boundary conditions are applied to the duct outlet and outer boundaries
of the surrounding region. The outlet to the surrounding region is at atmospheric pressure. The outlet
pressure of the main duct is adjusted to control the pressure difference across the orifice.
Rotating disk models in the rotating reference frame are utilized here, representing the experimental
configuration of Idris et al [7]. A schematic of the geometry and computational domain for this model is
shown in Figure 2(b). The disk contains six holes at the same radius and equally spaced circumferentially.
The inlet region consists of a cylindrical housing. This is followed by the orifice and an outlet cylindrical
housing. Considering the repeating flow conditions, only a 60o sector of the disc model is simulated.
Periodic boundary conditions are imposed on the sector sides. As above, a mass flow boundary condition
is specified at the inlet of the model and a uniform pressure boundary is applied to the outlet with
atmospheric pressure. The inlet flow has a zero swirl component of velocity in the absolute frame of
reference. No-slip and no penetration boundaries are applied on solid surfaces. The orifice model is given
a spin equal to the rotational speed of the disk.
2.4 CFD mesh and solution
Block structured meshes are used in the present work. Denser grids are used in the vicinity of the
orifice due to the high velocity gradients developed there. Considering both the model accuracy and speed,
a limitation of the maximum value of mean dimensionless near-wall distance, i.e. max 5y+ < , is satisfied
for all cases.
9
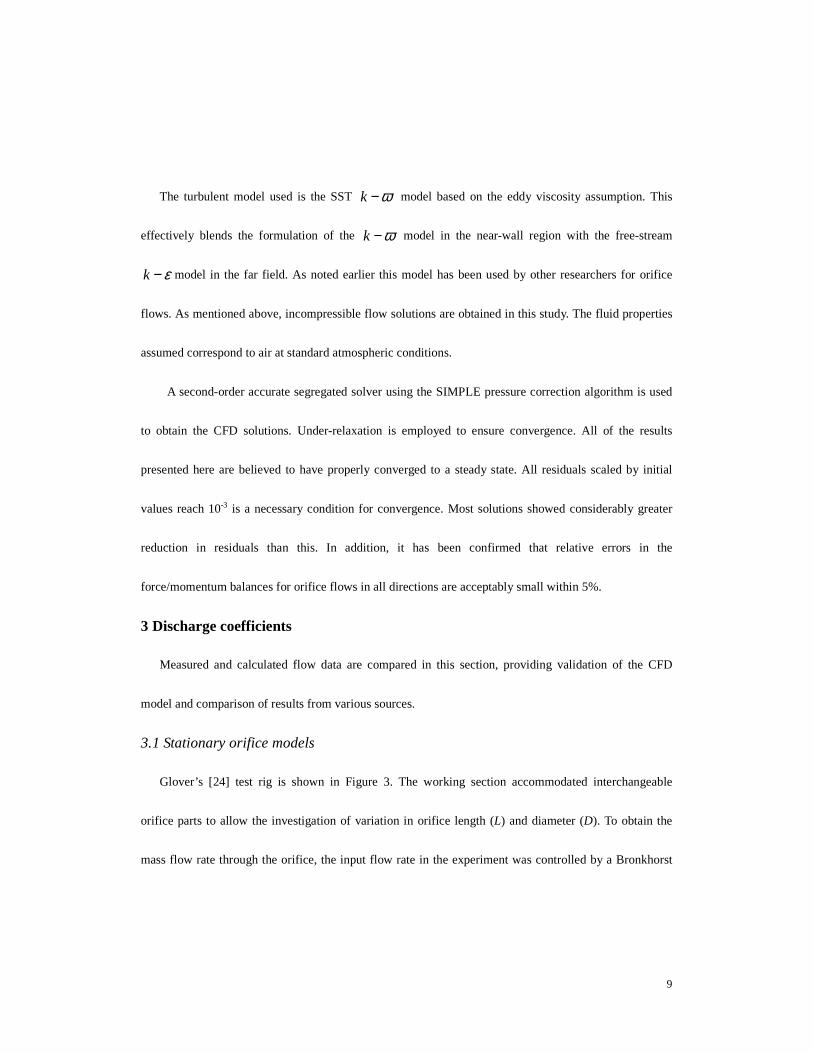
The turbulent model used is the SST k ω− model based on the eddy viscosity assumption. This
effectively blends the formulation of the k ω− model in the near-wall region with the free-stream
k ε− model in the far field. As noted earlier this model has been used by other researchers for orifice
flows. As mentioned above, incompressible flow solutions are obtained in this study. The fluid properties
assumed correspond to air at standard atmospheric conditions.
A second-order accurate segregated solver using the SIMPLE pressure correction algorithm is used
to obtain the CFD solutions. Under-relaxation is employed to ensure convergence. All of the results
presented here are believed to have properly converged to a steady state. All residuals scaled by initial
values reach 10-3 is a necessary condition for convergence. Most solutions showed considerably greater
reduction in residuals than this. In addition, it has been confirmed that relative errors in the
force/momentum balances for orifice flows in all directions are acceptably small within 5%.
3 Discharge coefficients
Measured and calculated flow data are compared in this section, providing validation of the CFD
model and comparison of results from various sources.
3.1 Stationary orifice models
Glover’s [24] test rig is shown in Figure 3. The working section accommodated interchangeable
orifice parts to allow the investigation of variation in orifice length (L) and diameter (D). To obtain the
mass flow rate through the orifice, the input flow rate in the experiment was controlled by a Bronkhorst

10
High-Tech Flow Controller, and an orifice meter was used to measure downstream mass flow rate. Static
pressures within the duct near orifices were determined at locations slightly upstream. A throttle valve and
suction pump were used to control duct exit pressure and prevent a high pressure blow-out.
The flow settling length in the 57 mm square section duct after the inlet is equal to approximately
1.7m. This allows ample length for flow development and is greater than the length assumed in the CFD
model. Orifices with diameter of 15 mm and 25 mm were tested. In most cases, the pressure difference
p∆ across the orifice is set to be in the range of 20 Pa to 60 Pa considering the accuracy of the
equipment available. The standard errors of orifice discharge coefficient in this experiment were
estimated as 1.9%. The parameters used in the Glover’s experiment and present simulation for stationary
orifices are listed in Table 1.
Table 1 Parameters of Glover’s experiment and present simulation
Parameter
Unit experiment simulation
Orifice diameter D [mm] 15 15
Orifice length L [mm] 5;7.5 0.15-15
L/D ratio [-] 0.3; 0.5 0.1-1
Pressure difference p∆ [Pa] 20-60 2-2000
Cross flow velocity cV [m/s] 2.74-4.46 2-40
Figure 4 plots discharge coefficients against velocity head ratio (VHR). This figure compares
McGreehan et al.’s correlation, Da Soghe et al.’s correlation, Dittrich et al.’s measurements, Rohde et al.’s

11
measurements, Glover’s measurements and the present CFD results. All results show a similar trend.
Increasing VHR reduces the effect of cross flow and tends to increase the discharge coefficient to a
limiting value.
Generally, agreement between the different sets of results is good with differences of less than 10%.
Note that Da Soghe et al.’s correlation is based on CFD results for conditions in which 0.5dC > . Hence
some departure from other results for very low VHR might be expected.
3.2 Rotating orifices
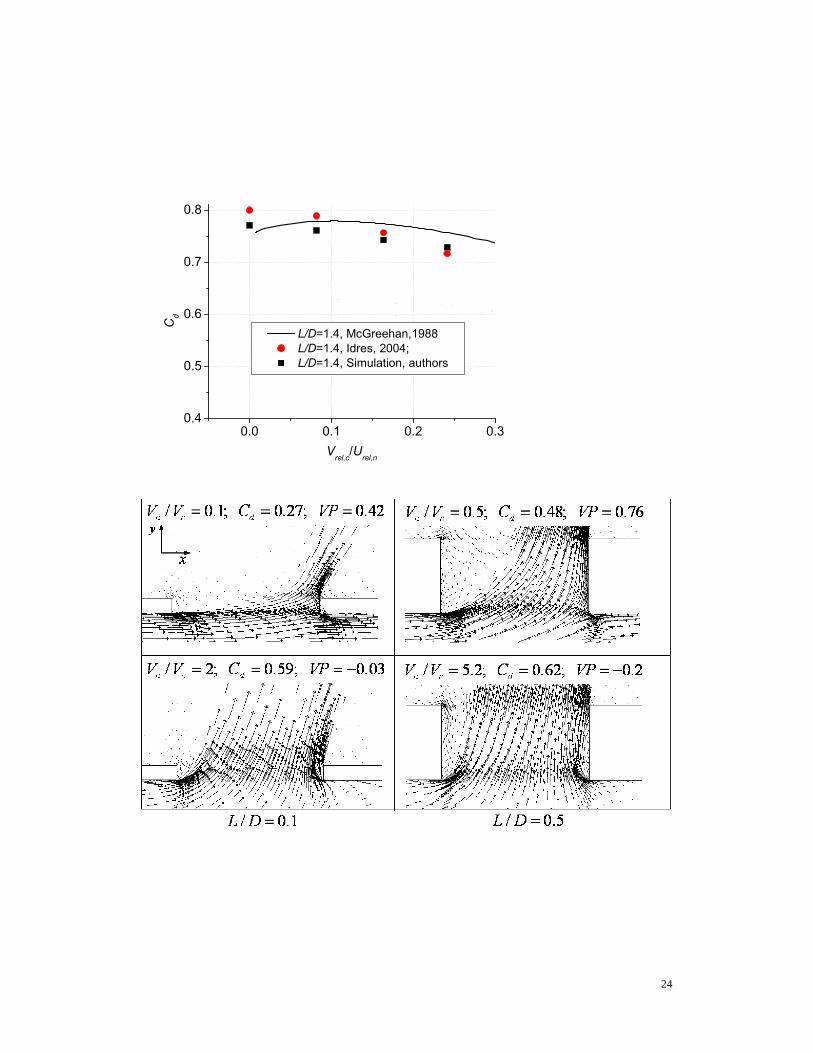
Measurements by Idris et al. and McGreehan et al.’s correlation are compared with CFD in Figure 5.
Although the main focus of the present paper is for/ 0.5L D ≤ , it is encouraging to see reasonable
agreement of CFD with Idris et al’s measurements for an orifice in a rotating disk with / 1.4L D = . For
this case CFD and experiment agree within 4% of dC . Note that in Figure 5 the abscissa is the cross flow
to orifice flow velocity ratio, rather than the VHR used in Figure 4. The CFD results for this case were for
a fixed mass flow given a mean orifice flow velocity of 67.2 m/s.
4 Flow visualization
Figure 6 shows some typical velocity vector plots for the two cases considered. Results are shown on
planes passing through the orifice centre and are aligned to give comparable views for the three cases.
The results for the stationary orifice are considered first as these do not include the effects of rotation and
cross flow at exit, and are therefore clear. At high crossflow conditions (low /n cV V ) Figure 6(a) shows

12
that the flow impinges on the downstream edge of the orifice and that this leads to strong deflection of the
flow as it passes through the orifice. As expected, high crossflow leads to a large separation zone on the
upstream side of the orifice. At higher values of /n cV V there is less deviation of the flow through the
orifice. This condition also produces significant separation on the downstream side. Especially, the
suction effect of the orifice leads to small tangential velocity component at orifice inlet and sometimes
corresponds to negative VP.
At low crossflow conditions (high ,/n rel tV V ) the rotating orifice results in Figure 6(b) are
qualitatively similar to those for the stationary orifice. Results for ,/ 2n rel tV V = in Figure 7(a), 7(b), and
for ,/ 5.2n rel tV V = in Figure 7(a) also show some quantitative agreement. At high crossflow conditions,
which also correspond to relatively strong rotational effects, more complex flows occur. These include
substantial recirculation at the orifice exit, which leads to some unexpectedly high estimates of the
velocity pick-up, VP. For such conditions the flow at the orifice exit and the value of VP are likely to
depend significantly on the flow conditions downstream of the orifice.
5 Velocity pick-up
5.1 Stationary orifices
Figure 7 summarizes the results for velocity pick-up for the stationary orifice. Figure 7 (a) shows the
CFD results from a series of tests for/ 0.1L D = , with VP plotted against the ratio of orifice through
flow velocity to inlet cross flow velocity /n cV V . For this seal, VP is well below unity for all conditions.

13
Generally VP decreases as /n cV V increases with the collapse of data showing independence of
Reynolds number for these conditions. The region of small negative values of VP around / 2n cV V = is
associated with the flow being separated at the orifice exit, as noted from the flow visualization.
Figure 7 (b) shows the variation of VP with /n cV V for different /L D values. As expected,
increasing /L D at a given velocity ratio increasesVP . For higher /L D values, VP approaches
unity at low values of /n cV V . At / 1L D = , the assumption that 1VP = gives errors in ,o tV less than
10% of the maximum of ,o tV and nV for all conditions. i.e. , ,/ max( , ) 0.1o t o t nV V V < . For / 0.5L D = ,
assuming 1VP = would give errors of up to 30% of the maximum of ,o tV and nV .
Attempting to account for the effects of both /n cV V and /L D , Figure 7(c) plots the velocity pick-up
against the ratio of characteristic times /D LT T , DT and LT are characteristic times for flow to cross
the orifice and to pass through the orifice. The ratio is given by
/ ( / ) ( / ) ( / ) ( / )D L c n n cT T D V L V V V L D= = (6)
Some collapse of data is shown in this figure for the cases of / 0.5L D ≤ . With increasing /D LT T ,
VP decreases and tends to a small value. For the region with small /D LT T , some significant differences
exist between the results for different /L D .
5.2 Rotating orifices
A series of rotating disk orifice solutions with rotational speeds from 1000 RPM to 18000 RPM are
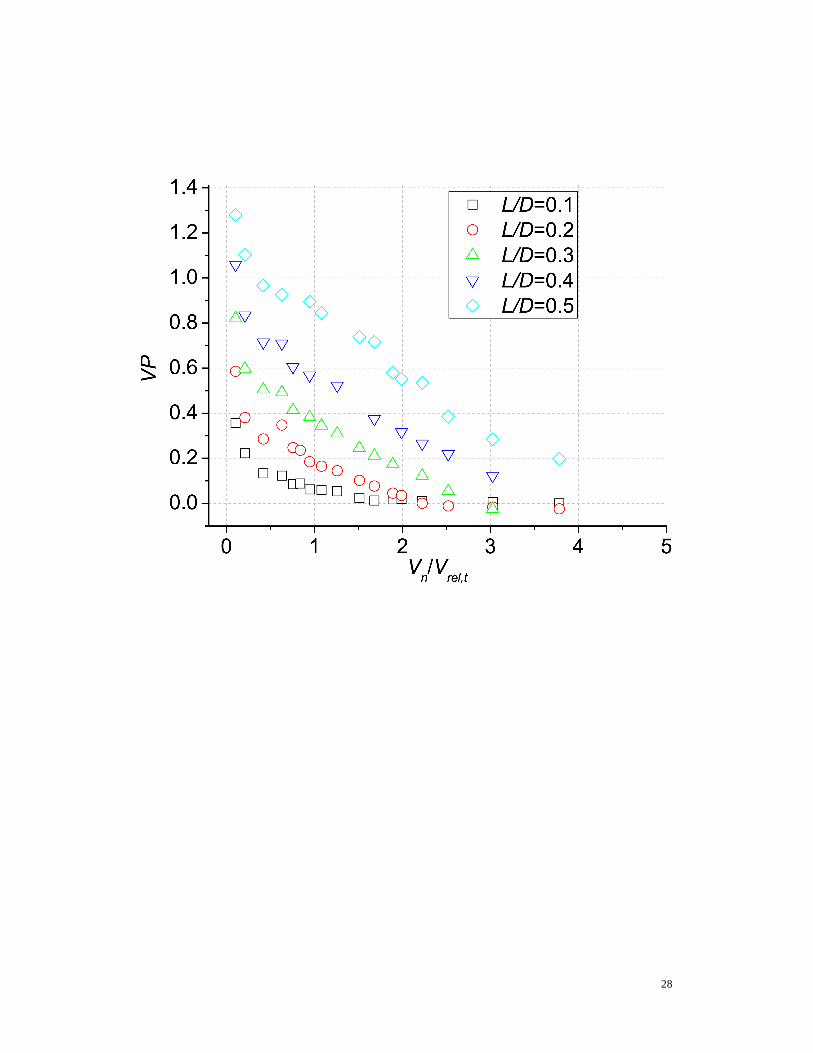
obtained for different orifice length to diameter ratios. Figure 8 shows the results for VP plotted against

14
/n tV V and /D LT T . As for the stationary orifice, for given/L D , VP decreases with increasing /n tV V
or /D LT T and tends to a small value. Note that some values exceed 1 for small /D LT T
and0.3 / 0.5L D≤ ≤ . These results are influenced by complex flows in the rotating orifice as discussed in
section 4.
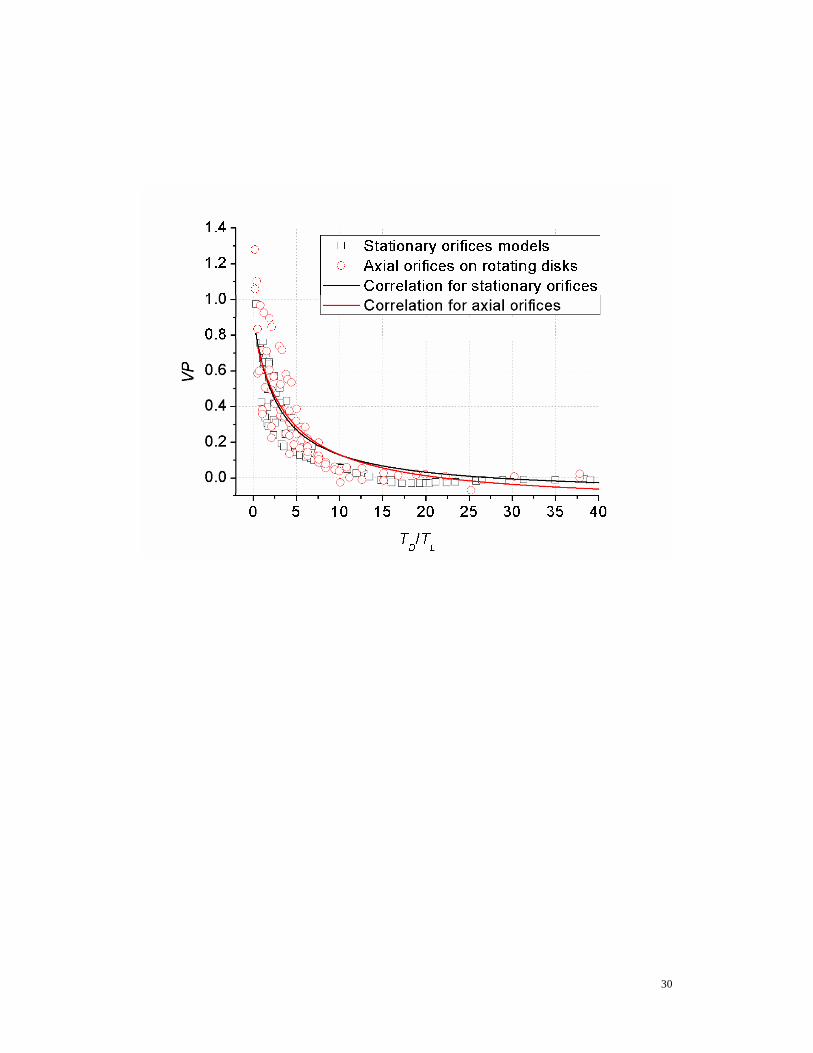
5.3 Correlation for velocity pick-up ratio
As described above, velocity pick-up will be low for orifice flows with large /D LT T and is of
interest for orifices with low /L D . It has been shown that VP depends to a significant extent on flow
conditions. Nevertheless a correlation of the present results is presented, as this may be useful in
approximate engineering calculations.
A simplified analysis of the orifice, assuming a tangential force due to the stagnation of the tangential
flow on the orifice inner surface, has been used to suggest a form for correlation of VP. Taking the
tangential force to be proportional to 2 / 2tVρ times the elemental surface area, and assuming a constant
through flow velocity component, the following expression for VP may be derived.
1 1 2/ ( / )D LVP k k T T k= + + (7)
where 1k and 2k are constants to be determined.
Figure 9 gives plots of VP against /D LT T for all numerical results with / 0.5L D ≤ . Correlations of
the form given by equation (7) are also included. For stationary orifice models,
1 2.85k = and 2 0.093k = − ; For rotating disk models, 1 3.9k = and 2 0.15k = − ; Although some scatter is

15
noticeable, it is clear that VP is reasonably correlated.
6 Conclusion
The flow through round orifices with cross flow at inlet was investigated in this research. Steady,
incompressible and 3D CFD models with the SST k ω− turbulent model were employed to simulate the
flows through stationary orifices, axial orifices in a rotating disk, and radial orifices in a rotating shaft. It
was shown that the discharge coefficients of these orifices are in general agreement with other workers’
experimental results and correlations. McGreehan and Schotsch’s [18] empirically based correlation
showed reasonable agreement with all data. Da Soghe and Andreini’s [22] correlation based on CFD for
quite different conditions.
Changes of the fluids tangential velocity when it passes through the orifice have been investigated
using CFD. A definition of velocity pick-up ratio (VP) has been developed based on the orifice exit to
inlet tangential (or cross flow) velocity ratio. For short orifices VP may be considerably less than 1,
indicating that significant tangential momentum is advected through the orifice. In rotating machinery
applications this may affect vortex strength, and pressure distribution in cavities downstream of the
orifice.
Velocity pick-up was shown to be a function of/D LT T , the ratio of characteristic times for flow to
cross and to pass through the orifice. A correlation of results for VP as a function of /D LT T was
produced, and may be used for approximate prediction. However, results show significant scatter about

16
this correlation associated with rotational and downstream flow effects, so some caution is advised. The
correlation was based on results for orifices with0.1 / 0.5L D≤ ≤ , as this range was considered to be of
meet practical interest. For/ 1L D = , the assumption 1VP = would give errors in the exit tangential
velocity less than 10% of the maximum of the inlet tangential velocity and the through flow velocity.
Acknowledgements
This work has been conducted at the Thermo-Fluids Systems, University Technology Centre at the
University of Surrey. Financial support from the China Scholarship Council for Dr. D. Fu as a visiting
scholar and support from the University of Surrey are gratefully acknowledged.
References
[1] Etemad, M. R., Pullen, K., Besant, C. B. and Baines, N. Evaluation of windage losses for high-speed
disc machinery. Proc Instn Mech Engrs, Part A, 1992, 206 (3): 149-157.
[2] Swain, R. and Preater, R. Investigation of windage heating effects on rotating components using
pulsed ESPI. Optics and Lasers in Engineering, 1997, 26: 377-394.
[3] Fiebig, M. Embedded vortices in internal flow: heat transfer and pressure loss enhancement. Int. J.
Heat and Fluid flow. 1995, 16: 376-388.
[4] Alexiou, A., Hills, N. J., Long, C. A., Turner, A. B., Wong, L. S. and Millward, J. A. Discharge
coefficients for flow through holes normal to a rotating shaft. Int. J. Heat and fluid Flow, 2000, 21:
17
701-709.
[5] Sousek, J., Pfitzner, M. and Niehuis, R. Experimental study of discharge coefficients of radial orifices
in high-speed rotating shafts. Proceedings of ASME Turbo Expo 2010. GT2010-22691: 1-10.
[6] Taslim, M. E. and Ugarte, S. Discharge coefficient measurements for flow through compound-angle
conical holes with cross-flow. International Journal of Rotating Machinery, 2004, 10: 145-153.
[7] Idris, A., Pullen, K and Barnes, D. An investigation into the flow within inclined rotating orifices and
the influence of incidence angle on the discharge coefficient. Proc. IMechE Part A: J. Power and Energy,
2004, 218: 55-69.
[8] Dittmann, M., Dullenkopf, K. and Wittig, S. Discharge coefficients of rotating short orifices with
radiused and chamfered inlets. Journal of Engineering for Gas Turbines and Power, 2004, 126: 803-808.
[9] Hay, N. and Lampard, D. Discharge coefficient of turbine cooling holes: a review. Journal of
Turbomachinery, 1998, 120: 314-319.
[10] Rowbury, D. A., Oldfield, M. L. G. and Lock, G. D. A method for correlating the influence of
external crossflow on the discharge coefficients of film cooling holes. Journal of Turbomachinery, 2001,
123: 258-265.
[11] Huning, M. Comparison of discharge coefficient measurements and correlations for several orifice
designs with cross-flow and rotation around several axes. Proceedings of ASME Turbo Expo Berlin, 2008.
GT2008-50976: 1-14.

18
[12] Idris, A. and Pullen, K R. Correlations for the discharge coefficient of rotating orifices based on the
incidence angle. Proc. IMechE Part A: J. Power and Energy, 2005, 219: 333-352.
[13] Deo, R. C., Mi, J. and Nathan, G. J. The influence of nozzle-exit geometric profile on statistical
properties of a turbulent plane jet. Experimental Thermal and Fluid Science, 2007, 32: 545-559.
[14] Ramamurthi, K. and Nandakumar, K. Characteristics of flow through small sharp-edged cylindrical
orifices. Flow Measurement and Instrumentation , 1999, 10: 133-143.
[15] Rohde, J. E., Richards, H. T. and Metger, G. W. Discharge coefficients for thick plate orifices with
approach flow perpendicular and inclined to the orifice axis, NASA Technical Note, NASA TN D-5467.
1969.
[16] Dittrich, R. T. and Graves, C. C. Discharge coefficient for combustor liner air-entry holes. I –
Circular Holes with Parallel Flow. NACA TN 3663, 1956.
[17] McGreehan, W. F. and Schotsch, M. S. Flow characteristics of long orifices with rotation and corner
radiusing. Journal of Turbomachinery, 1988, 110: 213-217.
[18] Meyfarth, P. F. and Shine, A. J. Experimental study of flow through moving orifices. Journal of Basic
Engineering, Dec. 1965: 1082-1083.
[19] Grimm, R. E. Fluid flow characteristics through orifices in enclosed rotating disks. M. S. Thesis,
AFIT, 1967.
[20] Sousek, J., Riedmuller, D. and Pfitzner, M. Experimental and numerical investigation of the flow

19
field at radial holes in high-speed rotating shafts. Proceedings of ASME Turbo Expo 2012,
GT2012-68209.
[21] Da Soghe, R. and Andreini, A. Numerical characterization of pressure drop across the manifold of
turbine casing cooling system. Proceedings of ASME Turbo Expo 2012, GT2012-68787.
[22] Schulz, A., Gritsch, M., and Wittig, S. Effect of crossflows on the discharge coefficient of film
cooling holes with varying angles of inclination. ASME, Turbo Expo, 2001-GT-0134.
[23] Ansys. Fluent. Fluent 6.3 Documentation.
[24] Glover, S. M. Discharge coefficient and flow measurement for orifices with crossflow. Final Year
Project Report, University of Surrey, 2011.
Appendices
Notation
A surface area
dC discharge coefficient
D diameter of orifice
pF stagnation force on orifice surface
1k parameter for velocity pick-up ratio
2k parameter for velocity pick-up ratio

20
L length of orifice
m& mass flow rate
dsp static pressure for the duct flow
jsp static pressure for the orifice flow
T characteristic time
u local flow velocity
U ideal orifice flow velocity
V mass weighted average velocity
VHR velocity head ratio
VP velocity pick-up
x x-coordinate in right-hand reference frame
y y-coordinate in right-hand reference frame
ρ density
ω rotating speed
p∆ static pressure difference across orifice
Subscripts
abs parameters in the absolute frame

21
c parameters in the cross flow direction
D expresses the characteristic flow parameter across the orifice
i parameters at the inlet of orifice
L expresses the characteristic flow parameter pass through the orifice
n parameters in the orifice axial direction
o parameters at the outlet of orifice
rel parameters in a relative reference frame which fixed with the orifice
t parameters in the tangential direction
T parameters based on total pressure

22

23
1 2 5 10 20 30 400.0
0.1
0.2
0.3
0.4
0.5
0.6
0.7
L/D=0.32 Dittrich, 1956 L/D=0.51 Rohde, 1969 L/D=0.3 L/D=0.5 McGreehan,1988 L/D=0.3 L/D=0.5 Da Soghe,2012 L/D=0.3 L/D=0.5 Experiment, Glover L/D=0.3 L/D=0.5 Simulation, authors
VHR=(pT-pjs)/(pT-pds)
Cd
24
0.0 0.1 0.2 0.30.4
0.5
0.6
0.7
0.8
L/D=1.4, McGreehan,1988 L/D=1.4, Idres, 2004; L/D=1.4, Simulation, authors
Vrel,c/Urel,n
Cd

25

26

27
28

29
30