Embed Size (px)
Citation preview
Turbidity Monitoring Plan
VELCO PV-20 Cable Replacement Project
Grand Isle, Vermont
Prepared for VELCO 366 Pinnacle Ridge Road Rutland, VT 05701 Prepared by VHB
40 IDX Drive, Building 100 Suite 200 South Burlington, VT 05403
April 14, 2016
i VELCO PV-20 Turbidity Monitoring Plan
Table of Contents Table of Contents ................................................................................................................................................ i
1.0 Purpose and Background........................................................................................................................ 1
1.1 Study Purpose and Objectives .................................................................................................................................... 2 1.2 Project Organization ....................................................................................................................................................... 3
1.2.1 VELCO and Qualified Consultant ................................................................................................................. 3 1.2.2 Fondriest Environmental (or similar company) ........................................................................................... 4
1.3 Documents and Records ............................................................................................................................................... 4 2.0 Monitoring Plan ....................................................................................................................................... 4
2.1 Monitoring Locations ..................................................................................................................................................... 4 2.2 Monitoring Methods and Equipment ...................................................................................................................... 7 2.3 Visual Monitoring ............................................................................................................................................................ 8
3.0 Regulatory Compliance ................................................................................................................................ 8
3.1 Vermont Water Quality Standards ............................................................................................................................ 8 3.2 Background Turbidity Levels - Deep Intake .......................................................................................................... 9 3.3 Proposed Action Levels ............................................................................................................................................... 10
4.0 Quality Control ...................................................................................................................................... 11
4.1 Instrument/Equipment Testing, Inspection, Maintenance, and Calibration ........................................... 11 4.2 Data Management ......................................................................................................................................................... 11 4.3 Assessment and Oversight ......................................................................................................................................... 12
5.0 Data Validation and Usability ................................................................................................................ 12
5.1 Data Review, Verification, and Validation .................................................................................................... 12 5.2 Verification and Validation Methods ............................................................................................................. 12
6.0 Reporting ............................................................................................................................................... 12
7.0 Summary ............................................................................................................................................... 13
References ....................................................................................................................................................... 14

1 VELCO PV-20 Turbidity Monitoring Plan
1.0 Purpose and Background
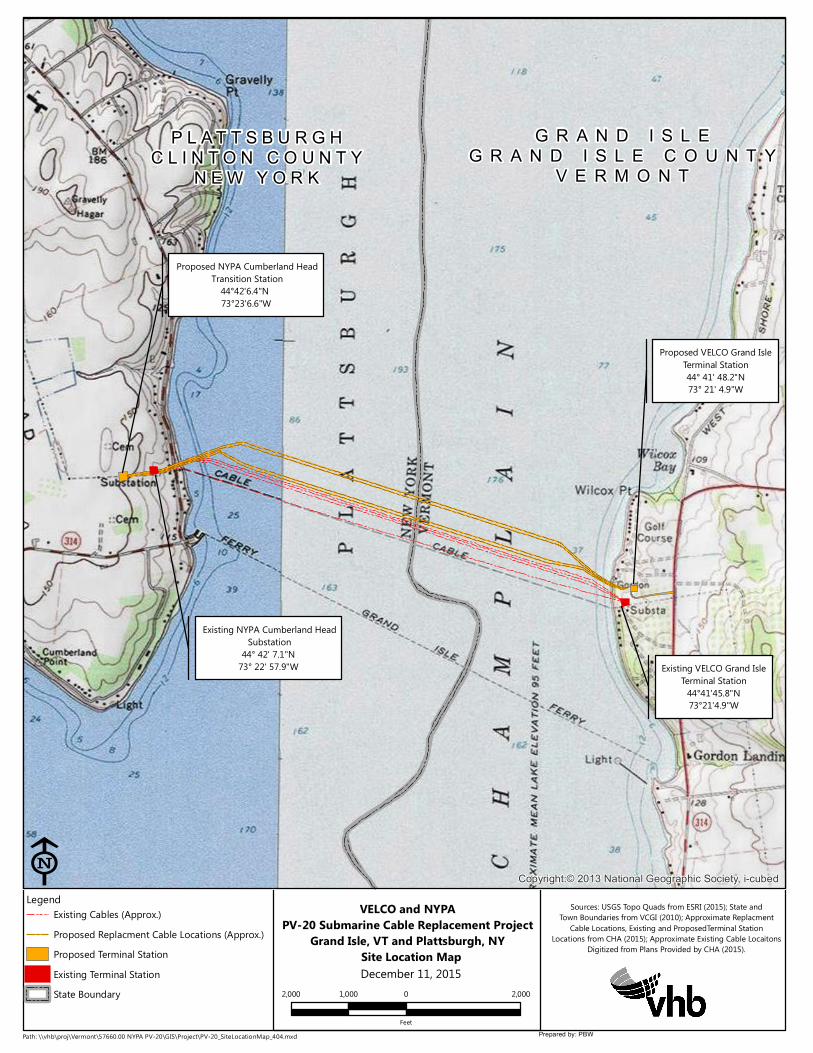
On behalf of Vermont Transco LLC and Vermont Electric Power Company Inc. (hereinafter collectively referred to as “VELCO”), VHB has prepared this Turbidity Monitoring Plan (“TMP”) for turbidity monitoring during select in-Lake construction activities for the proposed PV-20 Cable Replacement Project (“Project”). The Project proposes to replace a segment of the existing 115 kV K20 circuit that extends west-to-east between the New York Power Authority (“NYPA”) Cumberland Head Substation in Plattsburgh, New York and VELCO’s Grand Isle terminal station in Grand Isle, Vermont (refer to the Site Location Map on page 1 of the Attachment). This segment of the existing circuit currently consists of six oil-filled electrical transmission cables still in operation and one abandoned cable that failed in 1969. These seven cables are buried along the land portions and within the shallows of Lake Champlain (the “Lake”) and directly laid along the bottom in the deeper portions of the Lake. The Project involves the installation of four new, extruded dielectric (oil-free) submarine cables within an approximate 500-foot-wide corridor starting approximately 30 feet north of the northernmost existing cable and extending northward within the Lake. Cable installation methods starting from the east at the terminal station to the west at the Vermont/New York state line within the Lake will include open trenching, horizontal directional drilling (“HDD”), jet sledding, and direct laying. The cable installations will occur one at a time, with an anticipated jet sled duration of approximately 2 hours per cable. Although installation work within the Lake is scheduled to occur between June 1 and October 1 of the construction year (with the exception of horizontal direction drill activities), it is currently anticipated that all four cables will be installed over a period of 16 non-consecutive days. This means that there will be a period of time between installations in the Vermont side of the Lake, allowing resuspended sediment to settle prior to the installation of the next cable in the same area of the Lake. Thus, turbidity increases in the water column are not anticipated to accumulate as a result of subsequent installations. In addition, the anticipated monitoring period will be approximately 16 days, more or less, depending on prevailing conditions that affect the speed of installation. VELCO intends to also monitor background conditions for up to two weeks prior to start of the in-lake installation activities. Once the new cables are installed, tested, and commissioned into service, the seven existing oil-filled cables will be removed, one at a time. Prior to removal of the existing cables, the free-phase oil will be drained and purged with water, air or another innocuous material, to remove oil from within the cables. The land portions of the cables will be removed via open trench methods. Within shallow portions of the Lake (less than 20 feet water depth), the cables were placed under a layer of rip-rap that will likely require mechanical removal methods. The rip-rap will be side cast or placed on a barge deck and replaced once the cable is retrieved. Within deeper portions of the Lake, the cable would be removed utilizing a barge and hoisting system which will lift the cable off the lake bottom onto the barge deck for disposal or recycling. After the rip-rap is removed and the route has been confirmed clear, actual removal of the cables via barge and hoist is anticipated to take 1 day per cable, with removal of all cables completed over a period of 24 days. The 24

2 VELCO PV-20 Turbidity Monitoring Plan
days could be non-consecutive depending on unanticipated delays, challenges, etc. The removal work period will take place between June 1 and September 30 of the construction season to allow for mobilization, preparation, cable purging, potential problem solving, and demobilization. Therefore, it is anticipated that the actual turbidity monitoring period will be consistent with actual removal activity duration, and VELCO intends to monitor background conditions for up to two weeks prior to start of the removal activities. The turbidity monitoring presented herein is proposed to take place during Project activities in the Vermont side of the Lake that are expected to result in the short term resuspension of sediment and thus a short term increase in total suspended solids (“TSS”) within the Lake, specifically during cable installation via jet sledding and cable removal activities. Previous modeling and research completed for the proposed Project (VHB, 2015) indicates that the majority of resuspended sediment would extend no more than 200 feet from the work area, would settle within four hours of cable installation via jet sledding, and would not prevent the full support of uses of the Lake, described below in Section 3.1. Installation via HDD and direct lay will result in minimal, disturbance of Lake bottom sediments. Based on available data the existing cables are believed to be covered in varying amounts of sediment. The evidence suggests that the cables are covered with a “dusting” up to 4 feet of lakebed sediments. The proposed removal activities are anticipated to result in minor resuspension of lakebed sediments; however given the nature of the work it is not anticipated to exceed the modeling results associated with the jet sled installation. For the PV-20 Project, VELCO is proposing to monitor turbidity because TSS needs to be analyzed by a laboratory in which results are not available for a minimum of 24 hours. Given the short duration of each cable’s installation via jet sledding and each cable removal for the PV-20 Project, measuring TSS as a means of assessing the Project’s real time impact is not appropriate. Rather, VELCO proposes to monitor turbidity, which can be measured in real-time with an in-situ sensor (as described herein) to monitor the Project’s impact to water quality.
1.1 Study Purpose and Objectives
Although modeling results indicate that the PV-20 Project installation and removal will comply with the Vermont Water Quality Standards (“VWQS”, 2014) for TSS and other water quality parameters (VHB, 2015; HDR, 2014), this turbidity monitoring plan (“TMP”) has been established for verification by monitoring real time conditions during construction activities, and to establish water quality action thresholds for the maintenance of VWQS criteria. Further, the TMP has been designed with specific consideration of the Grand Isle Consolidated Water District’s (“GICWD’s”) deep water intake (“Deep Intake”), which is located 3,900 feet to the south of the Project corridor and used to supply water to the VT Fish and Wildlife Department’s (“FWD’s”) Ed Weed Fish Hatchery (“Fish Hatchery”) as well as to supply potable water to the GICWD. The Fish Hatchery is sensitive to the amount of turbidity in the water, and although water quality impacts are not expected to be measureable at this distance from the Project, this Plan incorporates turbidity monitoring locations between the Project corridor and the Deep Intake to provide an extra measure of assurance. The TMP has also been designed with consideration of the GICWD Shallow Intake, which is also used to supply potable municipal water.

3 VELCO PV-20 Turbidity Monitoring Plan
The data quality objectives for the project are to quantitatively and qualitatively monitor turbidity concentrations within Lake Champlain during new cable installation via jet sledding and the existing cable removal activities. To ensure that the data quality objectives are met, all sampling will occur in accordance with the specifications presented in this TMP.
1.2 Project Organization
The monitoring plan will consist of the following components: Real-time in-situ turbidity monitoring approximately 2 weeks prior to and during jet sled
installation activities in the Vermont side of the Lake (approximately 14 days of pre-construction monitoring and 16 days of construction monitoring, depending on prevailing conditions)
Real-time in-situ turbidity monitoring approximately 2 weeks prior to and during cable removal activities in the Vermont side of the Lake (approximately 14 days of pre-construction monitoring and 24 days of construction monitoring, depending on prevailing conditions)
Visual water surface monitoring during all in-Lake construction activities in the Vermont side of the Lake, including HDD and direct lay.
General TMP coordination is being performed by VELCO and VELCO’s qualified consultant (Project’s Compliance Team). Monitoring equipment will be supplied by Fondriest Environmental (or similar company). Access and navigation will be coordinated by VELCO and its contractor in consultation with the US Army Corps of Engineers and the US Coast Guard. The roles and responsibilities associated with the equipment supplier and the Compliance Team are summarized below.
1.2.1 VELCO and Qualified Consultant VELCO and its qualified consultant will be responsible for the following:
overall project coordination, oversight, and assessment field equipment deployment, calibration, and collection field analysis and assessment sampling quality control data processing, data processing quality control, data quality review, and data
evaluation (if applicable) submit monitoring reports to the Vermont Department of Environmental
Conservation (“VT DEC”) as described in Section 6.0
Technical Project Manager: VELCO, Timothy Follensbee II, Environmental Manager, 802-770-6423 Quality Assurance Personnel: Qualified Consultant or VELCO Personnel, to be determined (“TBD”) Field Operations Manager: Qualified Consultant or VELCO Personnel, TBD

4 VELCO PV-20 Turbidity Monitoring Plan
1.2.2 Fondriest Environmental (or similar company)
Fondriest Environmental (or similar company) will be responsible for the following: Equipment factory calibration Real-time communication set up Web data center host Equipment support and troubleshooting
1.3 Documents and Records
Field data and records of calibration of field equipment provided by VELCO’s Qualified Consultant will be digitally scanned from the field notebook(s) and stored in the electronic project file. Digital photographs collected from the Project’s Monitoring Team will also be stored in the electronic project file. All turbidity measurements collected in real-time will be available to the Project’s Monitoring Team in an on-line web center. During active construction, the Project’s Compliance Team will actively monitor the turbidity data and all data will be downloaded for backup on a weekly basis. Work completed will be recorded by the construction crew and relayed to the Project’s Compliance Team daily. The Project’s Compliance Team will be responsible for recording daily visual observations. Observations will be reported to the Project’s Compliance Team more frequently if either visual or turbidity sensor monitoring indicates a potential issue. All project files will be maintained for a minimum of three years.
2.0 Monitoring Plan
In general, real-time, in-situ turbidity monitoring will be conducted during jet sledding cable installation and during cable removal activities within the Vermont side of the Lake. Data buoys with turbidity sensors and data loggers will be installed in the water to the north and south of the Project corridor in order to continuously monitor turbidity conditions up-current and down-current of the Project. Current meters/profilers will also be installed on two of the buoys to monitor flow direction for determining up-current and down-current locations.
Buoys and instruments will be installed up to two weeks prior to the anticipated date of jet sledding and cable removal. Turbidity sensors and current meters (select buoys) will be secured approximately 15 feet off the Lake bottom. Data will be evaluated to assess natural turbidity levels and fluctuations prior to construction activities.
2.1 Monitoring Locations
Installation: During jet sled installation, data buoys will be installed with the goal of monitoring turbidity conditions that may affect general water quality and the Deep Intake. During cable
5 VELCO PV-20 Turbidity Monitoring Plan
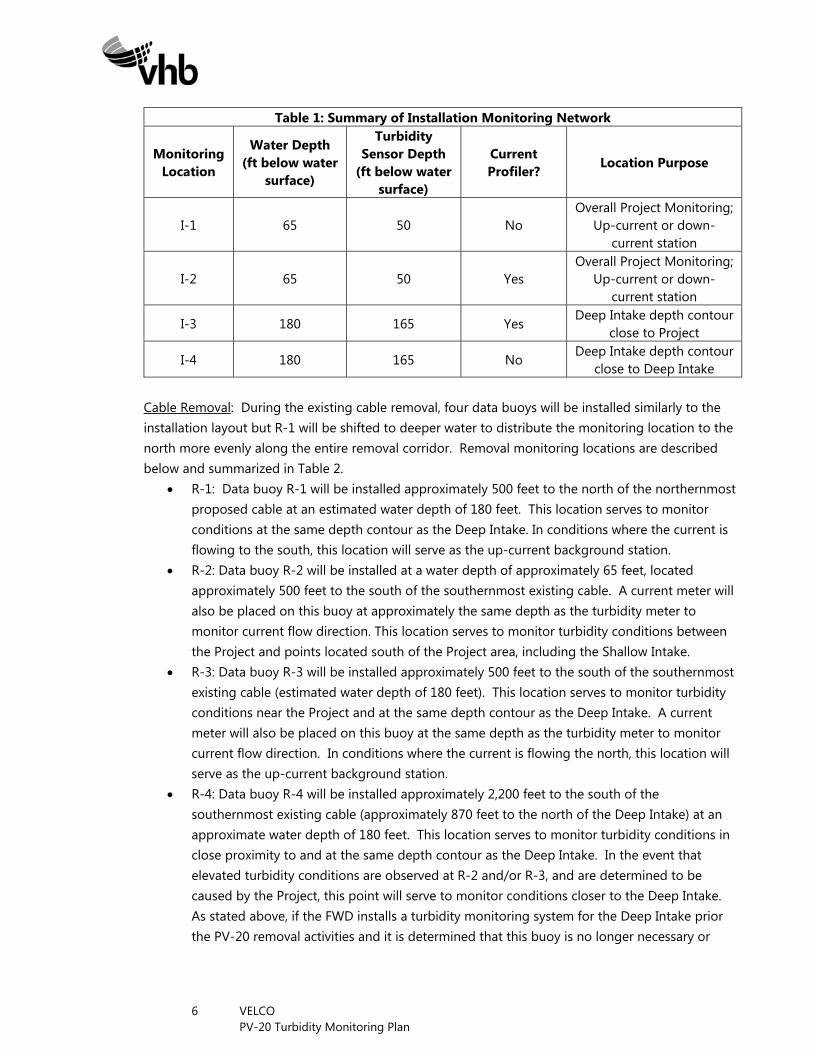
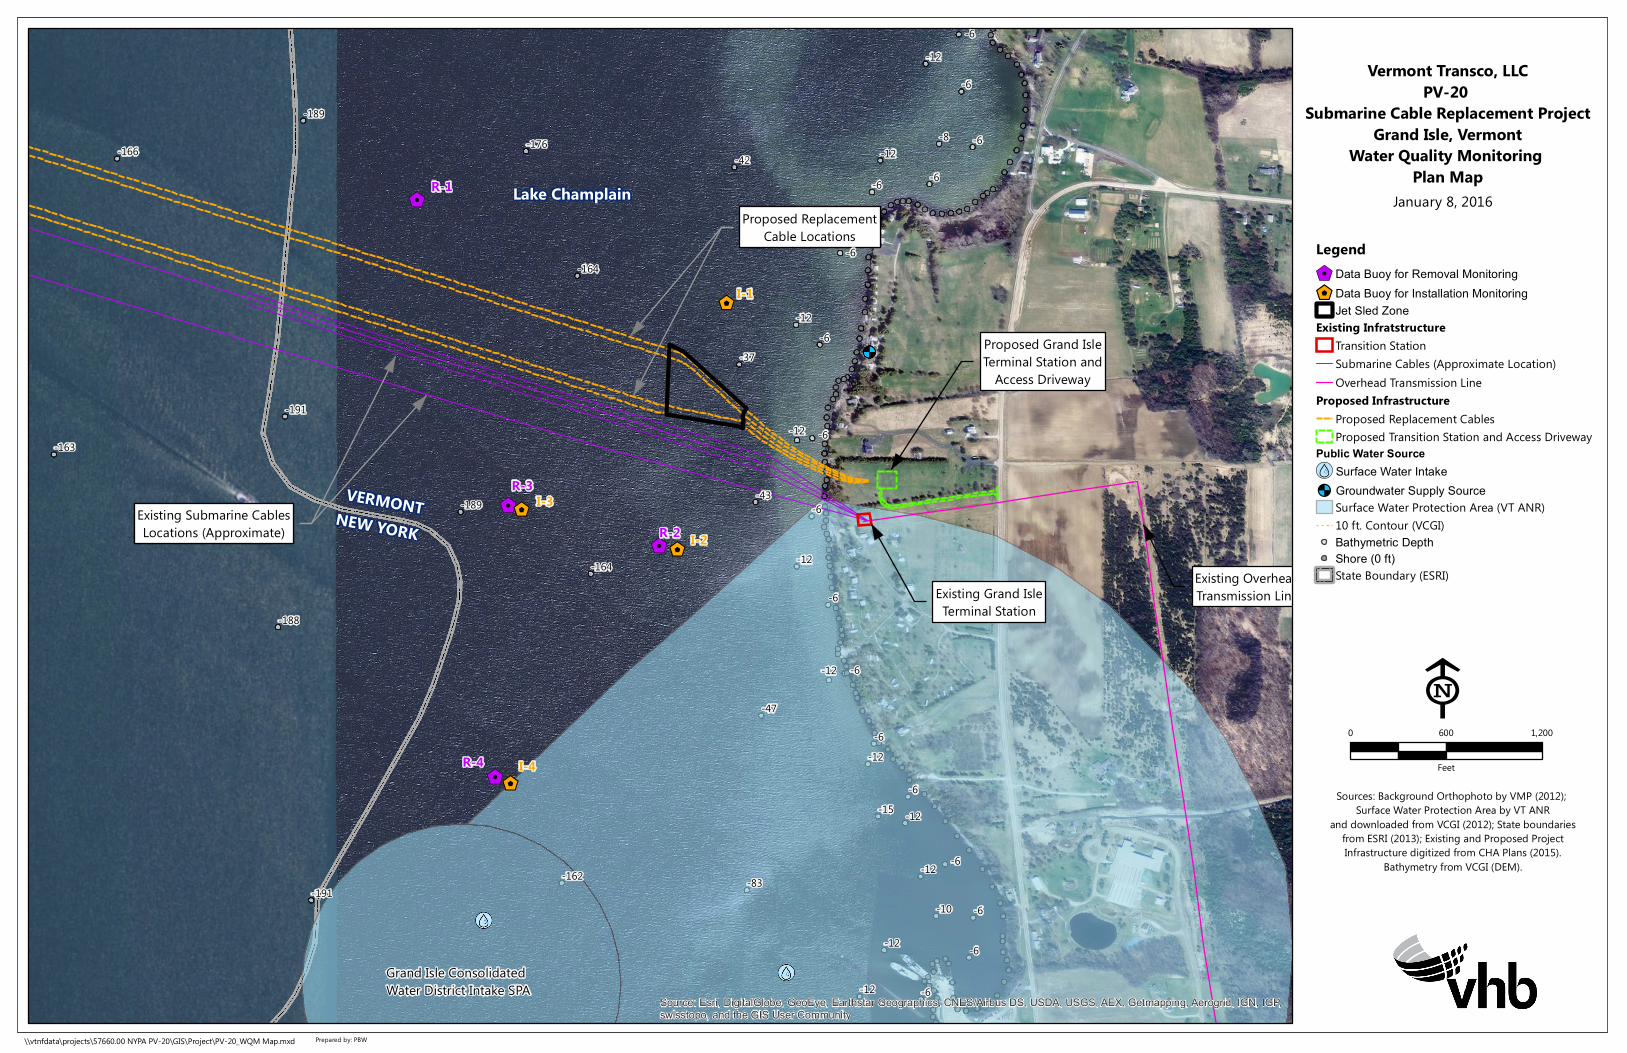
installation, the greatest sediment disturbance will be during installation of the cables via jet sled, therefore the installation monitoring network has been designed accordingly, as follows (refer to the Turbidity monitoring plan Map for visual representation of the buoy locations and Table 1 for a summary of the locations):
I-1: Data buoy I-1 will be installed approximately 500 feet to the north of the northernmost proposed cable, laterally located in the approximate center of the jet sled area (estimated water depth of 65 feet). In conditions where the current is flowing to the south, this location will serve as the up-current/ background station.
I-2: Data buoy I-2 will be installed approximately 500 feet to the south of the southernmost existing cable, laterally located in the approximate center of the jet sled area (estimated water depth of 65 feet). A current meter will be placed on this buoy at the approximate same depth as the turbidity meter to monitor current flow direction. In conditions where the current is flowing the north, this location will serve as the up-current background station. This location also serves to monitor conditions between the project and points located south of the Project area, including, the Shallow Intake.
I-3: Data buoy I-3 will be installed in a water depth of approximately 180 feet, located approximately 500 feet to the south of the southernmost existing cable. A current meter will also be placed on this buoy to monitor current flow direction at this depth. This location serves to monitor turbidity conditions near the Project at the same depth contour as the Deep Intake.
I-4: Data buoy I-4 will be installed approximately 2,200 feet to the south of the southernmost existing cable (approximately 870 feet to the north of the Deep Intake) at an approximate water depth of 180 feet. This location serves to monitor turbidity conditions in close proximity to and along the depth contour of the Deep Intake. In the event that elevated turbidity conditions are observed at I-2 and/or I-3, and are determined to be caused by the Project, this point will serve to monitor conditions closer to the Deep Intake. Based on discussions with the Agency of Natural Resources (“ANR”), it possible that the VT Fish and Wildlife Department (“FWD”) may install a turbidity monitoring system to monitor water from the Deep Intake prior to the filtration system. If this is accomplished prior to the initiation of in Lake work for the PV-20 Project, VELCO will work with the ANR representatives and determine if buoy I-4 remains necessary or warranted, given the real-time monitoring within the Ed Weed Fish Culture facility. If it is determined that buoy I-4 is no longer necessary or warranted, then this buoy may be eliminated from the monitoring plan and data from this general location would be supplemented with the data collected from the FWD’s turbidity monitoring of water from the Deep Intake.
6 VELCO PV-20 Turbidity Monitoring Plan
Table 1: Summary of Installation Monitoring Network
Monitoring Location
Water Depth (ft below water
surface)
Turbidity Sensor Depth
(ft below water surface)
Current Profiler?
Location Purpose
I-1 65 50 No Overall Project Monitoring;
Up-current or down-current station
I-2 65 50 Yes Overall Project Monitoring;
Up-current or down-current station
I-3 180 165 Yes Deep Intake depth contour
close to Project
I-4 180 165 No Deep Intake depth contour
close to Deep Intake
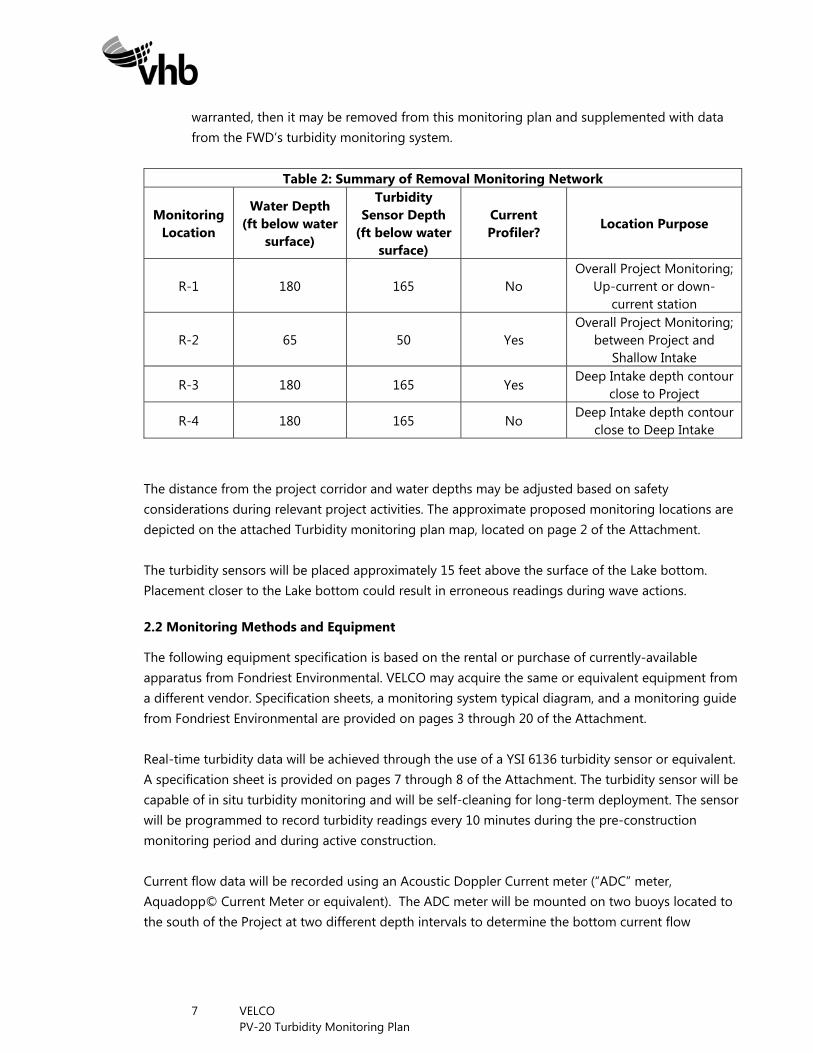
Cable Removal: During the existing cable removal, four data buoys will be installed similarly to the installation layout but R-1 will be shifted to deeper water to distribute the monitoring location to the north more evenly along the entire removal corridor. Removal monitoring locations are described below and summarized in Table 2.
R-1: Data buoy R-1 will be installed approximately 500 feet to the north of the northernmost proposed cable at an estimated water depth of 180 feet. This location serves to monitor conditions at the same depth contour as the Deep Intake. In conditions where the current is flowing to the south, this location will serve as the up-current background station.
R-2: Data buoy R-2 will be installed at a water depth of approximately 65 feet, located approximately 500 feet to the south of the southernmost existing cable. A current meter will also be placed on this buoy at approximately the same depth as the turbidity meter to monitor current flow direction. This location serves to monitor turbidity conditions between the Project and points located south of the Project area, including the Shallow Intake.
R-3: Data buoy R-3 will be installed approximately 500 feet to the south of the southernmost existing cable (estimated water depth of 180 feet). This location serves to monitor turbidity conditions near the Project and at the same depth contour as the Deep Intake. A current meter will also be placed on this buoy at the same depth as the turbidity meter to monitor current flow direction. In conditions where the current is flowing the north, this location will serve as the up-current background station.
R-4: Data buoy R-4 will be installed approximately 2,200 feet to the south of the southernmost existing cable (approximately 870 feet to the north of the Deep Intake) at an approximate water depth of 180 feet. This location serves to monitor turbidity conditions in close proximity to and at the same depth contour as the Deep Intake. In the event that elevated turbidity conditions are observed at R-2 and/or R-3, and are determined to be caused by the Project, this point will serve to monitor conditions closer to the Deep Intake. As stated above, if the FWD installs a turbidity monitoring system for the Deep Intake prior the PV-20 removal activities and it is determined that this buoy is no longer necessary or
7 VELCO PV-20 Turbidity Monitoring Plan
warranted, then it may be removed from this monitoring plan and supplemented with data from the FWD’s turbidity monitoring system.
Table 2: Summary of Removal Monitoring Network
Monitoring Location
Water Depth (ft below water
surface)
Turbidity Sensor Depth
(ft below water surface)
Current Profiler?
Location Purpose
R-1 180 165 No Overall Project Monitoring;
Up-current or down-current station
R-2 65 50 Yes Overall Project Monitoring;
between Project and Shallow Intake
R-3 180 165 Yes Deep Intake depth contour
close to Project
R-4 180 165 No Deep Intake depth contour
close to Deep Intake The distance from the project corridor and water depths may be adjusted based on safety considerations during relevant project activities. The approximate proposed monitoring locations are depicted on the attached Turbidity monitoring plan map, located on page 2 of the Attachment. The turbidity sensors will be placed approximately 15 feet above the surface of the Lake bottom. Placement closer to the Lake bottom could result in erroneous readings during wave actions.
2.2 Monitoring Methods and Equipment
The following equipment specification is based on the rental or purchase of currently-available apparatus from Fondriest Environmental. VELCO may acquire the same or equivalent equipment from a different vendor. Specification sheets, a monitoring system typical diagram, and a monitoring guide from Fondriest Environmental are provided on pages 3 through 20 of the Attachment. Real-time turbidity data will be achieved through the use of a YSI 6136 turbidity sensor or equivalent. A specification sheet is provided on pages 7 through 8 of the Attachment. The turbidity sensor will be capable of in situ turbidity monitoring and will be self-cleaning for long-term deployment. The sensor will be programmed to record turbidity readings every 10 minutes during the pre-construction monitoring period and during active construction. Current flow data will be recorded using an Acoustic Doppler Current meter (“ADC” meter, Aquadopp© Current Meter or equivalent). The ADC meter will be mounted on two buoys located to the south of the Project at two different depth intervals to determine the bottom current flow
8 VELCO PV-20 Turbidity Monitoring Plan
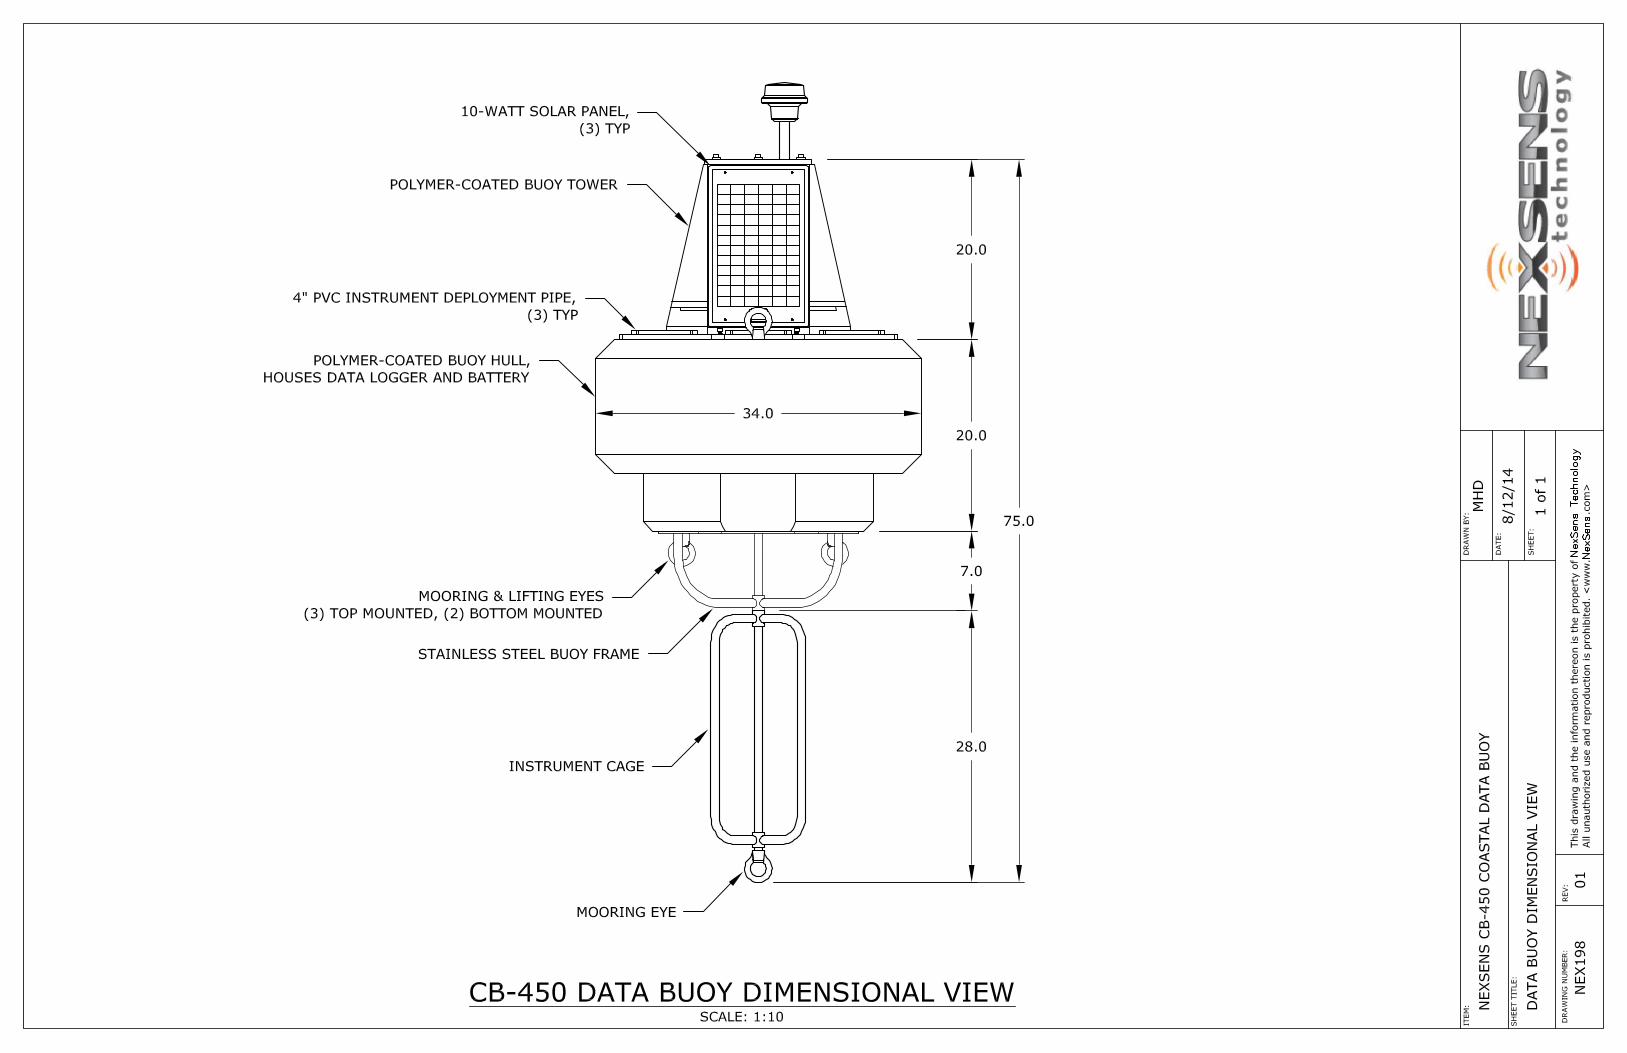
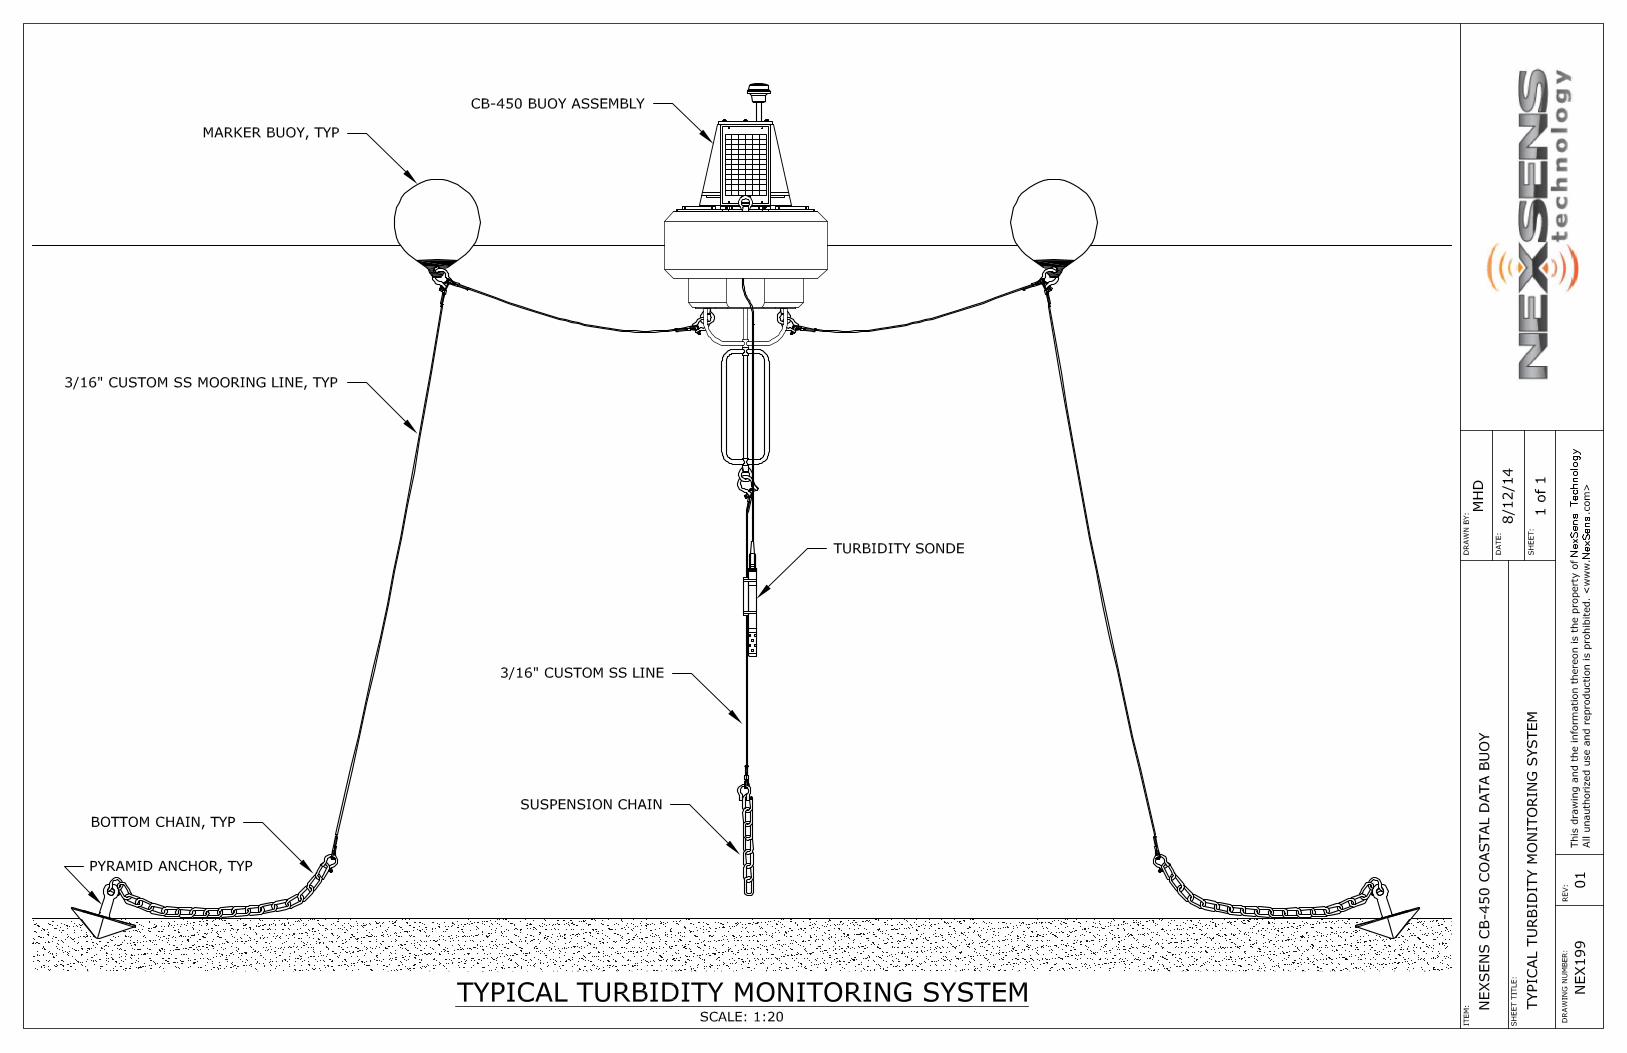
direction across the Project Corridor, as well as at different depth contours. Readings will be collected every 10 minutes and transferred remotely similarly to the turbidity data. A data buoy will be used to suspend the turbidity sensors and ACD meters approximately 15 feet above the surface of the lakebed (refer to the Data Buoy Dimensional View, page 3 of the Attachment). The suspension cable will be weighted but not anchored so as to prevent sediment disturbance within the vicinity of the sample location. The data buoy will be secured by two anchor lines with marker buoys to separate the data cable from the anchor lines (refer to the Typical Turbidity Monitoring System diagram, page 4 of the Attachment).
2.3 Visual Monitoring
VELCO and its qualified contractor/consultant will visually monitor water surface conditions within the Project corridor and vicinity during all in-Lake construction activities, including HDD and direct lay, for the presence of potential turbidity issues. Visual observations will be recorded if visibly discolored water is observed by the compliance monitor, either from Project activities or elsewhere, or if turbidity levels at the buoy monitoring locations indicate a potential issue. If visibly discolored water is identified, observations will be recorded based on initial identification and any subsequent turbidity changes during Project activities. In the event significantly discolored water is observed, the monitor may take individual turbidity monitoring samples at the surface or other depths to determine the levels and extent of the turbidity, if warranted, and will record all such data. These observations will be recorded regularly (at least daily) during active Project in-Lake construction, and will be used to supplement or confirm the quantitative real-time data from the buoy mounted monitors (for jet sledding and cable removal).
3.0 Regulatory Compliance
This section includes a discussion of applicable regulatory guidance, the establishment of turbidity level action thresholds, and VELCO’s response procedures if the action thresholds are observed during in-Lake construction. As previously described, VELCO intends to monitor turbidity during in-Lake construction activities rather than TSS due to the short duration of the proposed Project activities and the time delay associated with collecting and obtaining TSS results. Because the VWQS do not stipulate specific, quantitative turbidity values for such Projects (as discussed below in Section 3.1), VELCO proposes to work with DEC and the FWD to develop acceptable turbidity thresholds for the Project in context of the VWQSs, and specifically, for the protection of the Fish Hatchery. VELCO will coordinate communication with DEC, FWD, GICWD, and other applicable agencies during in-Lake activities.
3.1 Vermont Water Quality Standards
In order to comply with the Project’s anticipated Lake Encroachment Permit and §401 Water Quality Certification, VELCO must demonstrate that the Project will comply with the VWQS, and that the
9 VELCO PV-20 Turbidity Monitoring Plan
Project will not prevent the full support of uses of the Lake. The VWQS designate the uses of the Lake as follows:
1. Aquatic Biota, Wildlife, and Aquatic Habitat - aquatic biota and wildlife sustained by high quality aquatic habitat with additional protection in those waters where these uses were sustainable at a higher level based on Water Management Type designation.
2. Aesthetics - water character, flows, water level, bed and channel characteristics, exhibiting good aesthetic value and, where attainable, excellent aesthetic value based on Water Management Type designation.
3. Public water supply - Suitable for use as a source for a public water supply with filtration and disinfection.
4. Irrigation of crops and other agricultural uses - suitable, without treatment, for irrigation of crops used for human consumption without cooking and suitable for other agricultural uses.
5. Swimming and other primary contact recreation - suitable for swimming and other forms of water based recreation where sustained direct contact with the water occurs and, where attainable, suitable for these uses at very low risk of illness based on Water Management Type designation.
6. Boating, fishing and other recreational uses - Suitable for these uses with additional protection in those waters where these uses are sustainable at a higher level based on Water Management Type designation.
Additionally, the VWQS (2014) stipulate that for Class B Warm Water Fish Habitat waters (as this section of the Lake is), turbidity shall be “none in such amounts or concentrations that would prevent the full support of uses, and not to exceed 25 NTU (nepholometric turbidity units) as an annual average under dry weather base-flow conditions.” Since a portion of the Project is located in close proximity to the source protection area associated with the GICWD water supply intakes, the turbidity standard for the management of Class A(2) Public Water Supplies has also been considered, which is defined as follows: “none in such amounts or concentrations that would prevent the full support of uses, and not to exceed 10 NTU (nepholometric turbidity units) as an annual average under dry weather base-flow conditions.” Note that these standards are based on annual averages and during dry weather base flow conditions, making these absolute values inappropriate for use in establishing action thresholds. Further, the VWQS establish the TSS standard for these waters as “none in such concentrations or combinations that would prevent the full support of uses.”
3.2 Background Turbidity Levels - Deep Intake
VHB reviewed turbidity data reported on the Vermont Monthly Water System Operations Report for the GICWD (WSID #20614)1 from June 2015 through September 2015 (representative timeframe for in-Lake work). Based on this dataset, the average turbidity at the deep water intake is 2.4, with a range
1 The reports do not indicate which intake the results are from, but DEC staff indicated the reports provided are for the deep intake based on temperature data.
10 VELCO PV-20 Turbidity Monitoring Plan
from 0.4 to 9.1. These values do not represent an action threshold, but rather provide an indication of the background range of turbidity variation at the 180-foot depth for one specific 3 month period.
3.3 Proposed Action Levels
Given that the FWD currently does not have historical data related to turbidity and/or its impacts on the Ed Weed Fish Culture Station’s filtration system, VELCO proposes to work with DEC and FWD to establish turbidity thresholds which would trigger the need to evaluate and/or alter the Project activities. VELCO proposes the following trigger thresholds, with numerical values to be developed in consultation with DEC and FWD:
Level 1: A certain value, in NTU, above background (up-current location) at a down-current monitoring location located within 500 feet from the Project corridor (dependent upon current flow). The Level 1 trigger would alert the Project team that elevated turbidity levels may be more widespread than predicted by the model, and Level 1 response would be initiated (described below).
Level 2: A certain value, in NTU, above the background (up-current location) at the monitoring location closest to (or at) the Deep Intake, but only if currents are shown to be flowing from the Project Area to the Deep Intake. The Level 2 trigger, which would presumably be reached after Level 1, would alert the Project Team that elevated turbidity levels caused by the Project could reach the Deep Intake, and Level 2 response would be initiated.
Level 3: The ultimate threshold, in NTU, determined likely to overwhelm the Ed Weed Fish Culture Station filtration system, regardless of background levels, is observed at southernmost monitoring location (I-4 or R-4, or at the FWD Station). This threshold would only apply if it is determined that the Project is causing the elevated turbidity conditions, which will be determined based on current flow direction and monitoring data closer to the Project.
If these action levels are observed during the active in-Lake Project construction (jet sledding or cable removal) VELCO will initiate Level 1, 2, and 3 response procedures as indicated above and described as follows:
1. Level 1 - Initial Response: VELCO will obtain a collection of manual measurements near the buoys to confirm the results or to determine if sensor calibration is needed. If turbidity levels are verified, VELCO will determine if the Project is causing the elevated turbidity conditions, based on current flow direction and monitoring data closer to the Project; for example, if the current is flowing south and down-current locations closer to the Project indicate relatively higher turbidity levels compared to up-current locations. The compliance monitor will make the decision based on their professional judgment, whether Level 2 response should be initiated, based on the following:
a. If the manual measurements indicate there is no turbidity problem resulting from the Project, the compliance monitor will correct the issue, and collect manual measurements to confirm the issue has been resolved. No further action is required.
11 VELCO PV-20 Turbidity Monitoring Plan
b. If the manual measurements indicate a potential problem, the compliance monitor will track the plume in the direction of the current, and initiate Level 2 response if necessary.
2. Level 2 – Notification: If manual measurements confirm the action levels have been reached at the southernmost monitoring location, VELCO will implement Level 2 response by notifying the DEC and other applicable agencies of the turbidity levels and extent. VELCO will concurrently discuss with the contractor and implement changes to the installation or removal methods, such as reducing the water pressure of the jets or altering the speed of jet sled or cable removal. Provided the ultimate threshold determined likely to overwhelm the Ed Weed Fish Culture Station filtration system is not reached at the Deep Intake monitoring location, VELCO may proceed with installation or removal activities, provided VELCO and their contractors are implementing corrective actions to limit water quality impacts and continue to monitor the situation for subsequent changes. VELCO would require the contractor to implement potential corrective actions as soon as feasible, however given the relatively short period of time for each cable installation and/or removal, VELCO assumes that any permanent adjustments to the work activities would need to be made on the subsequent installation or cable removal efforts.
3. Level 3 – Project Evaluation/Agency Coordination: If it is determined that project
modifications do not resolve the turbidity issues and the Deep Intake is in threat of being overwhelmed as a result of the Project, VELCO would work with FWD, DEC and the Project contractors to evaluate all options and implement corrective actions to limit impacts to water quality and the intake.
4.0 Quality Control
4.1 Instrument/Equipment Testing, Inspection, Maintenance, and Calibration
Self-wiping, logging optical turbidity sondes (YSI 600 OMS) will be used for field measurements of the in-situ turbidity levels. Maintenance, testing, and calibration of the sensors will be performed by the manufacturer prior to shipment, and by the monitoring team prior to deployment in accordance with manufacturer’s specifications as presented in the operations manual for the instrument. The instrument will have a range of 0 to 1,000 NTU with a resolution of 0.1 NTU and accuracy of 2% of the reading. A specification sheet is included on pages 7 and 8 of the Attachment.
4.2 Data Management
Water quality data will be managed by VELCO’s qualified personnel or consultant. Field data will be collected remotely, downloaded, and stored in the electronic project file at least weekly, and more
12 VELCO PV-20 Turbidity Monitoring Plan
frequently during sediment resuspension activities. All data will be entered into a Microsoft® Excel spreadsheet maintained for the project. Within the spreadsheet, one page will be dedicated to each specific sampling location.
4.3 Assessment and Oversight
It is not anticipated that an intensive assessment and oversight program will be necessary to achieve the required data quality and goals of this project. However, at the discretion of VELCO or their qualified consultant, field sampling instrumentation, data quality, and project management systems could be reviewed at any time during the monitoring program. Any reviews will help ensure that the data collection and analysis methods presented in this Turbidity Monitoring Plan resulted in the collection of water quality data necessary to achieve the goals of the project.
5.0 Data Validation and Usability
5.1 Data Review, Verification, and Validation
Upon inspection of the field-collected data, the data will be accepted for the monitoring program unless there is a noted occurrence of field instrumentation malfunction. These conditions will be clearly noted within field data collection notes and reports submitted to ANR (refer to Section 6.0 for Reporting requirements).
5.2 Verification and Validation Methods
A specification sheet of the turbidity sensor is attached (pages 7 and 8) which describes the accuracy and validation of the instrument.
6.0 Reporting
As stated in Section 3.0, if data indicates that the established Level 2 turbidity threshold is reached, then VELCO will verbally notify the ANR within 24 hours of the Level 2 occurrence. A written report with applicable data will be provided within one week of the initial detection. Final summary reports and all data will be submitted within 90 days of completion of the jet sled installation and within 90 days of the completion of cable removal.
13 VELCO PV-20 Turbidity Monitoring Plan
7.0 Summary
VELCO proposes to conduct turbidity monitoring during in-Lake Project activities (Vermont side of the Lake), specifically cable installation via jet sledding and cable removal, that are expected to result in the short term resuspension of sediment and thus a short term increase in TSS (and resultantly turbidity) within the Lake. The monitoring plan has been designed to monitor the Project’s overall turbidity impact and specific monitoring is proposed to ensure the Project does not result in adverse effects to the GICWD intakes, specifically the Deep Intake, which also serves the Ed Weed Fish Culture Station. Refer to Tables 1 and 2 in Section 2.1 for Table summaries of the monitoring network. VELCO proposes to work with DEC and FWD to establish turbidity thresholds which would trigger the need to evaluate or alter the Project’s activities. VELCO proposes two thresholds, with numerical values to be agreed upon as described in section 3.3 above. If these action levels are observed during the active in-Lake Project construction (jet sledding or cable removal) and are verified to be a result of the Project activities, than VELCO will initiate Level 1, 2, and 3 response procedures as outlined above in section 3.3. In conclusion, by implementing this proposed TMP, VELCO will demonstrate the Project’s compliance with the VWQSs and will provide adequate protection for the Grand Isle Consolidated Water District Intakes and Ed Weed Fish Culture Station.
14 VELCO PV-20 Turbidity Monitoring Plan
References
HDR, 2014. Lake Champlain Water Quality Monitoring Report. New England Clean Power Link. December 2014. Exh. TDI-AT-2 of PSB Docket 8400.
Vermont Agency Of Natural Resources, Department of Environmental Conservation, 2014. “Vermont
Water Quality Standards, Environmental Protection Rule Chapter 29(a).” Effective October 30, 2014.
VHB, 2015. VELCO PV-20 Lake Champlain Crossing Water Quality Assessment Memorandum. July 13,
2015. \\vtnfdata\projects\57660.00 NYPA PV-20\reports\Water Quality Monitoring Plan\VELCO Turbidity Monitoring Plan final_rev04142016.docx

ATTACHMENT
Existing VELCO Grand IsleTerminal Station
44°41'45.8"N73°21'4.9"W
Existing NYPA Cumberland Head Substation
44° 42' 7.1"N73° 22' 57.9"W
Proposed VELCO Grand IsleTerminal Station44° 41' 48.2"N73° 21' 4.9"W
Proposed NYPA Cumberland Head Transition Station
44°42'6.4"N 73°23'6.6"W
P L A T T S B U R G HC L I N T O N C O U N T Y
N E W Y O R K
G R A N D I S L EG R A N D I S L E C O U N T Y
V E R M O N T
Copyright:© 2013 National Geographic Society, i-cubedELegend
Existing Cables (Approx.)Proposed Replacment Cable Locations (Approx.)Proposed Terminal StationExisting Terminal StationState Boundary
Prepared by: PBW
VELCO and NYPAPV-20 Submarine Cable Replacement Project
Grand Isle, VT and Plattsburgh, NYSite Location Map December 11, 2015
Path: \\vhb\proj\Vermont\57660.00 NYPA PV-20\GIS\Project\PV-20_SiteLocationMap_404.mxd
Sources: USGS Topo Quads from ESRI (2015); State andTown Boundaries from VCGI (2010); Approximate Replacment
Cable Locations, Existing and ProposedTerminal StationLocations from CHA (2015); Approximate Existing Cable Locaitons
Digitized from Plans Provided by CHA (2015).
2,000 0 2,0001,000
Feet
$1
$1
$1
$1
$K
$K
$K
$K
Lake Champlain
Existing Grand IsleTerminal Station
VERMONTNEW YORK
Proposed Grand IsleTerminal Station and
Access Driveway
Proposed ReplacementCable Locations
Existing Submarine CablesApproximate Locations
Existing Submarine CablesLocations (Approximate)
Proposed ReplacementCable Locations
Existing OverheadTransmission Line
Grand Isle Consolidated Water District Intake SPA
R-4
R-2
R-3
R-1
I-1
I-3
I-2
I-4
100
-6
-6
-6
-6-6
-6
-6
-6
-6
-6
-6
-6
-6
-6
-6
-6
-6
-12
-12
-12
-12
-12
-12
-12
-12
-12
-12
-12
-166
-189
-176-42
-8
-37
-164
-191
-189 -43
-15
-47
-164
-188
-163
-162 -83
-10-191
Source: Esri, DigitalGlobe, GeoEye, Earthstar Geographics, CNES/Airbus DS, USDA, USGS, AEX, Getmapping, Aerogrid, IGN, IGP,swisstopo, and the GIS User Community
Vermont Transco, LLCPV-20
Submarine Cable Replacement ProjectGrand Isle, Vermont
Water Quality Monitoring Plan Map
January 8, 2016
Prepared by: PBW
Sources: Background Orthophoto by VMP (2012); Surface Water Protection Area by VT ANR
and downloaded from VCGI (2012); State boundariesfrom ESRI (2013); Existing and Proposed ProjectInfrastructure digitized from CHA Plans (2015).
Bathymetry from VCGI (DEM).
Legend$1 Data Buoy for Removal Monitoring$K Data Buoy for Installation Monitoring
Jet Sled ZoneExisting Infratstructure
Transition StationSubmarine Cables (Approximate Location)Overhead Transmission Line
Proposed InfrastructureProposed Replacement CablesProposed Transition Station and Access Driveway
Public Water Source[p Surface Water Intake+U Groundwater Supply Source
Surface Water Protection Area (VT ANR)10 ft. Contour (VCGI)Bathymetric DepthShore (0 ft)State Boundary (ESRI)
E
\\vtnfdata\projects\57660.00 NYPA PV-20\GIS\Project\PV-20_WQM Map.mxd
0 600 1,200
Feet

CB-450DATA BUOY
° Self-powered data logging buoy
° Wi-Fi, radio, cellular or satellite telemetry
° Supports a variety of environmental sensors
° Accommodates most environmental data loggers
° Rugged polymer-coated foam hull
The NexSens CB-450 Data Buoy is designed for deployment in lakes, rivers, coastal waters, harbors, estuaries and other freshwater or marine environments. The floating platform supports both topside and subsurface environmental monitoring sensors including weather stations, wave sensors, thermistor strings, multi-parameter sondes, Doppler current profilers and other monitoring instruments.
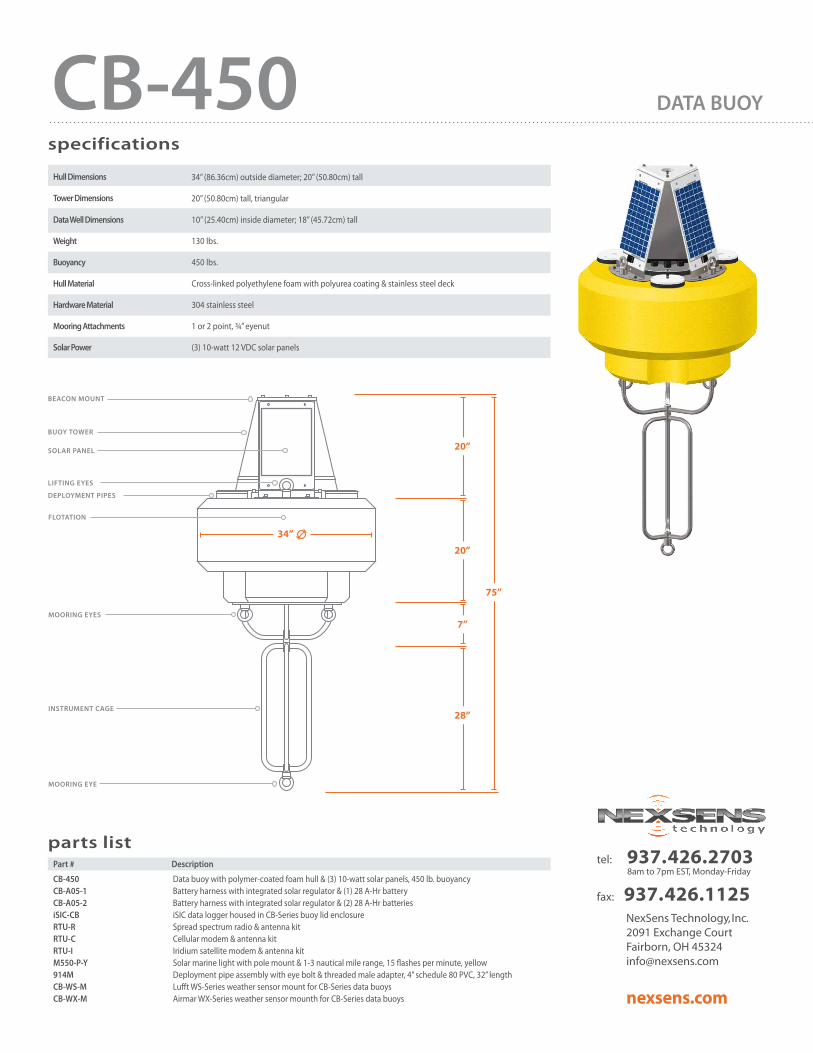
The buoy is constructed of an inner core of cross-linked polyethylene foam with a tough polyurea skin. A topside 20” tall stainless steel tower includes three 10-watt 12 VDC unbreakable solar panels, and a center 10” ID x 18” tall instrument well accommodates batteries, data loggers, sensors, and more. Three 4” pass-through holes with female NPT bottom threads allow for quick connection of instrument deployment pipes and custom sensor mounts. The stainless steel frame supports both single point and multi-point moorings.
The CB-450 Data Buoy is optimized for use with NexSens data loggers. Wireless telemetry options include Wi-Fi, spread spectrum radio, cellular and Iridium satellite. Compatible digital and analog sensor interfaces include RS-232, RS-485, SDI-12, VDC, mA, and pulse count. The top of the instrument well includes 8 pass-through ports for power and sensor interface. Each port offers a UW receptacle with double O-ring seal for a reliable waterproof connection.
Part # Description
CB-450 Data buoy with polymer-coated foam hull & (3) 10-watt solar panels, 450 lb. buoyancyCB-A05-1 Battery harness with integrated solar regulator & (1) 28 A-Hr batteryCB-A05-2 Battery harness with integrated solar regulator & (2) 28 A-Hr batteriesiSIC-CB iSIC data logger housed in CB-Series buoy lid enclosureRTU-R Spread spectrum radio & antenna kitRTU-C Cellular modem & antenna kitRTU-I Iridium satellite modem & antenna kitM550-P-Y Solar marine light with pole mount & 1-3 nautical mile range, 15 flashes per minute, yellow914M Deployment pipe assembly with eye bolt & threaded male adapter, 4” schedule 80 PVC, 32” lengthCB-WS-M Lufft WS-Series weather sensor mount for CB-Series data buoysCB-WX-M Airmar WX-Series weather sensor mounth for CB-Series data buoys
specifications
parts list
Hull Dimensions
Tower Dimensions
Data Well Dimensions
Weight
Buoyancy
Hull Material
Hardware Material
Mooring Attachments
Solar Power
34” (86.36cm) outside diameter; 20” (50.80cm) tall
20” (50.80cm) tall, triangular
10” (25.40cm) inside diameter; 18” (45.72cm) tall
130 lbs.
450 lbs.
Cross-linked polyethylene foam with polyurea coating & stainless steel deck
304 stainless steel
1 or 2 point, ¾” eyenut
(3) 10-watt 12 VDC solar panels
20”
20”
7”
28”
75”
MOORING EYE
MOORING EYES
INSTRUMENT CAGE
FLOTATION
BUOY TOWER
SOLAR PANEL
BEACON MOUNT
nexsens.com
tel: 937.426.27038am to 7pm EST, Monday-Friday
fax: 937.426.1125NexSens Technology, Inc.2091 Exchange CourtFairborn, OH [email protected]
CB-450 DATA BUOY
34”
LIFTING EYES
DEPLOYMENT PIPES
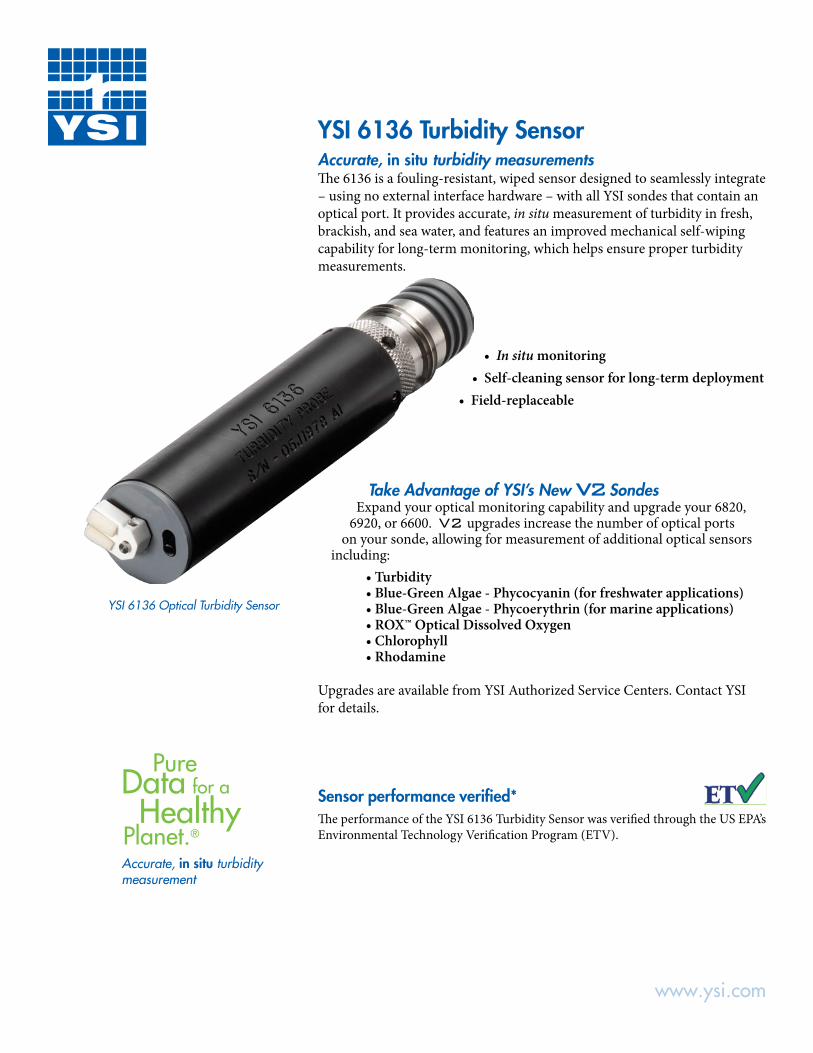
YSI 6136 Turbidity SensorAccurate, in situ turbidity measurementsThe 6136 is a fouling-resistant, wiped sensor designed to seamlessly integrate – using no external interface hardware – with all YSI sondes that contain an optical port. It provides accurate, in situ measurement of turbidity in fresh, brackish, and sea water, and features an improved mechanical self-wiping capability for long-term monitoring, which helps ensure proper turbidity measurements.
• In situ monitoring• Self-cleaning sensor for long-term deployment
• Field-replaceable
Take Advantage of YSI’s New V2 SondesExpand your optical monitoring capability and upgrade your 6820,
6920, or 6600. V2 upgrades increase the number of optical ports on your sonde, allowing for measurement of additional optical sensors
including: • Turbidity • Blue-Green Algae - Phycocyanin (for freshwater applications) • Blue-Green Algae - Phycoerythrin (for marine applications) • ROX™ Optical Dissolved Oxygen • Chlorophyll • Rhodamine
Upgrades are available from YSI Authorized Service Centers. Contact YSI for details.
Sensor performance verified*The performance of the YSI 6136 Turbidity Sensor was verified through the US EPA’s Environmental Technology Verification Program (ETV).
PureData for a
HealthyPlanet.®
www.ysi.com
Accurate, in situ turbidity measurement
YSI 6136 Optical Turbidity Sensor
To order, or for more info, contact+1 937 767 7241 800 897 4151 (US)www.ysi.com
YSI Environmental+1 937 767 7241Fax +1 937 767 [email protected]
YSI Integrated Systems & Services+1 508 748 [email protected]
SonTek/YSI+1 858 546 [email protected]
YSI Gulf Coast+1 225 753 [email protected]
YSI Hydrodata (UK)+44 1462 673 [email protected]
YSI Middle East+973 3977 [email protected]
YSI India+91 [email protected]
YSI (Hong Kong) Limited+852 2891 [email protected]
YSI (China) Limited+86 10 5203 [email protected]
YSI Nanotech (Japan)+81 44 222 [email protected]
YSI Australia+61 7 [email protected]
ROX, Pure Data for a Healthy Planet, and Who’s Minding the Planet? are trademarks of YSI Incorporated. Hach is a registered trademark of Hach Company.
©2007 YSI Incorporated Printed in USA 0109 E56-03
*Sensors with listed with the ETV logo were submitted to the ETV program on the YSI 6600EDS. Information on the performance characteristics of YSI water quality sensors can be found at www.epa.gov/etv, or call YSI for the ETV verification report. Use of the ETV name or logo does not imply approval or certification of this product nor does it make any explicit or implied warranties or guarantees as to product performance.
Y S I i n c o r p o r a t e d Who’s Minding the Planet?®
ISO 9001ISO 14001Yellow Springs, Ohio Facility
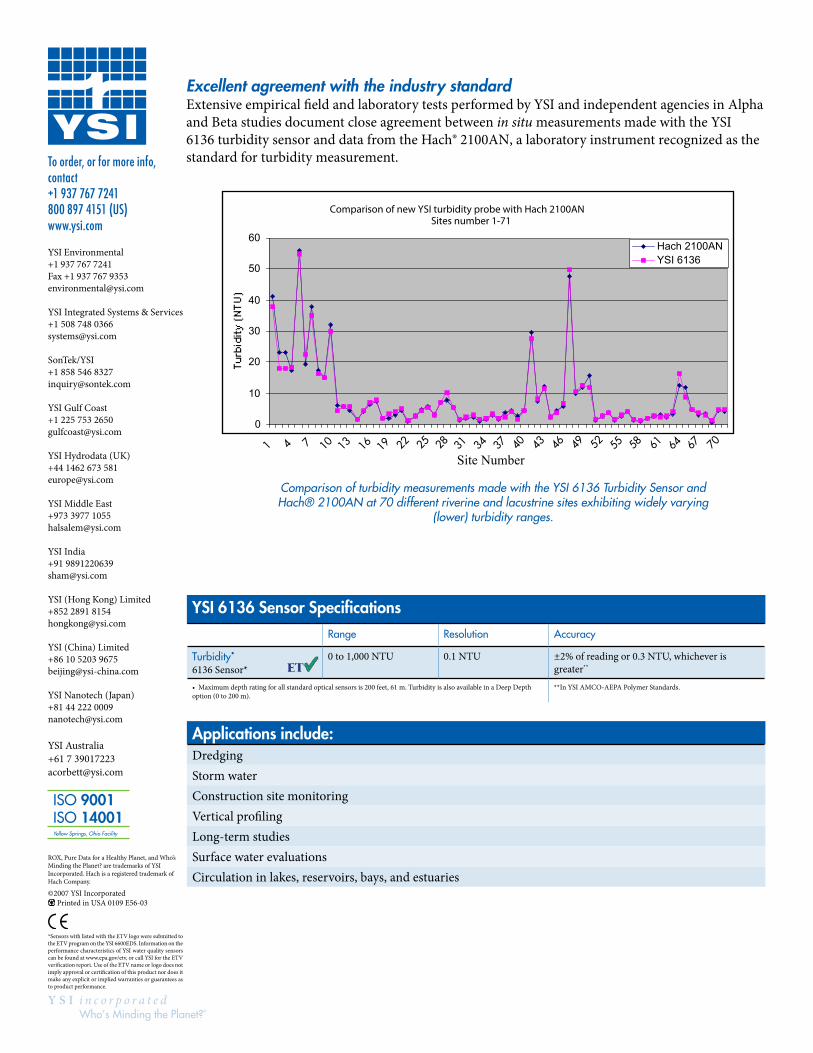
YSI 6136 Sensor SpecificationsRange Resolution Accuracy
Turbidity•
6136 Sensor*0 to 1,000 NTU 0.1 NTU ±2% of reading or 0.3 NTU, whichever is
greater**
• Maximum depth rating for all standard optical sensors is 200 feet, 61 m. Turbidity is also available in a Deep Depth option (0 to 200 m).
**In YSI AMCO-AEPA Polymer Standards.
Excellent agreement with the industry standard Extensive empirical field and laboratory tests performed by YSI and independent agencies in Alpha and Beta studies document close agreement between in situ measurements made with the YSI 6136 turbidity sensor and data from the Hach® 2100AN, a laboratory instrument recognized as the standard for turbidity measurement.
Comparison of turbidity measurements made with the YSI 6136 Turbidity Sensor and Hach® 2100AN at 70 different riverine and lacustrine sites exhibiting widely varying
(lower) turbidity ranges.
Comparison of new YSI turbidity probe with Hach 2100ANSites number 1-71
0
10
20
30
40
50
60
Site Number
Hach 2100ANYSI 6136
Site Number1 4 7 10 13 16 19 22 25 28 31 34 37 40 43 46 49 52 55 58 61 64 67 70
Applications include:DredgingStorm waterConstruction site monitoringVertical profilingLong-term studiesSurface water evaluationsCirculation in lakes, reservoirs, bays, and estuaries

MONITORING TURBIDITYAT DREDGING SITESA GUIDE TO UNDERSTANDING AND ESTABLISHING TURBIDITY AS A REAL-TIME MONITORING SOLUTION

Overview of USACE GuidelinesEnvironmental dredging is defined as: “the removal of contaminated sedi-ments from a water body for purposes of sediment remediation” (USACE). While there are several approaches to dealing with contaminated sediment, dredging is frequently the cleanup method of choice for projects under the Comprehensive Environmental Response, Compensation, and Liability Act (CERCLA), also known as the “Superfund” program.
As no two projects are identical, the specific environmental limits set for a dredging project will vary. Several influencing factors include location, sediment composition, acting regulatory agencies and environmental laws. To assist with this effort, the U.S. Army Corps of Engineers (USACE) has generated a comprehensive set of guidelines to evaluate environmental dredging as a solution for sediment remediation projects. While the EPA’s remediation guide addresses all possible steps and alternatives for dealing with contaminated sediment, the USACE’s guide focuses specifically on the dredging component.
These guidelines provide detailed steps regarding the establishment of a dredging operation, from the preliminary evaluation to the process, methods and control procedures. In doing so, this guide establishes a hier-archy of objectives regarding the technical aspects of a remedial dredging operation. These objectives aim not only to minimize sediment re-suspen-sion, release and residuals, but also to maintain a cost-effective strategy in both the short and long term.
Both of these guidelines stress the importance of implementing a moni-toring strategy that provides rapid feedback, allowing dredge operators to respond to high re-suspension levels before they become problematic. Established limits for sediment re-suspension (maximum allowable levels for water quality and released contaminants), may be a part of dredging regulations established in consultation with stakeholders, or by federal acts and regulatory agencies.
The USACE recommends drafting a comprehensive monitoring plan that includes equipment and techniques to use, protocols for sampling, where to place sampling devices and details about how to interpret the monitor-ing data. Furthermore, the guidelines suggest creating a management plan that describes the specific actions to be taken based on the results of the monitoring. This may include increasing monitoring locations/sampling fre-quency to further assess impacts, implementing operational controls (i.e., stopping or slowing down dredge work), altering debris management or changing equipment. To this end, the USACE technical guidelines advise incorporating real-time feedback on re-suspension into the monitoring plan to make early identification of problems possible. The most rapid and effi-cient management responses are achievable with this real-time data.
Dredging is a common and economically viable solution for the removal and subsequent treatment of contaminated sediment. If executed properly, dredging can yield positive environmental results without harming water quality conditions. Dredging operations should aim to remove sediment as efficiently as possible while diminishing short-term environmental impacts, most notably the re-suspension of potentially contaminated sediments.
To minimize sediment re-suspension and contaminant release, a monitoring system should be established. Sediment can easily be dislodged by dredging and dispersed into the water column. This re-suspension may damage water quality both in the immediate vicinity as well as downstream as it travels with the current. Additionally, if the suspended sediment is contaminated, it can release toxins into the water and air. Effective monitoring of re-suspended sediments for the duration of dredging operations is crucial to maintaining acceptable water quality levels for both wildlife and humans.
For this reason, the U.S. Army Corps of Engineers (USACE) and Environmental Protection Agency (EPA) offer extensive guidelines for estimat-ing the environmental consequences of a dredge. The guides also emphasize the need to monitor these effects as the dredging operation occurs in order to keep any re-suspension and transport under control. These monitoring efforts allow project managers to respond if re-suspended sediment levels exceed pre-established parameters by slowing down or altering the dredging.
For the complete USACE’s Technical Guidelines for Environmental Dredging of Contaminated Sediments, visit: http://el.erdc.usace.army.mil/elpubs/pdf/trel08-29.pdf For the complete EPA’s Contaminated Sediment Remediation Guidance for Hazardous Waste Sites, visit:http://www.epa.gov/superfund/health/conmedia/sediment/pdfs/guidance.pdf
Environmental Dredging: Overview of USACE Guidelines
A Real-Time Solution
Turbidity Technology
Typical Turbidity Monitoring System
Points of Compliance
Data Management
Quality Assurance
Recommended Equipment
Purchase or Rent?
About Fondriest Environmental
System Configuration Tool
01
02
04
06
08
10
12
14
16
17
18
WHY MONITORING MATTERS
WHAT’S INSIDE ENVIRONMENTAL DREDGING
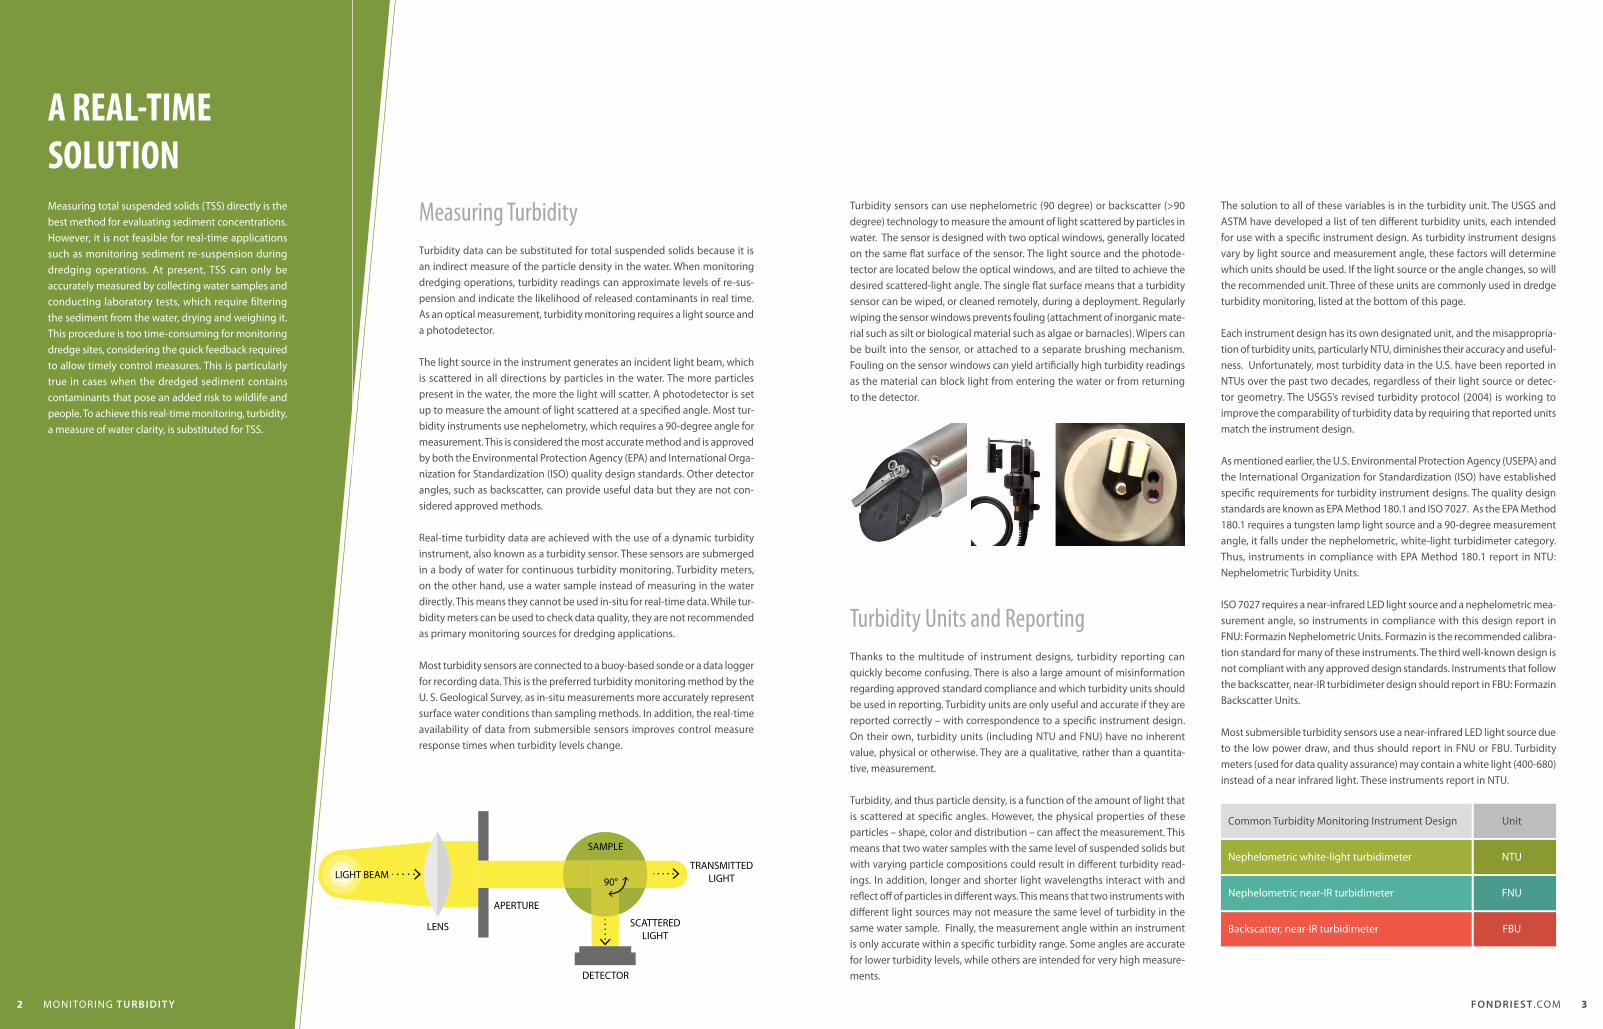
Measuring TurbidityTurbidity data can be substituted for total suspended solids because it is an indirect measure of the particle density in the water. When monitoring dredging operations, turbidity readings can approximate levels of re-sus-pension and indicate the likelihood of released contaminants in real time. As an optical measurement, turbidity monitoring requires a light source and a photodetector.
The light source in the instrument generates an incident light beam, which is scattered in all directions by particles in the water. The more particles present in the water, the more the light will scatter. A photodetector is set up to measure the amount of light scattered at a specified angle. Most tur-bidity instruments use nephelometry, which requires a 90-degree angle for measurement. This is considered the most accurate method and is approved by both the Environmental Protection Agency (EPA) and International Orga-nization for Standardization (ISO) quality design standards. Other detector angles, such as backscatter, can provide useful data but they are not con-sidered approved methods.
Real-time turbidity data are achieved with the use of a dynamic turbidity instrument, also known as a turbidity sensor. These sensors are submerged in a body of water for continuous turbidity monitoring. Turbidity meters, on the other hand, use a water sample instead of measuring in the water directly. This means they cannot be used in-situ for real-time data. While tur-bidity meters can be used to check data quality, they are not recommended as primary monitoring sources for dredging applications.
Most turbidity sensors are connected to a buoy-based sonde or a data logger for recording data. This is the preferred turbidity monitoring method by the U. S. Geological Survey, as in-situ measurements more accurately represent surface water conditions than sampling methods. In addition, the real-time availability of data from submersible sensors improves control measure response times when turbidity levels change.
A REAL-TIME SOLUTIONMeasuring total suspended solids (TSS) directly is the best method for evaluating sediment concentrations. However, it is not feasible for real-time applications such as monitoring sediment re-suspension during dredging operations. At present, TSS can only be accurately measured by collecting water samples and conducting laboratory tests, which require filtering the sediment from the water, drying and weighing it. This procedure is too time-consuming for monitoring dredge sites, considering the quick feedback required to allow timely control measures. This is particularly true in cases when the dredged sediment contains contaminants that pose an added risk to wildlife and people. To achieve this real-time monitoring, turbidity, a measure of water clarity, is substituted for TSS.
LIGHT BEAM
SAMPLE
90°
TRANSMITTED LIGHT
SCATTERED LIGHT
DETECTOR
APERTURE
LENS
Turbidity Units and ReportingThanks to the multitude of instrument designs, turbidity reporting can quickly become confusing. There is also a large amount of misinformation regarding approved standard compliance and which turbidity units should be used in reporting. Turbidity units are only useful and accurate if they are reported correctly – with correspondence to a specific instrument design. On their own, turbidity units (including NTU and FNU) have no inherent value, physical or otherwise. They are a qualitative, rather than a quantita-tive, measurement.
Turbidity, and thus particle density, is a function of the amount of light that is scattered at specific angles. However, the physical properties of these particles – shape, color and distribution – can affect the measurement. This means that two water samples with the same level of suspended solids but with varying particle compositions could result in different turbidity read-ings. In addition, longer and shorter light wavelengths interact with and reflect off of particles in different ways. This means that two instruments with different light sources may not measure the same level of turbidity in the same water sample. Finally, the measurement angle within an instrument is only accurate within a specific turbidity range. Some angles are accurate for lower turbidity levels, while others are intended for very high measure-ments.
The solution to all of these variables is in the turbidity unit. The USGS and ASTM have developed a list of ten different turbidity units, each intended for use with a specific instrument design. As turbidity instrument designs vary by light source and measurement angle, these factors will determine which units should be used. If the light source or the angle changes, so will the recommended unit. Three of these units are commonly used in dredge turbidity monitoring, listed at the bottom of this page.
Each instrument design has its own designated unit, and the misappropria-tion of turbidity units, particularly NTU, diminishes their accuracy and useful-ness. Unfortunately, most turbidity data in the U.S. have been reported in NTUs over the past two decades, regardless of their light source or detec-tor geometry. The USGS’s revised turbidity protocol (2004) is working to improve the comparability of turbidity data by requiring that reported units match the instrument design.
As mentioned earlier, the U.S. Environmental Protection Agency (USEPA) and the International Organization for Standardization (ISO) have established specific requirements for turbidity instrument designs. The quality design standards are known as EPA Method 180.1 and ISO 7027. As the EPA Method 180.1 requires a tungsten lamp light source and a 90-degree measurement angle, it falls under the nephelometric, white-light turbidimeter category. Thus, instruments in compliance with EPA Method 180.1 report in NTU: Nephelometric Turbidity Units.
ISO 7027 requires a near-infrared LED light source and a nephelometric mea-surement angle, so instruments in compliance with this design report in FNU: Formazin Nephelometric Units. Formazin is the recommended calibra-tion standard for many of these instruments. The third well-known design is not compliant with any approved design standards. Instruments that follow the backscatter, near-IR turbidimeter design should report in FBU: Formazin Backscatter Units.
Most submersible turbidity sensors use a near-infrared LED light source due to the low power draw, and thus should report in FNU or FBU. Turbidity meters (used for data quality assurance) may contain a white light (400-680) instead of a near infrared light. These instruments report in NTU.
Turbidity sensors can use nephelometric (90 degree) or backscatter (>90 degree) technology to measure the amount of light scattered by particles in water. The sensor is designed with two optical windows, generally located on the same flat surface of the sensor. The light source and the photode-tector are located below the optical windows, and are tilted to achieve the desired scattered-light angle. The single flat surface means that a turbidity sensor can be wiped, or cleaned remotely, during a deployment. Regularly wiping the sensor windows prevents fouling (attachment of inorganic mate-rial such as silt or biological material such as algae or barnacles). Wipers can be built into the sensor, or attached to a separate brushing mechanism. Fouling on the sensor windows can yield artificially high turbidity readings as the material can block light from entering the water or from returning to the detector.
Common Turbidity Monitoring Instrument Design Unit
Backscatter, near-IR turbidimeter FBU
Nephelometric near-IR turbidimeter FNU
Nephelometric white-light turbidimeter NTU
32 FONDRIEST .COMMONITORING TURBIDIT Y
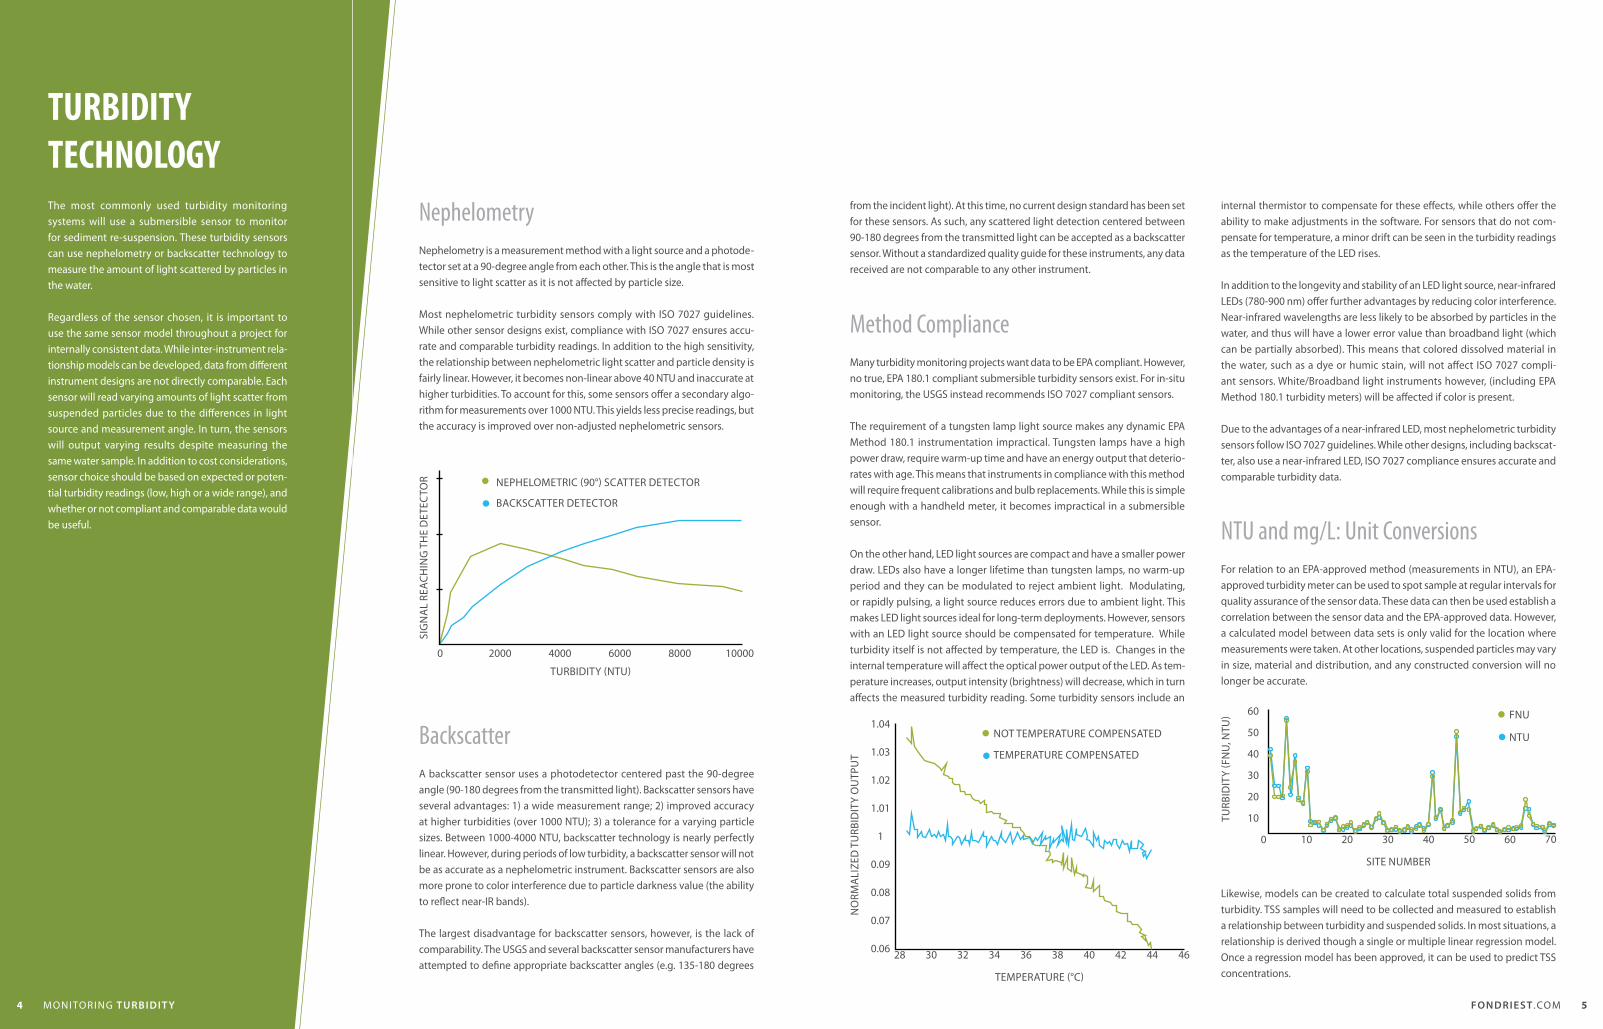
TURBIDITY TECHNOLOGYThe most commonly used turbidity monitoring systems will use a submersible sensor to monitor for sediment re-suspension. These turbidity sensors can use nephelometry or backscatter technology to measure the amount of light scattered by particles in the water.
Regardless of the sensor chosen, it is important to use the same sensor model throughout a project for internally consistent data. While inter-instrument rela-tionship models can be developed, data from different instrument designs are not directly comparable. Each sensor will read varying amounts of light scatter from suspended particles due to the differences in light source and measurement angle. In turn, the sensors will output varying results despite measuring the same water sample. In addition to cost considerations, sensor choice should be based on expected or poten-tial turbidity readings (low, high or a wide range), and whether or not compliant and comparable data would be useful.
Nephelometry
Backscatter
Nephelometry is a measurement method with a light source and a photode-tector set at a 90-degree angle from each other. This is the angle that is most sensitive to light scatter as it is not affected by particle size.
Most nephelometric turbidity sensors comply with ISO 7027 guidelines. While other sensor designs exist, compliance with ISO 7027 ensures accu-rate and comparable turbidity readings. In addition to the high sensitivity, the relationship between nephelometric light scatter and particle density is fairly linear. However, it becomes non-linear above 40 NTU and inaccurate at higher turbidities. To account for this, some sensors offer a secondary algo-rithm for measurements over 1000 NTU. This yields less precise readings, but the accuracy is improved over non-adjusted nephelometric sensors.
A backscatter sensor uses a photodetector centered past the 90-degree angle (90-180 degrees from the transmitted light). Backscatter sensors have several advantages: 1) a wide measurement range; 2) improved accuracy at higher turbidities (over 1000 NTU); 3) a tolerance for a varying particle sizes. Between 1000-4000 NTU, backscatter technology is nearly perfectly linear. However, during periods of low turbidity, a backscatter sensor will not be as accurate as a nephelometric instrument. Backscatter sensors are also more prone to color interference due to particle darkness value (the ability to reflect near-IR bands).
The largest disadvantage for backscatter sensors, however, is the lack of comparability. The USGS and several backscatter sensor manufacturers have attempted to define appropriate backscatter angles (e.g. 135-180 degrees
TURBIDITY (NTU)
NEPHELOMETRIC (90°) SCATTER DETECTOR
BACkSCATTER DETECTOR
1000080006000400020000
SIG
NA
L RE
ACH
ING
TH
E D
ETEC
TOR
Method Compliance
NTU and mg/L: Unit Conversions
Many turbidity monitoring projects want data to be EPA compliant. However, no true, EPA 180.1 compliant submersible turbidity sensors exist. For in-situ monitoring, the USGS instead recommends ISO 7027 compliant sensors.
The requirement of a tungsten lamp light source makes any dynamic EPA Method 180.1 instrumentation impractical. Tungsten lamps have a high power draw, require warm-up time and have an energy output that deterio-rates with age. This means that instruments in compliance with this method will require frequent calibrations and bulb replacements. While this is simple enough with a handheld meter, it becomes impractical in a submersible sensor.
On the other hand, LED light sources are compact and have a smaller power draw. LEDs also have a longer lifetime than tungsten lamps, no warm-up period and they can be modulated to reject ambient light. Modulating, or rapidly pulsing, a light source reduces errors due to ambient light. This makes LED light sources ideal for long-term deployments. However, sensors with an LED light source should be compensated for temperature. While turbidity itself is not affected by temperature, the LED is. Changes in the internal temperature will affect the optical power output of the LED. As tem-perature increases, output intensity (brightness) will decrease, which in turn affects the measured turbidity reading. Some turbidity sensors include an
For relation to an EPA-approved method (measurements in NTU), an EPA-approved turbidity meter can be used to spot sample at regular intervals for quality assurance of the sensor data. These data can then be used establish a correlation between the sensor data and the EPA-approved data. However, a calculated model between data sets is only valid for the location where measurements were taken. At other locations, suspended particles may vary in size, material and distribution, and any constructed conversion will no longer be accurate.
Likewise, models can be created to calculate total suspended solids from turbidity. TSS samples will need to be collected and measured to establish a relationship between turbidity and suspended solids. In most situations, a relationship is derived though a single or multiple linear regression model. Once a regression model has been approved, it can be used to predict TSS concentrations.
SITE NUMBER
TEMPERATURE (°C)
FNU
NOT TEMPERATURE COMPENSATED NTU
TEMPERATURE COMPENSATED
0
28 30 32 34 36 38 40 42 44 46
60
60 70
501.04
0.09
50
401.03
0.08
40
301.02
0.07
30
201.01
0.06
20
10
1 10
TURB
IDIT
Y (F
NU
, NTU
)
NO
RMA
LIZE
D T
URB
IDIT
Y O
UTP
UT
from the incident light). At this time, no current design standard has been set for these sensors. As such, any scattered light detection centered between 90-180 degrees from the transmitted light can be accepted as a backscatter sensor. Without a standardized quality guide for these instruments, any data received are not comparable to any other instrument.
internal thermistor to compensate for these effects, while others offer the ability to make adjustments in the software. For sensors that do not com-pensate for temperature, a minor drift can be seen in the turbidity readings as the temperature of the LED rises.
In addition to the longevity and stability of an LED light source, near-infrared LEDs (780-900 nm) offer further advantages by reducing color interference. Near-infrared wavelengths are less likely to be absorbed by particles in the water, and thus will have a lower error value than broadband light (which can be partially absorbed). This means that colored dissolved material in the water, such as a dye or humic stain, will not affect ISO 7027 compli-ant sensors. White/Broadband light instruments however, (including EPA Method 180.1 turbidity meters) will be affected if color is present.
Due to the advantages of a near-infrared LED, most nephelometric turbidity sensors follow ISO 7027 guidelines. While other designs, including backscat-ter, also use a near-infrared LED, ISO 7027 compliance ensures accurate and comparable turbidity data.
4 MONITORING TURBIDIT Y 5FONDRIEST .COM
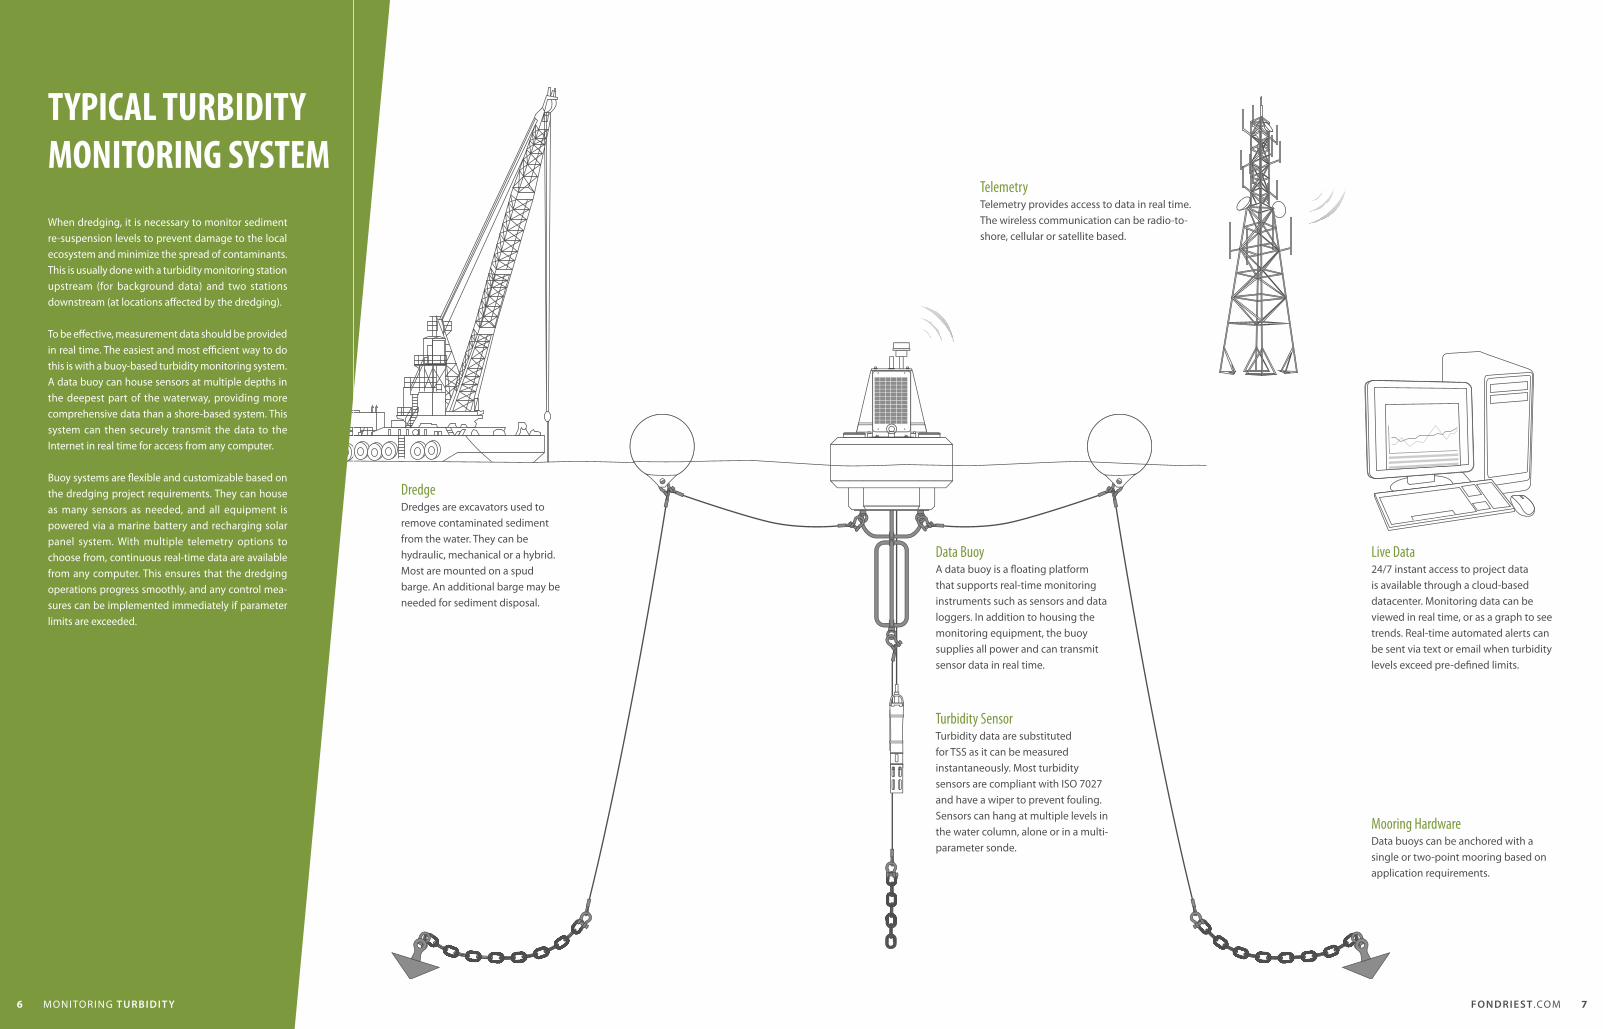
TYPICAL TURBIDITY MONITORING SYSTEMWhen dredging, it is necessary to monitor sediment re-suspension levels to prevent damage to the local ecosystem and minimize the spread of contaminants. This is usually done with a turbidity monitoring station upstream (for background data) and two stations downstream (at locations affected by the dredging).
To be effective, measurement data should be provided in real time. The easiest and most efficient way to do this is with a buoy-based turbidity monitoring system. A data buoy can house sensors at multiple depths in the deepest part of the waterway, providing more comprehensive data than a shore-based system. This system can then securely transmit the data to the Internet in real time for access from any computer.
Buoy systems are flexible and customizable based on the dredging project requirements. They can house as many sensors as needed, and all equipment is powered via a marine battery and recharging solar panel system. With multiple telemetry options to choose from, continuous real-time data are available from any computer. This ensures that the dredging operations progress smoothly, and any control mea-sures can be implemented immediately if parameter limits are exceeded.
DredgeDredges are excavators used to remove contaminated sediment from the water. They can be hydraulic, mechanical or a hybrid. Most are mounted on a spud barge. An additional barge may be needed for sediment disposal.
TelemetryTelemetry provides access to data in real time. The wireless communication can be radio-to-shore, cellular or satellite based.
Data BuoyA data buoy is a floating platform that supports real-time monitoring instruments such as sensors and data loggers. In addition to housing the monitoring equipment, the buoy supplies all power and can transmit sensor data in real time.
Turbidity SensorTurbidity data are substituted for TSS as it can be measured instantaneously. Most turbidity sensors are compliant with ISO 7027 and have a wiper to prevent fouling. Sensors can hang at multiple levels in the water column, alone or in a multi-parameter sonde.
Live Data24/7 instant access to project data is available through a cloud-based datacenter. Monitoring data can be viewed in real time, or as a graph to see trends. Real-time automated alerts can be sent via text or email when turbidity levels exceed pre-defined limits.
Mooring HardwareData buoys can be anchored with a single or two-point mooring based on application requirements.
76 FONDRIEST .COMMONITORING TURBIDIT Y

Selecting the LocationAs suggested by the name, stationary systems are set at fixed locations. These systems can be placed on structure or on an anchored buoy in the water. Seawalls are a common example of a structure that can be used, as turbidity monitoring sensors can be mounted in a perforated PVC pipe along the seawall. However, site conditions often make it difficult or impractical to mount the monitoring equipment along the shore. In addition, relying solely on shoreline solutions may not accurately represent re-suspension levels and sediment transport due to the nature of water currents. For these reasons, buoy-based systems offer the most comprehensive and cost-effective solu-tion. Data buoys provide a stable platform for turbidity monitoring, with the ability to house multiple sensors at different depths in the water column. In addition, they can carry a data logger, solar-powered battery pack, and telemetry (wireless communications) systems for extended deployments.
Anchored buoys are usually located both up and downstream of the dredg-ing operation. The downstream buoy(s) measure re-suspended sediment and sediment transport in areas at risk, while the upstream (and off-site) buoy serves as a control for suitable turbidity levels. These buoys can come in different sizes based on the environmental conditions and the number of sensors suspended from the buoy. Data buoys with 150- to 450-lb. net buoyancy are generally adequate for monitoring projects on rivers, inland lakes and protected waters. Larger platforms may be required in coastal and Great Lakes deployments that are subject to more extreme conditions and wave action.
Towed sensors are known as “floating” points of compliance, as they move with the dredging operation. While these can be attached directly to the dredging equipment, they can also be deployed on a buoy system a set distance away from the dredge location. The buoy systems then move with the dredge as the project progresses, remaining the same distance away from the active dredging site.
POINTS OF COMPLIANCE
Pre-Deployment
For accurate data, all sensors should be calibrated shortly before the project begins. If using a buoy-based system, the platforms should be fully assem-bled on shore prior to deployment. This includes attaching any sensors, towers, solar panels and additional ballast weights if needed. Furthermore, the complete turbidity monitoring system (sensors, data logger, telemetry, software) should be tested before the buoy is put in the water. While this process ensures that all equipment is functioning within specifications, it also gives everyone the chance to familiarize themselves with the system prior to deployment. Issues are always easier to deal with before the buoy platform is deployed in the water.
Where turbidity monitoring systems should be located will depend largely on the site conditions of the dredging project. The number of monitoring loca-tions required for a dredging operation can vary, but a common monitoring setup relies on three measure-ment locations. The chosen measurement locations are known as points of compliance. At these points, the USACE suggests using stationary or towed turbid-ity sensors in conjunction with water column sampling.
Buoy Mooring
Single-Point Mooring
Two-Point Mooring
A buoy-based system must be moored to ensure that it remains stationary. The buoy is usually moored via a stainless steel mooring line, bottom chain and anchor. It is recommended to moor the buoy in the deepest part of the waterway to ensure the most inclusive measurements. This allows for multiple measurement depths and will best reflect the characteristics of the water body as a whole.
Buoy-based systems are typically moored as either a single-point or two-point mooring, based on environmental and application-specific factors.
Single-point moorings are not common, but they require the least amount of mooring equipment. This setup can be deployed in very calm waters with minimal instruments. A single-point mooring should only be used when all sensors and equipment are housed within an instrument cage or deploy-ment pipe. Hanging sensors risk getting damaged or entangled with the anchor line. A cage or pipe protects the instruments from entanglement, subsurface debris and currents without affecting sensor readings.
In a single-point configuration, a mooring line connects the buoy directly to a bottom chain and anchor. The sensors are typically housed within a central deployment pipe or attached to a rigid instrument cage. The anchor, bottom chain and mooring line are assembled and attached to the buoy prior to deploying the system.
Two-point moorings are the most common deployment configuration. This is the recommended setup if sensors will be hanging at multiple depths in the water column. In a two-point setup, the mooring lines are pulled away from the data buoy by two smaller marker buoys. This configuration leaves the water column below the buoy available for sensors, without risk of entanglement with anchor lines. It also offers greater stability if there are currents or wave action at the location.
A two-point mooring requires a larger deployment area than a single-point mooring, as the marker buoys are typically set about ten feet away from the data buoy. Additional mooring lines run from the marker buoys to bottom chains and anchors at the seafloor. The increased system stability from the two anchor setup is well worth the extra equipment, as is the expanded area for hanging sensors. If there is significant subsurface debris or other risks present, deployment pipes or instrument cages can still be used.
98 FONDRIEST .COMMONITORING TURBIDIT Y

TelemetryTelemetry, or wireless communication, is a useful tool for monitoring turbid-ity in real time. Common telemetry options are cellular and radio, though satellite telemetry can be used in more remote locations. The deciding factor when determining the most cost-effective telemetry option should be the local site conditions and proximity to a project computer. All three of these options permit real-time updates regarding water quality during a dredg-ing operation.
Radio telemetry is recommended when all equipment is in close proximity. If equipped with a license-free spread-spectrum radio, a data logger can com-municate with a shore-side radio base station. This range may vary depend-ing on the logger and base station used. Spread-spectrum radio technology may allow a range as far as five miles (line-of-sight) or a few hundred feet (non-line-of-sight). The radio base station serves as a central hub for any buoy-based data logger in range, with the ability to send the collected data to a project computer.
Cellular telemetry offers more geographic flexibility than radio, though it does require a cellular data plan. This small, additional cost permits data transmissions from anywhere that receives a cellular signal. With cellular
Data LoggerAs the name implies, a data logger is an instrument that stores data. In envi-ronmental monitoring applications, data loggers can be used not only to collect data from sensors and sondes, but to control sampling rates and transmit data to a central location in real time.
While sondes often have the ability to log their own data, a separate, dedi-cated data logger can gather data from any and all attached sensors, while ensuring that no data are lost. If telemetry (wireless communication) is avail-able, the logger can remotely control sensor sampling rates and transmit collected data to a central project computer. Data loggers with telemetry technology can provide real-time turbidity data and remote access via a cellular modem, radio transmission or satellite modem.
When housed in a data buoy, a data logger is charged by the buoy’s solar power system. If a solar panel system or external battery is not available, the logger can be self-powered using alkaline batteries. Data loggers can be configured with a number of sensor ports for connection to industry-standard digital and analog interfaces, including RS-485, SDI-12 or 0-2.5 VDC. Turbidity sensors can connect to a logger directly or through a multi-parameter sonde. A data logger can also handle additional water quality sensors, temperature strings or Doppler velocity meters if they are required for the dredging application.
Real-Time Online DatacenterThe easiest way to share and view turbidity monitoring data is through a web-based datacenter. An online datacenter offers 24/7 instant access to project data via any web browser. Turbidity monitoring and other data can be exported into the datacenter directly from the data logger, or through the project software.
This project management service can be password protected or public, and allows users access to the collected data in real time. In addition to any dredging-specific information, the online interface can provide dynamic area maps, overlaid with weather information, recent and historical data, time series graphs and statistical summaries. Visitors can interact with the project maps and view real-time monitoring data or turbidity level trends over time.
But these cloud-based datacenters are more than just a pretty face. Many can be programmed to send out automated alarm notifications when tur-bidity levels exceed pre-defined limits. These limits are determined by col-lecting background data prior to dredging using spot-sampling equipment. Once an allowable turbidity range has been set, the data are entered into the online database. If turbidity levels exceed this recommended range during dredging operations, the datacenter will immediately issue an alert (text and/or email) to the appropriate project manager or operator.
With the availability of real-time data and the datacenter’s auto-alert system, dredge operators can be notified immediately when turbidity levels rise. This means that timely control procedures can be implemented to slow down, alter or stop the dredging operation until levels fall below the maximum allowable limit. The online datacenter can also transmit this alert back to the data logger in order to respond to the exceeded turbidity range. Automated responses may include taking more frequent readings during high turbidity periods, then resuming regular log intervals when levels return to normal.
DATA MANAGEMENT
telemetry, monitoring stations do not need to be in close proximity, nor is a shore-side base station required. Instead, all the data can be accessed wire-lessly via the Internet. Data loggers may be equipped with cellular modems from different providers, including AT&T, Verizon and Sprint.
For remote applications where radio and cellular telemetry are not feasible, satellite telemetry can be used. The Iridium communications network main-tains a dynamic, cross-linked constellation of Low Earth Orbiting (LEO) sat-ellites, providing coverage all over the world. This means that data loggers with an Iridium satellite modem can transmit data in real time from any-where on Earth. As with cellular networks, the data are sent to a central gateway, which then transfers the data over the Internet to any project computer or cell phone.
A major part of any monitoring project is collect-ing and accessing the data. While it is possible to simply record measurements onsite, the ability to log, send and view monitoring data in real time is far more efficient.
1110 FONDRIEST .COMMONITORING TURBIDIT Y
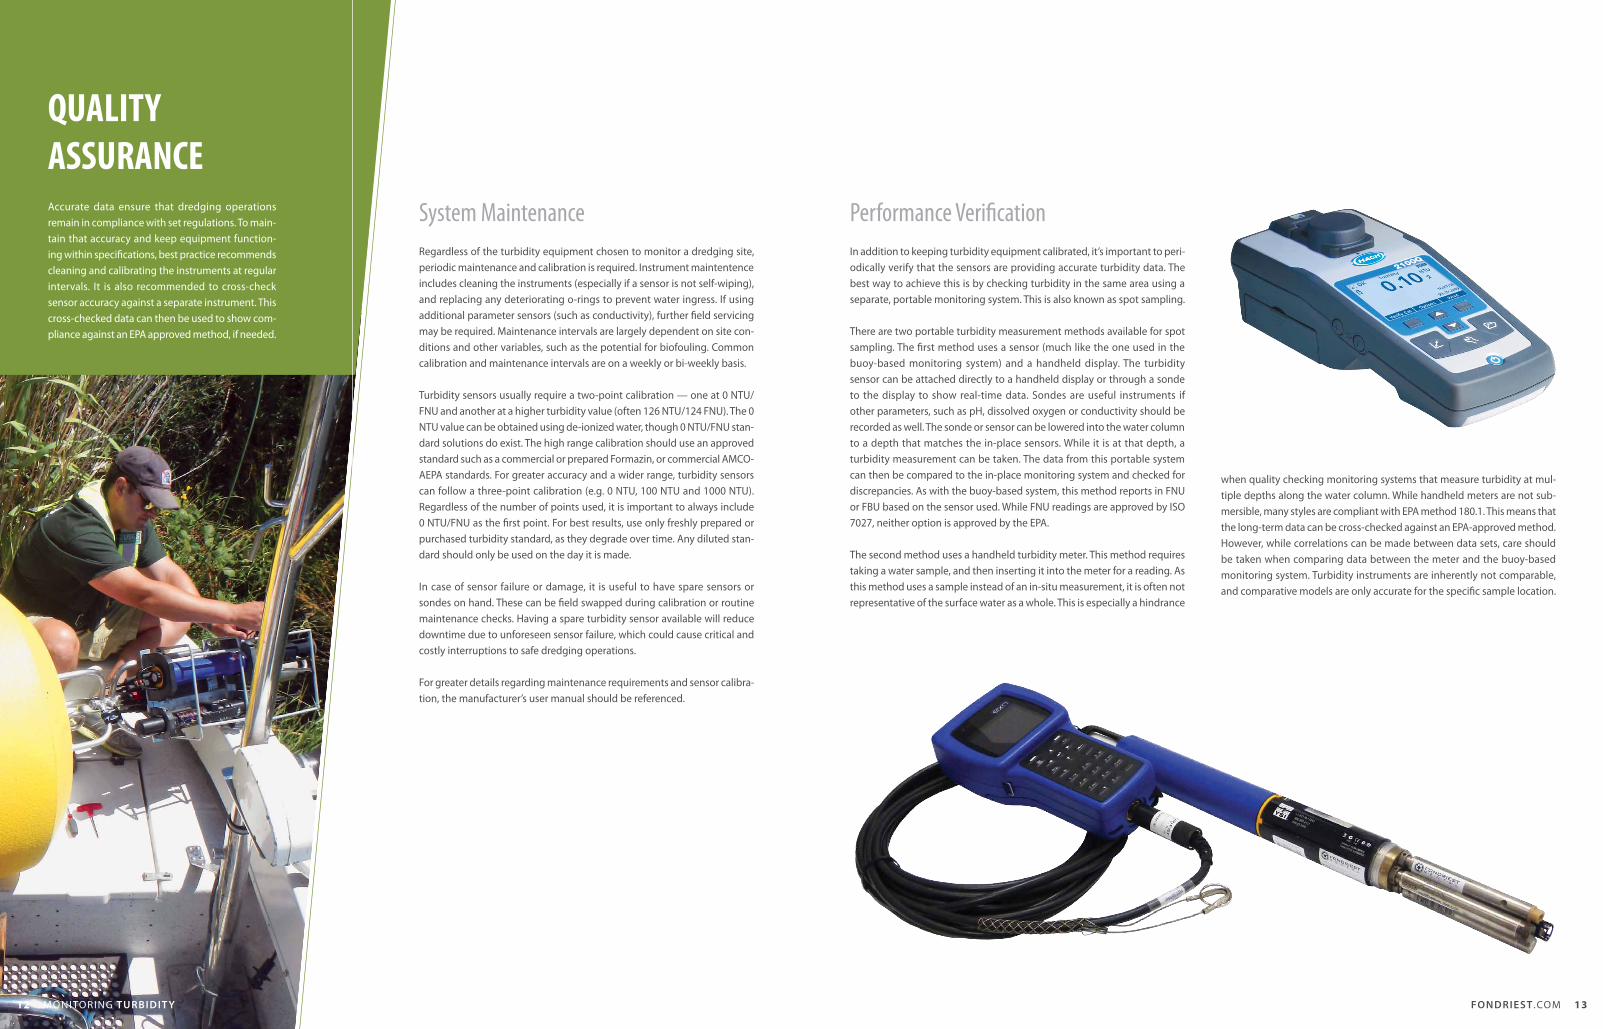
In addition to keeping turbidity equipment calibrated, it’s important to peri-odically verify that the sensors are providing accurate turbidity data. The best way to achieve this is by checking turbidity in the same area using a separate, portable monitoring system. This is also known as spot sampling.
There are two portable turbidity measurement methods available for spot sampling. The first method uses a sensor (much like the one used in the buoy-based monitoring system) and a handheld display. The turbidity sensor can be attached directly to a handheld display or through a sonde to the display to show real-time data. Sondes are useful instruments if other parameters, such as pH, dissolved oxygen or conductivity should be recorded as well. The sonde or sensor can be lowered into the water column to a depth that matches the in-place sensors. While it is at that depth, a turbidity measurement can be taken. The data from this portable system can then be compared to the in-place monitoring system and checked for discrepancies. As with the buoy-based system, this method reports in FNU or FBU based on the sensor used. While FNU readings are approved by ISO 7027, neither option is approved by the EPA.
The second method uses a handheld turbidity meter. This method requires taking a water sample, and then inserting it into the meter for a reading. As this method uses a sample instead of an in-situ measurement, it is often not representative of the surface water as a whole. This is especially a hindrance
Regardless of the turbidity equipment chosen to monitor a dredging site, periodic maintenance and calibration is required. Instrument maintentence includes cleaning the instruments (especially if a sensor is not self-wiping), and replacing any deteriorating o-rings to prevent water ingress. If using additional parameter sensors (such as conductivity), further field servicing may be required. Maintenance intervals are largely dependent on site con-ditions and other variables, such as the potential for biofouling. Common calibration and maintenance intervals are on a weekly or bi-weekly basis.
Turbidity sensors usually require a two-point calibration — one at 0 NTU/FNU and another at a higher turbidity value (often 126 NTU/124 FNU). The 0 NTU value can be obtained using de-ionized water, though 0 NTU/FNU stan-dard solutions do exist. The high range calibration should use an approved standard such as a commercial or prepared Formazin, or commercial AMCO-AEPA standards. For greater accuracy and a wider range, turbidity sensors can follow a three-point calibration (e.g. 0 NTU, 100 NTU and 1000 NTU). Regardless of the number of points used, it is important to always include 0 NTU/FNU as the first point. For best results, use only freshly prepared or purchased turbidity standard, as they degrade over time. Any diluted stan-dard should only be used on the day it is made.
In case of sensor failure or damage, it is useful to have spare sensors or sondes on hand. These can be field swapped during calibration or routine maintenance checks. Having a spare turbidity sensor available will reduce downtime due to unforeseen sensor failure, which could cause critical and costly interruptions to safe dredging operations.
For greater details regarding maintenance requirements and sensor calibra-tion, the manufacturer’s user manual should be referenced.
QUALITYASSURANCE
Performance VerificationSystem Maintenance
when quality checking monitoring systems that measure turbidity at mul-tiple depths along the water column. While handheld meters are not sub-mersible, many styles are compliant with EPA method 180.1. This means that the long-term data can be cross-checked against an EPA-approved method. However, while correlations can be made between data sets, care should be taken when comparing data between the meter and the buoy-based monitoring system. Turbidity instruments are inherently not comparable, and comparative models are only accurate for the specific sample location.
Accurate data ensure that dredging operations remain in compliance with set regulations. To main-tain that accuracy and keep equipment function-ing within specifications, best practice recommends cleaning and calibrating the instruments at regular intervals. It is also recommended to cross-check sensor accuracy against a separate instrument. This cross-checked data can then be used to show com-pliance against an EPA approved method, if needed.
1312 FONDRIEST .COMMONITORING TURBIDIT Y
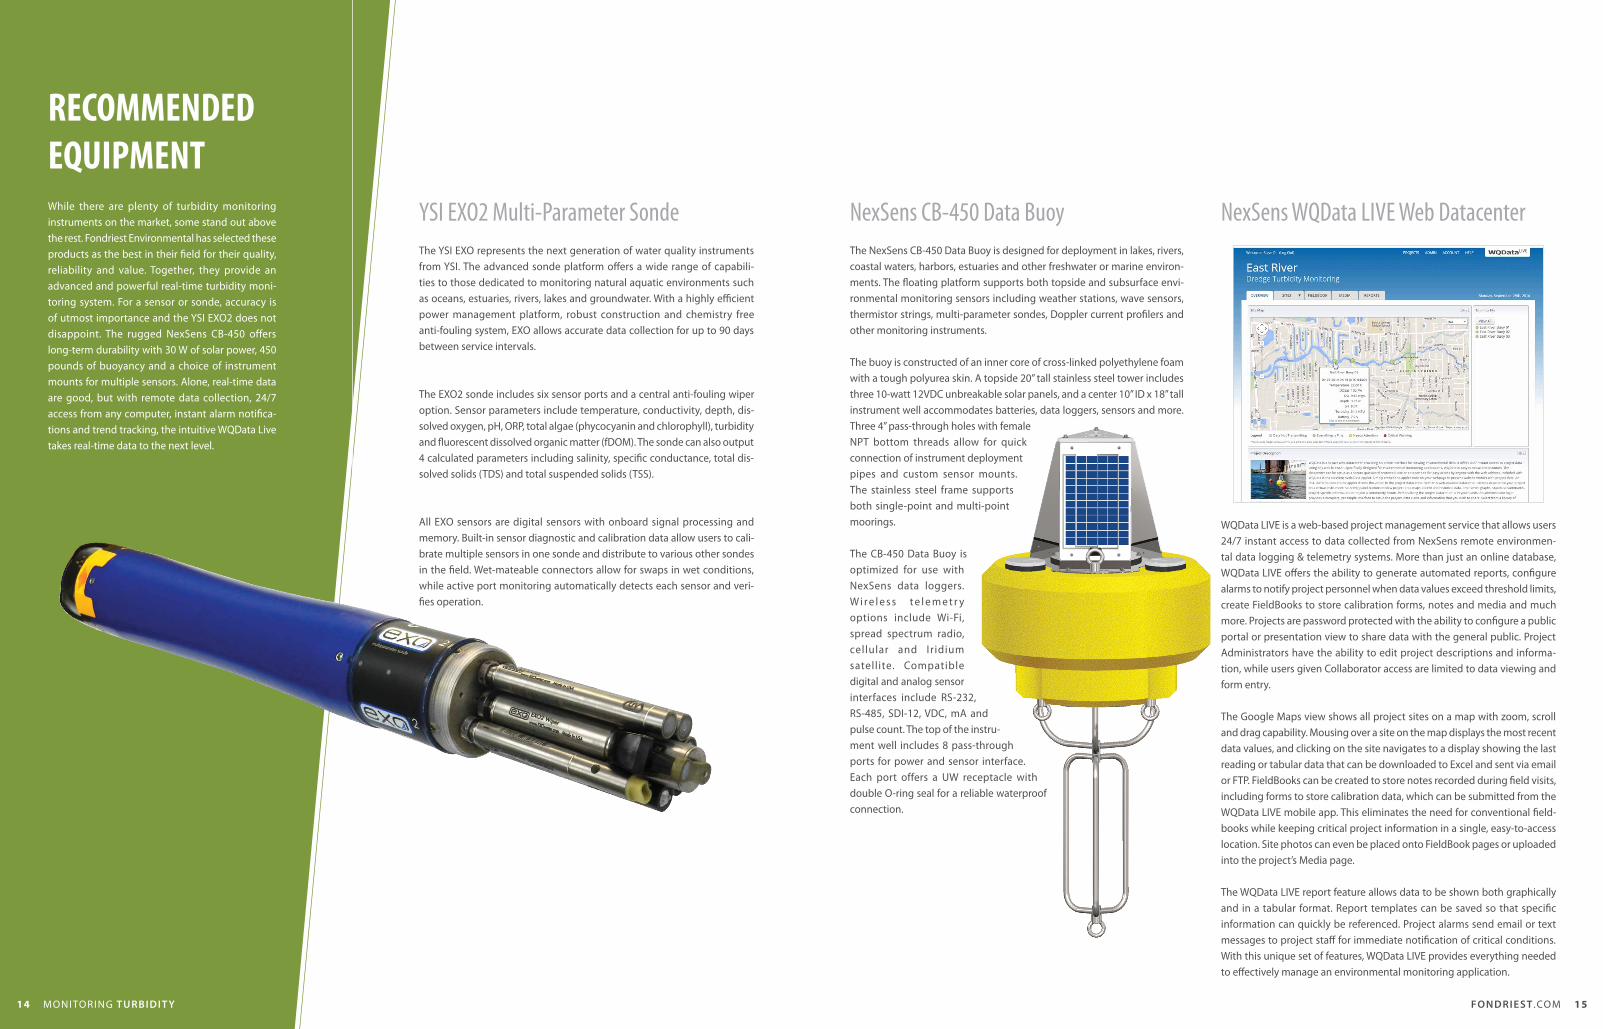
NexSens CB-450 Data BuoyYSI EXO2 Multi-Parameter Sonde NexSens WQData LIVE Web DatacenterThe NexSens CB-450 Data Buoy is designed for deployment in lakes, rivers, coastal waters, harbors, estuaries and other freshwater or marine environ-ments. The floating platform supports both topside and subsurface envi-ronmental monitoring sensors including weather stations, wave sensors, thermistor strings, multi-parameter sondes, Doppler current profilers and other monitoring instruments.
The buoy is constructed of an inner core of cross-linked polyethylene foam with a tough polyurea skin. A topside 20” tall stainless steel tower includes three 10-watt 12VDC unbreakable solar panels, and a center 10” ID x 18” tall instrument well accommodates batteries, data loggers, sensors and more. Three 4” pass-through holes with female NPT bottom threads allow for quick connection of instrument deployment pipes and custom sensor mounts. The stainless steel frame supports both single-point and multi-point moorings.
The CB-450 Data Buoy is optimized for use with NexSens data loggers. Wi r e l e s s t e l e m e t r y options include Wi-Fi, spread spectrum radio, cellular and Iridium satellite. Compatible digital and analog sensor interfaces include RS-232, RS-485, SDI-12, VDC, mA and pulse count. The top of the instru-ment well includes 8 pass-through ports for power and sensor interface. Each port offers a UW receptacle with double O-ring seal for a reliable waterproof connection.
The YSI EXO represents the next generation of water quality instruments from YSI. The advanced sonde platform offers a wide range of capabili-ties to those dedicated to monitoring natural aquatic environments such as oceans, estuaries, rivers, lakes and groundwater. With a highly efficient power management platform, robust construction and chemistry free anti-fouling system, EXO allows accurate data collection for up to 90 days between service intervals.
The EXO2 sonde includes six sensor ports and a central anti-fouling wiper option. Sensor parameters include temperature, conductivity, depth, dis-solved oxygen, pH, ORP, total algae (phycocyanin and chlorophyll), turbidity and fluorescent dissolved organic matter (fDOM). The sonde can also output 4 calculated parameters including salinity, specific conductance, total dis-solved solids (TDS) and total suspended solids (TSS).
All EXO sensors are digital sensors with onboard signal processing and memory. Built-in sensor diagnostic and calibration data allow users to cali-brate multiple sensors in one sonde and distribute to various other sondes in the field. Wet-mateable connectors allow for swaps in wet conditions, while active port monitoring automatically detects each sensor and veri-fies operation.
WQData LIVE is a web-based project management service that allows users 24/7 instant access to data collected from NexSens remote environmen-tal data logging & telemetry systems. More than just an online database, WQData LIVE offers the ability to generate automated reports, configure alarms to notify project personnel when data values exceed threshold limits, create FieldBooks to store calibration forms, notes and media and much more. Projects are password protected with the ability to configure a public portal or presentation view to share data with the general public. Project Administrators have the ability to edit project descriptions and informa-tion, while users given Collaborator access are limited to data viewing and form entry.
The Google Maps view shows all project sites on a map with zoom, scroll and drag capability. Mousing over a site on the map displays the most recent data values, and clicking on the site navigates to a display showing the last reading or tabular data that can be downloaded to Excel and sent via email or FTP. FieldBooks can be created to store notes recorded during field visits, including forms to store calibration data, which can be submitted from the WQData LIVE mobile app. This eliminates the need for conventional field-books while keeping critical project information in a single, easy-to-access location. Site photos can even be placed onto FieldBook pages or uploaded into the project’s Media page.
The WQData LIVE report feature allows data to be shown both graphically and in a tabular format. Report templates can be saved so that specific information can quickly be referenced. Project alarms send email or text messages to project staff for immediate notification of critical conditions. With this unique set of features, WQData LIVE provides everything needed to effectively manage an environmental monitoring application.
RECOMMENDED EQUIPMENTWhile there are plenty of turbidity monitoring instruments on the market, some stand out above the rest. Fondriest Environmental has selected these products as the best in their field for their quality, reliability and value. Together, they provide an advanced and powerful real-time turbidity moni-toring system. For a sensor or sonde, accuracy is of utmost importance and the YSI EXO2 does not disappoint. The rugged NexSens CB-450 offers long-term durability with 30 W of solar power, 450 pounds of buoyancy and a choice of instrument mounts for multiple sensors. Alone, real-time data are good, but with remote data collection, 24/7 access from any computer, instant alarm notifica-tions and trend tracking, the intuitive WQData Live takes real-time data to the next level.
1514 FONDRIEST .COMMONITORING TURBIDIT Y

When managing a large or long-term dredging project, purchasing several turbidity monitor-ing systems is often the most economical option. However, for short-term dredging projects on a tight budget, it may not be practical to purchase the necessary turbidity monitoring equipment. In these situations, it is much more prudent to rent real-time monitoring systems. With several lease duration and extension options available, the flexibility of renting turbidity monitoring systems may still be cost-effec-tive for the larger dredging applications as well.
Turbidity monitoring equipment can be rented instrument by instrument, or as an entire system, calibrated and ready to deploy on arrival. Rental equipment can include sensors, sondes, handheld displays, data buoys and web-based datacenter access. Real-time telemetry via radio-to-shore, cel-lular and satellite can also be incorporated. A large rental pool also means that most turbidity monitor-ing equipment can be shipped same-day for quick deployment and emergency situations.
Just as with Fondriest purchases, rental projects have access to a knowledgeable support staff who will provide personalized service before, during and after the project.
Fondriest Environmental, Inc.2091 Exchange CourtFairborn, OH 45324
tel: 888.426.2151fax: [email protected]
PURCHASE OR RENT?
CompanyLocated in the Lower Great Lakes and Ohio River Valley region, Fondriest Environmental is a leading distributor and integrator of equipment for natural resource professionals and outdoor enthusiasts. Our team of spe-cialists can help customers understand the products they are buying and make the correct decisions out in the field. We seek to understand project needs, devise a comprehensive solution, provide the equipment and know-how to implement it and then offer long-term project support for whatever needs arise.
CapabilitiesWe work closely with NexSens Technology, a company that specializes in the design and manufacture of real-time environmental measurement systems. A variety of sensor, platform and telemetry options are available to fit the unique needs of each project. We can provide complete integrated solutions and support projects from conception to completion. An extensive fleet of rental equipment is also available for short-term project needs.
CertificationsFondriest Environmental is a Certified Repair Center for YSI, NexSens & Fish-Sens, offering quick turnaround, affordable labor rates and personalized service. Our knowledgeable technicians are available for phone, email and onsite support when the need arises.
PublicationsWe cover many customer projects in our Environmental Monitor magazine, which is updated daily online and printed quarterly. We also produce Lake Scientist, an interactive online resource providing research articles and news on lake ecology. Informational pages on environmental parameters and applications are available in the Measurement Sciences section of our website. And FishSens Magazine, available online, provides anglers, boaters and fisheries professionals with the latest fish science news.
CommitmentA commitment to integrity and longstanding customer relations are the standard, rather than the exception, at Fondriest Environmental. We support professionals, educators and researchers who continuously work to monitor and protect our global resources by providing them with the products and services needed to face today’s environmental challenges. Our team of solu-tion-driven experts has years of field experience and a keen eye for finding the best equipment for each application. Contact InformationTo reach an application specialist, please call (888) 426.2151 or email [email protected]
ABOUTFONDRIEST
1716 FONDRIEST .COMMONITORING TURBIDIT Y

SYSTEM CONFIGURATION TOOL
Contact Information
Site Conditions
Fondriest application specialists will assist with tailoring buoy configuration and equipment choices on a site-by-site basis to ensure reliability and proper data management. The ques-tionnaire below can help you get started. Once completed, this form can be faxed to (937) 426.1125 or, if completed digitally, emailed to [email protected].
Describe the site conditions in a paragraph or two. Please include details regarding levels of wind, waves and boat traffic experienced in the area.
Name:
Organization:
Telephone:
Email:
Site LocationThe location of a monitoring system can affect what buoy configuration best suits the conditions. Please select in what type of water body the system will reside.
Lake CoastalRiver
Water Column MeasurementsMeasuring turbidity at a single mid-level depth is often sufficient for dredge monitoring. In some cases, however, regulatory agencies may require readings at multiple depths.
Single Depth Multiple Depths Please Specify
TelemetryLicense-free spread-spectrum radio telemetry allows communication with a shore-side NexSens radio base station as far as five miles line-of-sight from the monitoring site. Cellular telemetry allows greater geographic flexibility and is able to transmit from almost anywhere in the U.S., but it includes the cost of a cellular data plan. Satellite telemetry can be used nearly anywhere in the world, but it tends to have the highest data cost compared with cellular telemetry.
Cellular Radio Satellite None
Project Length (Rental vs. Purchase)Although it often makes sense to purchase systems outright, many short-term dredging projects make it cost-prohibitive. Fondriest Environmental offers real-time turbidity monitoring systems with weekly and monthly rental rates to accommodate these operations. An application specialist can make recommendations on what choice is most cost-effective.
1-3 Months 3-6 Months 6-12 Months >1 Year Please Specify
Quality AssuranceA multi-parameter sonde with turbidity sensor connected to a handheld display is an ideal way to verify the accuracy of a turbidity monitoring system and uses the ISO 7027 method. Alternatively, there are portable turbidimeters that can measure using the EPA-approved 180.1 method.
Multi-parameter sonde & handheld display (ISO 7027 Method) Portable turbidimeter (EPA 180.1 Method)
Approximate DepthThe mooring hardware and cable lengths used for a deployment depends on the distance to the sea floor. An application specialist can develop the best mooring plan to accomodate the approximate water depth.
< 5 ft. Between 25 and 50 ft. > 100 ft.Between 5 and 25 ft. Between 50 and 100 ft.
Other Please Specify
1918 FONDRIEST .COMMONITORING TURBIDIT Y

TAKE YOUR PROJECT TO THE NEXT LEVEL.CONTACT A FONDRIEST APPLICATION SPECIALIST
888.426.2151
when your
demandsresearchquality data
Fondriest Environmental, Inc.2091 Exchange CourtFairborn, OH 45324
P 888.426.2151
F 937.426.1125
PRSRT STDUS POSTAGEPAIDDAYTON, OHPERMIT# 860
![The VELCO STATCOM-Based Transmission System … Statcom Based...The VELCO STATCOM-Based Transmission System Project ... in the states of Vermont [16], Texas and California ... power](https://img.pdfslide.us/doc/110x75/5ae039447f8b9af05b8d62b1/the-velco-statcom-based-transmission-system-statcom-basedthe-velco-statcom-based.jpg)