Embed Size (px)
Citation preview
DOT-TST-77-82
VEHICLE SAFETY TELEMETRY
FOR AUTOMATED HIGHWAYS VEHICLE SAFETY TELEMIETRY N78'-15952(NASA-CR-155536)
FOR AUTOMATED HIGHWAYS Final Report, Dec. 1976 - Sep. 1977 (Jet Propulsion Lab.) 93 p
CSCL 13F UnclasHC A05/MF A01 G3/85 578-09
Of~Tt4 4 %
gzo0
NOVEMBER 1977
FINAL REPORT
Document is available to the U.S. public through the National Technical Information Service,
Springfield, Virginia 22161
Prepared for
U.S. DEPARTMENT OF TRANSPORTATID OFFICE OF THE SECRETARYt,- ,
Office of Telecommunications - 4
Washington, D.C. 20590 fo\,,§,
https://ntrs.nasa.gov/search.jsp?R=19780008009 2020-04-19T13:29:46+00:00Z
Technical Report Documentation Page
1. Report No. 2. Government Accession No. 3. Recipient's Catalog No. DOT-TST-77-82
A. Title and 5ubtitl. 5. Re~ort Dote
VEHICLE SAFETY TELEMETRY November 15, 19776. Performing Orgaizotion CodeFOR AUTOMATED HIGHWAYS
S. Performing Organization Report No.
7. Author's) George R. Hansen JPL Publication 77-57
10. Work Unit No. (TRAIS)9. Performing Organization Name and Address
Jet Propulsion Laboratory11. Contract or Grant No.DOi4S7024800 Oak Grove Drive MA7-100,
Pasadena, California 91103 13. Type of Report and Period Covered
12. Sponsoring Agency Name and Address Final Report U.S. Department of Transportation Dec. 1976 through Sept. 1977
Office of the SecretaryS.W. 14. Sponsoring Agency Code400 7th Street,
Washington, D.C. 20590 TST-48
15. Supplementary Notes
16. Abstract The concept of automated highways providing the means for motor vehicles
to travel between interurban centers without active driver participation has been
forwarded by many investigators. Breakdowns of the vehicles using such a highwayThe propercould be hazardous to life or, at the least, interrupt traffic flow.
operation of a vehicle approaching an automated highway would have to be assessed
to a high degree of certainty tefore that vehicle could be allowed entry.
This report summarizes the results of a study of several areas germane to
The current state-of-the-art of automaticthe automated highway and vehicle system.
vehicle testing and diagnosis was investigated and it was determined that the
emphasis is primarily centered on the proper operation of the engine. Lateral and
longitudinal guidance technologies, including speed control and headway sensing for
collision avoidance, were reviewed. The principal guidance technique remains the
Speed control and headway sensing, even though they show the same basicburied wire. elements in the braking and fuel systems, are proceeding independently.
The applica
tions of on-board electronic and microprocessor techniques were investigated and here
again each application (emission control, spark advance, or anti-slip braking) is
The final portion of the report presentsbeing treated as an independent problem.
various processor systems leading to a proposed unified bus system of distributed
processors for accomplishing the various functions and testing required for vehicles
equipped to use automated highways.
I8.Distribution Statement17. Key Words
Available to the Public Through the Automated highway, vehicle safety, National Technical Information Service telemetry, lateral guidance, speed Springfield, Virginia 22161
control, diagnostics, microprocessors
19. Security Cl1ssif. (of this report) ReZ.Secuity of ofte i page) 2.N Unclassified IUnclassified 9
Form DOT F 170D.7 (8-72) Repwoductioti of comnpleted page authorized
NOTICE
This document is disseminated under the sponsorship'of the U. S.Department of Transportation in the interest of information exchange.The United States--Government assumes no-liability for the contents orthe use thereof.
The United States government does not endorse products or manufacturers. Trade or manufacturers' names appear herein solely becausethey are considered essential to the object of this report.
ACKNOWLEDGEMENT
This work presents the results of research conducted at the JetPropulsion Laboratory, California Institute of Technology, for theDepartment of Transportation under Reimbursable Agreement No. DOT-AS-70012,by agreement with the National Aeronautics and Space Administration.
FOREWORD
The concept of interurban, 100- to 400-mile, automated highways-
has been studied by several investigators. The highway systems fore
casted, as a result of these studies, would have some or all lanes
equipped for lateral guidance and longitudinal speed control. Any
breakdown, whether sudden or gradual, would cause a flow blockage and
could be extremely hazardous to vehicles which are following or in
adjacent lanes. Therefore, so that the operations, safety, and traffic
flow are maintained, the entry of improperly performing, incompletely
equipped, or potentially unreliable vehicles should be discouraged or
prevented.
The judgment as to the proper operation criteria being met by(1) because of thethe vehicle obviously cannot be left to the driver:
driver's inability to determine if the automatic equipment is performing
adequately, while the vehicle is under manual control; (2) because of
driver acquired tolerance for marginal performance; and (3) because of
driver impatience about the' possibility of a delay. An automatic test
and checkout procedure is, therefore, called for prior to the entry of
the vehicle onto the automated highway. These tests may require manual
intervention in a test facility, be performed semi-automatically, or be
accomplished "on the fly" without driver involvement.
Several areas of technology relating to vehicles and automated
highways were investigated and the results are presented in this report.
It was determined which vehicular sensors are in current use and which
are forecast for future use.. The applications of these sensors for
both on vehicle equipments and in several off-vehicle test and diagnosisThe operations and test philosophiessystems were also investigated.
of current test-systems are presented, as well as the possible incorporation
of these systems or sensors into on-board checkout systems.
Lateral and longitudinal guidance methodologies, as well as speed
control and headway sensing techniques were reviewed. It appears that
the sensors for automotive lateral guidance are not common to any other
vehicular sensor systems while longitudinal guidance, speed, and headway
controls share similar basic elements in the engine fuel supplying and
braking areas. These technologies were reviewed to estimate the sort of
criteria that should be established in allowing or denying entry of
vehicles to an automated highway. The criteria for rejecting vehicles
on the basis that all subsystems are not working correctly can be estab
lished by wayside or on-board checkout or diagnostic systems. Denial of
entry to a vehicle, based on the estimate that it probably cannot complete
the journey, requires an assessment of the remaining operating life in
all critical operating subsystems or elements. This requires that
historical replacement data and degree of usage be provided, as well as
the subsystems operational checks being performed before an estimate canThe sensed indicabe made that a particular vehicle is likely to fail.
tions alone, without the parts life data, appears insufficient to establish
that entry is warranted.
iii
- - - - - - - - - - - - - - - - - - - - - - - - - - - - - - - - - - - -
I 1.-1
RECEDING PAGE BLANK NOT FILMED
CONTENTS
DIAGNOSTIC TECHNOLOGIES ------------------------------------
A. INTRODUCTION ------------------------------------------ 1-1
B. SENSORS AND SYSTEMS ---------------------------------- 1-1
1. Sensors ---------------------------------------------- 1-3
2. Systems ---------------------------------------------- 1-9
I. GUIDANCE TECHNOLOGIES -------------------------------------- 2-1
A. INTRODUCTION ----------------------------------------- 2-1
B. LATERAL GUIDANCE ------------------------------------- 2-1
1. Single Buried Wire ----------------------------------- I21
2. Parallel Wire Pairs ---------------- ----------------- 2-5
3. Buried Wire Pair (Radio Frequency) ------------------- 2-6
4. Vehicle Excited Wires -------------------------------- 2-7
5. Shaped Antennas -------------------------------------- 2-7
6. Magnetic "Nails -- 2-8
7; Magnetic Rods ---------------------------------------- 2-9
8. Optical Reflectors ----------------------------------- 2-9
9. Mechanical Grooves ----------------------------------- 2-10
10. Mechanical Fin --------------------------------------- 2-10
11. Acoustic Discontinuity ------------------------------- 2-12
C. LONGITUDINAL GUIDANCE -------------------------------- 2-12
1. Two Frequency Method --------------------------------- 2-13
2. Helically Wound Wire Pair ---------------------------- 2-14
3. Transposed Wires ------------------------------------- 2-15
4. Single Wire With Shaped Return ----------------------- 2-15
D. FIDUCIAL INDEXES ------------------------------------- 2-16
v
1. Passive Markers -------------------------------------- 2-16
2. Active Markers ---------------------------------------- 2-16
E. AUTOMOTIVE ELEMENTS ---------------------------------- 2-17
1. Lateral Sensors -------------------------------------- 2-1
2. Signal Conditioning ---------------------------------- 2-17
3. Processing ------------------------------------------- 2-18
4. Steering --------------------------------------------- 2-18
F. SPEED CONTROL ---------------------------------------- 2-19
1. Sensors ---------------------------------------------- 2-20
2. Signal Conditioning ----------------------------------- 2-20
3. Processing ------------------------------------------- 2-21
G. HEADWAY SENSORS -------------------------------------- 2-21
H. ACTUATORS -------------------------------------------- 2-22
I. GUIDANCE-BASED TESTING ------------------------------- 2-22
III. PERFORMANCE CRITERIA --------------------------------------- 3-1
A. INTRODUCTION------------------------ ----------------- 3-1
B. HIGHWAY ENTRY CRITERIA ------------------------------- 3-1
1. Dynamic Performance ---------------------------------- 3-1
2. Static Performance ----------------------------------- 3-2
3. Indications ------------------------------------------ 3-3
4. Sensed Parameters ------------------------------------ 3-3
5. Failures and Replacements ---------------------------- 3-3
6. . Breakdowns ------------------------------------------- 3-6
7. Summary -------------------------------------------- 3---37
C. PRECISION OF MEASUREMENTS ---------------------------- 3-8
D. TESTING AND DIAGNOSIS -------------------------------- 3-9
1. Vehicular Electronic Subsystems ---------------------- 3-11
vi
-------------------------
3-122. Safety Telemetry Systems -----------------------------
REFERENCES ----------------------------------------------------
5-1BIBLIOGRAPHY ----------------------------------------------------
APPENDIX
A. SURVEY OF AUTOMOTIVE SENSORS ------------------------- A-I
Figures
1. Fluid Level Switch - --------------------------------- 1-5
2. Maintenance Indicator System Panel ------------------- 1-11
1-143. Autosense Console -----------------------------------
4. Vehicle Harness Connections -------------------------- 1-16
1-185. Operator's Hand Held Control
6. Test Report Printout --------------------------------- 1-19
7. Diesel Speed Time Curves, No Load -------------------- 1-22
8. BMS 1000 Bus Maintenance System ---------------------- 1-25
9. IDEA System ------------------------------------------ 1-27
1-2910. STE-ICE Unit -----------------------------------------
11a. Magnetic Field Lines --------------------------------- 2-3
11b. Amplitude Sensor Coils ------------------------------- 2-3
12a. 4
12b. Proportional Output ---------------------------------- 2-5
-------- 2-6
Phase Sensitive Detector ----------------------------
13a. Horizontal Component Detector for 2-Wire Pair
13b. Transposed Pair -------------------------------------- 2-7
2-814. Vehicle Excited Loops --------------------------------
Magnetic Nails or Rods ------------------------------- 2-915.
16. Optical Reflectors ----------------------------------- 2-10
vii
17. Mechanical Groove ------------------------------------ 2-11
18. Mechanical Fin --------------------------------------- 2-11
19. Acoustic Discontinuity ------------------------------- 2-12
20a. Two Frequebcy Wire -Pair----------- ------------------- 2- 3
20b. Phase Pattern ---------------------------------------- 2-13
21a. Helical Wire ----------------------------------------- 2-14
21b. Two Wire Pair ---------------------------------------- 2-15
22. Speed Control Block Diagram -------------------------- 2-19
23. Individual Vehicle Processors ------------------------ 3-14
24. Safety Telemetry Processor - Input Data Only --------- 3-15
25. Central Vehicle Processor ---------------------------- 3-16
26. Identibal Processors --------------------------------- 3517
27. Bus Processor Configuration -------------------------- 3-18
Tables
1. MIS Measurements ------------------------------------- 1-12
2. Autosense Measurement Specifications ----------------- 1-20
viii
SECTION I
DIAGNOSTIC TECHNOLOGIES
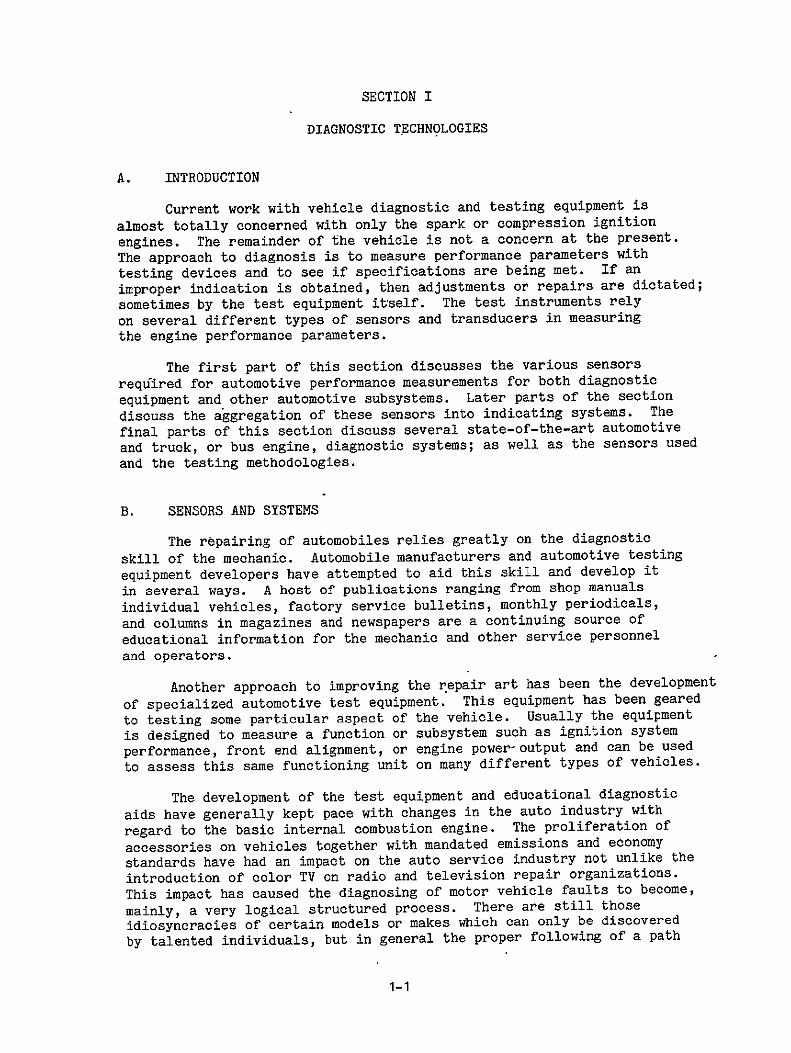
A. INTRODUCTION
Current work with vehicle diagnostic and testing equipment is
almost totally concerned with only the spark or compression ignition
engines. The remainder of the vehicle is not a concern at the present.The approach to diagnosis is to measure performance parameters with
testing devices and to see if specifications are being met. If an
improper indication is obtained, then adjustments or repairs are dictated;
sometimes by the test equipment itself. The test instruments rely
on several different types of sensors and transducers in measuringthe engine performance parameters.
The first part of this section discusses the various sensors
required for automotive performance measurements for both diagnostic
equipment and other automotive subsystems. Later parts of the section
discuss the aggregation of these sensors into indicating systems. The
final parts of this section discuss several state-of-the-art automotive
and truck, or bus engine, diagnostic systems; as well as the sensors used
and the testing methodologies.
B. SENSORS AND SYSTEMS
The repairing of automobiles relies greatly on the diagnostic
skill of the mechanic. Automobile manufacturers and automotive testing
equipment developers have attempted to aid this skill and develop it
in several ways. A host of publications ranging from shop manuals
individual vehicles, factory service bulletins, monthly periodicals,
and columns in magazines and newspapers are a continuing source of
educational information for the mechanic and other service personnel
and operators.
Another approach to improving the repair art has been the development
of specialized automotive test equipment. This equipment has been geared
to testing some particular aspect of the vehicle. Usually the equipment
is designed to measure a function or subsystem such as ignition system
performance, front end alignment, or engine power-output and can be used
to assess this same functioning unit on many different types of vehicles.
The development of the test equipment and educational diagnostic
aids have generally kept pace with changes in the auto industry with
regard to the basic internal combustion engine. The proliferation of
accessories on vehicles together with mandated emissions and economy
standards have had an impact on the auto service industry not unlike the
introduction of color TV on radio and television repair organizations.
This impact has caused the diagnosing of motor vehicle faults to become,
mainly, a very logical structured process. There are still those
idiosyncracies of certain models or makes which can only be discoveredby talented individuals, but in general the proper following of a path
1-1
through a diagnosis "tree" structure will lead to the malfunction(Ref. 1). These diagnostic trees are a series of tests, which lead tocertain indications of either improper or faulty operation, dictatedprimarily by a complaint or improper function. The path through thetree is therefore determined, through the logical elimination of possiblecontributors to the faulty action, leading to the actual cause of theproblem. The successfuI use if these iagnostic trees relies on makingall of the tests called for and noting the results. Playing hunches*or skipping steps has no place in the use of these aids.
So that the tests can be properly made, the test equipment manufacturers have developed many types of instruments and sensors. Theyhave also combined and assembled these instruments into unified testconsoles, usually mobile, to facilitate using the equipment near thevehicle. These unified test equipments are available from several manufacturers. The types of functions they are designed to measure are:
(1) Ignition .timing.
(2) Primary coil voltage.
(3) Voltage waveshape of primary coil.
(4) Secondary coil voltage.
(5) Voltage waveshape of secondary coil.
(6) Ignition point dwell angle.
(7) Ingition point resistance (closed).
(8) Alternator output voltage.
(9) Alternator field current (voltage).
(10) Battery voltage - cranking.
(11) Battery voltage - charging.
(12) Starter voltage.
(13) Starter-current.
(14) Fuel pump pressure.
(15) Engine speed.
(16) Intake manifold depression (vacuum)
(17) Air-fuel mixture
(18) Exhaust CO (carbon monoxide)
(19) Exhaust HC (hydrocarbons)
1-2
The functions listed are those necessary to ascertain the causes
-of the vast majority of common complaints concerning the ignition,
charging, engine electrical, and engine fuel systems.
1. Sensors
a. The use of sensors on automotiveAutomotive Sensors.
vehicles, until recently, was to merely operate instruments or to prothe opervide other indications of vehicle performance or condition to
ator. Speedometer, fuel level and temperature gauges were all that
were usually provided,.together with "no-charge" and low oil pressure
warning lights, and a high beam indicator. The incorporation of more
and- more accessories, emission controls, safety equipment, and diagnostic
test points have resulted in a substantial increase in the on-board
sensor complement. The requirement for additional sensors.for safety
and automatic equipment will undoubtedly increase, particularly with the
increasing use of microelectronics.
The parameters measured in the past includbd pressure (oil),
current (battery), voltage (charging regulator),temperature (coolant), fluid level (gasoline), rotational velocity (speedometer), linear motion
(brake light switch), and other switch position indicators. With the
exception of a few special purpose parameter measurements, the mentioned
parameters are still of principal importance, but in much greater number.
b. Level Sensors. Remote indicating level*sensors have foundsomeapplication primarily in military vehicles, but there has been
The leyel sensor avoids the useapplication in civilian vehicles.
of dipsticks and allows fluid reservoirs to be placed without consideration
for visual inspection. Level sensors in current-use are:
(1) Coolant (Radiator)
(2) Coolant (Reservoir)
(3) Transmission Fluid
(4) Brake Master Cylinder(s)
(5) Brake Fluid Reservoir
(6) Power Steering Fluid
(7) Lubricating Oil
(8)- Fuel Level
(9) Windshield Washer Fluid
(10) Differential Lube
(11) Battery Electrolyte
1-3
The battery electrolyte level sensor may be thought of as a switchcontact or voltage probe because it is a metallic conductor which piercesthe wall of the battery. The metal contact on the inside wall is positioned at the low limit of electrolyte. When the electrolyte levelis above or "wetting" the contact, the contact senses the electricalpotential of the electrolyte. When the electrolyte level drops belowthe low limit, due to water lots for example, the contact is open circuitedand no voltage is sensed. This technique has been employed on theVolkswagen and Toyota vehicles.
The most familiar level sensor which provides an analog output isthe fuel sensor. This is generally a rheostat gauge where the moveablearm of the rheostat is operated by a float which rests on the surface ofthe fuel. The varying resistance of the rheostat, as fuel level changes,controls a current to a remote fuel gauge. Other level sensors proposedfor this function and developed for aircraTt or other uses include floatoperated switches and acoustic or capacitance operated level sensors.
A fuel capacitance sensor is currently under development byGeneral Motors (Ref. 2). The sensing element consists of two coaxialcylindrical tubes immersed vertically into the fuel. The dielectricconstant of gasoline is about twice that of air and the change incapacity (empty to full) is purported to be about two to one (60 to130 pf). This capacity is compared in a circuit with a standard capacitor.The circuit develops a pulse train with the duration (width) of thepulses proportional to the capacitance or the fuel level sensed.
Acoustic sensors have not received attention for automobile application. The principle relies on the excellent reflectivity of the fuel/airinterface to an acoustic pulse. The time delay of an acoustic pulse,from transmission to return, determines either the height of the fluidor the distance to the fluid depending on where the transducer is placed.The time delay and the speed of sound (in fuel or air) yields the physicaldistance and therefore the fluid level. This technique is usuallyreserved for hazardous or corrosive fluids.
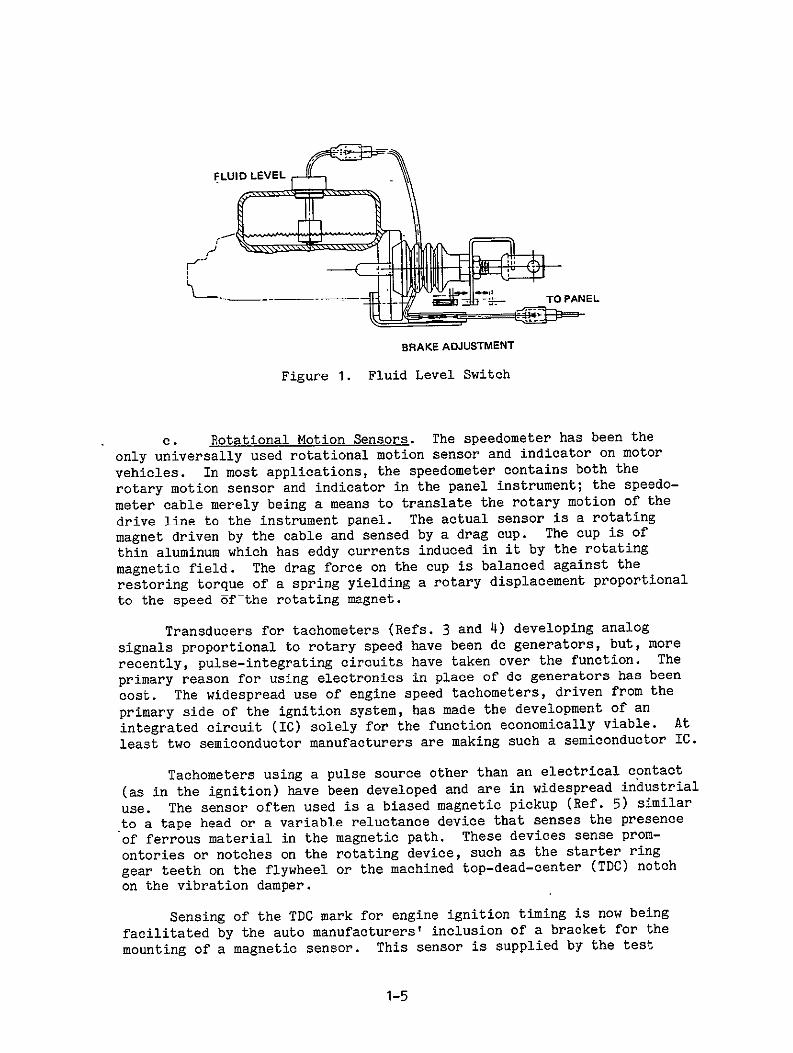
The float operated switch is in current use in automotive application and in one form consists of a non-ferrous L-shaped tube whichcontains a magnetic reed switch (see Figure I). The tube is closedon one end but the other is open to allow egress for the switch wires.A cylindrical, plastic float with an axial hole rides on the L-shapedtube. The float contains a magnet so that when it reaches a certainposition on the tube the reed switch is actuated. The tube may beplaced with the "1" in the normal position or in the inverted positionand thereby it indicates when the sensed level is either below or abovethe desired position.
In deep tank applications, the float switch is installed on along tube containing several switches. Several discrete levels canthen be sensed.
1-4
tTOPANEL
BRAKE ADJUSTMENT
Figure 1. Fluid Level Switch
c. Rotational Motion Sensors. The speedometer has been the
only universally used rotational motion sensor and indicator on motor
vehicles. In most applications, the speedometer contains both the
rotary motion sensor and indicator in the panel instrument; the speedo
meter cable merely being a means to translate the rotary motion of the
drive line to the instrument panel. The actual sensor is a rotating
magnet driven by the cable and sensed by a drag cup. The cup is of
thin aluminum which has eddy currents induced in it by the rotating
magnetic field. The drag force on the cup is balanced against the
restoring torque of a spring yielding a rotary displacement proportional
to the speed of the rotating magnet.
Transducers for tachometers (Refs. 3 and 4) developing analog
signals proportional to rotary speed have been do generators, but, more
recently, pulse-integrating circuits have taken over the function. The
primary reason for using electronics in place of do generators has been
cost. The widespread use of engine speed tachometers, driven from the
primary side of the ignition system, has made the development of an
integrated circuit (IC) solely for the function economically viable. At
least two semiconductor manufacturers are making such a semiconductor IC.
Tachometers using a pulse source other than an electrical contact
(as in the ignition) have been developed and are in widespread industrial
sensor often used is a biased magnetic pickup (Ref. 5) similaruse. The to a tape head or a variable reluctance device that senses the presence
of ferrous material in the magnetic path. These devices sense prom
ontories or notches on the rotating device, such as the starter ring
gear teeth on the flywheel or the machined top-dead-center (TDC) notch
on the vibration damper.
Sensing of the TDC mark for engine ignition timing is now being
facilitated by the auto manufacturers' inclusion of a bracket for the
mounting of a magnetic sensor. This sensor is supplied by the test
1-5
mounting of a magnetic sensor. This sensor is supplied by the testequipment manufacturer and, when installed, permits direct reading ofengine advance or retard on the test meter.
In a similar manner a flywheel ring gear sensor is being usedby engine diagnostic devices for power-contnibution tests. The-manyteeth on this gear allow the changes in angular accelerations to bedetermined, to fair precision, during a revolution. The relative forcescontributed by the different cylinders during engine revolutions canthen be determined.
Two of the magnetic pickups - one at each end of the driveline allow not only rotation but angular displacement, as a result of torqueto be measured. This technique is currently being developed for marineand industrial engines to provide a continual measure of horsepoweroutput.
Other rotational speeds being measured for automatic diagnosis areprimarily in the heater/air-conditioning system. These are fan-motorvelocities which are measured together with the current and voltage todetermine proper operation.
Electric engine coolant fan speed as well as power-steering pumpand air-conditioner compressor speed are future candidates for velocitymeasurements. The latter two could provide a rapid indication of abroken drive belt.
In the area of a anti-skid brake system for trucks (Ref. 6) considerable work has been done to develop sensors which measure wheel velocity(relative to a fixed point on the vehicle) as part of a system to preventwheel lock-up when brakes are applied ....especially in panic situations.In conjunction-with this, some rather sophisticated proximity and velocitysensors have been developed which might have application in other areasof safety measurement ....such as steering or suspension checkout.
d. Switch Sensors. Mechanical switches are now being used forthe operation of safety-related indicators. The same type of doorswitches, which operate the dome light, is also used to operate a "doorunlocked" indicator by sensing the push-button control position. Thissame switch type is also used to monitor a partially open door, hood,or trunk condition for safety or anti-theft purppses.
The OK Panel used on the Toyota and discussed in another part ofthis section utilizes continuity wires molded into the brake lining toindicate when wear has reached a certain point., The .grounding contactbetween the wire in the lining and the rotor or drum on brake application operates as a mechanical switch. The wear limit may be indicatedby contact being made on each brake application, as above, or by.an opencircuit when the wire wears through as the wear limit is reached. Thislatter method does not rely on a contact and can also indicateif the sensor wire is open-circuited.
1-6
--
A linear-motion switch, (which has generally supplanted a pressure
switch) is the stop-light switch. This switch is operated by the ini
tial movement of the brake pedal and is tolerant of a great deal of
over-travel which would occur in the case of low pedal. A switch to
detect low pedal (Refs. 7 and 8) has been employed on military vehicles.
This switch is mechanized by a stationary reed-switch mounted near the
brake master-cylinder linkage. A small magnet on the linkage is posi
tioned to operate the reed switch when pedal travel reaches a pre
scribed limit.
e. Special Sensors. Sensors for special applications,or
parameter measures are in some production vehicles and in research use.
One of the newest, brought about by the triple catalytic converter,
is the lambda sensor (Ref. 9) or oxygen-sensor. This is a zirconium
dioxide electrolyte sensor, which responds to the partial pressure
of oxygen in the exhaust stream. This partial pressure changes by
factors of about io7 td 1019 when the mixture changesfrom slightlyrich to slightly lean. The sensor output, which is typically 800 millivolts
or more on the rich side and less than 100 millivolts on the lean,
is used in a closed-loop fuel injection system to maintain a constant
air/fuel ratio.
The Zirconia Exhaust-Oxygen Gas Sensor consists of a zirconia
-ceramic tube with porous platinum electrodes on both its inner and outercan be insertedsurfaces. One end of the tube is closed, so that it
into the engine exhaust stream. Heat from the exhaust gas is reliedThe sensor begins to operateon to activate the sensor ceramic tube.
excess of 3500C. At this temperature, electrolyticfor exhaust temperature in conduction of oxygen ions occurs in the zirconia tube.
Sensor voltage is self-generated by electrochemical processes.
Under ideal conditions, voltage output of the sensor is given by the
Nernst equation where it is assumed that the exhaust-exposed electrode
has sufficient catalytic activity to fully,equilibrate exhaust gaschemical reactions.
The following features are inherent to the zirconia oxygen sensor:
(1) Rapid transient response-- approximate first-order time
constant of 50 ms.
(2) Fast warmup time -- less than 30 s.
(3) Simple construction -- uses spark plug technology.
(4) Self-generated voltage output signal.
(5) Output signal is easily measured because signal strengths
are hundreds of millivolts, and internal impedances aretypically less than 10 kilohms.
(6) Stoichiometric air-fuel ratio is accurately measured
accuracy typically better than ±0.3 ratio.
1-7
Humidity sensors are required for air-conditioning systems, particularly in demister applications. Humidity also plays a part in adaptivespark-advance (Ref. 10) systems as the amount of water vapor presenteffects the amount of knock-limited advance that can be used.
A direct measure of the mass flow of engine combustion airsimplifies the control of air/fuel ratio (Ref. 11Y. It avoids thenecessity to infer the amount of air entering the engine based onthrottle position, manifold vacuum, and temperature. Mass flow ismeasured by a very low mass propeller (plastic foam) in one researchsystem. The rotational speed of the propeller is a measure of themomentum of the incoming air stream.
Blunt body vortex-shedding devices which measure air velocity arealso being investigated for automotive mass-flow purposes. The rate ofvortex shedding is independent of temperature in these sensors, but truemass flow must still be determined analytically.
A bluff body, vortex-generating rod is placed in the intake airstream and the generated vortices are carried downstream of the rod.An ultransonic beam, with frequency of approximately 150 kHz, is transmittedacross the flowing trail of vortex swirls. The flowing air carriesthe vortices through the acoustic beam.
Amplitude of the received ultrasonic signal is not- constant, butrather, is modulated by passages of the vortices through the acousticbeam. Frequency of modulation of the received signal depends directlyon the frequency of vortex shedding, whereas the modulation depth ofthe received signal depends on relative strengths of vortex disturbances.Since vortex shedding frequency is proportional to flow velocity,measurement of-the frequency of modulation of the received acousticsignal gives a direct indication of air flow velocity.
The following features are inherent to the shedded-vortex air flowsensor:
(1) Wide, linear, 50:1 operating range - typically 1.2 m/s to 60 m/s (11 cfm to 430 cfm through a 6.6 in.2 duct).
(2) Good accuracy -- better than 1%.
(3) Good transient response 570 m/s2 .
- detects flow changes as rapid as
(4) Low pressure drop - less than 0.4 kPa (1.5 in. H20).
(5) No moving parts.
(6) High operating temperature limit - up to 4250C, allowing engine exhaust flow measurements.
(7) Digital output signal -- 150 pps to 15,000 pps, which is a direct indication of volume flow rate:
1-8
2. Systems
Periodic Motor Vehicle Inspection (PMVI). Motor vehicleAdditional
a. inspections on a periodic basis are conducted in 32 states.
states operate on a spot check system. These inspections are not uniform
in scope, application, or standards (Ref. 12). The Clean Air Act of
1970 has given some emphasis to the establishment of periodic emission
Title II of this act provides that-certaininspections (Ref. 13). reductions-of emissions be attained and also that the control devices
have a useful life of at least 50,000 miles. It follows that sufficient
inspections to be statistically significant are required to verify the
performance.
Prior to the addition of emissions to the list of functions to
be checked, vehicle inspections were intended primarily for the purposeThe test emphasisof determining the overall safety of the motor vehicle.
was primarily on braking system elements and performance, tire condia stoption, suspension, and steering. Brake performance is based on
from 20 mph being accomplished within a certain distance (approx. 30
feet) or a floor mounted motor driven roller system is used to measure
the braking torque available from the vehicle wheels (Ref. 14). Wheel
removal is sometimes performed'to measure both drum diameter and lining
thickness or to ascertain disc-brake pad thickness. The flexible
hydraulic lines to each wheel are visually checked as is the fluid level
in the brake system reservoir. Mechanical parking brake linkages and
cables are also visually inspected. Power brake systems are all
inspected for leaks and pump drive belt condition. Pedal effort or
"feel" and reserve is also inspected in some tests.
Suspension tests are primarily visual including the judgment of
the amount of rebound present during a shock absorber jounce test.TireSteering wheel play is sometimes measured but more often felt.
and-wheel play top to bottom and side to side is felt to judge wheel
bearing and steering linkage looseness. This test also purportedly
checks for ball joint wear.
Various miscellaneous visual inspections of lights, windshield
wipers, belts, glass, and body condition are also performed. The funcjudged and sometimes the headtioning of wipers, horns, and lights are
light aiming is measured;
The testing philosophy is based on the opinion that good maintenance
will lessen the chance of accidents caused by equipment malfunction.
A second philosophy not explicitly endorsed is that visual and subjective
tests can in-general determine both good maintenance and mechanical
This second point causes much controversy for the failurecondition. to provide the vehicle operator with a specific diagnosis of a fault
or the part needing repair may cause unnecessary part replacement or
hardship.
The two most populated countries in Arizona (Maricopa and Pima)
have established automatic emission test inspection stations (Ref. 15)These equipments areutilizing self-calibrated diagnostic equipment.
arrayed in multiple bays for each inspection lane. Twelve centers with
1-9
a total of 36 inspection lanes are currently employed. There-is also amobile testing facility for the more remote residents of the twocounties.
The tests measure and record unburned hydrocarbons and carbonmonoxide at both low and high cruise speeds.... The. test requires 5minutes and costs 5 dollars. A hard copy diagnosis and test result isfurnished to the motor vehicle operator to assist in determining thereason for substandard performance. Reinspection, if required, is free.
A similar emission inspection station network employing diagnostictype equipment is scheduled for implementation in the Southern Californiaarea. The start of this program is scheduled for 1978.
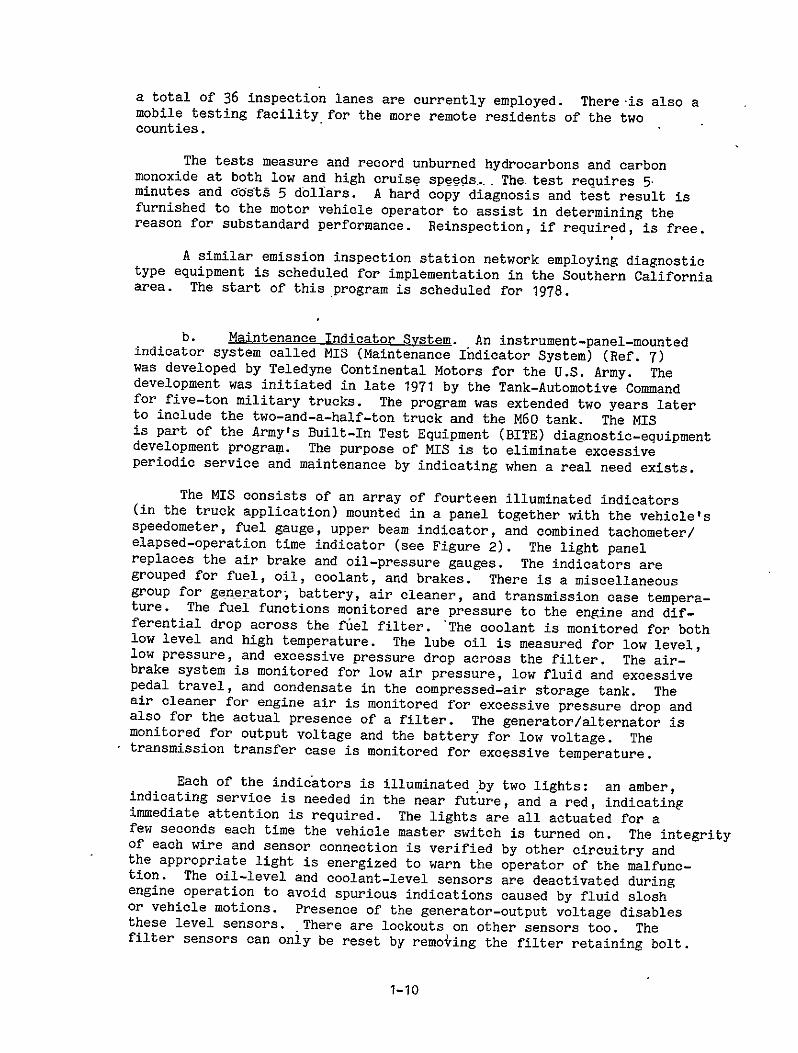
b. Maintenance Indicator System. An instrument-panel-mountedindicator system called MIS (Maintenance Indicator System) (Ref. 7)was developed by Teledyne Continental Motors for the U.S. Army. Thedevelopment was initiated in late 1971 by the Tank-Automotive Commandfor five-ton military trucks. The program was extended two years laterto include the two-and-a-half-ton truck and the M60 tank. The MISis part of the Army's Built-In Test Equipment (BITE) diagnostic-equipmentdevelopment program. The purpose of MIS is to eliminate excessiveperiodic service and maintenance by indicating when a real need exists.
The MIS consists of an array of fourteen illuminated indicators(in the truck application) mounted in a panel together with the vehicle'sspeedometer, fuel gauge, upper beam indicator, and combined tachometer/elapsed-operation time indicator (see Figure 2). The light panelreplaces the air brake and oil-pressure gauges. The indicators aregrouped for fuel, oil, coolant, and brakes. There is a miscellaneousgroup for generator; battery, air cleaner, and transmission case temperature. The fuel functions monitored are pressure to the engine and differential drop across the f6el filter. 'The coolant is monitored for bothlow level and high temperature. The lube oil is measured for low level,low pressure, and excessive pressure drop across the filter. The airbrake system is monitored for low air pressure, low fluid and excessivepedal travel, and condensate in the compressed-air storage tank. Theair cleaner for engine air is monitored for excessive pressure drop andalso for the actual presence of a filter. The generator/alternator ismonitored for output voltage and the battery for low voltage. Thetransmission transfer case is monitored for excessive temperature.
Each of the indicators is illuminated by two lights: an amber,indicating service is needed in the near future, and a red, indicatingimmediate attention is required. The lights are all actuated for afew seconds each time the vehicle master switch is turned on. The integrityof each wire and sensor connection is verified by other circuitry andthe appropriate light is energized to warn the operator of the malfunction. The oil-level and coolant-level sensors are deactivated duringengine operation to avoid spurious indications caused by fluid sloshor vehicle motions. Presence of the generator-output voltage disablesthese level sensors. There are lockouts on other sensors too. Thefilter sensors can oniy be reset by removing the filter retaining bolt.
1-10
30~ 2020 4015 RMt
Figure 2. Maintenance Indicator System Panel
The oil-filter sensor is also not activated after resetting until the oil temperature reaches 1000F.
The various sensors are essentially independent except for theinteractions mentioned before. There is no unifying circuitry to conclude probable causes for multiple indications such as might be the case where a radiator-cooling-fan belt breaks and the generator light comes on followed shortly by the coolant high temperature light.
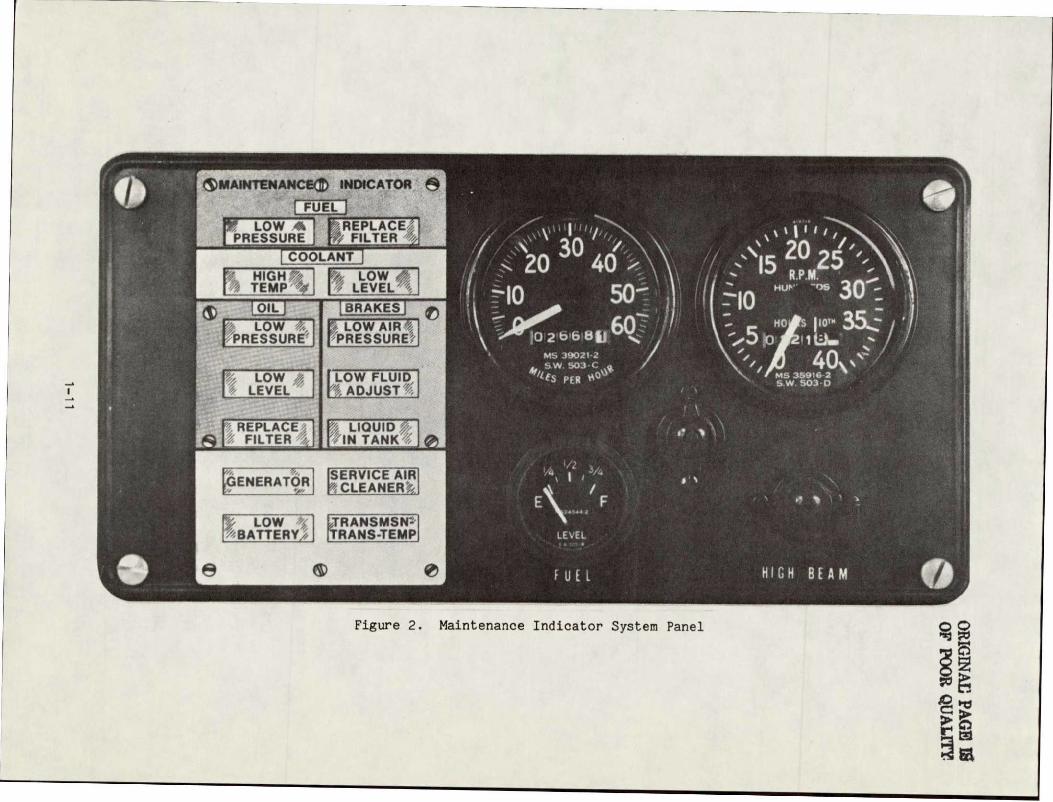
Table 1 is a listing of the MIS functional measurements and the operating limits and tolerances.
Table 1. MIS Measurements
Function Limits
Oil filter restriction 12 ± 2 psi differential
Fuel filter restriction 15 ± 2 psi differential
Air filter restriction 27 ± 15% in. of water
Engine oil pressure 6 ± 2 psig
Engine oil level Gage rod add level ±0.12 in.
Vehicle fuel pressure 1.5 ± 0.5 psig
Coolant temperature 225 ± 5 deg F
Transmission temperature 275 ± 5 deg F
Transfer case temperature 275 ± 5 deg F
Radiator coolant level 0.83 + 0.12 in. below full line
Vehicle air pressure 65 ± 2 psig
Brake fluid level 1.62 ± 0.12 in. below full
Brake adjustment Pedal position 2 in. from full travel
Air reservoir water detection 945 cc (static)
Generator output Generator charge > 6 volts
Battery voltage > 18 volts
1-12
a. OK Monitor (Electro Sensor Panel). The OK Monitor, firstintroduced on the 1973 Toyota, is a driver information diagnostic panelwhich monitors various operational functions (Ref. 16). The systemutilizes 16 different sensors and provides detection of 11 items. Thisindividual warning light system illuminates a part of the panel identifying the fault and a red flashing light attracts the attention of thedriver. Almost all of the sensors are switches indicating a limit hasbeen reached by the change in continuity. Relays are used to sense thecurrent drain of a functioning lamp with the relay contact providing thesensing function if a lamp is open-circuited.
The conditions tested by the OK Monitor are:
(1) Brake pad wear.
(2) Coolant temperature.
(3) Oil level.
(4) Brake fluid level.
(5) Reservoir tank level (brake fluid).
(6) Battery electrolyte level.
(7) Washer fluid level.
(8) Vacuum warning (excessive fuel consumption).
(9) Lamp failures.
(10) Blown fuses.
A switch opening is used to indicate a fault, therefore a wiringor connector fault will be indicated as well as the malfunction.
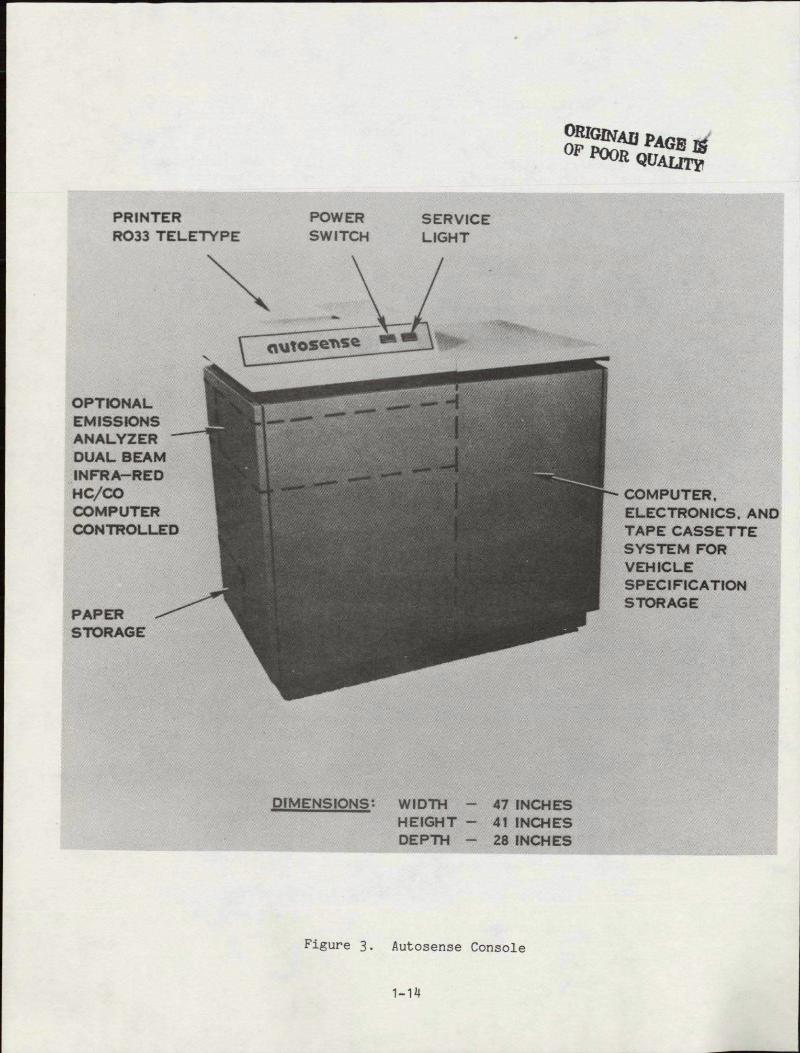
d. tutQsnse. Autosense, manufactured by Hamilton Test Systems,is a computer-based diagnostic instrument used to determine automobilemalfunctions. The Autosense system (see Figure 3) by means of variousparameter measurements and a comparison of these measurements againstcertain limits, identifies probable malfunction causes (Refs. 17 and 18).
The Autosense system consists of a vehicle harness which includesthe sensors and connections required to test the engine performance,the ignition system, the charging system, and the cranking system.These sensors and connection points are:
(1) Vehicle ground.
(2) Plus battery.
(3) Minus battery.
1-13
ORIGJADPAAI Ij
0 4
1-14
(4) Clamp-on current probe.
(5) Timing pickup (Top dead center magnetic pickup or timinglight).
(6) Starter solenoid coil.
(7) Starter solenoid contact.
(8) Starter motor.
(9) Alternator field.
(10) Alternator output.
(11) Voltage regulator field.
(12) Voltage regulator battery.
(13) Ignition coil (battery side).
(14) Ignition coil (points side).
(15) Ignition coil secondary.
(16) No. 1 spark plug.
(17) Intake manifold pressure.
(18) Tailpipe sensor.
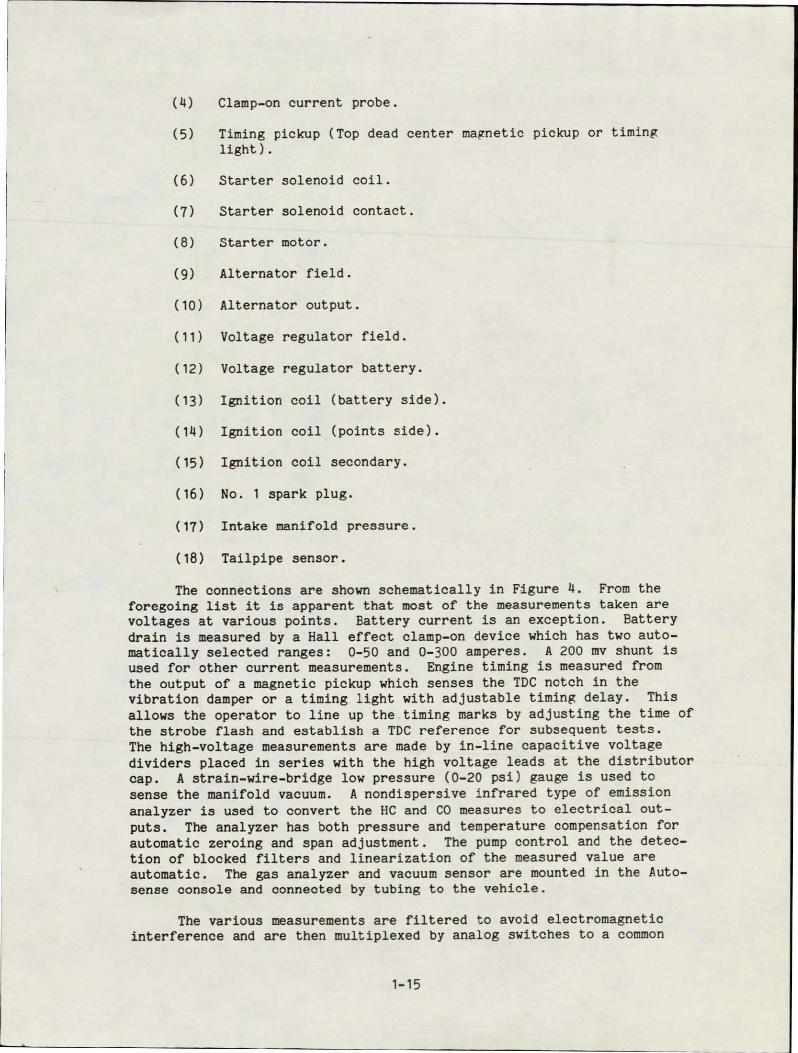
The connections are shown schematically in Figure 4. From theforegoing list it is apparent that most of the measurements taken arevoltages at various points. Battery current is an exception. Batterydrain is measured by a Hall effect clamp-on device which has two automatically selected ranges: 0-50 and 0-300 amperes. A 200 my shunt isused for other current measurements. Engine timing is measured fromthe output of a magnetic pickup which senses the TDC notch in thevibration damper or a timing light with adjustable timing delay. Thisallows the operator to line up the timing marks by adjusting the time ofthe strobe flash and establish a TDC reference for subsequent tests.The high-voltage measurements are made by in-line capacitive voltagedividers placed in series with the high voltage leads at the distributorcap. A strain-wire-bridge low pressure (0-20 psi) gauge is used tosense the manifold vacuum. A nondispersive infrared type of emissionanalyzer is used to convert the HC and CO measures to electrical outputs. The analyzer has both pressure and temperature compensation for automatic zeroing and span adjustment. The pump control and the detection of blocked filters and linearization of the measured value areautomatic. The gas analyzer and vacuum sensor are mounted in the Autosense console and connected by tubing to the vehicle.
The various measurements are filtered to avoid electromagneticinterference and are then multiplexed by analog switches to a common
1-15
GROUND
BATTERY (--- BATTERY (+)
Jj CURRENT PROBE
rQ TIMING PICK-UP & TIMING LIGHT
STARTER SOLENOID COIL VOLTS
CONSLEALTERNATOR OUTPUT VOLTS
ALTERNATOR FIELD VOLTS
VOLTAGE REGULATOR (FIELD)
REGULATOR (BATTERY)
r1~GNgTON COIL VOLTS(SWITCHING)
IGNITION COIL VOLTS
N HIGH VOLTAGE PROBE
0 1 PLUG
(" MANIFOLDI PRESSURE __ ' __I / SENSOR FROM r
OPTIONAL j VACUUM PORT I HC'CO TAILPIPE I SENSOR
Figure 4. Vehicle Harness Connections
1-16
12-bit analog-to-digital converter. The top-dead-center probe or timing light input as well as the coil primary (point opening and closing or transistor switch) and the number one plug voltage are input as times of occurrence by means of start/stop circuits and pulse width to digital converters. Another set of inputs are derived from the electrical outputs of the hydrocarbon and carbon monoxide emission analyzer and are also multiplexed into the 12-bit analog-to-digital converter.
All of the digitized measurements are converted to serial words and supplied to a 16-bit serial computer. The computer has 4100 words (expandable to 8200 words) of random access memory for the diagnosis and parameter comparator programs.
The operator of the Autosense is required to enter vehicle identification data through the hand held control (see Figure 5). This control has a ten-digit keyboard and seven other function keys. Three separate numerical displays present the reference test number, data, limits, instructions, and real time selected measurements to the operator.
A tape cassette and reader are also part of Autosense. This cassette contains manufacturer's reference data for the various measurements, as well as provided or deduced limits for these measures. Data for 5 years past of domestic cars, updated at six month intervals, are available. Similar data are available for the most common foreign automobiles.
After vehicle identity entry, the appropriate cassette is searchedand the specification limits are transferred to the computer memory.The diagnosis is initiated by the operator first entering a code for the particular complaint. The operator is then cued to conduct certain tests involving static key-on, cranking, idling, run-up, and fast idle modes. The results of the tests as well as the high and low limits are printed out as a hard copy vehicle test report (Figure 6). Repair codes are also printed out indicating probable required repairs. The system also allows re-entry to any of the diagnostic tests after repairs have beendone to determine if the out-of-limit condition has been corrected.
The Autosense is intended to be used for tune-ups and periodic maintenance as well as for customer complaints and predelivery preparation. Hookup through complete printout requires some 12 to 15 minutes in the tune-up or maintenance check mode. The measurements, scales and accuracies are shown in Table 2.
e. Diesel Diagnostic System. The Diesel Diagnostic System, orDiesel Sense, also manufactured by Hamilton Test Systems, is an adaptation of Autosense for the checkout of compression ignition engines. The same operator control, console and printer, and essentially the same vehicle or engine harness are used in Diesel Sense as in Autosense. The computer memory is expanded to the full 8192 words and additional tests are provided which are peculiar to diesel engines. Most of the tests that are only associated with spark ignition are eliminated, but provisions are made for glow-plug tests on diesel engines that use these for starting.
1-17
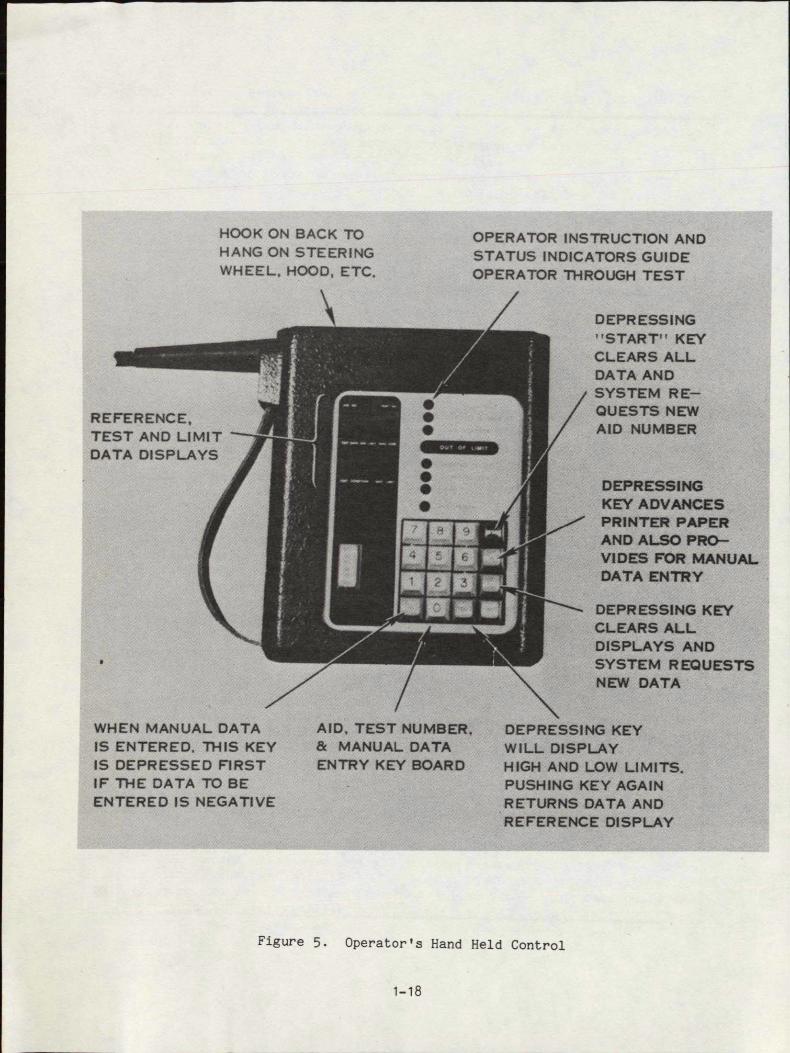
Figure 5. Operator's Hand Held Control
1-18
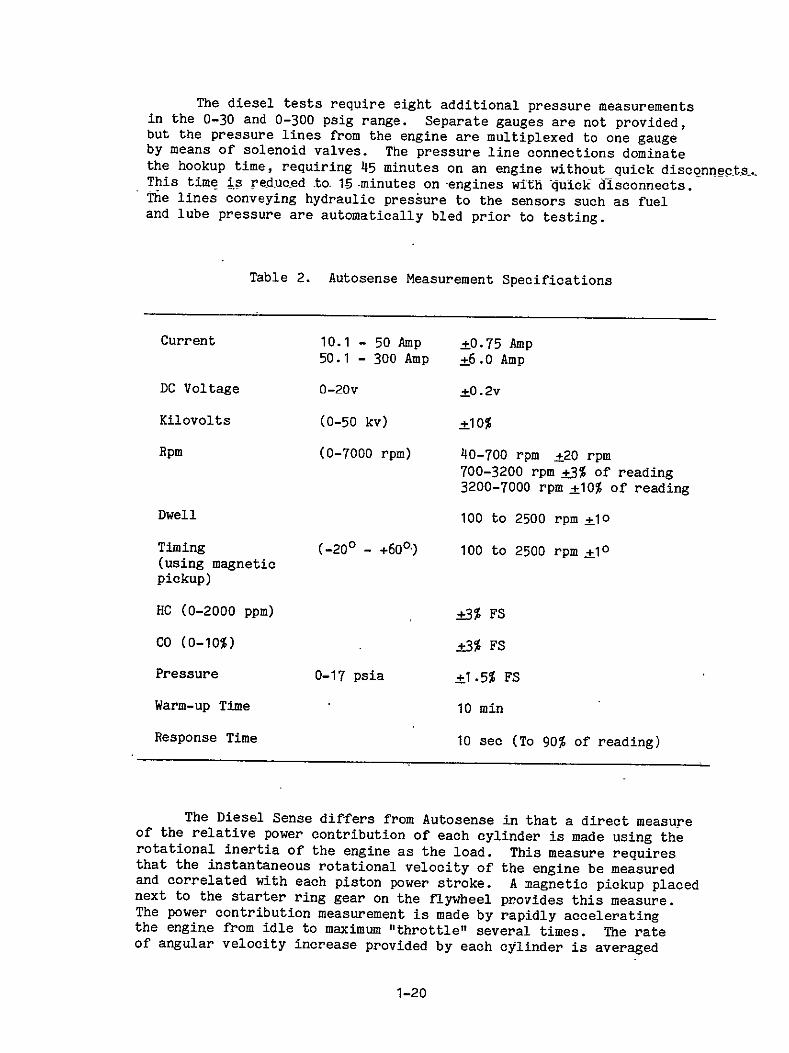
The diesel tests require eight additional pressure measurementsin the 0-30 and 0-300 psig range. Separate gauges are not provided,but the pressure lines from the engine are multiplexed to one gaugeby means of solenoid valves. The pressure line connections dominatethe hookup time, requiring 45 minutes on an engine without quick disconnects.This time is reduced to- -minutes on -engines with -uick disconnects.The lines conveying hydraulic pressure to the sensors such as fueland lube pressure are automatically bled prior to testing.
Table 2. Autosense Measurement Specifications
Current 10.1 - 50 Amp ±0.75 Amp50.1 - 300 Amp +6.0 Amp
DC Voltage 0-20v ±0.2v
Kilovolts (0-50 kv) ±10%
Rpm (0-7000 rpm) 40-700 rpm ±20 rpm
700-3200 rpm +3% of reading3200-7000 rpm ±10% of reading
Dwell 100 to 2500 rpm ±10
Timing (-200 - +600) 100 to 2500 rpm +10(using magneticpickup)
HC (0-2000 ppm) +3% FS
CO (0-10%) +3% FS
Pressure 0-17 psia ±1.5% FS
Warm-up Time 10 min
Response Time 10 see (To 90% of reading)
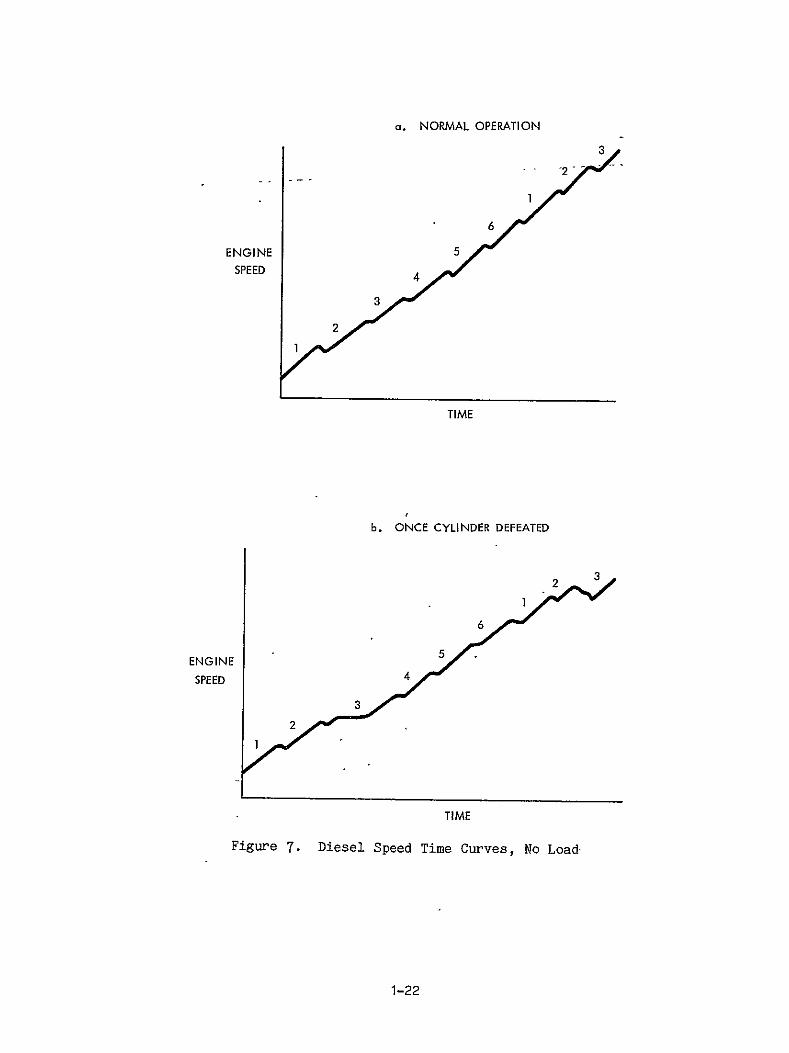
The Diesel Sense differs from Autosense in that a direct measureof the relative power contribution of each cylinder is made using therotational inertia of the engine as the load. This measure requiresthat the instantaneous rotational velocity of the engine be measuredand correlated with each piston power stroke. A magnetic pickup placednext to the starter ring gear on the flywheel provides this measure.The power contribution measurement is made by rapidly acceleratingthe engine from idle to maximum "throttle" several times. The rateof angular velocity increase provided by each cylinder is averaged
1-20
to determine the relative power output of each cylinder. Figure 7adepicts the angular rotation or speed curve versus time during "run
up". The discontinuities on the curve indicate the acceleration contri
bution of each cylinder. Figure 7b depicts the same curve with cylinder
No. 3 defeated and, therefore, not contributing power. Instead of
the acceleration expected, there is actually a deceleration, since
a load on the crankshaft rather than a power contributor.cylinder No. 3 is
blow-by which is measuredOther tests peculiar to Diesel Sense are: by noting the pressure fluctuations at the crankcase filler pipe; turbo
charger boost pressure and drag; injector timing; and, fuel pump calibration.
Diesel Sense is used in the complaint-oriented mode as well as
the tune-up or preventative-maintenance mode. Another planned use
is a quality control check at the end of engine assembly lines.
f. Avis Autosense System. The Avis Autosense System is a
modification of the basic Autosense to orient the device toward a more
automatic screening mode rather than a diagnostic mode (Ref. 19). The
needs of Avis as a large volume purchaser of new cars and vehicle renter
are for a rapid means to check new cars on delivery and ascertain whether
preventative maintenance is required on returned rentals.
The conventional Autosense, according to Avis, was too slow forfor a system which would proceed automaticallytheir needs. The need was
from one test to the next without waiting for printing of intermediate
results. Avis has contracted with Hamilton Test Systems for Autosense
units with increased memory size, modified software, and wider test
limits.
The wider limits were found necessary to provide the necessary
vehicles to satisfy customer demand. Avis found that if new cars were
screened to manufacturers specifications and tolerances, about 85% would
be rejected, primarily for idle speed or timing adjustment. To avoid
the delays in having the out-of-tolerance conditions corrected, wider
limits provided a still driveable vehicle with less than optimum performance.
The rejection rate was reduced to 45%. Regardless of the limits, the
Autosense printouts provide a permanent record of the vehicle parameters,
when delivered, which may be used as the basis for post delivery negoti
ations and possible warranty adjustments.
The new vehicle (less than 1000 indicated miles) checkout involves
some fourteen tests of the engine, ignition, charging, engine electrical,
and emissions. These are all standard test sequences, but in some cases
the tests have been abbreviated. If the odometer indicates more than
1000 miles, then additional tests are performed. These are the relative
compression and the cylinder power contribution tests. Entering the
mileage together with the vehicle ID at the start of the test determines
the sequence to be utilized.
The goal for Avis is a 5-minute checkout including sensor hookup
and the printout of results. The current minimum time achieved is 3 minutes and 5 seconds. This time may be compared with the minimum that
1-21
3
a. NORMAL OPERATION
6
ENGINE 5
SPEED
TIME
b. ONCE CYLINDER DEFEATED
TIME
Figure 7. Diesel Speed Time Curves, No Load,
1-22
Avis mechanics could achieve with conventional oscilloscope-based test
equipment; some 25 minutes. The test sequence is briefly as follows:
(1) Key on.
(2) Cranking - Compression check by means of starter current.
(3) Start and Idle - Makes series of 40-second timing, mixture
and alternator tests.
(4) Run up to 2500 rpm - Additional ignition, timing and emission
tests. Power contribution test.
(5) Automatic shutdown - Printout of results.
The checkout prints data on the performance of the car as received.
If there is an idle speed or timing adjustment called for, these can be
made without calling for diagnostic tests and a checkout test rerun.
Other software changes were a reduction of the power contribution test
from 20 seconds per cylinder to 8 seconds each. The use of heavy fly
wheels by some manufacturers tended to cause a failure indication on
this test even by properly operating engines and software changes to
widen limits were required. The original test sequence also called for
a battery available voltage test immediately after cranking. The test
at this time gave a spuriously low value for battery voltage so the test
time was changed to the end of the idle test; this yielded a more real-theistic value. Prior to the actual sensor check of the vehicle1
operator enters data derived from visual checks. These may include
tires, drive belts, body dents, missing equipment, and glass condition.
These visual check data then become part of the printed record.
The Avis Autosense units are to be equipped with tape cassette
recorders to enable the gathering of statistical data. Each of the test
results will be tape recorded at the individual Avis installations
together with suitable annotation data; date, time, etc. The tapes
will then be forwarded to Avis Headquarters for statistical compilation..
This procedure should allow preventative repair and maintenance strate
gies to be established in response to discover failure or malfunctiontrends.
At present, Avis has units in the four largest markets undergoingThese are San Francisco, Philadelphia, Chicago, andevaluation tests.
New York.
g. Avis Red Box. Prior to Autosense, Avis had experimented This was a drivewith a vehicle checkout system called the "Red Box."
through unit which tested such things as brake performance and lights.
The tread depth of the tires was automatically checked at three points
on the tire footprint. Multiple spring loaded fingers probed the tread
pattern at each point. The difference in penetration was electrically
measured. The characteristics of these sensors limited the speed of the
A tire pressure sensor wasvehicle to less than 3 to 5 miles per hour.
also included. This was a circular plunger that the tire passed over
1-23
which then measured the pressure per unit area of the tire footprint.This device was found to be less accurate than desired. Tread thicknessfor example, had a significant effect. The differing stiffness ofthicker and thinner treads in bridging from the roadway to moveablesensor plungers caused substantial errors in the readings.
A drive over toe-in indicator was also available in the systemat an additional cost.
The "Red Box" required 18 manual inputs in order to run the tests.It was a large unit, physically too big to be installed indoors withthe result that there were many operational difficulties. Many ofthe observations relied on mirrors which clouded-up because of condensation at night. The throughput of the device was slow with the resultthat an operational bottleneck was createa. The operational difficultiesforced the abandonment of the device even though most of the technicalconcepts were and are sound.
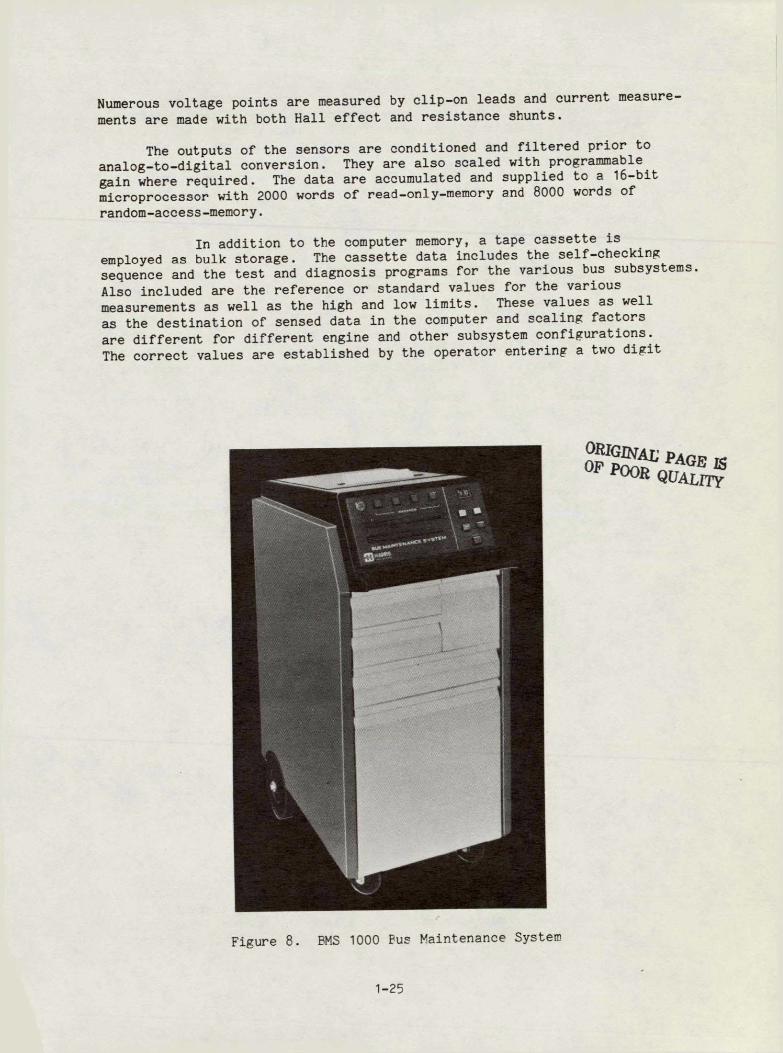
h. Bus Maintenance System. The EMS 1000, manufactured by PRDElectronics in Westbury, New York is a computer based diagnostic systemthat measures and judges the various systems (Refs. 20 and 21) common tointra and inter city buses. The BMS 1000 in passenger bus applicationmakes 58 measurements of the.electrical, engine, air conditioning andheating, air supply and brake, and transmission-converter systems (Ref.-22). The system is intended for use in the periodic maintenance inspection of buses to detect and indicate faulty or out of limit conditions.The system can also indicate needed repairs and verify in-limit performance after repair has been accomplished.
The BMS 1000 is contained in a single cabinet (see Figure 8). Inthe top of the cabinet is a hard copy printer to provide a permanentrecord of the results of the tests. The front panel contains a two-linealphanumeric display to lead the operator through the tests by instructionsand to provide data to the operator. There are also various operationalpush buttons to step through the tests, clear data, or reenter thetest sequence. Hazard indicators are also located on this panel togetherwith an audible alarm. These are to provide immediate action warningsof out-of-tolerance conditions that could cause severe damage to thesystems under t~st. The front of the cabinet contains drawers wherethe various sensors and adaptors for different bus equipments are stowed.
The cabinet is connected by a sensor harness to the bus equipments. In this system, the pressure and vacuum sensors are all locatedat the engine or equipment under test and all connections to the cabinetare , thereby, electrical. The pressure and temperature sensors areconnected to the appropriate points by quick disconnects or at leakproof insertion points. This technique avoids the necessity of bleedinglines, but does subject the expensive pressure and temperature transducers to considerable handling.
The sensors used are platinum resistance thermometers, strain-wirebridge pressure gages, and magnetic proximity sensors for rotating elements.
1-24
Numerous voltage points are measured by clip-on leads and current measure
ments are made with both Hall effect and resistance shunts.
The outputs of the sensors are conditioned and filtered prior toThey are also scaled with programmableanalog-to-digital conversion.
gain where required. The data are accumulated and supplied to a 16-bit
microprocessor with 2000 words of read-only-memory and 8000 words of
random-access-memory.
In addition to the computer memory, a tape cassette isThe cassette data includes the self-checkingemployed as bulk storage.
sequence and the test and diagnosis programs for the various bus subsystems.
Also included are the reference or standard values for the variousThese values as wellmeasurements as well as the high and low limits.
as the destination of sensed data in the computer and scaling factors
are different for different engine and other subsystem configurations.
The correct values are established by the operator entering a two digit
ORI~pA~PAGE i O O QUALrry
Figure 8. BMS 1000 Bus Maintenance System
1-25
identity number at the start of the tests. Other software on the tape includes fault patterns for diagnosis and the applicable diagnosticmessages for the operator. Operator instructions are included on thetape. They are displayed to lead the operator through the tests.
Future plans for the EMS 1000 include the addition of a hand-held two-line display and keyboard. This unit may be carried by the operatorwhile making visual inspections and can serve as an indicator displaying pertinent measures when making adjustments.
i. Integrated Digital Enuine Analyzer. IDEA is an acronym samefor Integrated Digital Engine Analyzer. It is an outgrowth of the
technology which is used in the EMS 1000 (Ref. 23) and it is also a product of the PRD Electronics Division of Harris Corporation (Ref. 24). IDEA is a portable unit contained in two units (see Figure 9) and will operate from line or automotive battery voltage. The portability allowsIDEA to be carried to marine and other non-traction diesel engines.
IDEA relies on a tape cassette to store parameters and programsfor different engine types and operational sequences.
Relative cylinder compression and balance and relative power con
tribution of each cylinder are measured and displayed. Compression is measured by starter current draw as in other systems. Power contribution is determined by measuring the rate of change of angular velocityat the flywheel and correlating it with each piston power stroke. The measurement is taken during no load run-up and averaged over severalaccelerations. Other tests are made of the lube-oil pressure andtemperature, cooling, fuel pump pressures, electrical starting andcharging, brake air, turbo-charger, and combustion air.
The results of the tests together with probable fault diagnosis is made and printed on hard copy. The operator interface unit is ahand-held two-line display with keyboard.
The accuracy of the measurements are:
(1) Pressure ±2% of range
(2) Current ±2% of range
(3) Temperature ±2% of reading, or +20F
(4) Voltage ±1% of range
(5) Speed ±.1% of range or ±3 rpm
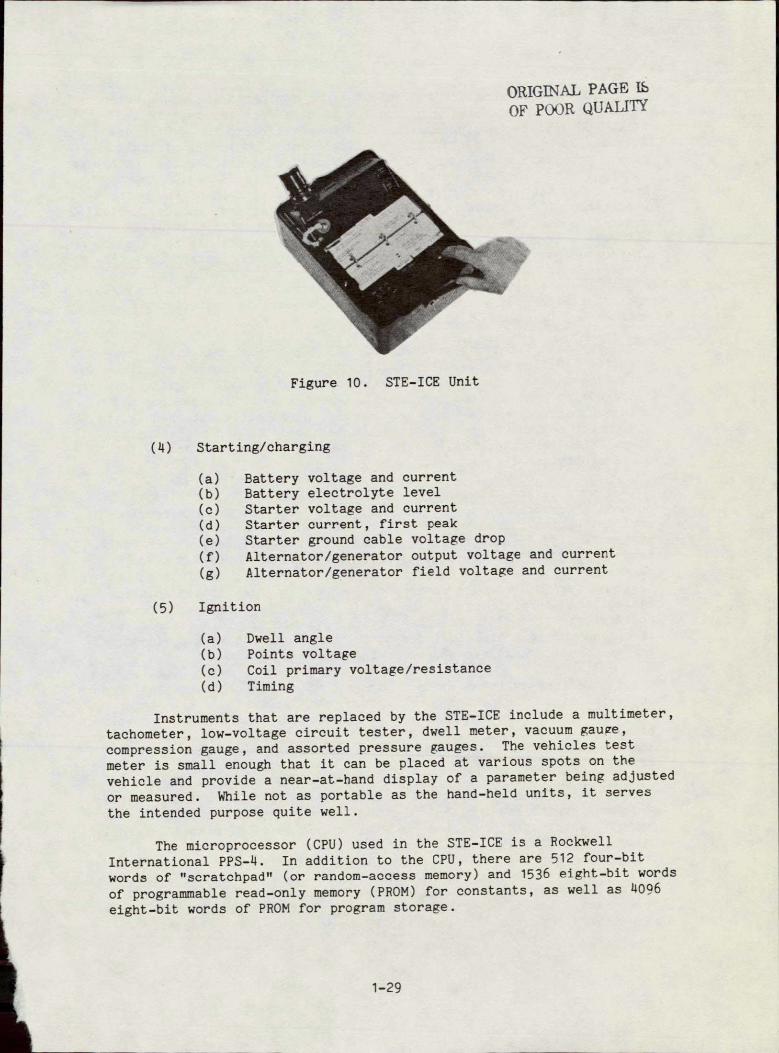
J. Simplified Test Eouinment - Internal Combustion Engine.
The Simplified Test Equipment-Internal Combustion Engine (STE-ICE pronounced "stay-ice") (Ref. 25) is a U.S. Army-sponsored system currently in Low Rate Initial Production status, and is being produced by RCA (Figure 10). The development of STE-ICE was undertaken during the development
1-26
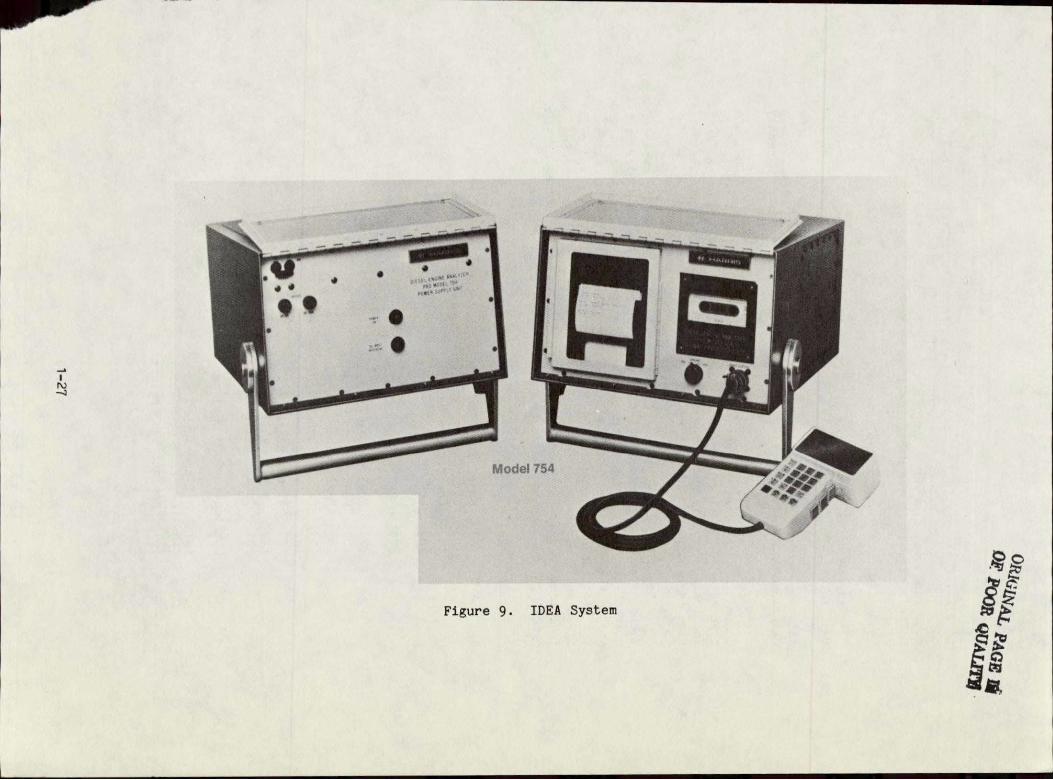
Figure 9. IDEA System 4
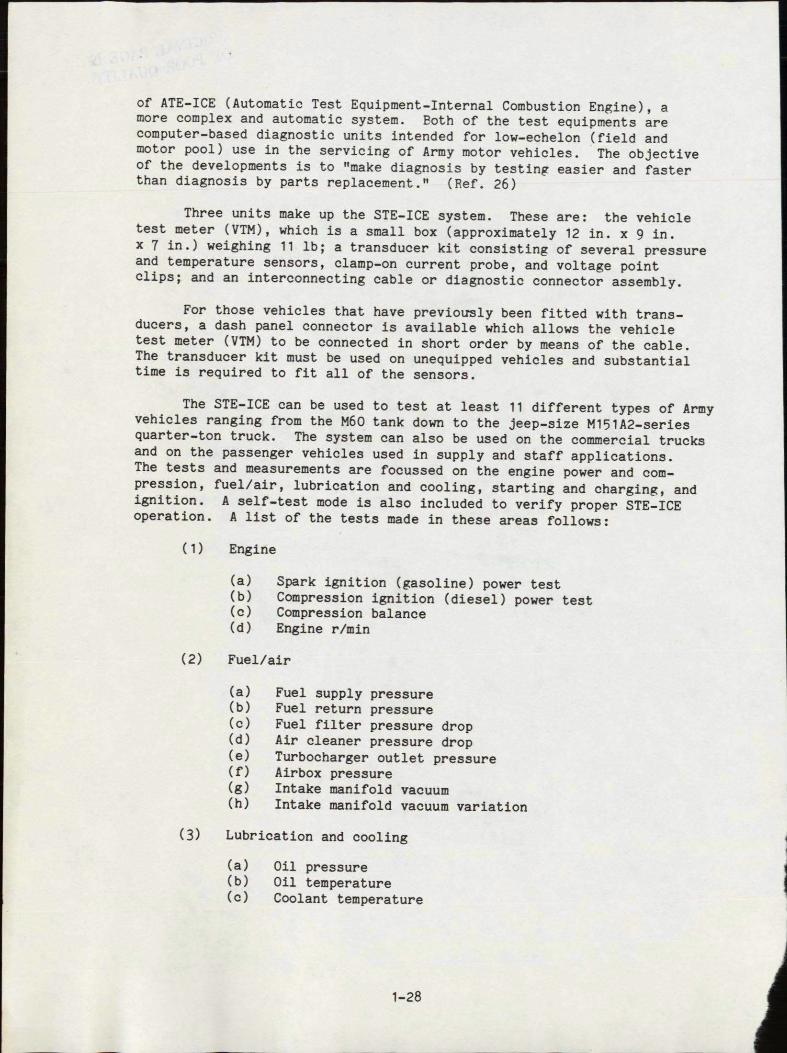
of ATE-ICE (Automatic Test Equipment-Internal Combustion Engine), amore complex and automatic system. Both of the test equipments arecomputer-based diagnostic units intended for low-echelon (field andmotor pool) use in the servicing of Army motor vehicles. The objectiveof the developments is to "make diagnosis by testing easier and fasterthan diagnosis by parts replacement." (Ref. 26)
Three units make up the STE-ICE system. These are: the vehicletest meter (VTM), which is a small box (approximately 12 in. x 9 in.x 7 in.) weighing 11 lb; a transducer kit consisting of several pressureand temperature sensors, clamp-on current probe, and voltage pointclips; and an interconnecting cable or diagnostic connector assembly.
For those vehicles that have previously been fitted with transducers, a dash panel connector is available which allows the vehicletest meter (VTM) to be connected in short order by means of the cable.The transducer kit must be used on unequipped vehicles and substantialtime is required to fit all of the sensors.
The STE-ICE can be used to test at least 11 different types of Armyvehicles ranging from the M60 tank down to the jeep-size M151A2-seriesquarter-ton truck. The system can also be used on the commercial trucksand on the passenger vehicles used in supply and staff applications.The tests and measurements are focussed on the engine power and compression, fuel/air, lubrication and cooling, starting and charging, andignition. A self-test mode is also included to verify proper STE-ICEoperation. A list of the tests made in these areas follows:
(1) Engine
(a) Spark ignition (gasoline) power test(b) Compression ignition (diesel) power test(c) Compression balance(d) Engine r/min
(2) Fuel/air
(a) Fuel supply pressure(b) Fuel return pressure(c) Fuel filter pressure dropd) Air cleaner pressure drop(e) Turbocharger outlet pressure(f) Airbox pressure(g) Intake manifold vacuum(h) Intake manifold vacuum variation
(3) Lubrication and cooling
(a) Oil pressure(b) Oil temperature(a) Coolant temperature
1-28
ORIGINAL PAGE lb
OF POOR QUALITY
Figure 10. STE-ICE Unit
(4) Starting/charging
(a) Battery voltage and current(b) Battery electrolyte level(a) Starter voltage and current(d) Starter current, first peak(e) Starter ground cable voltage drop
(f) Alternator/generator output voltage and current
(g) Alternator/generator field voltage and current
(5) Ignition
(a) Dwell angle(b) Points voltage(c) Coil primary voltage/resistance(d) Timing
Instruments that are replaced by the STE-ICE include a multimeter,
tachometer, low-voltage circuit tester, dwell meter, vacuum gauge,The vehicles testcompression gauge, and assorted pressure gauges.
meter is small enough that it can be placed at various spots on the
vehicle and provide a near-at-hand display of a parameter being adjusted
or measured. While not as portable as the hand-held units, it serves
the intended purpose quite well.
The microprocessor (CPU) used in the STE-ICE is a Rockwell
In addition to the CPU, there are 512 four-bitInternational PPS-4. words of "scratchpad" (or random-access memory) and 1536 eight-bit words
of programmable read-only memory (PROM) for constants, as well as 4096
eight-bit words of PROM for program storage.
1-29
The control function and computations performed include a determination that the test number called for is valid for the vehicle under test. On vehicles equipped with the dash-panel connector and transducers, there is an identifying resistance included in the wiring har
ness. Automatic measurement of this resistance identifies the vehicle
to the VTM and thereby prevents the operator from calling for improper
tests. The microprocessor establishes the routing path of the measure
ments through the various signal conditioners, filters, analog-to-digital
conversion, and then to the appropriate memory location. It also
determines if a single measurement or series of samples is to be made.
The computer averages measurements where required and establishes the
timed interval between measurements, as well as programming gains to
adjust the scale of the measurements. The values sampled are compared
against limits and, where needed, the measurement is converted to
engineering units for display.
The test functions performed by STE-ICE on either spark or com
pression ignition engines lead to the display of a value or condition in
most cases. The sequential or logical steps to be made in going through
a diagnostic tree are not performed automatically. The operator has
printed instructions for each test series, permanently attached to the
VTM, which contain proper intermediate test results and proceduralsteps. The test steps have to be followed in the proper fashion to
successfully complete a test.
There is one test that is unique to STE-ICE. This test is a
determination of the percent of full-rated power output of a sparkignition engine. The test is made at full throttle and by means of
systematically eliminating the sparkplug firing voltages, a much-reduced
maximum "no-load" speed is attained. This reduced speed has been
determined by dynamometer tests to accurately reflect the full output
power of the engine. The power from each cylinder is pitted in turn
against the inertial load of the engine and the load of the compressionand exhaust strokes of the other unfired cylinders. This technique,in a sense, allows the remainder of the engine to act as a dynamometerfor the functioning or power-producing part.
On a four-cylinder engine, four out of each five spark-plug firings
are eliminated. There are normally two power strokes per revolution,
but this elimination reduces that to one power stroke every two revolu
tions. The speed is greatly reduced because of this loss of power
strokes and because the other cylinders are compressing full charges
without throttle losses.
Typical speeds that might be attained for a four-cylinder quarterin the 1100 to 1400 rpm range for acceptable powerton-truck engine are
output. Acceptable power has been determined to be 75 percent of full
rated power. The 75 percent value was obtained by a series of tests
using a large group of drivers familiar with the vehicles. The vehicles
were detuned to various power levels and the drivers, who were unaware
of this, were asked to comment on driveability. Some drivers coulddetect small losses of power, but, in general, the vehicle performancewas unsatisfactory to all when the 75 percent level was reached.
1-30
SECTION II
GUIDANCE TECHNOLOGIES
A. INTRODUCTION
Automated highways, high-speed ground transit, guided transit, and
personnel rapid transit all share the requirements for lateral and longi
tudinal guidance and control. Purely mechanical (e.g., tracks) or other
lateral guidance techniques requiring no steering on the vehicle will not
be addressed here. The longitudinal control refers to the means of main
taining speed and/or position on the right-of-way. Speed control and
on-board headway sensors are part of the longitudinal control but will be
discussed separately as will the automotive elements required for lateral
control.
B. LATERAL GUIDANCE
The techniques for lateral guidance employ magnetic, electro
magnetic, optical, acoustic, and very high frequency radio technologies.
The most common technique in current use, is the "buried wire" used to
guide very slow moving vehicles in warehouses, storage yards, hospitals,
etc.
The buried wire has been the foundation of many experimental
guidance studies employing passenger automobile and buses; the former
at speeds greater than 100 km/hr.
1. Sidgle Buried Wire
This technique employs a single wire, buried in a shallow groove,
usually along the center line of a highway lane or the vehicle right-of
way. The term "single wire" means single loop as the wire used in aSimilarly, in warehouselane returns by another lane to form a Loop.
loop is desiredoperations and the like, a complete circular route or
and the single-wire loop describes the complete path.
The wire is excited with low frequency alternating current. The
are generally less than 10 kHz where FCC licensingfrequencies employed is not required. Several loops covering different routes can share
a common section of right-of-way by using different frequencies. The
then discriminate amongvehicles inten~ded for the different routes
the different frequencies to determine which wire should be followed.
The power required to energize the wire is usually modest with
Large-gauge wire is usually usedcurrents of about 1 A being typical. for mechanical strength and the inductance of the wire is the pre
dominant impedance. The loop is often tuned with capacitance at the
generator to make a series resonant, albeit low Q, circuit.
2-1
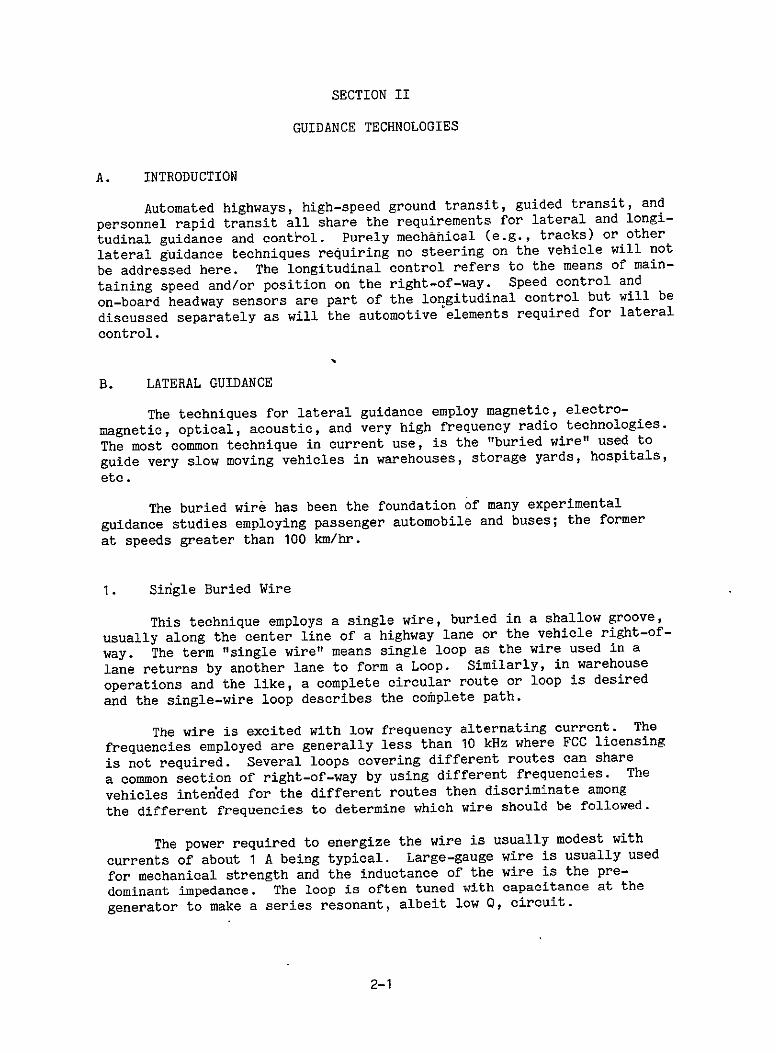
The lines of equistrength magnetic field around the single wire are essentially concentric circles if the return wire is distant. When the wires are close together (e.g., less than a few meters), thelines of equal strength are no longer concentric but are circular with
%the centers displaced away from the wires as depicted in Figure 11a. The effect of this lack of symmetry above the wine is-to introduce a yawl-component- if th& vehicle sensor-to-wire distance changes, as in bounce and rebound.
Yaw-motions are also introduced by distortions of the magneticfield. These distortions occur where the wire passes close to -aferrousmass such as a manhole cover, or bridge deck, or the reinforcing steelin concrete road surfaces.
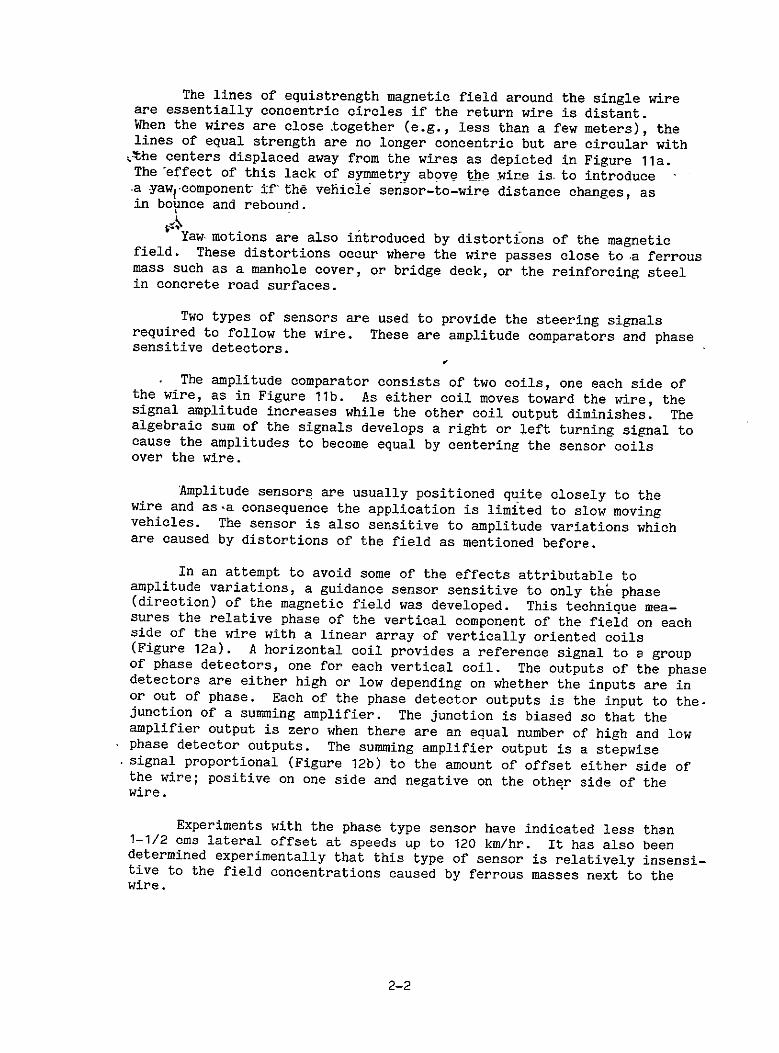
Two types of sensors are used to provide the steering signalsrequired to follow the wire. These are amplitude comparators and phasesensitive detectors.
The amplitude comparator consists of two coils, one each side ofthe wire, as in Figure 11b. As either coil moves toward the wire, thesignal amplitude increases while the other coil output diminishes. Thealgebraic sum of the signals develops a right or left turning signal tocause the amplitudes to become equal by centering the sensor coilsover the wire.
'Amplitudesensors are usually positioned quite closely to thewire and as-a consequence the application is limited to slow movingvehicles. The sensor is also sensitive to amplitude variations whichare caused by distortions of the field as mentioned before.
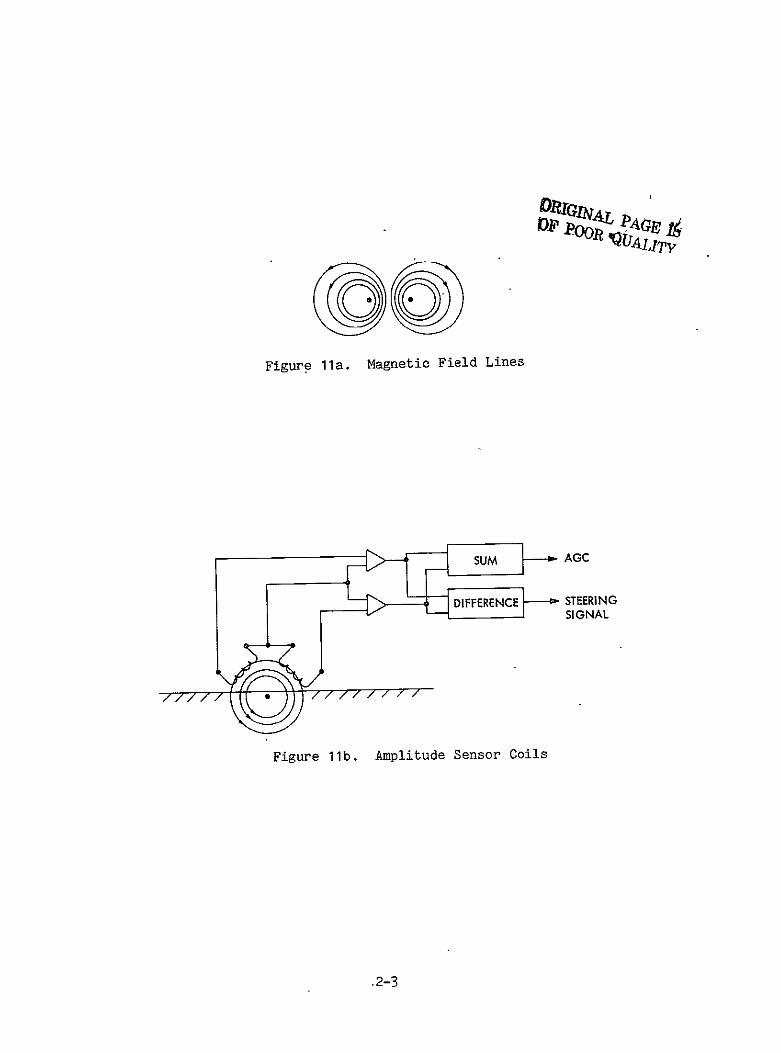
In an attempt to avoid some of the effects attributable toamplitude variations, a guidance sensor sensitive to only tha phase(direction) of the magnetic field was developed. This technique measures the relative phase of the vertical component of the field on eachside of the wire with a linear array of vertically oriented coils(Figure 12a). A horizontal coil provides a reference signal to a groupof phase detectors, one for each vertical coil. The outputs of the phasedetectors are either high or low depending on whether the inputs are inor out of phase. Each of the phase detector outputs is the input to thejunction of a summing amplifier. The junction is biased so that theamplifier output is zero when there are an eaual number of high and low
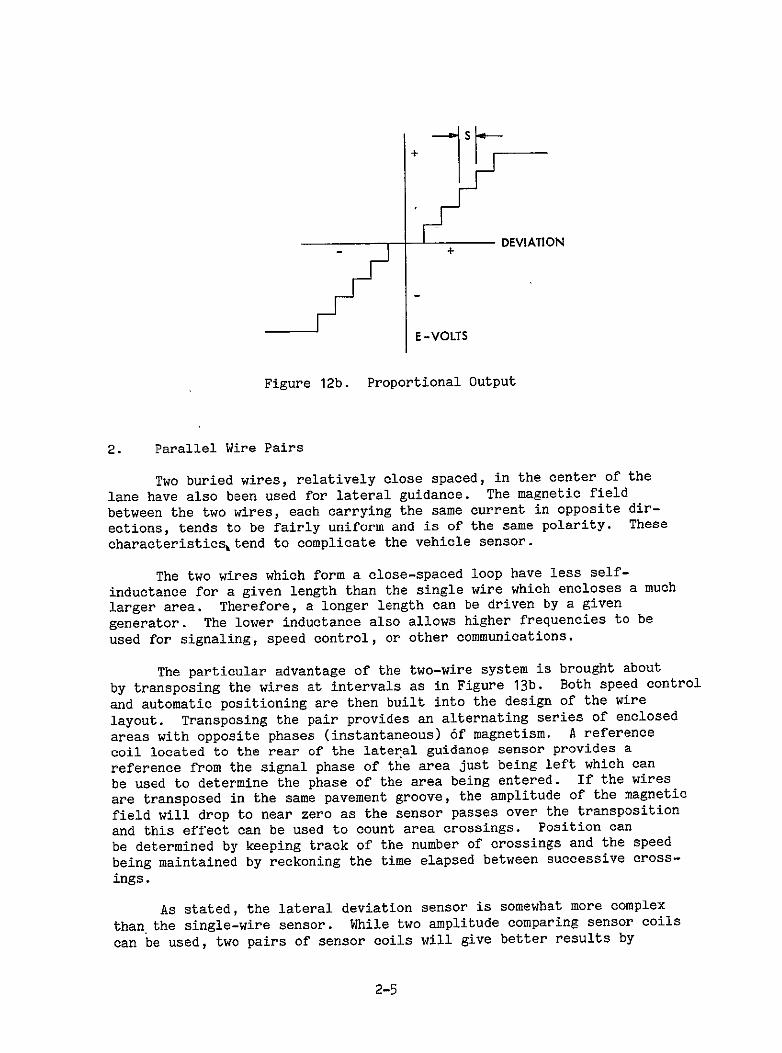
* phase detector outputs. The summing amplifier output is a stepwise.signal proportional (Figure 12b) to the amount of offset either side ofthe wire; positive on one side and negative on the other side of thewire.
Experiments with the phase type sensor have indicated less than1-1/2 oms lateral offset at speeds up to 120 km/br. It has also beendetermined experimentally that this type of sensor is relatively insensitive to the field concentrations caused by ferrous masses next to thewire.
2-2
I PooR~ PA
Figure 11a. Magnetic Field Lines
sum AGC
DIFFERENCE STEERIN G SIGNAL.
Figure 11b. Amplitude Sensor Coils
.2-3
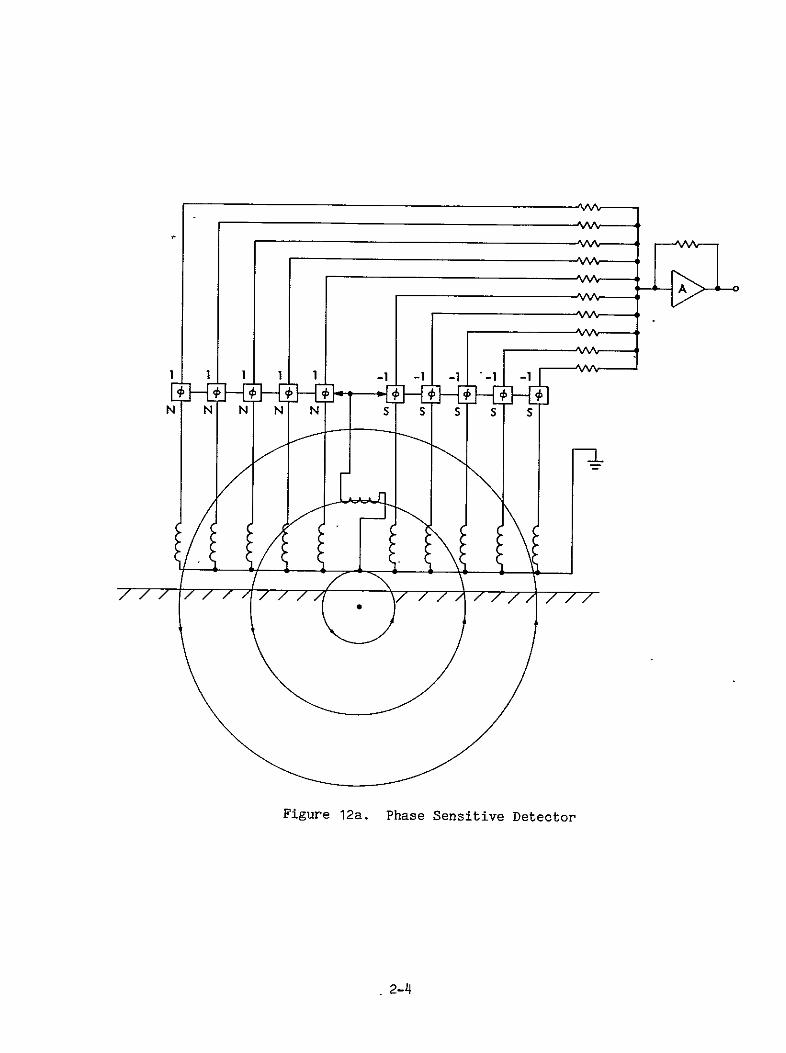
Figure 12a. Phase Sensitive Detector
.2-4
DEVIATION
E-VOLTS
Figure 12b. Proportional Output
2. Parallel Wire Pairs
Two buried wires, relatively close spaced, in the center of the
lane have also been used for lateral guidance. The magnetic field
between the two wires, each carrying the same current in opposite dir
ections, tends to be fairly uniform and is of the same polarity. These
characteristics tend to complicate the vehicle sensor.
The two wires which form a close-spaced loop have less self
inductance for a given length than the single wire which encloses a much
larger area. Therefore, a longer length can be driven by a given
The lower inductance also allows higher frequencies to begenerator. used for signaling, speed control, or other communications.
The particular advantage of the two-wire system is brought about
by transposing the wires at intervals as in Figure 13b. Both speed control
and automatic positioning are then built into the design of the wire
layout. Transposing the pair provides an alternating series of enclosed
areas with opposite phases (instantaneous) 6f magnetism. A reference
coil located to the rear of the lateral guidance sensor provides ajust being left which canreference from the signal phase of the area
be used to determine the phase of the area being entered. If the wires
are transposed in the same pavement groove, the amplitude of the magnetic
near zero as the sensor passes over the transpositionfield will drop to and this effect can be used to count area crossings. Position can
be determined by keeping track of the number of crossings and the speed
being maintained by reckoning the time elapsed between successive cross
ings.
As stated, the lateral deviation sensor is somewhat more complex
than the single-wire sensor. While two amplitude comparing sensor coils
can be used, two pairs of sensor coils will give better results by
2-5
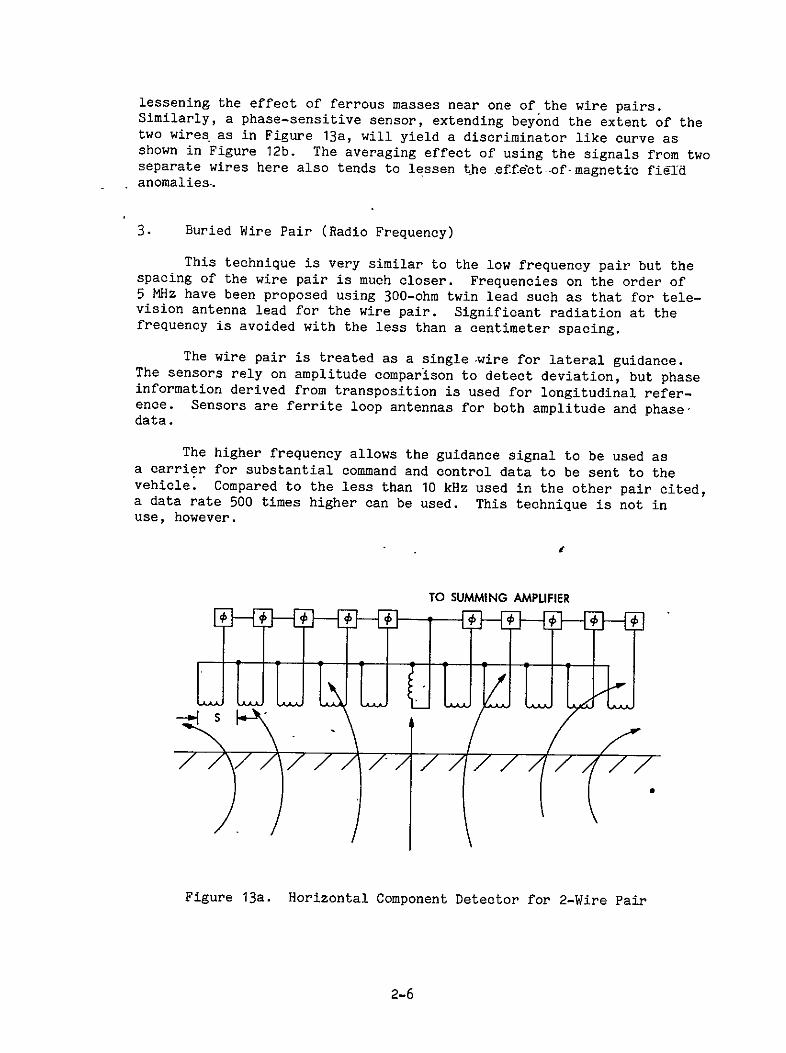
lessening the effect of ferrous masses near one of the wire pairs.Similarly, a phase-sensitive sensor, extending beyond the extent of thetwo wires as in Figure 13a, will yield a discriminator like curve asshown in Figure 12b. The averaging effect of using the signals from twoseparate wires here also tends to lessen the nffect--of-magnetic fieldanomalies.
3. Buried Wire Pair (Radio Frequency)
This technique is very similar to the low frequency pair but thespacing of the wire pair is much closer. Frequencies on the order of5 MHz have been proposed using 300-ohm twin lead such as that for television antenna lead for the wire pair. Significant radiation at thefrequency is avoided with the less than a centimeter spacing.
The wire pair is treated as a single ,wire for lateral guidance.The sensors rely on amplitude comparison to detect deviation, but phaseinformation derived from transposition is used for longitudinal reference. Sensors are ferrite loop antennas for both amplitude and phasedata.
The higher frequency allows the guidance signal to be used asa carrier for substantial command and control data to be sent to thevehicle. Compared to the less than 10 kHz used in the other pair cited,a data rate 500 times higher can be used. This technique is not inuse, however.
TO SUMMING AMPLIFIER
LJL UCU /7/)/// //// 7/j
Figure 13a. Horizontal Component Detector for 2-Wire Pair
2-6
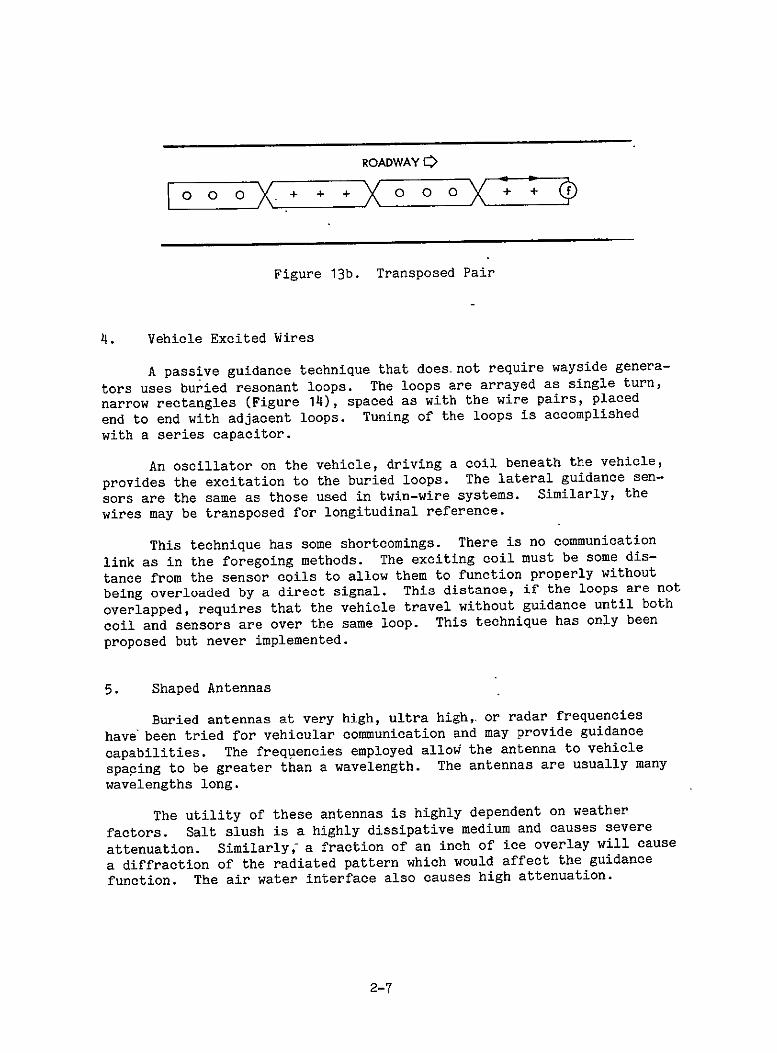
ROADWAY['0L0o0o ++ +Xooo0 + + f
Figure 13b. Transposed Pair
4. Vehicle Excited Wires
A passive guidance technique that does-not require wayside genera
tors uses buried resonant loops. The loops are arrayed as single turn,
spaced as with the wire pairs, placednarrow rectangles (Figure 14), Tuning of the loops is accomplishedend to end with adjacent loops.
with a series capacitor.
An oscillator on the vehicle, driving a coil beneath the vehicle,
The lateral guidance senprovides the excitation to the buried loops.
same as those used in twin-wire systems. Similarly, thesors are the wires may be transposed for longitudinal reference.
This technique has some shortcomings. There is no communication
link as in the foregoing methods. The exciting coil must be some dis
tance from the sensor coils to allow them to function properly withoutThis distance, if the loops are notbeing overloaded by a direct signal.
overlapped, requires that the vehicle travel without guidance until both
This technique has only beencoil and sensors are over the same loop.
proposed but never implemented.
5. Shaped Antennas
or radar frequenciesBuried antennas at very high, ultra high,,
have been tried for vehicular communication and may provide guidance
capabilities. The frequencies employed allow the antenna to vehicle
spacing to be greater than a wavelength. The antennas are usually many
wavelengths long.
The utility of these antennas is highly dependent on weather
factors. Salt slush is a highly dissipative medium and causes severe
attenuation. Similarly, a fraction of an inch of ice overlay will cause
a diffraction of the radiated pattern which would affect the guidance
The air water interface also causes high attenuation.function.
2-7
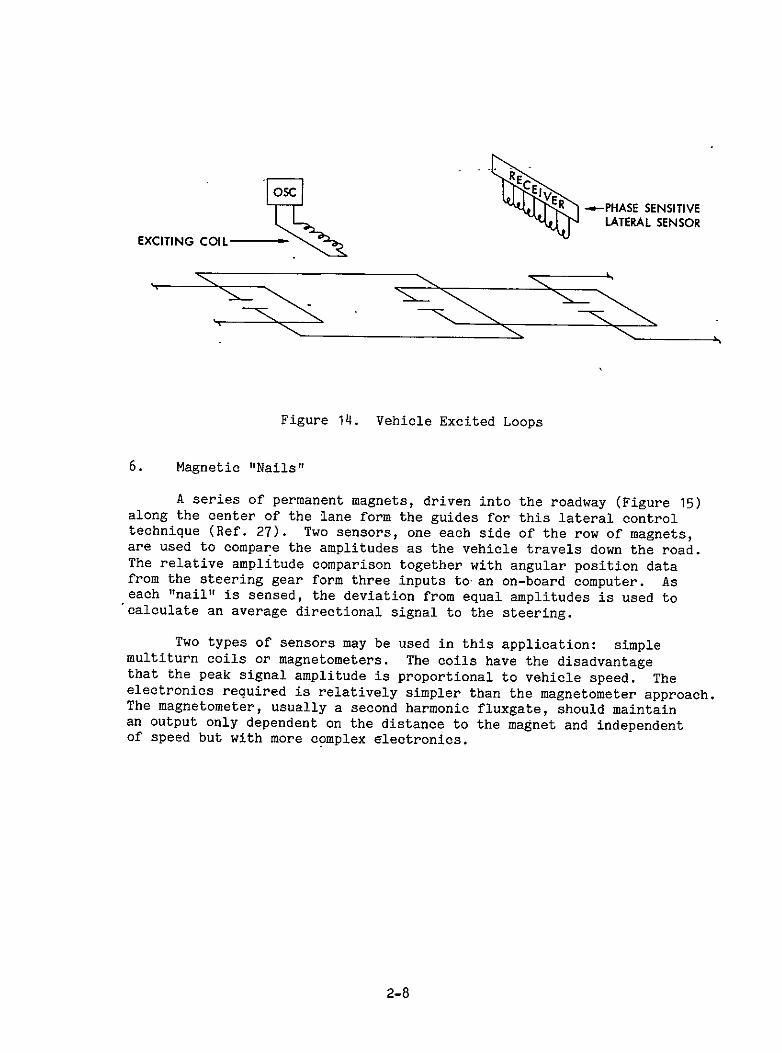
O R -PHASE SENSITIVE
ELATERAL SENSOR EXCITING COIL-
Figure 14. Vehicle Excited Loops
6. Magnetic "Nails"
A series of permanent magnets, driven into the roadway (Figure 15)along the center of the lane form the guides for this lateral controltechnique (Ref. 27). Two sensors, one each side of the row of magnets,are used to compare the amplitudes as the vehicle travels down the road.The relative amplitude comparison together with angular position datafrom the steering gear form three inputs to an on-board computer. Aseach "nail" is sensed, the deviation from equal amplitudes is used tocalculate an average directional signal to the steering.
Two types of sensors may be used in this application: simplemultiturn coils or magnetometers. The coils have the disadvantagethat the peak signal amplitude is proportional to vehicle speed. Theelectronics required is relatively simpler than the magnetometer approach.The magnetometer, usually a second harmonic fluxgate, should maintainan output only dependent on the distance to the magnet and independentof speed but with more complex electronics.
2-8
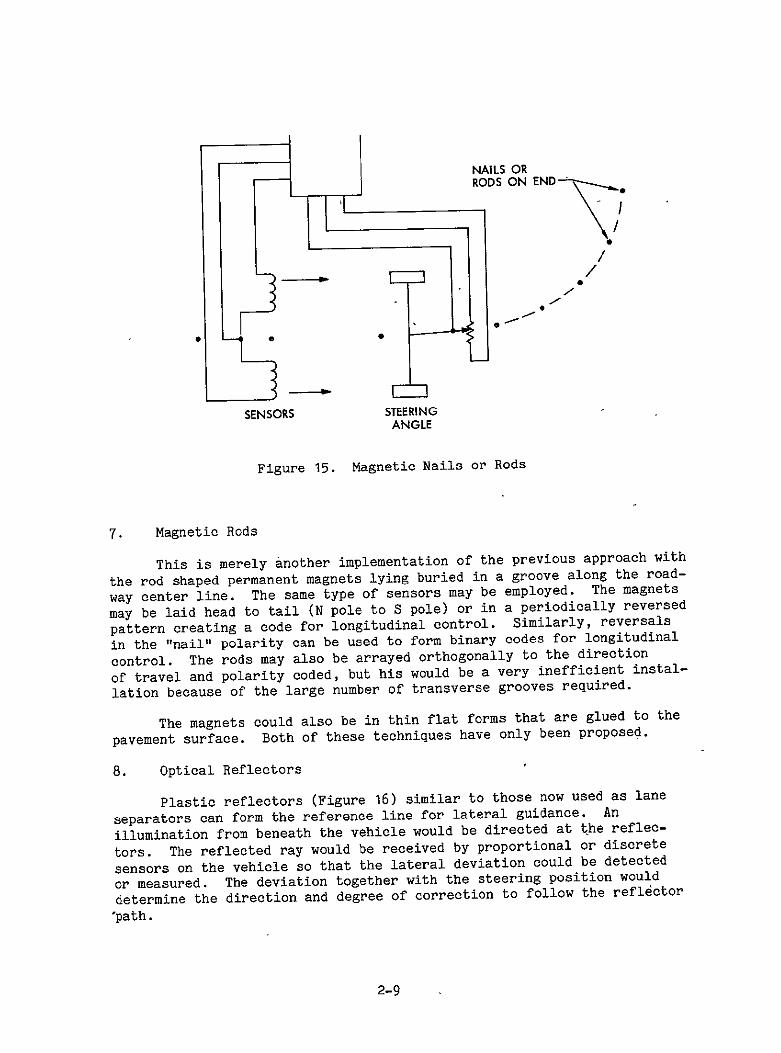
~NAILSOR \RODS ON END- .
/
STEERINGSENSORS ANGLE
Figure 15. Magnetic Nails or Rods
7. Magnetic Rods
This is merely another implementation of the previous approach with
the rod shaped permanent magnets lying buried in a groove along the road-
The same type of sensors may be employed. The magnetsway center line. may be laid head to tail (N pole to S pole) or in a periodically reversed
pattern creating a code for longitudinal control. Similarly, reversals
in the "nail" polarity can be used to form binary codes for longitudinal
The rods may also be arrayed orthogonally to the directioncontrol. of travel and polarity coded, but his would be a very inefficient
instal
lation because of the large number of transverse grooves required.
The magnets could also be in thin flat forms that are glued to the
Both of these techniques have only been proposed.pavement surface.
8. Optical Reflectors
Plastic reflectors (Figure 16) similar to those now used as laneAnseparators can form the reference line for lateral guidance.
illumination from beneath the vehicle would be directed at the reflec-
The reflected ray would be received by proportional or discretetors. sensors on the vehicle so that the lateral deviation could be detected
or measured. The deviation together with the steering position would
determine the direction and degree of correction to follow the reflector
path.
2-9
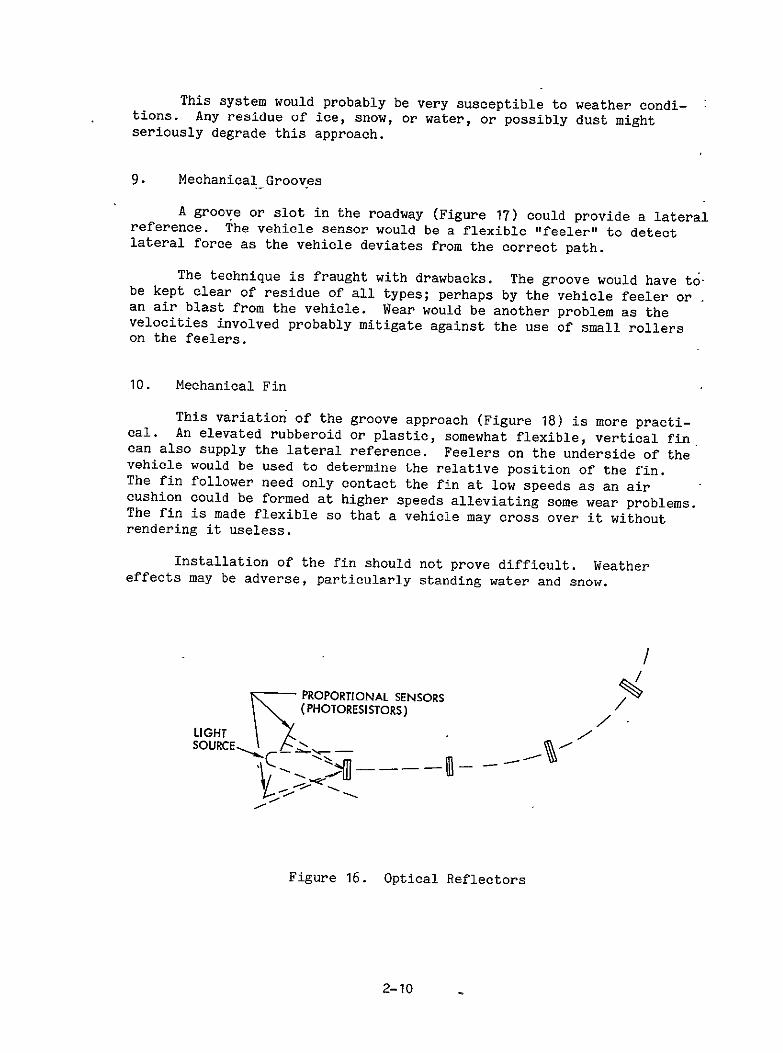
This system would probably be very susceptible to weather conditions. Any residue of ice, snow, or water, or possibly dust mightseriously degrade this approach.
9. Mechanical Grooves
A groove or slot in the roadway (Figure 17) could provide a lateralreference. The vehicle sensor would be a flexible "feeler" to detectlateral force as the vehicle deviates from the correct path.
The technique is fraught with drawbacks. The groove would have to,be kept clear of residue of all types; perhaps by the vehicle feeler oran air blast from the vehicle. Wear would be another problem as thevelocities involved probably mitigate against the use of small rollerson the feelers.
10. Mechanical Fin
This variation of the groove approach (Figure 18) is more practical. An elevated rubberoid or plastic, somewhat flexible, vertical fincan also supply the lateral reference. Feelers on the underside of thevehicle would be used to determine the relative position of the fin.The fin follower need only contact the fin at low speeds as an aircushion could be formed at higher speeds alleviating some wear problems.The fin is made flexible so that a vehicle may cross over it withoutrendering it useless.
Installation of the fin should not prove difficult. Weathereffects may be adverse, particularly standing water and snow.
/
PROPORTIONAL SENSORS/(PHOTORESISTORS)
LIGHT
Figure 16. Optical Reflectors
2-10
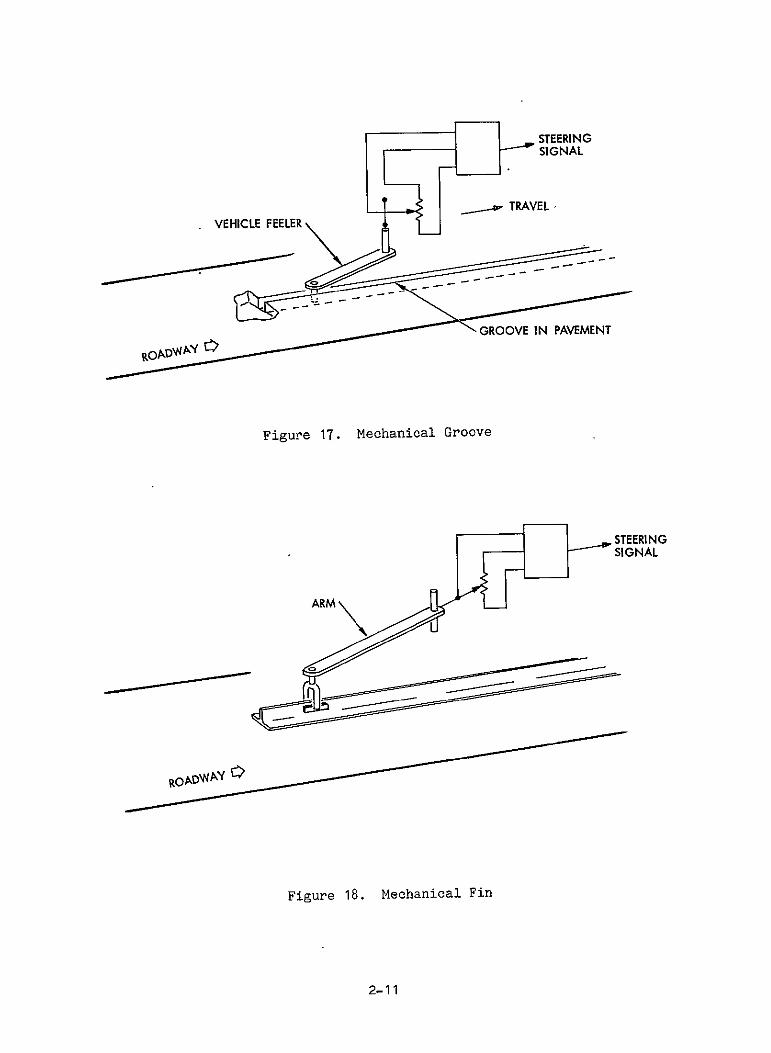
' TRAVEL,
VEHICLE FEELER
OAGROOVE IN PAVEMEN
Figure 17. Mechanical Groove
SSARM
Figure 18. Mechanical Fin
2-11
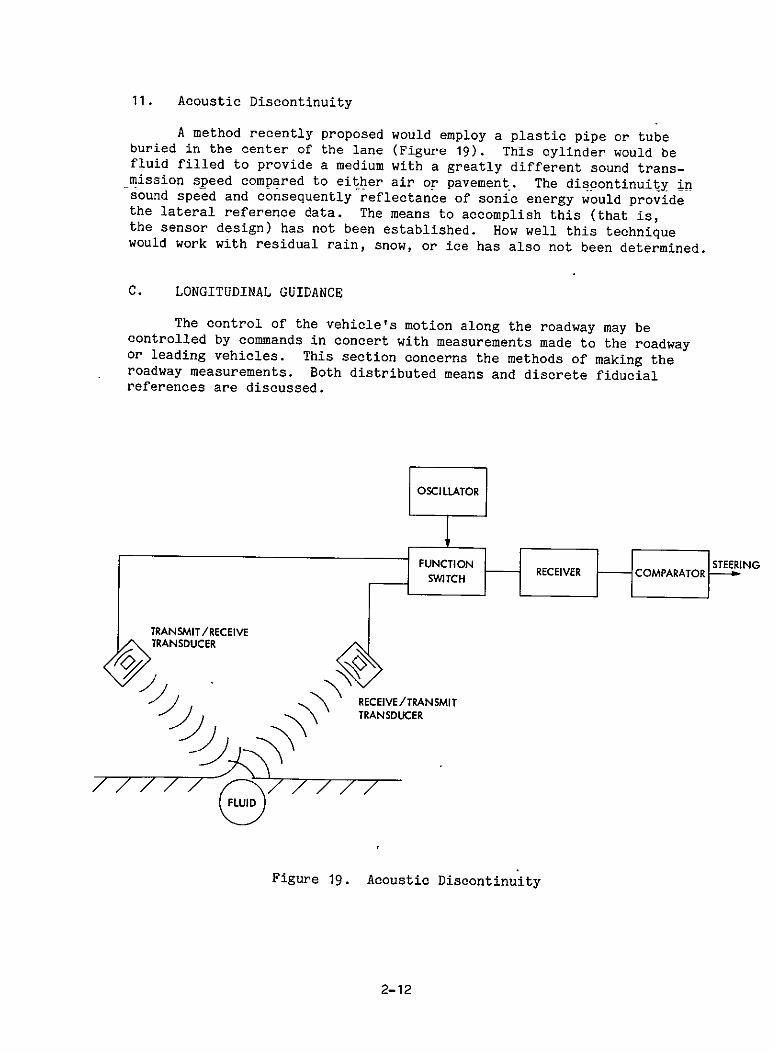
11. Acoustic Discontinuity
A method recently proposed would employ a plastic pipe or tubeburied in the center of the lane (Figure 19). This cylinder would befluid filled to provide a medium with a greatly different sound trans-mission speed compared to either air or pavement. The discontinuity insound speed and consequently reflectance of sonic energy would providethe lateral reference data. The means to accomplish this (that is,the sensor design) has not been established. How well this techniquewould work with residual rain, snow, or ice has also not been determined.
C. LONGITUDINAL GUIDANCE
The control of the vehicle's motion along the roadway may becontrolled by commands in concert with measurements made to the roadwayor leading vehicles. This section concerns the methods of making theroadway measurements. Both distributed means and discrete fiducialreferences are discussed.
OSCILLATOR I
FUNCION_rREEIVR COPARTORSTEERING SWITCH CMAAO
TRANSMIT/RECEIVETRANSDUCER
>RECEIVE /TRAN SMIT> TRANSDUCER
FLUID
Figure 19. Acoustic Discontinuity
2-12
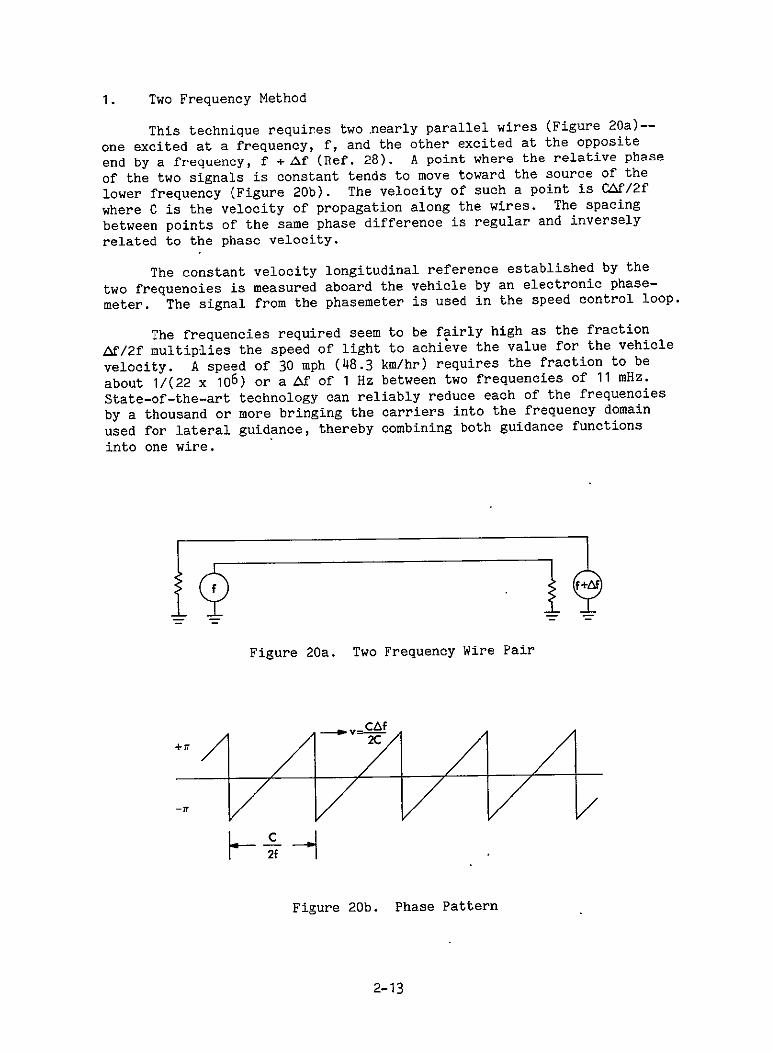
1. Two Frequency Method
This technique requires two nearly parallel wires (Figure 20a)-
one excited at a frequency, f, and the other excited at the oppositeA point where the relative phaseend by a frequency, f + Af (Ref. 28).
of the two signals is constant tends to move toward the source of the
lower frequency (Figure 20b). The velocity of such a point is CAfI2f
where C is the velocity of propagation along the wires. The spacing
between points of the same phase difference is regular and inversely
related to the phase velocity.
The constant velocity longitudinal reference established by theelectronic phasetwo frequencies is measured aboard the vehicle by an
meter. The signal from the phasemeter is used in the speed control loop.
The frequencies required seem to be fairly high as the fraction
Lf/2f multiplies the speed of light to achieve the value for the vehicle
A speed of 30 mph (48.3 km/hr) requires the fraction to bevelocity. or a Af of 1 Hz between two frequencies of 11 mHz.about 1/(22 x 106)
State-of-the-art technology can reliably reduce each of the frequencies
by a thousand or more bringing the carriers into the frequency domain
used for lateral guidance, thereby combining both guidance functions
into one wire.
Figure 20a. Two Frequency Wire Pair
Cr
Figure 20b. Phase Pattern
2-13
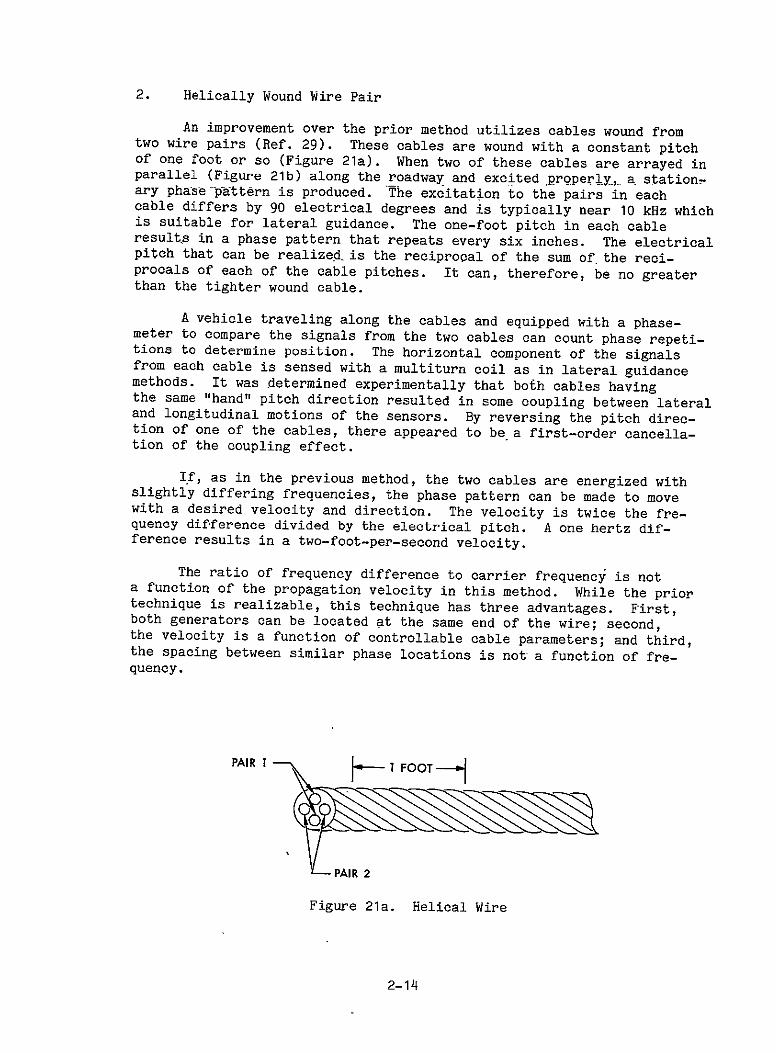
2. Helically Wound Wire Pair
An improvement over the prior method utilizes cables wound fromtwo wire pairs (Ref. 29). These cables are wound with a constant pitchof one foot or so (Figure 21a). When two of these cables are arrayed inparallel (Figure 21b) along the roadway and excited properl-y, a stationary phas-e pattern is produced. The excitation to the pairs in eachcable differs by 90 electrical degrees and is typically near 10 kHz whichis suitable for lateral guidance. The one-foot pitch in each cableresults in a phase pattern that repeats every six inches. The electricalpitch that can be realized is the reciprocal of the sum of the reciprocals of each of the cable pitches. It can, therefore, be no greaterthan the tighter wound cable.
A vehicle traveling along the cables and equipped with a phasemeter to compare the signals from the two cables can count phase repetitions to determine position. The horizontal component of the signalsfrom each cable is sensed with a multiturn coil as in lateral guidancemethods. It was determined experimentally that both cables havingthe same "hand" pitch direction resulted in some coupling between lateraland longitudinal motions of the sensors. By reversing the pitch direction of one of the cables, there appeared to be a first-order cancellation of the coupling effect.
If, as in the previous method, the two cables are energized withslightly differing frequencies, the phase pattern can be made to movewith a desired velocity and direction. The velocity is twice the frequency difference divided by the electrical pitch. A one hertz difference results in a two-foot-per-second velocity.
The ratio of frequency difference to carrier frequency is nota function of the propagation velocity in this method. While the priortechnique is realizable, this technique has three advantages. First,both generators can be located at the same end of the wire; second,the velocity is a function of controllable cable parameters; and third,the spacing between similar phase locations is not a function of frequency.
PAIR I
Figure 21a. Helical Wire
2-14
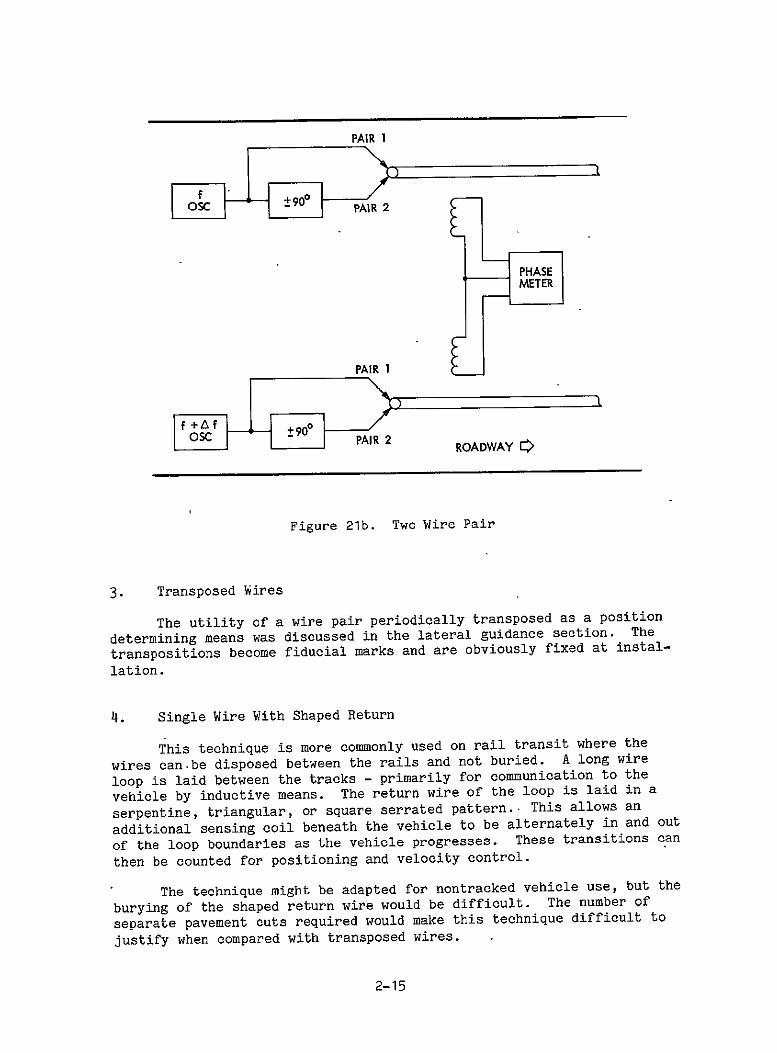
PAIR 1
PAIR 1
ROADWAY C
Figure 21b. Two Wire Pair
3. Transposed Wires
The utility of a wire pair periodically transposed as a positionThedetermining means was discussed in the lateral guidance section.
transpositions become fiducial marks and are obviously fixed at instal
lation.
4. Single Wire With Shaped Return
This technique is more commonly used on rail transit where the
wires can.be disposed between the rails and not buried. A long wire
loop is laid between the tracks - primarily for communication to the
vehicle by inductive means. The return wire of the loop is laid in a
serpentine, triangular, or square serrated pattern.. This allows an
additional sensing coil beneath the vehicle to be alternately in and out
of the loop boundaries as the vehicle progresses. These transitions can
then be counted for positioning and velocity control.
The technique might be adapted for nontracked vehicle use, but the
burying of the shaped return wire would be difficult. The number of
separate pavement cuts required would make this technique difficult to
justify when compared with transposed wires.
2-15
D. FIDUCIAL INDEXES
Discrete markers or reference points can be established forpositioning and velocity measurement or control. The markers are eitheractive or passive.
1. Passive Markers
a. Metallic Plates. Small plates may be buried beneath oraffixed to the pavement at intervals. The presence of these platesis detected by metal detection or magnetic sensors on the vehicle andthe number of detections accumulated.
b. Rod Magnets. Vertical or horizontal magnets placed in thepavement can and are being used for fiducial data. In one applicationthe magnets are arranged in coded sequences by having either the N or Spole topmost in a series of magnets. These then form a code for a particular location or distance from a previous location. The detector *forthis type of system is either a coil or magnetometer to detect the fieldand the polarity.
c. Dipoles. Burying short wire rods cut to predeterminedlengths allows the detection of the reference by radar means. If thewires are cut to one-half wavelength at the frequency employed, substantial energy is reradiated when they are illuminated by the radar.
The sensor required on the vehicle entails a CW or pulsed very lowpower radar and receiver to detect the reradiated energy. The detectionsare counted or used for speed control.
A variation of the dipole method uses wires with a semiconductordiode in the center of two wires. These form parametric reflectors whichradiate energy at twice the frequency of the illuminating energy. Thistends to simplify the receiver design as the effect of direct radiationhas been eliminated.
2. Active Markers
a. Magnetometers. Magnetometers buried in the roadway are usedfor detecting automobiles, guideway transit vehicles, and trains. Themagnetometer is essentially a presence detector which notes the passageof a vehicle and the duration of time that the vehicle is over it.
The magnetometer data is usually used in wayside traffic countingand measuring applications. It could also be used as the measuringdevice for issuing speed controlling commands.
b. Loop Detectors. The loop detector is a large, buried, fewturn coil which detects the presence of vehicles by the change in
2-16
inductance. The application and use has been primarily the same as
the magnetometer detector and could be used in speed controlling.
The loop does have the additional capability of being the antenna
This has been exploited in train and nontransitof a communication system.
systems. Both the communication and detection processes can be used
simultaneously.
The antennas used for broadbandc. Buried Radar Antennas.
communication with vehicles from beneath the roadway might also be
used as presence detectors by reflected energy detection. The effects
of weather residuals would need to be studied for this use.
E. AUTOMOTIVE ELEMENTS
1. Lateral Sensors
The lateral sensors for almost all of the techniques provide an
output which is proportional to the amount of lateral deviation from the
,desired path. The proportional output may not be linear but in most
instances is monotonic over the expected lateral motion that should
occur. The lateral motion limit is usually reached when one of the
sensors in the pair is above the desired lateral path centerline or the
output has reached a maximum value. Behavior of the sensor output
beyond this limit is usually disregarded and guidance there is determined
by the technique used for path acquisition.
The magnetic field amplitude sensors, magnetic coils, or magnetom
the radio frequency amplitude sensors, are positionedeters, as well as beneath the vehicle in close proximity to the roadway. The spacing
between the sensors usually determines the extent of lateral motion
possible. Similarly, the length of the phase sensitive magnetic array
determines the amount of lateral motion possible.
2. Signal Conditioning
signals from the sensors usually have to be amplified beforeThe ac processing. Vertical vehicular motions or other effects which cause
common changes will affect the magnitude of most comparison voltages.
Long-term or short-time changes in amplifier gain will cause spurious
comparison voltages to be developed.
For these reasons, automatic gain control (AGC) and gain stability
The time constant of the automatic gain must be suchare both required. that the lateral motions to be detected are not disguised. One method
derives the AGC from the sum of the two signals and applies the control
equally to both amplifiers. .Long-term and short-term gain stability can
be assured by utilizing operational amplifier techniques where the gain
is determined by stable passive components and not the active gain stages.
2-17
The sensors intended to derive phase data avoid most of the foregoing problems. The only requirements are that the gain bandwidthproduct of the amplifiers be adequate under minimum amplitude inputand that phase distortion be avoided.
3." Processing
The comparison of the amplitude signals is accomplished by rectification (usually of opposite polarities) of the two signals. Theresulting dc voltages are then summed in an operational amplifier todevelop the lateral error voltage for steering. Analog-to-digital conversion of the rectified voltages for subsequent digital processing isalso possible. Similarly, voltage-to-frequency conversion and subsequent frequency comparison may also be used.
The phase comparison is accomplished primarily with digital logicdevices which can function as phasemeters, such as the exclusive-OR orthe edge triggered flip-flop. The output of either of these devices isthen filtered to develop the do steering voltage.
The phase detector technique which uses a multiplicity of coilsand phase detectors develops a steering signal proportional to offset,but in a series of steps. To avoid the effect of the step discontinuities, the signal is integrated before being used for steering control.
4. Steering
The three most common steering mechanisms for passenger cars arethe recirculating ball nut, worm and sector, and rack and pinion.Servos employed to drive these steering gears are electric and electriccontrolled hydraulic (Ref. 30). Positional feedback, usually potentiometer controlled dc voltage, is common. Most attempts to automate thesteering at the front wheels have had to provide a means of declutchingthe steering wheel. The steering wheel inertia load is substantial andis greatly magnified in effect by the steering gear ratio. Owing to thelarge forces and relatively short motions involved, hydraulic linearactuators are used, as is common in manually controlled power steering.The actuator drives the linkage connecting the front wheels.
Electric servomotors with worm and pinion gearing are sometimesused where the steering shaft and wheel are driven directly. Thisimplementation also requires that the electric motor be declutched or theworm be disengaged from the pinion gear to avoid inertia effects whenthe steering wheel is manually operated.
The servos to operate either of the power mechanisms are usuallysecond-order devices to achieve zero position error. Rate input isrequired and is normally a derived signal obtained by differentiation ofthe control signal from the sensor signal conditioner.
- 2-18
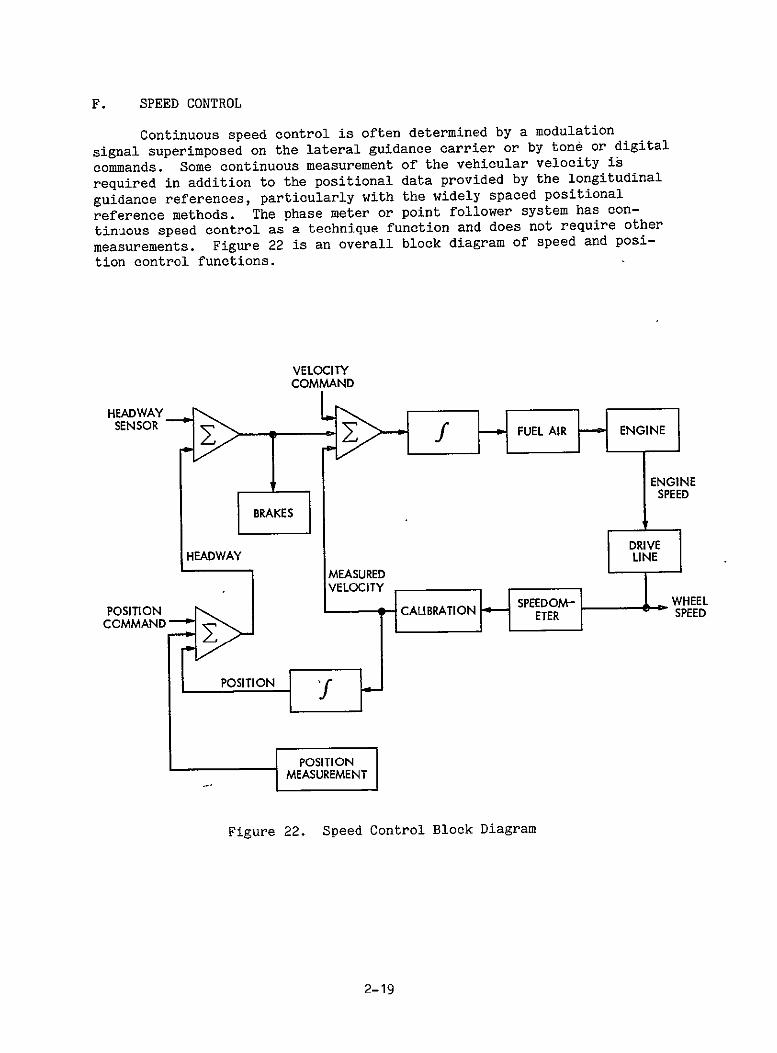
F. SPEED CONTROL
Continuous speed control is often determined by a modulationdigitalsignal superimposed on the lateral guidance carrier or by tone or
commands. Some continuous measurement of the vehicular velocity is
required in addition to the positional data provided by the longitudinal
guidance references, particularly with the widely spaced positional
The phase meter or point follower system has conreference methods. tinuous speed control as a technique function and does not require other
an overall block diagram of speed and posimeasurements. Figure 22 is
tion control functions.
VELOCITY COMMAND
HEEADWAY
MEASURED
POSINSPEE
Figure 22. Speed Control Block Diagram
2-19
1. Sensors
A speedometer cable driven do generator or drive line driventoothed wheel and proximity coil are the two most common velocity measuring devices providing electrical signals (Refs. 31 and 32). The firstyields a voltage and the second a frequency proportional to speed. These-devices provide a zspeed"measurement which-has intrinsic errors due totire wear, inflation pressure changes, and wheel slip. The positionaldata available from the longitudinal sensors can be used to providecorrectional data.
Continuous speed sensors which can measure true ground speed havebeen developed in three implementations. There are acoustic, radar,and laser mechanizations which provide a noncontact measure of the velocityof the roadway beneath the vehicle. The acoustic and radar methodswhich have been produced in prototype or production versions rely onthe doppler shift of the reflected energy which increases with increasingspeed. The radar and acoustic devices are usually operated in a continuous wave mode and the illuminating energy directed forward towardthe road at a downward angle. The reflected energy is compared withthe radiated, and the beat frequency difference which is the measureof speed is extracted.
The laser device provides a laser beam directed vertically downwardtoward the road surface. This device has been demonstrated as partof a vehicle locator "system (Ref. 2) and is also used as a non-contactspeed detector in steel rolling mills. The reflected "spot" containsa speckle pattern which moves with a velocity twice that of the reflectingsurface. The forward component of the speckle pattern is extractedwith a transverse diffraction grating and a light sensitive detector.A phase locked loop or synchronous amplifier is then used to extractand track a frequency which is determined solely by-the motion overthe road and the spacing in the grating. The frequency is a directindication of speed.
2. Signal Conditioning
The do generator speed sensor provides a voltage which can beused without further modification. Some implementations might usea voltage-to-frequency conversion or analog-to-digital conversion forcomputer input.
The toothed wheel provides a variable frequency signal which mustbe amplified to be used. A tracking phase locked loop is normally usedto eliminate amplitude variations and the ability to apply correctionsto the frequency based on the positional signals.
The radar, acoustic, and laser instruments also provide frequenciesproportional to speed which generally need no further conditioning.
2-20
3. Processing
Speed control by positional data points and commands, either
sent to the vehicle requires some method to measurestored on-board or the elapsed time between reference points. The speed command might be
the value of the time required to cover the'distance between reference
points. In this case a comparison of the command time value and mea
sured elapsed time made at each reference indicates whether the vehicleThe vehicle operates in an open-loop modeshould speed up or slow down.
between corrections. A speedometer control allows closed loop operation
to be maintained by continuous adjustment of the speed in accord with
the commanded value and previous correction.
Tone type speed control signals allow direct and continuous compari
son viith those vehicle speedometers which yield a frequency output. The
true ground speed devices need no calibration correction signals, but
those operating through the vehicle wheels do because of slip.
The speed commands may be times or tones but may.also be the actual
speed, or a code representing the speed, or an acceleration profile.
The variations are many and the implementations with discrete logic
elements can have very different topologies. The obvious differences
tend to disappear when microprocessor implementation is used. The
differences then show up in the software or program.
The processing for poiht follower speed control is merely a con
tinuous closed loop system. Additional processing may be required if
corrective actions are to be taken in the event the vehicle slips from
one point to the next or advances due to overspeed. The action to be
taken depends upon the entire system design, including such factors as
nominal speed, headway, braking ability, and headway sensing.
G. HEADWAY SENSORS
Devices to determine if a safe distance exists ahead of a vehicle
are somewhat akin to the traveling block system used by guided transit.
" If a certain distance ahead is clear, then maximum speed may be main-
If an object is detected but still at some distance, then atained. moderate or reduced speed is to be observed. When the distance falls to
some minimum, the following vehicle is obliged to stop.
Some transit systems have proposed headway sensors as the speed con
trolling,device (Ref. 33). In automotive service, the prime emphasis has
been to develop headway sensors for collision avoidance or air bag deployment.
Headway sensors have been primarily radar based using continuous
sweep frequeficy (as in a radar altimeter).wave, ultra short pulse, or Some techniques have required cooperating reflectors on the rear of the
preceding vehicle while others use parametric passive antennas as freRoadside clutter and opposing trafficquency doublers on the car ahead.
have posed serious obstacles to the development of viable devices.
Acoustic and laser techniques have and are being investigated, but they
also have similar problems.
2-21
The headway sensor output is used as an overriding command tothe speed control circuitry. The headway sensor is considered a vitalfunction to vehicular safety.
A telemetry approach to headway sensing has been proposed wherebyeach vehicle transmits its poition andspeed to-the vehicle--nearby
-Raf. 33). _This technique also transmits acceleration data. Eachvehicle has a signal processor and becomes a part of a distributed computer guidance system.
H. ACTUATORS
Brake and throttle actuators which can perform under automaticcontrol and not interfere with manual operation are needed for automotiveapplication. Throttle actuators are available with limited speed controlrange. These criteria are usually met with pneumatic devices where engine manifold and the atmosphere provide the operating forces. Hydraulicactuators are also used but they are more difficult to decouple formanual operating conditions.
Position feedback is sometimes required from the actuators to thespeed control servo. Potentiometers are commonly used in developmentalsystems, but these may be replaced with capacitive-position-to-frequencysensors currently being developed.
I. GUIDANCE-BASED TESTING
The lateral and longitudinal guidance elements interface in threefunctional areas on the automobile - steering, braking, and air-fuelmetering. The headway sensor system independently interfaces with thebraking system and may also have fuel and ignition cut-off capabilities.
The automation required to perform lateral guidance can providethe means to measure the total free play in steering. This free playis made up of looseness in steering arm and relay rod ends and the backlash in the steering gear box or rack and pinion assembly. The arm androd ends are involved regardless of the type of steering mechanizationor the automatic guidance servo. Position sensors to provide measuresof the angular motion of each wheel together with the motion of theservo will determine the deadband in the arm and rod ends. These sensorsmay also be used to measure-toe-in and steering geometry (not camberor caster). If the servo is above the steering gear, then the backlashis also included in the deadband, and a third position sensor willbe necessary to apportion the looseness to the contributing elements.
There are and have been several original equipment and after marketdevices installed to help maintain constant vehicle speed. These devicesuse the revolutions of the speedometer cable as the speed reference andthe servo typically uses manifold depression to provide a means ofindependently controlling throttle valve position. The servo is usuallyanalog at present, but speed control is a prime candidate for microprocessor control.
2-22
Current speed controls can provide a starting point for longitudinal control interfacing and also a means of determining some dynamicengine vehicle performance tests. The tests would probably be associatedwith step-wise-speed increases of various amounts to determine if-the
accelerations indicate sufficient engine reserve for automatic operation.Detailed diagnosis for lack of engine reserve must rely on additional
tests.
The longitudinal guidance system -as well as the headway sensor
must also interface with the braking system. In a similar manner to
accelerations, overall braking system performance checks could be made
by commanded step-wise speed reductions. Again, more detailed measure
ments which are independent of the actuation means (i.e., automatic or
manual) would be needed to determine pad or lining wear, brake line
pressures, leak rate, fluid level, or any other factor which would be
critical to braking performance.
2-23
SECTION III
PERFORMANCE CRITERIA
A. INTRODUCTION
This section of the report is concerned-with determining which
vehicle performance parameters should be measured and what indications
should be provided for the purpose of meeting highway entry criteria.
A qualitative assessment of these criteria is presented.
The contributors to mechanically caused accidents as well as parts
expected to be replaced during extended vehicle life are presented and
related. A discussion of nonaccident breakdowns and probable causes is
included.
The last part outlines several possible configurations of on-board
safety-telemetry processing equipment in relation to other vehicular
electronic subsystems.
B. HIGHWAY ENTRY CRITERIA
The entry criteria for automated interurban highways must screen
out incompletely equipped, improperly performing, and potentially unreli
able vehicles. These vehicles, if allowed entry, might break down either
suddenly or gradually becoming a hazard to other vehicles.
The incompletely equipped vehicle is probably the easiest to detect
but might prove the most difficult to deter. The improperly performing
vehicle can be detected with more difficulty but with a high degree of
certainty. The properly operating but potentially unreliable vehicle is
obviously the most difficult to detect with surety.
Sufficient fuel to complete the journey is the foremost requirement
The other very broad requirement is that adequate performancefor entry.
can be maintained throughout the journey. The performance dynamic
criteria are in the steering, braking, acceleration, speed control,
and economy areas.
1. Dynamic Performance
The steering must have adequate responsiveness with proper damping
and limited overshoot. The tracking offset, if any, must be limited to a
very small amount of the tracking range of the lateral guidance sensor.
Braking effectiveness criteria should cover the deceleration
capabilities in both normal speed control functions and emergency situa
tions. The criteria might relate the pressure on the pedal or in the
braking system to the deceleration achieved.
3-1
The acceleration performance must be such as to meet the longitudinalcontrol requirements at grade changes and merges (if any). Both partand full throttle acceleration criteria are required,. The former isprimarily for speed control while the latter is needed to measure engineand transmission conditions and possibly allow for emergency maneuvers;if such are to be allowed in the guidance,system-design-.
Criteria for speed control must determine if the speed controltolerance is within the accuracy required for the method employed.Completely deterministic speed control systems, where the vehicle followsan imaginary point, need as criteria the data on vehicle displacementfrom the desired position. This longitudinal error is related to the"tightness" of the speed control loop. On open loop or commanded speedcontrol, the accuracy requirement is more stringent because vehicles mustbe prevented from bunching to the point where the on-board headwaysensors take over and modify the distance to the car ahead. This wouldchange the operation of the guidance system to a different mode. Surging, which might be a result of a poorly-tuned engine or a faultyon-board speed control system, should also be included in the speedcontrol measurement criteria.
The economy or miles per gallon currently being achieved is anotherdynamic entry criteria. This is naturally related to the fuel on boardand the length of the journey and would establish that the trip can orcannot be completed with sufficient fuel margin.
The last dynamic performance criteria is related to the on-boardheadway sensor. The rate of closure sensitivity as well as the minimumdistance threshold must be determined to determine if air bag (or otherrestraint) actuation or braking may be properly performed.
2. Static Performance
Static performance criteria which do not require vehicle motionor the effect -of vehicle-dynamics must also be met. The principalmeasure that must be made is the weight of the vehicle which is requiredto determine expected vehicle dynamics. Other examples of static criteria would be the determination of the braking actuator response tothe braking signal. The actual criteria would depend on whether thebraking system is proportional or not. A similar criteria would beapplied to the throttle control portion of the speed control system.The steering control actuation in response to a steering signal isanother example of static criteria. Most automatic steering systemswould disconnect the manual steering wheel to reduce the inertial loadingon the steering servo. Whether this has been accomplished or not isanother static criteria. The minimum actuation distance for the anticollisionor air bag headway sensor is a static criteria which may be measuredalong with the dynamic rate of closure criteria.
3-2
3. Indications
Highway entry criteria should also be concerned with the ageand prior service of original and replaced parts. Replaced parts includethose replaced at normal maintenance intervals (such as spark plugs),those substituted for failed parts (e.g., belts and hoses), or parts
near end of life (brakes, shock absorbers, etc.). Service intervals
currently promulgated by automobile and parts manufacturers are usually
defined in terms ,of elapsed time or mileage for most maintenance.Engine oil and various filter replacement intervals are about the only
ones that are recognized to be affected by other conditions such as
sustained high speed, stop-and-go driving, or dusty conditions.
Additional indications which might be judged as criteria are
measures of tire tread depth or brake lining thickness at the last
several inspections. These data would indicate the rate of wear and
possibly provide end of life prediction data. In a similar manner, the
economy history of the vehicle could indicate a deteriorating enginecondition.
4. Sensed Parameters
The primary parameters that should be sensed to determine if a
vehicle meets entry criteria are at least those now provided to the
manual operator. These are not limited to those parameters which are
displayed by instruments on the dash but also include fluid levels which
can be measured by dipstick or visual sighting. Also included are those
equipments which can be judged by observing the operation or physical
condition such as lights, windshield wipers, tires, glass heaterdefroster, door and hood latches, etc.
5. Failures and Replacements
Mechanical failures are the principal cause of accidents in only
a small percentage of single and multiple car mishaps. An ordered list
has been determined (Ref. 34) and is essentially as follows:
(1) Brake performance.
(2) Vehicle driveability (engine performance).
(3) Suspension.
(4) Brake lines and wheel cylinders.
(5) Drums and discs.
(6) Accelerator linkage.
(7) Power steering.
(8) Wheel balance and alignment.
3-3
(9) Hood latch.
(10) Defroster.
(11) Headlights.
(121 Windshield wipers.
(13) Automatic transmission.
Another study (Ref. 35) estimated which parts on a 1970 standardsized automobile would probably need replacement before 100,000 odometerindicated miles had been accumulated. This list, not ordered as topriority, is as follows:
(1) Battery and cables.
(2) Radiator hoses.
(3) Alternator.
(4) Belts.
(5) Water pump.
(6) Distributor cap, points, condensor, rotor.
(7) Heater hoses.
(8) Air filter.(s).
(9) PCV valve.
(10) Ignition coil.
(11) Air pump.
(12) Timing gear chain.
(13) Fuel vapor canister filter.
(14) Fuel pump.
(15) Oil filter.
(16) Control arm bushing (steering).
(17) Spark plugs.
(18) Spark plug wires.
(19) Exhaust pipe.
(20) Voltage regulator.
3-4
(21) Windshield wiper blades.
(22) Crossover pipe (exhaust).
(23) Shock absorbers.
(24) Tie rod ends.
(25) Brake pads, disc parts, linings, wheel cylinder parts.
(26) Ball joints.
(27) Master cylinder.
(28) Universal joints.
(29) Starter.
(30) Brake rotors or discs.
(31) Tires.
(32) Muffler.
(33) Tail pipe.
(34) Steering idler arm.
The engine, transmission, and differential were expected to last
the entire 100,000 miles.
The wear-out list appears very lengthy because many items which
are to be routinely replaced at prescribed intervals are included.
There are also many items which are often replaced on the basis of age
rather than mileage. Also included are many items where replacement
could be avoided through.a proper maintenance regime. The list is very
inclusive but might be characterized as pessimistic.
The first five items on the list of accident contributors indicate
that maintaining the dynamic performance of the braking and engine
systems would help in avoiding mechanically induced accidents. The
suspension category includes tie rod ends, ball joints, and to a lesser
degree shock absorbers. These suspension components more likely con
tribute to accidents through catastrophic failure rather than gradual
degradation. The gradual wear would probably lead to a lack of mechani
cal integrity failure if maintenance were not performed and this wear
would certainly cause difficulty in the-servo loop of an automatic
guidance system. Wear indicators exist for ball joints which rely on
manual inspection (sight or feel of a pin projection) but no wear indicatorwas found for tie rod ends in the course of the study.
3-5
6. Breakdowns
Vehicle breakdowns, where the vehicle is forced to a stop within ashort time after a malfunction, are commonly caused by the following(arranged approximately in decreasing order of likelihood):
W1 Out of gas.
(2) Tire failure - blowout or flat.
(3) Overheating - belt breakage, coolant loss, lack of oil, vapor lock.
(4) Ignition - primary circuit failure.
(5) Driveline, engine, transmission.
(6) Speed control - throttle and brake actuators.
(7) Lateral control - hydraulic pump belt.
Items (6) and (7) are assumed for automatic highway application.
The out-of-gas situation is seldom caused by equipment failure ormalfunction. The usual reason is inattention to a low fuel indication.The measurement technology is well established.
Tire failures, particularly flats-caused by punctures, are muchmore likely with tires that are bald or with little tread. Blowouts orsidewall failures are often the result of overheating due to underflation, prior injury (rocks or curbs); or occasionally manufacturing faults.At present, it appears that only tire pressure will be a feasible continuousmeasure. Tread wear and obvious injuries may be determined during inspectionswhile internal faults are only detectable by sophisticated testers such asthat developed by Southwest Research Institute.
Overheating may be the result of any of many failures. Fan beltfailure is a common cause primarily because the water pump is driven fromthe same shaft. The fan is not usually needed at highway speeds butwater circulation is essential. Other failures, usually heater or radiator hose breakage, result in a dramatic coolant loss and overheating.This loss sometimes goes undetected by the temperature gauge as the sensor relies on the heat transfer from fluid to properly indicate hightemperature and steam or vapor does not supply sufficient heat. Lack ofoil is another cause of overheating, but, like lack of fuel, is usuallycaused by lack.of attention. It is very seldom that an on-road vehiclesuffers a sudden loss Of oil through a loss of integrity of the oilsystem.. Even an oil pump failure will indicate through loss of pressurewell before overheating occurs. High underhood temperatures, occurringdue to several conditions such as grades, following winds, air temperature, air conditioner use, and improper spark timing can cause vapor lockwhen the fuel boils (usually in an unpressurized or suction line). Vaporlock will result in a breakdown which can be misinterpreted as an out ofgas condition, which is technically true.
3-6
Ignition failures in the primary circuit which cause a total loss ofspark plug voltage are another breakdown cause. In Kettering ignition,this failure is usually due to lack of maintenance of the points andoccurs when the cam rubbing block is worn to an extent that the pointswill not open. This is easily discerned from a dwell angle measurement.Capacitor failure is another cause of loss of spark as is an open coil.Either of these failures are rare and usually are a result of manufacturingerrors, particularly if the fault occurs shortly after installation.Coils can be damaged by abuse by forcing internal secondary'circuitarcing which can happen if the engine,is cranked with the high tensionlead dangling in air. Other primary circuit failures are usually theresult of open connections.
The high energy or breakerless ignitions which rely heavily onsemiconductor technology and are surplanting the point systems are subjectto failures of a different sort. Underhood heat, moisture, vibration, andimpurities occurring during manufacture are some of the failure causes. The first three can be minimized by component placement and the last byimproved quality control. Improper application or exposure of semiconductorsto high-energy voltage transients are also causes of failure whichcan be avoided by proper engineering and attention to the environment.
The driveline, engine, or transmission as the principal cause of abreakdown is becoming more and more unlikely. The improvement inreliability of these major components has been steadily improving and willno doubt continue.
The last two causes of breakdown are conjectures and are placed atthe bottom of the list to indicate that they must be equal or superior tothe propulsion system in reliability for automatic highways. The speedcontrol, particularly the throttle and brake actuators, must be.extremelyreliable, especially in situations where there is little headway betweenvehicles. While the speed control system is probably backed up by an onboard headway sensor, a failure in either throttle or braking could slowor stop all following vehibles. An overspeed condition might resultin the headway sensor applying the brakes to avoid closure with thecar ahead while the throttle is belng opened by the fault.
The lateral guidance steering system should be the most reliable subsystem as a failure at high speed could quickly become catastrophic.A fail safe system is required and any single failure shoud not renderthe system inoperative. The manual operator cannot be depended upon toprovide the back-up function. Redundancy in sensors and electronics isprobably called for as well as means to back up mechanical linkage connections to avoid complete loss of function. An example of the lattermight be an auxiliary connection around a tie rod end which would comeinto use if the tie rod end came apart. Other steering and suspensionparts are also candidates for fail safe treatment.
7. Summary
The entry criteria that vehicles would have to meet to enterautomatic highways are, in the main, the same that a cautious driver would require of a vehicle before embarking on a similar trip. These
3-7
,are primarily static measurements or conditions with well establishedlimits of wear, component age, accrued mileage, and quantities of fuel,oil, water, and other liquids and lubricants.
The dynamic performance which would be demanded by automatichighways can only be qualitatively-judged at this time-. That is,numerical values of acceleration and deceleration or lateral stabilitycannot be assigned. These are functions of vehicle size, weight, propulsion means, and suspension. They can be determined by simulation(Ref. 36) or by experiment (Ref. 37), but a parametric study at thistime is probably premature.
C. PRECISION OF MEASUREMENTS
Engine performance parameters which affect driveability, performance and economy are well understood by the industry as to therange and precision of measurement required. The accuracies that mustbe maintained during the life of the sensor and under the environmentsexperienced are also well established. Fluid levels to be maintainedand the low (or high) limits that can be tolerated for extended periodsare also well known.
The fuel, the most rapidly consumed item, dictates the remainingrange of the vehicle. The measure of fuel quantity depends on theeconomy of the vehicle and the trip duration and profile. The length and topography of automated highways will be different, requiringdifferent quantities of fuel as a minimum for completion. Fuel stops onautomated highways are not contemplated.
,Since it is better to be cautious and avoid running out of gas,the present philosophy of fuel measurement should be maintained. Thatis, when "it" reads empty, there are a couple of gallons left. Forautomated highway use, the fuel level sensor should probably read tothe nearest gallon which is 4% to 10% of a'full tank and should have atolerance that favors a conservative measurement.
Measurements of the tire treads and brake linings should also beon the careful side. The tire tread depth is probably a good indicator of remaining life particularly if uniform across the width of the tire.This wear pattern indicates a proper inflation history, mechanical
- alignment and freedom from some forms of driving abuse. The tire tread wear versus mileage at uniform speeds such as on an automated highway and at different loads has probably been investigated at length, and the mandated tread wear indicators provide a universally accepted minimum tread depth. Therefore, it appears that the tire should be measuredprecisely enough to assure that this minimum depth will not be reachedat the end of the journey.
If a 20,000 mile tire with an initial tread of 5/16 in. isallowed to wear to 1/8 in., then the wear rate is roughly .01 -in.perthousand miles. Braced tread tires achieve wear rates of less than halfthat value. Manually operated tread depth gauges measure to 1/32 in.
3-8
(about .03 in.). It appears that a measurement precision in the rangeof .01 to .03 would be adequate..
The precision of brake lining measurements is very difficult topredict, particularly if one supposes that a well designed automatedhighway should only require one brake application when slowing down toleave. If more braking applications are required and emergency stopsmust be considered, then lining thickness adequate for the stops mustbe provided. Current on-board brake inspection systems vary widelyin performance and effectiveness (Ref. 38) but all provide warnings wellin advance of complete wearout. The measurement precision provided by adiscrete sensor, either electrical, acoustic noisemaker, or pulsatingpedal is probably not sufficient to bar a vehicle from the highway. Ifthe mileage since onset of the warning were also known, this would allowa more defensible evaluation to be made of the brake life remaining.
If the discrete warning comes at 1000 miles (average) before endof life, it will have different implications for the driver who gets 6to 10 thousand miles and the one who gets 40 to 60 thousand miles onequivalent linings. It appears that an incremental brake lining wearsensor yielding percentage of lining left (10 to 20% steps) might bemore suitable. The incremental indication of wear could yield a wearhistory if the mileage accrued at-each increment were recorded. Thewear history could then be used to predict lining end of life.
D. TESTING AND DIAGNOSIS
The flight computers of unmanned spacecraft are exercised byseparate computer based testers or support equipment. The testingphilosophy is that continual successful operation in the past andpresent of flight equipment is a trustworthy indication of successfulfuture operation during the mission. This same philosophy is applicableto automotive systems.
The support equipment is a means to apply stimuli to the flight computers and to record and compare the results. The support equipmentis not the functional equivalent of the flight equipment. Functionalequivalency resides in a very large general purpose computer simulatorwhich emulates the flight computer. This large machine is a thirdparty in the testing and it is used to determine the responses of theflight computer at various internal test points and at the output interfaces to flight computer testing programs.
All phases of the flight computers'are simulated by applying inputs and noting the responses. The inputs and responses are recorded on tape and supplied to the support equipment. The support equipment then applies these same inputs to the actual flight computer hardware and records the outputs. A comparison is made with the emulator outputs and agreements or discrepancies noted.
This same procedure is repeated over and over again under avariety of environmental conditions such as temperature extremes,voltage limits, vibration, shock, humidity, and vacuum. The flight
3-9
equipment is also exposed to environments beyond these limits whilenonoperating and then retested when the environment is returned to thenormal limits. This environmental testing should weed out the marginalcomponents and further develop confidence in the ability of the flight,equipment to withstand hostile environmental conditions.
The safety-telemetry processor in an automobile equipped forautomatic highway use is very much akin to the spacecraft support equipment. It should have the ability to apply stimuli to the various subsystem processors by either direct input or by simulation of a sensorinput signal. It would then compare the response obtained to thatexpected and determine if the two were close enough-alike to indicateproper operation of the subsystem. The expected results could either bestored in the safety-telemetry processor or in the wayside highway accesscontroller. In either case, these expected subsystem responses wouldprobably have been obtained from a third computer which performed thesimulation for all vehicles of a particular type, model or configuration.
If all the subsystem's proper responses were stored on board, thecomparison could be done there and a simple signal, indicating everything was all right, could be sent to the roadside. On the other hand,if the expected subsystem responses obtained from the simulator includedall those which would be obtained with various malfunctions in thesubsystems, the storage capability of the on-board safety-telemetryprocessor would probably be overwhelmed. It would then seem that roadside computer storage of "malfunctioning subsystem" responses would bemore appropriate.
If the safety-telemetry detected an abnormal response from aparticular subsystem, this entire response could be sent to the roadside'where it would be compared with malfunction responses. If agreementwere found, then an error message indicating the malfunction could begenerated. If this malfunction were serious enough to deny access tothe highway by the vehicle, then it could also be forwarded to thevehicle operator so that corrective action might be initiated.
The foregoing is illustrative of but one possible technique. Itmay be desirable to have the on-board safety telemetry processor diagnose simple obvious malfunctions and leave the more complicated to the roadside computer. The decision as to which are simple and which complex requires additional criteria.
Regardless of the system configuration or where the proper operation or malfunction decision is made, there are certain restrictions thatmust be observed in the testing of the various subsystems. This isespecially true if the subsystem tests are made "on the fly" and athighway speed. The two critical subsystems are obviously those forlateral and longitudinal guidance. The response to any stimulus of thesetwo systems must be kept small to avoid an unsafe vehicle response orseriously disturbing the manual operator. The diagnosis of the lateraland longitudinal guidance systems will then have to rely on small signalresponse unless the checkout can be done at very low speed where fullrange response testing is practical.
3-10
1. Vehicular Electronic Subsystems
Semiconductor electronic circuits and functional elements have
found application in four areas in vehicular use (Ref. 39). The first
of these, and also the oldest application, being entertainment; radio,
both AM and FM stereo, tape systems and radio communications. The
other areas are:
(1) Devices which convert driver instructions to actions:
(a) Electronically Sequenced Turn Indicator Flasher.
(b) Constant Speed Control (Cruise Control, Etc.).
() Heater-Air Conditioner (Climate) Control.
(d) Intermittent Windshield Wiper.
(2) Devices which regulate or control engine and related
operations:
(a) Alternator Rectifiers.
(b) Alternator Regulator.
(c) Electronic Fuel Injection.
(d) Ignition (High Energy, Capacitor Discharge, Transistor
Etc.)
(e) Electronic Spark Timing.
(f) Exhaust Gas Recirculator Valve Control.
(g) Emission Control (Lean Burn).
(3) Devices which aid, boost, or assist driver operations
and indicators:
(a) Controlled Slip Braking.
(b) Headlight Dipping Control.
(c) Tachometer.
(d) Clock.
(e) Intrusion Alarm.
(f) Electronically Controlled Automatic Transmission.
(g) O.K. Panel.
3-11
(h) Headway Sensor (Radar, Optical.)*
i) Automatic Braking.*
(j) Air Bag Deployment Control.
() EMectronic Panel Display.*
(1) Driver Information System.*
m) Impaired Driver Detector.*
With few exceptions, the devices in all categories require sensorsthat can interface with the electronics and many devices require actuatorsor switches which can be electronically operated.
Future trends are for microprocessors to control the devices orprovide the function. Since the devices are distributed throughoutthe vehicle, a multiplexed bus system for conveying sensor data to the microprocessor(s) and actuating data to the controllers is currentlybeing studied for automotive application.
Another ramification of this future trend is that the sensors andtransducers currently installed temporarily for off-vehicle diagnosisand test equipments, may very well be permanently installed as part of asubsystem. Therefore an on-board diagnosis system becomes a realizablepossibility.
2. Safety Telemetry Systems
A basic assumption in automatic highway operations is that onlyproperly equipped and operating vehicles should be allowed entry.Additionally, it is assumed that these determinations will be made,without driver intervention, just prior to entry onto the highway.
The implications of these assumptions are that there is some sortof "automatic checkout" of the vehicle to assure that all subsystems areoperating properly and that there is a means for relaying this information to the highway entry controller which makes the decision to grantor withhold access to the vehicle. Further inferences which may bedrawn are that there are means to prevent access to unsuitable vehiclesand that defensible reasons for not allowing access will be given to thevehicle operator. These latter aspects are not the concern of this effort.
*R and D Status at Present.
3-12
The possible configurations of the on-board checkout and relayingsystem depend on whether the checkout subsystem will be combined or not with other systems and whether sensor data or only the checkout resultswill be sent tq the roadside highway controller. The latter factor determines the complexity of the on-board-checkout or safety telemetry processor.
In the configuration shown in the block diagram of Figure 23,the safety telemetry processor and communication link have been addedto the vehicle as separate subsystems. An engine diagnostic processorand transmission controller are assumed to be part of the vehicle electronics.The safety telemetry processor receives data from sensors in the lateralguidance (steering control) subsystem, the longitudinal guidance (speedbraking control) subsystem, as well as from the economy emissions (fueltiming-egr), engine diagnostic and headway sensing subsystems.
If the safety-telemetry processor is principally a data converterand organizer, then it gathers data from the sensors and other subsystems, converts raw data to engineering units, and formats the information into a standardized form for transmission by the communicationlink. The standardized form for the data avoids the necessity foridentifying each piece of data as to its source or what it representsbut places a requirement that the entire message be received error freeso that each bit is in the proper place.
On the other hand, if the safety-telemetry processor has decisionmaking capabilities, then it may determine if the various sensor andsubsystem parameters are within prescribed limits. It can then providea summary message for transmission to the roadside highway controller.This summary can be as brief as a few bits indicating all systems arealright to a few words giving the status of all subsystems.
Regardless of the complexity of the safety telemetry processor for handling sensor or subsystem data, it seems that it should also have sufficient ability to respond to requests or commands from the roadside highway controller. This function would be needed for the exercise ' and diagnosis of all subsystems including the safety-telemetry processor. Connections from the processor to provide forcing functions or stimuli to each of the subsystems would be needed in addition to the subsystems sensor inputs and outputs shared by the safety telemetry. The dynamic response of the lateral and longitudinal guidance subsystems could then be tested by applying a step function to the inputs, for example.
If the safety-telemetry processor is connected to the input andoutput of the other subsystems, the configuration becomes more like thatof Figure 24. The safety-telemetry processor is then effectively inparallel with every other subsystem.
An additional feature of this configuration is a provision for themanual input of historical inspection or repair data. Inspection datasuch as tread depth when related to mileage and time intervals shouldallow a more accurate prediction of end of tire life or conversely areliable estimation of the tires lasting for an additional period. Repair or replacement data if correlated with an operation history ofthe vehicle should similarly provide more reliable prognostication data.
3-13
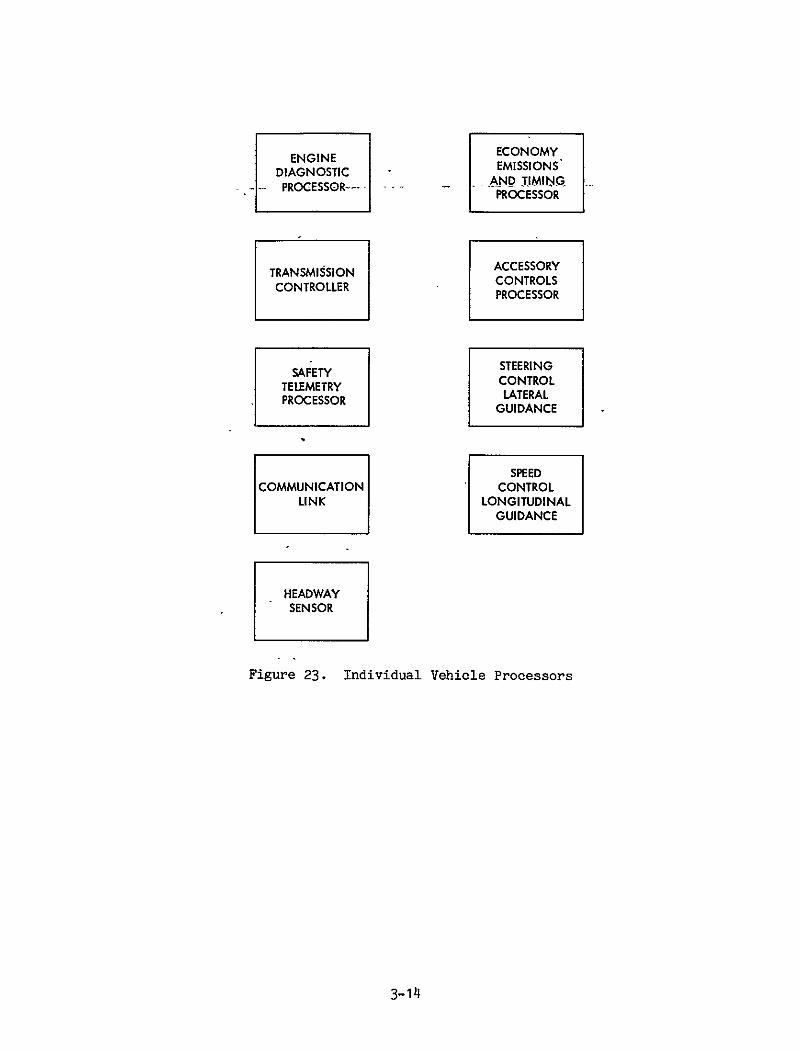
TRANSMISSION ACCESSORY CONTROLLERCONTROLSCON OPROCESSOR
SAFETY STEERINGTELEMETRY CONTROL
PROCESSOR LATERALGUIDANCE
SPEED COMMUNICATION CONTROL
LINK LONGITUDINAL GUIDANCE
HEADWAYSENSOR
Figure 23. Individual Vehicle Processors
3-14
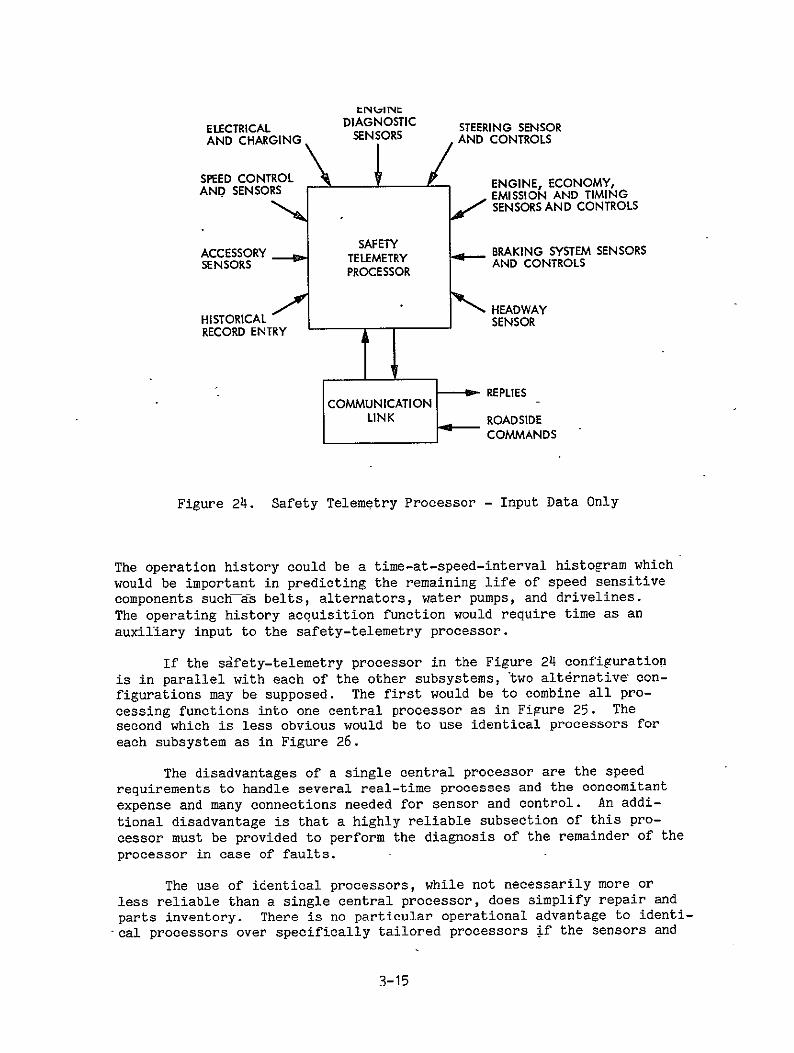
tIM MII
ELECTRICAL DIAGNOSTIC STEERING SENSOR AND CHARGING SENSORS AND CONTROLS
SPEED CONTROL ENGINE, ECONOMY,AND SENSORS EGNEOOYEMISSION AND TIMING " SENSORS AND CONTROLS
ACCESSORY SAFETY BRAKING SYSTEM SENSORS SENSORS - TELEMETRY AND CONTROLS
PROCESSOR
HEADWAY HISTORICAL SENSOR RECORD ENTRY
REPLIES COMMUNICATION
LINK ROADSIDE COMMANDS
Figure 24. Safety Telemetry Processor - Input Data Only
The operation history could be a time-at-speed-interval histogram which
would be important in predicting the remaining life of speed sensitivecomponents such as belts, alternators, water pumps, and drivelines.
The operating history acquisition function would require time as an
auxiliary input to the safety-telemetry processor.
If the sdfety-telemetry processor in the Figure 24 configuration
is in parallel with each of the other subsystems, two alt6rnative con
figurations may be supposed. The first would be to combine all pro
cessing functions into one central processor as in Figure 25. Thesecond which is less obvious would be to use identical processors foreach subsystem as in Figure 26.
The disadvantages of a single central processor are the speedrequirements to handle several real-time processes and the concomitant
expense and many connections needed for sensor and control. An addi
tional disadvantage is that a highly reliable subsection of this pro
cessor must be provided to perform the diagnosis of the remainder of the
processor in case of faults.
The use of identical processors, while not necessarily more or
less reliable than a single central processor, does simplify repair and
parts inventory. There is no particular operational advantage to identi
"cal processors over specifically tailored processors if the sensors and
3-15
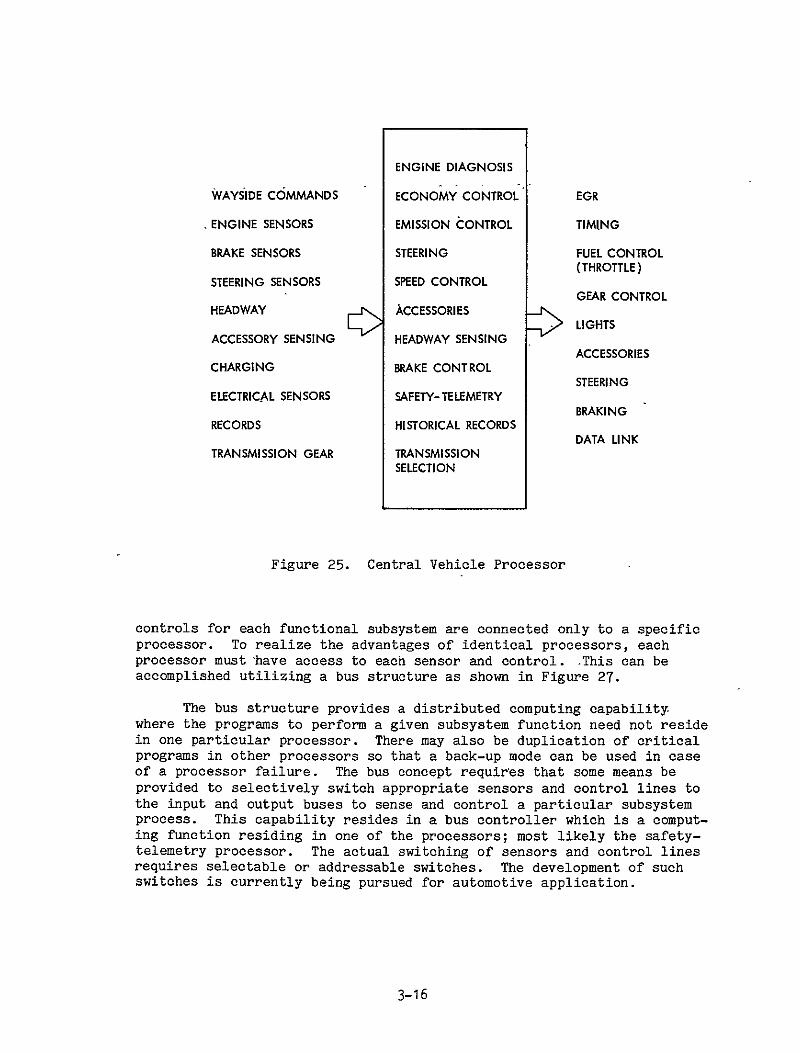
ENGINE DIAGNOSIS
WAYSIDE COMMANDS ECONOMY CONTROL EGR
ENGINE SENSORS EMISSION CONTROL TIMING
BRAKE SENSORS STEERING FUEL CONTROL (THROTTLE)
STEERING SENSORS SPEED CONTROL
HEADWAY E ACCESSORIES GEAR CONTROL LIGHTS
ACCESSORY SENSING HEADWAY SENSING ACCESSORIES
CHARGING BRAKE CONTROL STEERING
ELECTRICAL SENSORS SAFETY-TELEMETRY BRAKING
RECORDS HISTORICAL RECORDS DATA UNK
TRANSMISSION GEAR TRANSMISSION SELECTION
Figure 25. Central Vehicle Processor
controls for each functional subsystem are connected only to a specificprocessor. To realize the advantages of identical processors, eachprocessor must 'have access to each sensor and control. .This can be accomplished utilizing a bus structure as shown in Figure 27.
The bus structure provides a distributed computing capabilitywhere the programs to perform a given subsystem function need not residein one particular processor. There may also be duplication of criticalprograms in other processors so that a back-up mode can be used in caseof a processor failure. The bus concept requires that some means beprovided to selectively switch appropriate sensors and control lines tothe input and output buses to sense and control a particular subsystemprocess. This capability resides in a bus controller which is a computing function residing in one of the processors; most likely the safetytelemetry processor. The actual switching of sensors and control linesrequires selectable or addressable switches. The development of suchswitches is currently being pursued for automotive application.
3-16
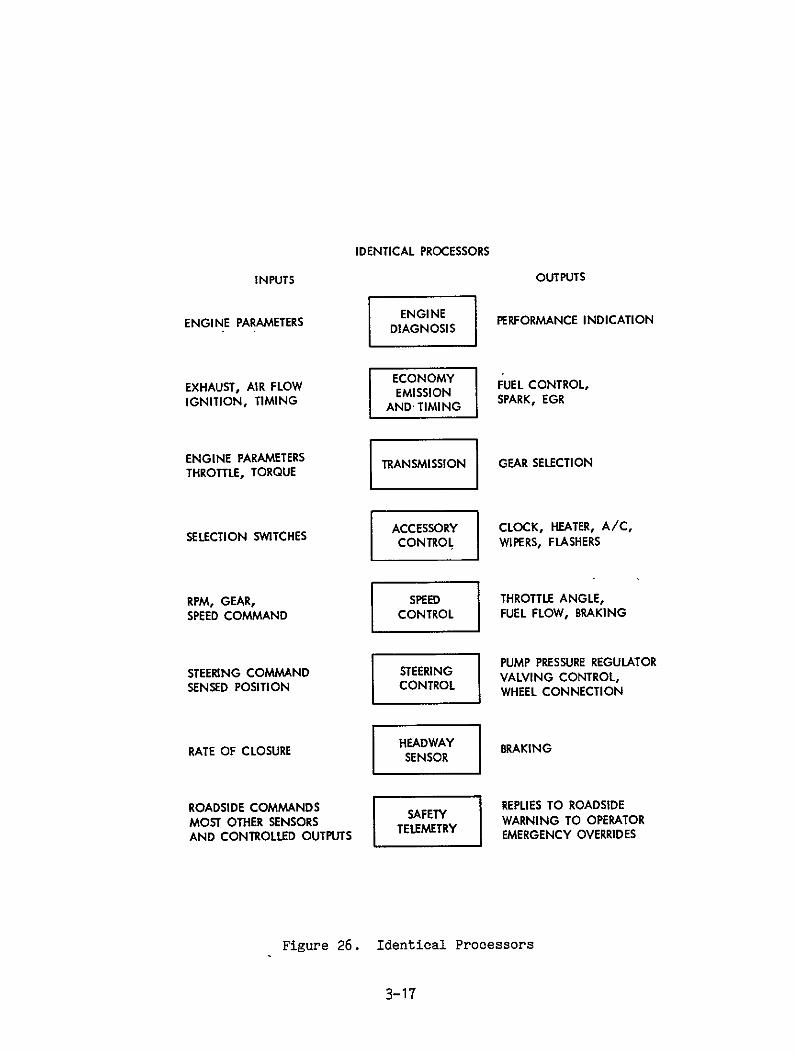
INPUTS
ENGINE PARAMETERS
EXHAUST, AIR FLOW IGNITION, TIMING
ENGINE PARAMETERS THROTTLE, TORQUE
SELECTION SWITCHES
RPM, GEAR, SPEED COMMAND
STEERING COMMAND SENSED POSITION
RATE OF CLOSURE
ROADSIDE COMMANDS MOST OTHER SENSORS AND CONTROLLED OUTPUTS
IDENTICAL PROCESSORS
ENGINE PDIAGNOSIS
IECONOMY ANDTIMING
TRANSMISSION
ACCESSORY CONTROL
SPEED CONTROL
STEERING CONTROL
HEADWAYSENSOR
TEEMTRY
OUTPUTS
PERFORMANCE INDICATION
UEL CONTROL, SPARK, EGR
GEAR SELECTION
CLOCK, HEATER, A/C,WIPERS, FLASHERS
THROTTLE ANGLE, FUEL FLOW, BRAKING
PUMP PRESSURE REGULATORVALVING CONTROL, WHEEL CONNECTION
BRAKING
REPLIES TO ROADSIDE WARNING TO OPERATOR EMERGENCY OVERRIDES
Figure 26. Identical Processors
3-17
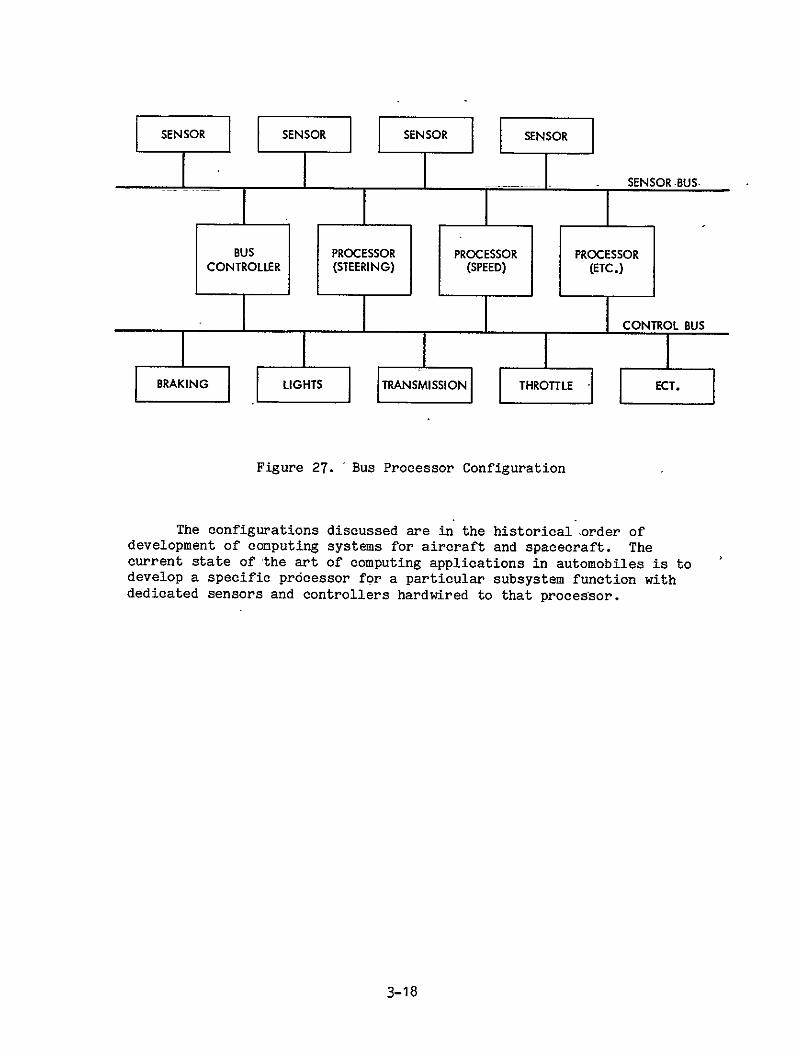
JSENSOR J SENSOR J SENSOR SENSOR
EJp SENSOR-BUS-I I I
BUS PROCESSOR PROCESSOR PROCESSOR CONTROLLER (STEERING) (SPEED) (ETC.)
7 - JICONTROL BUS
Figure 27. Bus Processor Configuration
The configurations discussed are in the historical .order ofdevelopment of computing systems for aircraft and spacecraft. Thecurrent state of the art of computing applications in automobiles is todevelop a specific pr6cessor for a particular subsystem function withdedicated sensors and controllers hardwired to that processor.
3-18
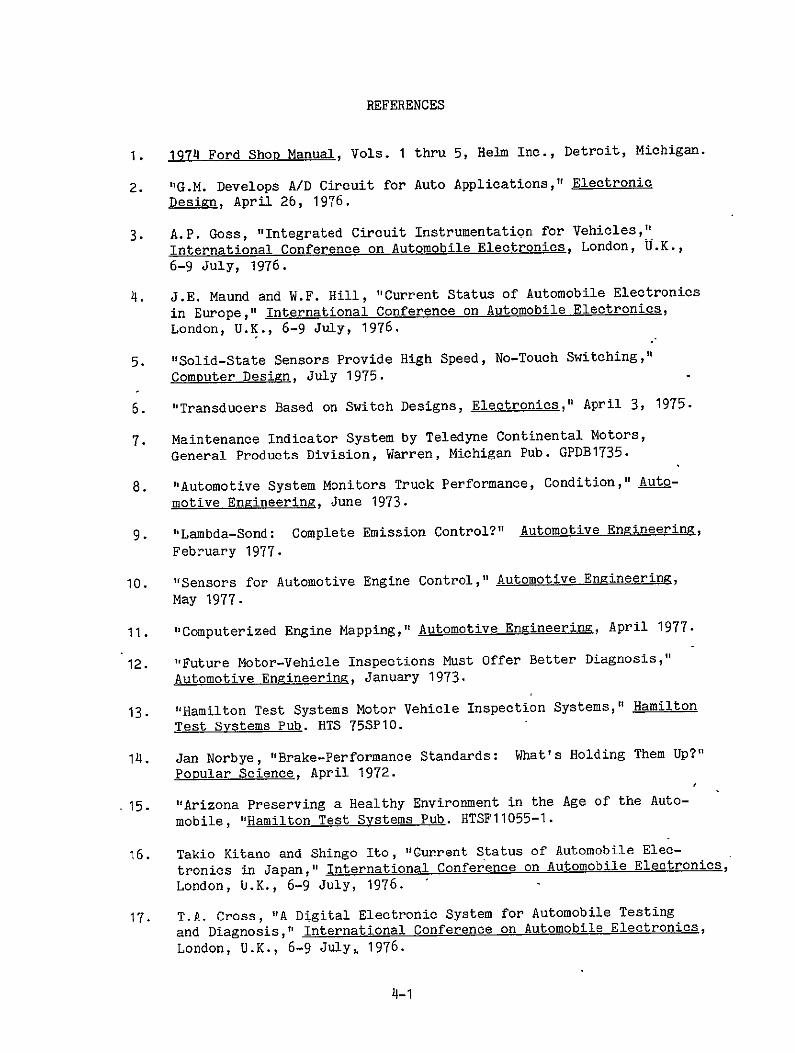
REFERENCES
1974 Ford Shop Manual, Vols. 1 thru 5, Helm Inc., Detroit, Michigan.1.
2. "G.M. Develops A/D Circuit for Auto Applications," Electronic
Design, April 26, 1976.
3. A.P. Goss, "Integrated Circuit Instrumentation for Vehicles,"International Conference on Automobile Electronics, London, U.K.,
6-9 July, 1976.
J.E. Maund and W.F. Hill, "Current Status of Automobile Electronics4. in Europe," International Conference on Automobile Electronics,
London, U.K., 6-9 July, 1976.
5. "Solid-State Sensors Provide High Speed, No-Touch Switching,"
Computer Design, July 1975.
6. "Transducers Based on Switch Designs, Electronics," April 3, 1975.
7. Maintenance Indicator System by Teledyne Continental Motors,
General Products Division, Warren, Michigan Pub. GPDB1735.
8. "Automotive System Monitors Truck Performance, Condition," Auto
motive Engineering, June 1973.
Automotive Engineering,9. "Lambda-Sond: Complete Emission Control?" February 1977.
"Sensors for Automotive Engine Control," Automotive Engineering,10. May 1977.
11. "Computerized Engine Mapping," Automotive Engineering, April 1977.
12. "Future Motor-Vehicle Inspections Must Offer Better Diagnosis,"
Automotive Engineering, January 1973.
"Hamilton Test Systems Motor Vehicle Inspection Systems," Hamilton13. Test Systems Pub. HTS 75SP10.
14. Jan Norbye, "Brake-Performance Standards: What's Holding Them Up?"
Popular Science, April 1972.
_15. "Arizona Preserving a Healthy Environment in the Age of the Auto
mobile, "Hamilton Test Systems Pub. HTSF11055-1.
Takio Kitano and Shingo Ito, "Current Status of Automobile Elec16. tronics in Japan," International Conference on Automobile Electronics,London, U.K., 6-9 July, 1976.
17. T.A. Cross, "A Digital Electronic System for Automobile Testing
and Diagnosis," International Conference on Automobile Electronics,
London, U.K., 6-9 July, 1976.
4-1
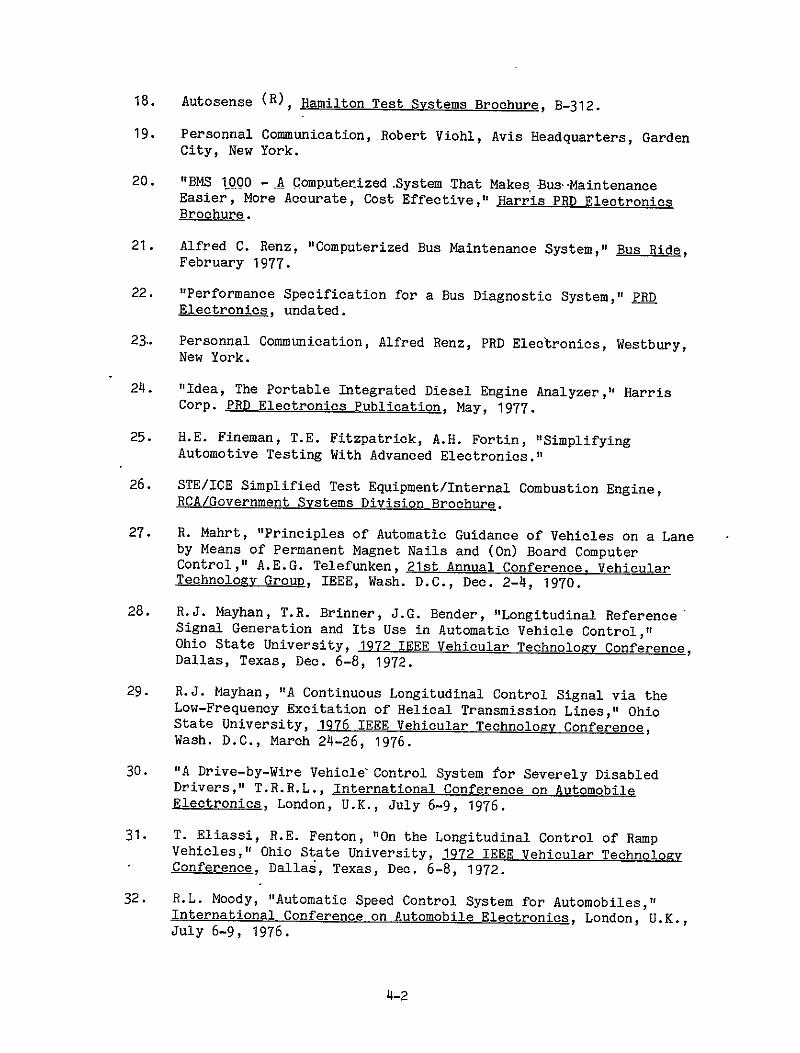
18. Autosense (R), Hamilton Test Systems Brochure, B-312.
19. Personnal Communication, Robert Viohl, Avis Headquarters, GardenCity, New York.
20. "BMS 1000 -.A Computerized.System That Makes-Bus--MaintenanceEasier, More Accurate, Cost Effective," Harris PRD ElectronicsBrochure.
21. Alfred C. Renz, "Computerized Bus Maintenance System," Bus Ride,February 1977.
22. "Performance Specification for a Bus Diagnostic System," PDElectronics, undated.
23. Personnal Communication, Alfred Renz, PRD Electronics, Westbury,New York.
24. "Idea, The Portable Integrated Diesel Engine Analyzer," HarrisCorp. PRD Electronics Publication, May, 1977.
25. H.E. Fineman, T.E. Fitzpatrick, A.H. Fortin, "SimplifyingAutomotive Testing With Advanced Electronics."
26. STE/ICE Simplified Test Equipment/Internal Combustion Engine,RCA/Government Systems Division Brochure.
27. R. Mahrt, "Principles of Automatic Guidance of Vehicles on a Laneby Means of Permanent Magnet Nails and (On) Board ComputerControl," A.E.G. Telefunken, 21st Annual Conference, VehicularTechnology Group, IEEE, Wash. D.C., Dec. 2-4, 1970.
28. R.J. Mayhan, T.R. Brinner, J.G. Bender, "Longitudinal ReferenceSignal Generation and Its Use in Automatic Vehicle Control,"Ohio State University, 1972 IEEE Vehicular Technology Conference,Dallas, Texas, Dec. 6-8, 1972.
29. R.J. Mayhan, "A Continuous Longitudinal Control Signal via theLow-Frequency Excitation of Helical Transmission Lines," OhioState University, 1976 IEEE Vehicular Technology Conference,Wash. D.C., March 24-26, 1976.
30. "A Drive-by-Wire Vehicle Control System for Severely DisabledDrivers," T.R.R.L., International Conference on AutomobileElectronics, London, U.K., July 6-9, 1976.
31. T. Eliassi, R.E. Fenton, "On the Longitudinal Control of RampVehicles," Ohio State University, 1972 IEEE Vehicular TechnologyConference, Dallas, Texas, Dec. 6-8, 1972.
32. R.L. Moody, "Automatic Speed Control System for Automobiles,"International Conference on Automobile Electronics, London, U.K.,July 6-9, 1976.
4-2
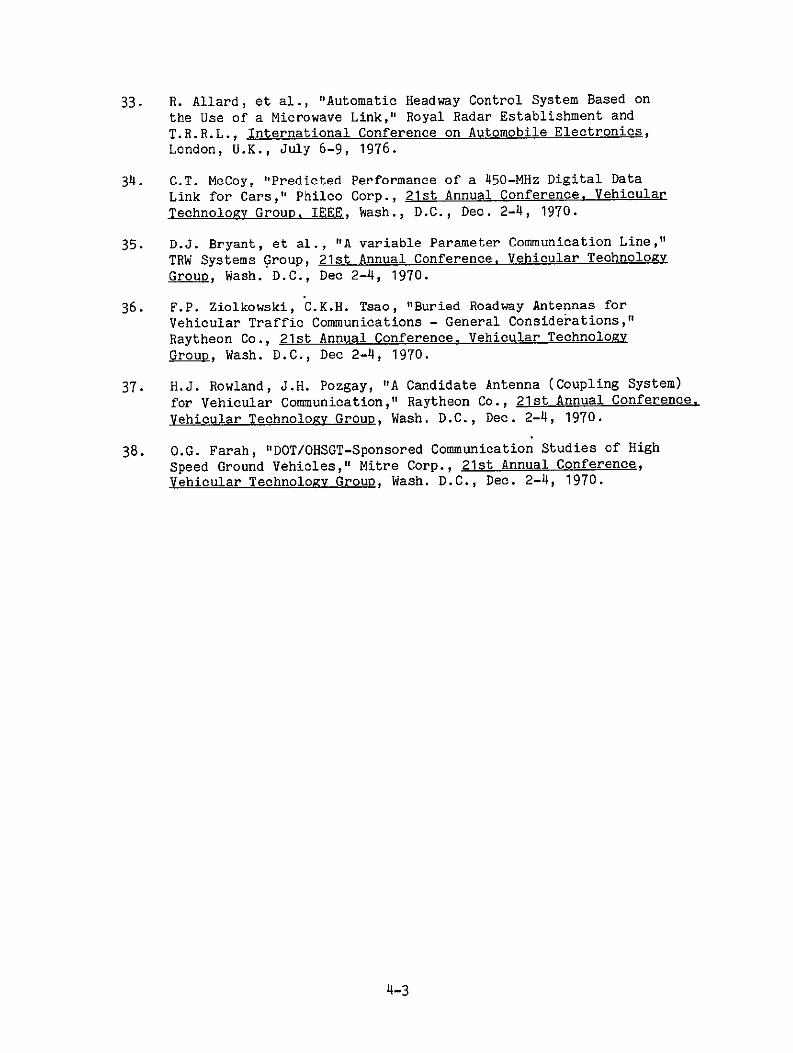
33. R. Allard, et al., "Automatic Headway Control System Based on
the Use of a Microwave Link," Royal Radar Establishment and
T.R.R.L., International Conference on Automobile Electronics,
London, U.K., July 6-9, 1976.
34. C.T. McCoy, "Predicted Performance of a 450-MHz Digital Data
Link for Cars," Philco Corp., 21st Annual Conference, Vehicular
Technology Group, IEEE, Wash., D.C., Dec. 2-4, 1970.
35. D.J. Bryant, et al., "A variable Parameter Communication Line,"
TRW Systems Group, 21st Annual Conference, Vehicular Technology
Group, Wash. D.C., Dec 2-4, 1970.
36. F.P. Ziolkowski, C.K.H. Tsao, "Buried Roadway Antennas for
Vehicular Traffic Communications - General Considerations,"
Raytheon Co., 21st Annual Conference, Vehicular Technology
Group, Wash. D.C., Dec 2-4, 1970.
37. H.J. Rowland, J.H. Pozgay, "A Candidate Antenna (Coupling System)
for Vehicular Communication," Raytheon Co., 21st Annual Conference,
Vehicular Technology Group, Wash. D.C., Dec. 2-4, 1970.
38. O.G. Farah, "DOT/OHSGT-Sponsored Communication Studies of High
Speed Ground Vehicles," Mitre Corp., 21st Annual Conference,
Vehicular Technology Group, Wash. D.C., Dec. 2-4, 1970.
4-3
BIBLIOGRAPHY
Larry Armstrong, "Fuel Management is Stepping Stone," Electronics,March 31, 1977.
Trevor 0. Jones, "The Status of Automotive Electronics in the U.S.A.,"International Conference on Automobile Electronics, 6-9 July, 1976.
Microprocessors and the Automobile, Automotive Engineering, April 1977.
L. Parmer, T. Donahue, U.S. Army Transportation Motor Pool Autosense(R)Evaluation Program Final Report, February 1977, Hamilton Test SystemPub. HTSER July 1975.
Tyrecheck Warns You of Low Tire Pressure, Popular Science, June 1973.
Better Performance,-Less Maintenance Make GM's New Automobile IgnitionSystem a Car Owner's Dream, Electronic Design News, April 20, 1975.
Fred W. Holder, "Anti-Collision Systems for Autos," Popular Electronics,October 1972.
John T. Frye, "Electronics in Automobiles," Popular Electronics,September 1973.
John D. Drummond, "Detroit Puts Electronics in the Drivers Seat,"Electronics, March 17, 1969.
1977 Automobile to Conserve Fuel with a "Microprocessor-based IgnitionSystem," Electronic Design, September 13, 1976.
John F. Mason, "Under-the-Hood Microprocessors Could Turn Up in 1979U.S. Care," Electronic Design, September 27, 1975.
"First I.C. Ignition System in Cars Offers Better Engine Performance,"Electronic Design, April 1, 1975.
I.C. Temperature Sensors: "The Market That Isn't--Yet!" ElectronicDesign, May 1977.
John F. Mason, "Engine Sensor - Telemetry System Hailed as the New
Racer's Edge," Electronic Design, June 7, 1975.
"Low-Cost Digital Setup Measures Horsepower," Electronic Design.
Walt Patstone, "Sensors and Transducers: An Update on theI.C. Invasion," Electronic Design News, July 20, 1974.
Jim Williams, "Designers Guide to: Temperature Sensing," ElectronicDesign News, May 5, 1977.
5-1
APPENDIX
SURVEY OF AUTOMOTIVE SENSORS
H. S. Rogero
The primary concern of those involved in automotive sensor developmenttoday is in providing sensors that can be economically used in conjunctionwith engine controls designed to permit auto manufacturers to meet current emission and fuel economy requirements. There is no reason, however, whythose same sensors, or the transduction techniques employed by them, couldnot be used to monitor parameters that are determined to be critical injudging whether or not a vehicle could enter an automated highway.
1. PRESSURE
a. Major Types of Pressure Sensors (Transduction Techniques)
There are five basic types of sensors in use or development for- theautomotive industry today. A brief description with some advantages anddisadvantages follows:
1) Variable Reluctance. This type of transduction operates onthe principle of changing the gap in the magnetic flux path, and therebyvarying the magnetic reluctance, as a diaphragm moves in response to anapplied pressure. The inductance ratio is measured by an ac bridgecircuit in which an output voltage proportional to pressure is obtained.Demodulation following the suppressed carrier bridge output is requiredfor a dc signal. The linear variable differential transformer (LVDT) isan electro-mechanical transducer which produces a voltage output directlyproportional to the displacement of a movable armature or magnetic core.The core is axially positioned inside three transformer coils consistingof a primary with .two secondaries connected in series opposite. Byenergizing the primary with alternating current, a voltage output appearsacross the secondary circuit when the magnetic core is moved from thecentral or null position.
2) Variable Capacitance. Sensors employing variable capacitance as the means of transduction generally vary the distance (andthe capacitance) between parallel plates, where one plate is rigidlylocated and the other free to move as pressure is applied. An electronics package containing an oscillator, capacitance, bridge, demodulator and amplifier is required to convert the varying capacitance into a do voltage (Ref. A-I).
3) Semiconductor. The transduction element for this typeof sensor is formed by gas diffusion of piezoresistive sensing elementson an etched silicone crystal diaphragm. The temperature compensation resistors, voltage regulation, and amplification required to supportthe sensor can be located on the diaphragm periphery or adjacent toit (Ref. A-2).
A-I
4) Strain Gage. Conventional strain gage transducers consistof metallic wire networks attached to a pressure flexible diaphragm.As the diaphragm is flexed the resistance of the -attached strain gageis changed. This change in resistance is measured and converted toa proportional dc voltage by means of a resistance (Wheatstone) bridgearrangement along with various compensating and amplifying electronics.
5) Crystal. This type of sensor contains a crystal whosefrequency of oscillation varies with pressure induced stress. Oneadvantage over other types of transduction is that this signal is directlycompatible with digital processing since the frequency of the signalis proportional to pressure (Ref. A-3).
Each of these techniques is used to make accurate pressuremeasurements and have been employed in various types of automotivediagnostic equipment, especially where the sensors are attached to thevehicle at the time of checkout. However, for permanent installationon large numbers of automobiles the situation is somewhat different.
Currently, and for the near future (one to two model years), thesensors that appear to have been accepted.are: variable reluctance typesfor 1978 and variable compacitance for 1979, although some-semiconductor sensors will no doubt be used on 1979 cars. The 1980-81 models, however,will most likely see a complete dominance by semiconductor sensors. Thereason is simple enough - up to now, semiconductor transduction techniqueshave not been able to meet the price and specification requirements ofthe automotive manufacturers. Improvements in technology have brought thatcapability to the point where it is attainable without the expenditure ofgreat amounts of time or money. This increased capability on the part ofsemiconductor sensors coupled with the inherent (albeit greatly improved)complexity, by comparison, of other types of transduction makes thecurrent trend towards the semiconductor sensor appear to be irreversible.
b. Pressure Measurement Applications
Pressure measures in both hydraulic and pneumatic application andin differential and absolute (or gauge) forms are needed for both sparkand combustion ignition engines. A list of present and future measurements and applications is presented in Table A-I.
Current methods of measuring pressure precisely as in off-vehiclediagnostic equipment use both the LVDT (low voltage differential transformer) and semiconductor strain gauge devices with integral amplifiers.The LVDT units cost $250 and up while the semiconductor devices are lessthan $20. On-board pressure sensors often use diaphragm controlledrheostats where an analog voltage is required.
c. Tire Pressure Monitor
Among the various reasons for remote, automatic determination ofautomobile tire pressure is the development of the "run flat" tire.
A-2
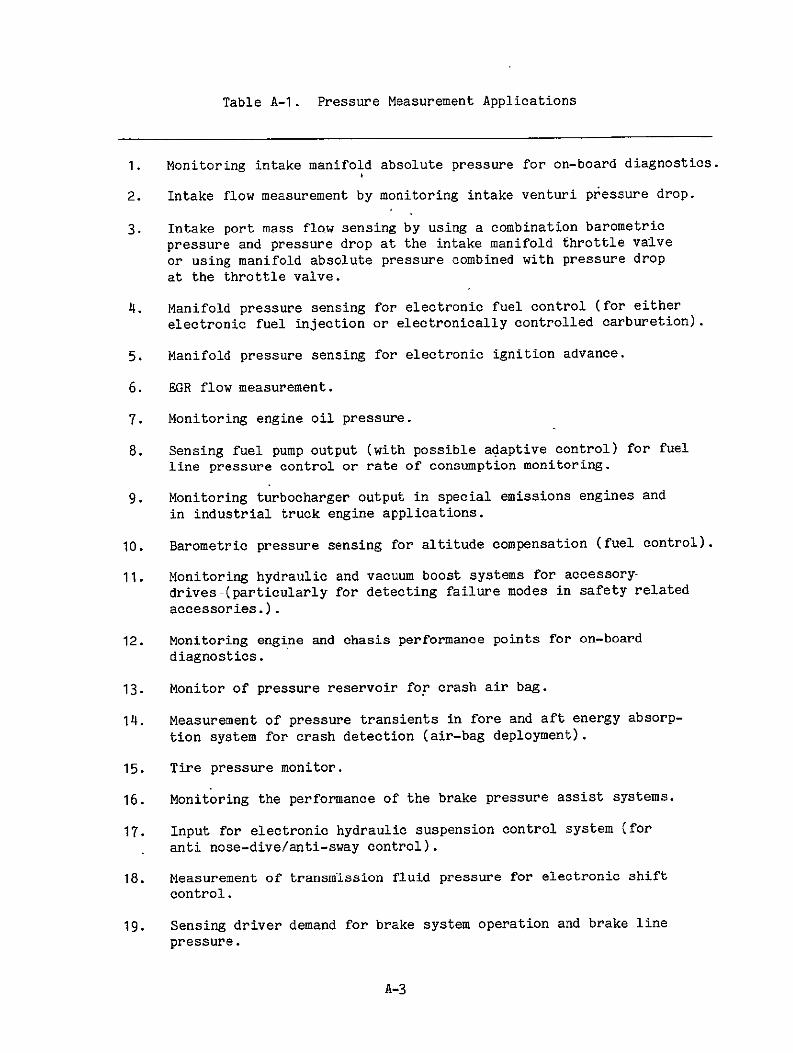
Table A-I. Pressure Measurement Applications
1. Monitoring intake manifold absolute pressure for on-board diagnostics.
2. Intake flow measurement by monitoring intake venturi pressure drop.
3. Intake port mass flow sensing by using a combination barometric
pressure and pressure drop at the intake manifold throttle valve
or using manifold absolute pressure combined with pressure drop
at the throttle valve.
4. Manifold pressure sensing for electronic fuel control (for either
electronic fuel injection or electronically controlled carburetion).
5. Manifold pressure sensing for electronic ignition advance.
6. EGR flow measurement.
7. Monitoring engine oil pressure.
8. Sensing fuel pump output (with possible adaptive control) for fuel
line pressure control or rate of consumption monitoring.
9. Monitoring turbocharger output in special emissions engines and
in industrial truck engine applications.
10. Barometric pressure sensing for altitude compensation (fuel control).
11. Monitoring hydraulic and vacuum boost systems for accessory
drives -(particularly for detecting failure modes in safety related
accessories.).
12. Monitoring engine and chasis performance points for on-board
diagnostics.
13. Monitor of pressure reservoir for crash air bag.
14. Measurement of pressure transients in fore and aft energy absorp
tion system for crash detection (air-bag deployment).
15. Tire pressure monitor.
16. Monitoring the performance of the brake pressure assist systems.
17. Input for electronic hydraulic suspension control system (for
anti nose-dive/anti-sway control).
18. Measurement of transmission fluid pressure for electronic shift
control.
19. Sensing driver demand for brake system operation and brake line
pressure.
A-3
Table A-I. Pressure Measurement Applications
(Continuation 1)
20. Antirskid control -by direct adaptive --sensing--of -the brake lire pressure either at the master cylinder or at the brakecaliper/brake shoe pressure application points.
21. Turbocharger output to determine engine output and fuel demand.
This tire, designed to eliminate the need for spare tires, permitsa vehicle to be driven some 50 miles at speeds up to 50 mph withoutdamage to the tire. Early reports of the handling characteristicsof prototypes indicate that, at least with rear mounted tires, thedriver cannot tell when he has a flat. He could thus, if not warned,drive the tire to destruction before he became aware of the condition.
Other results of not knowing a low-tire-pressure condition mightbe less spectacular, but could affect tire wear as well as vehiclehandling characteristics.
There have been several attempts at marketing devices to monitortire pressure, but as yet none have been successful from the automanufacturer's viewpoint because of technical problems, cost or both.
One device that could be close to acceptance, especially ifinstallation were legally required has been developed by AVCO. It worksas follows:
An electromechanical system consisting of a sensor and a transmitter are mounted inside each tire. Completing.the system are a pickup antenna mounted inside each wheel well, a radio receiver mounted inany convenient place, and a warning light or buzzer visible or audible to the driver.
The sensor/transmitter consists of a fluidic transducer monitoringthe tire pressure and a small radio transmitter that sends a codedwarning when pressure drops below a preset point. The radio transmitteris a self-pulsed oscillator operation in the citizens' band. The receivingor pickup antenna, mounted to a ground plane, consists of a printedcircuit board coil housed in a plastic case. Two rf-amplifier stagesmake up the receiver. The receiver amplifies the coded rf signals,decodes and amplifies the audio signal, and energizes a warning lightor buzzer for the driver.
The sensor/transmitter uses no electrical power unless low pressureis sensed, and then uses less than the standard auto clock.
A-4

2. TEMPERATURE
a. Major Types of Temperature Sensors (Transduction Techniques)
1) Thermistors. These devices are temperature sensitiveresistors with a high (usually negative) TCR (temperature coefficientof resistance. Thermistors can be used over the temperature rangefrom (-) 1000F to (+) 6000 F. They are cheap and dependable, but arealso nonlinear and in some cases the negative TCR is undesirable.
2) Platinum Resistance Bulbs. A coil of strain free, high purity platinum wire, they are usually used in a Wheatstone bridge circuit to give a linear output with a positive slope. Their useful range is - 435 0F to + 1800 0F. They are morle expensive than thermistors, but have their greatest applications in extreme environmental conditions or where higher precision measurements are required. Sensors which operate in the same manner are sometimes constructed using nickel as the temperature sensitive metal. The physical configuration can be in various forms from-that similar to a strain gage to a wound bobbin in a brass probe.
3) Semiconductor Temperature Sens6rs. There has been considerable progress in the development of integrated circuit sensorsutilizing the temperature sensitive properties of silicone as the transduction method. Several devices are currently on the market whichgive high level 10 millivolt/°K outputs over the range from -550 c to +2000c in the under $1/unit price range. This field is relatively newand seems to be expanding (Ref. A-4).
In some-cases semiconductor pressure transducers can be used tomeasure temperature where space or number of available leads is a concern. To do this the pressure sensor is used in a constant current mode and variations in bridge voltage are measured and converted intotemperature information. It is also relatively easy to incorporate aseparate temperature sensitive resistor on the pressure measuring chip,where desirable.
Temperature measurements on vehicles are primarily for determining ifproper lubrication-and cooling are being maintained in the engine anddrive line. Air conditioner and heater measurements often aid in diagnosing proper operation. Table A-2 is a list of temperature measurements for both buses and cars. The temperature sensor most often usedis the platinum resistance type. This device has excellent repeatbilityand linearity. Bimetallic elements are used where a mechanical interfaceis needed. On-board sensors where an electrical interface is requireduse thermistors and resistance thermometers. The direct operated gauge,used with an expansion bulb sensor, finds little use except in aftermarket coolant temperature gauges.
A-5
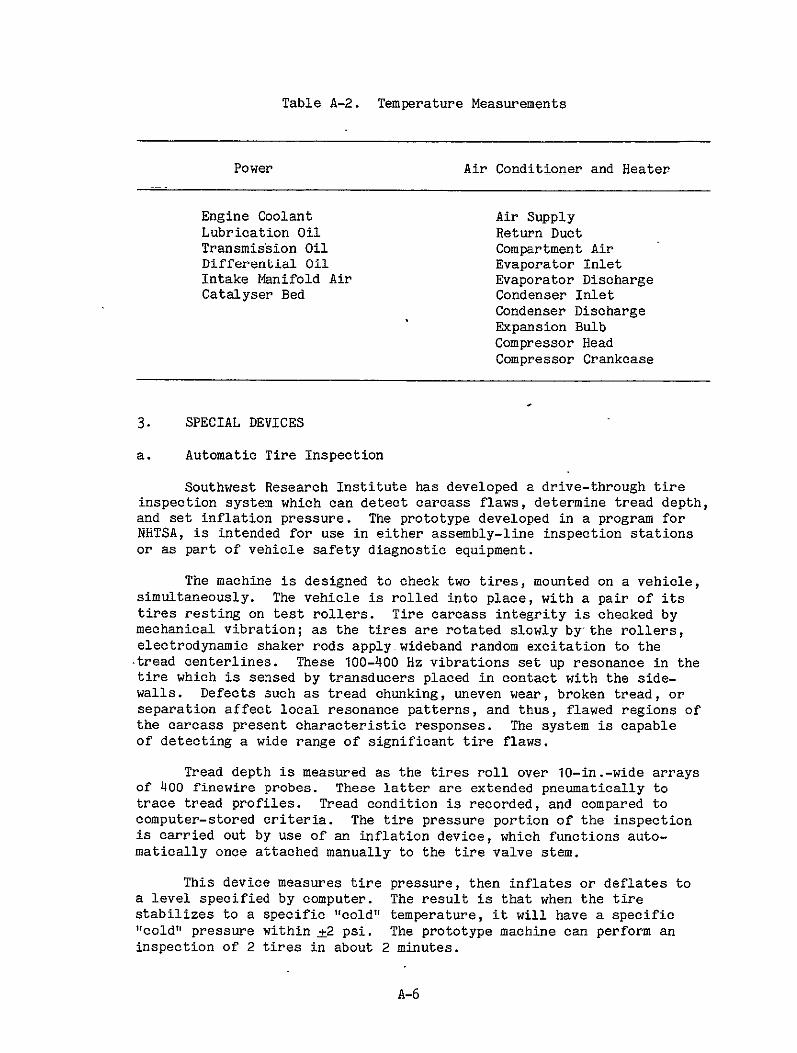
Table A-2. Temperature Measurements
Power Air Conditioner and Heater
Engine Coolant Air SupplyLubrication Oil Return DuctTransmission Oil Compartment AirDifferential Oil Evaporator InletIntake Manifold Air Evaporator DischargeCatalyser Bed Condenser Inlet
Condenser Discharge Expansion BulbCompressor HeadCompressor Crankcase
3. SPECIAL DEVICES
a. Automatic Tire Inspection
Southwest Research Institute has developed a drive-through tireinspection system which can detect carcass flaws, determine tread depth,and set inflation pressure. The prototype developed in a program forNHTSA, is intended for use in either assembly-line inspection stationsor as part of vehicle safety diagnostic equipment.
The machine is designed to check two tires, mounted on a vehicle,simultaneously. The vehicle is rolled into place, with a pair of itstires resting on test rollers. Tire carcass integrity is checked bymechanical vibration; as the tires are rotated slowly by-the rollers,electrodynamic shaker rods apply wideband random excitation to the-tread centerlines. These 100-400 Hz vibrations set up resonance in thetire which is sensed by transducers placed in contact with the sidewalls. Defects such as tread chunking, uneven wear, broken tread, orseparation affect local resonance patterns, and thus, flawed regions ofthe carcass present characteristic responses. The system is capableof detecting a wide range of significant tire flaws.
Tread depth is measured as the tires roll over 10-in.-wide arraysof 400 finewire probes. These latter are extended pneumatically totrace tread profiles. Tread condition is recorded, and compared tocomputer-stored criteria. The tire pressure portion of the inspectionis carried out by use of an inflation device, which functions automatically once attached manually to the tire valve stem.
This device measures tire pressure, then inflates or deflates toa level specified by computer. The result is that when the tirestabilizes to a specific "cold" temperature, it will have a specific"cold" pressure within ±2 psi. The prototype machine can perform aninspection of 2 tires in about 2 minutes.
A-6
The system is envisioned as part of an overall vehicle inspectionstation, one that would perform automated inspection of tires,- brakes,steering, and suspension components (Ref. A-5).
b. Throttle-Position Sensor
The primary thrust in this area is on potentiometric devices.With the improvements made in recent years, the problems associatedwith the wear of sliding contacts have been alleviated to a point where meeting life requirements of over 1,000,000 full cycles and 10,000,000 dithers is well within the reach of present-day technology.
c. Crankshaft-Position Sensor
Typically, engine speed and position signals are derived from thedistributor. However, the tolerance stack-up associated with themultiple linkages that exist between the crankshaft and thedistributor shaft necessitates that engine speed and position information be obtained from the crankshaft itself to increase measurementprecision. Considerations relating to the environment in which thesensor must be located lead to the selection of a variable-reluctance concept.
A unique feature of this design is that the sensor detects holesin a rotating member. The use of a rare-earth magnet makes it possibleto considerably reduce sensor size.
A-7
REFERENCES FOR APPENDIX
A-I. D. Coleman, "An Automotive Oriented Pressure Sensor Design", SAE Paper 770397, February 1977.
A-2. R. B. Hood, "Automotive Semiconductor Pressure Sensors", SAEPaper 760094, February 1976.
A-3. J. N. Reddy, "Sensors for Automotive Engine Control", SAE Paper770399, February 1977.
A-4. K. C. Weimer and W. T. Matzen, "Planar Semiconductor TemperatureSensor for Automotive Applications", SAE Paper 770395, February1977.
A-5. J. E. Johnson and L. H. Emery "Nondestructive Testing ofOn-Vehicle Tires Using Random Mechanical Excitation", "PassengerVehicle Tire Inspection Equipment Development". (These papershave not yet been published, but should be available soon fromSouthwest Research Institute, San Antonio, Texas.
A-8 DOT-JPL-ComI., L.A., Calif.