Embed Size (px)
Citation preview
_______________________________________________________________________________________________________2000 International ADAMS User Conference Page 1 of 13
Vehicle Ride Analysis of a Tractor-Trailer
Prepared by:
Greg Schade
International Truck and Engine Corporation
Stacey Hamill
Mechanical Dynamics, Inc.
May 31, 2000
1. Abstract
The purpose of this analysis was to study the ride quality of the International tractor, and toanalyze and directionally predict the effects of configuration changes on that ride quality. Thelong-term goal of the effort is to support the determination of components and sub-system levelspecifications. The main objective of the project was to establish a set of best practices to use tostudy the ride quality of the vehicle.
Working with International, MDI developed the following process for evaluating the ride qualityof the tractor-trailer:• Create a simple model of the tractor.• Create models of the subsystems and validate those based on test data provided by
International.• Import the subsystem models, one by one, into tractor model. Simulating after each addition
to verify the model.• Incorporate a flexible cab and frame into the tractor model.• Validate the tractor using physical test data obtained from the tractor.• Create a model of the trailer.• Merge the trailer model with the tractor model.• Validate the tractor-trailer model using physical test data.• Make small configuration changes to the physical truck and measure the ride quality. Make
the same configuration changes to the model and measure the ride quality to test if the modelcan directionally predict the ride quality.
_______________________________________________________________________________________________________2000 International ADAMS User Conference Page 2 of 13
2. Introduction
Companies that manufacture everything from automobiles to cellular phones are striving toreduce the cost and design cycle time required to bring a new product to market. At the sametime, their customers are demanding higher quality and better reliability, demands which tend toincrease costs and design cycle times. Traditional design processes that rely heavily on physicalprototyping fall short of meeting customer requirements or company goals.
International is experiencing the same challenges as other companies. In recognizing the need tobetter develop concepts early in the design process, International decided to use ADAMS tosimulate their heavy trucks. By using ADAMS, they hope to be able to develop concepts earlyin the design process which will help to reduce costs and design cycle times. At the same time,they hope to improve driver safety and comfort.
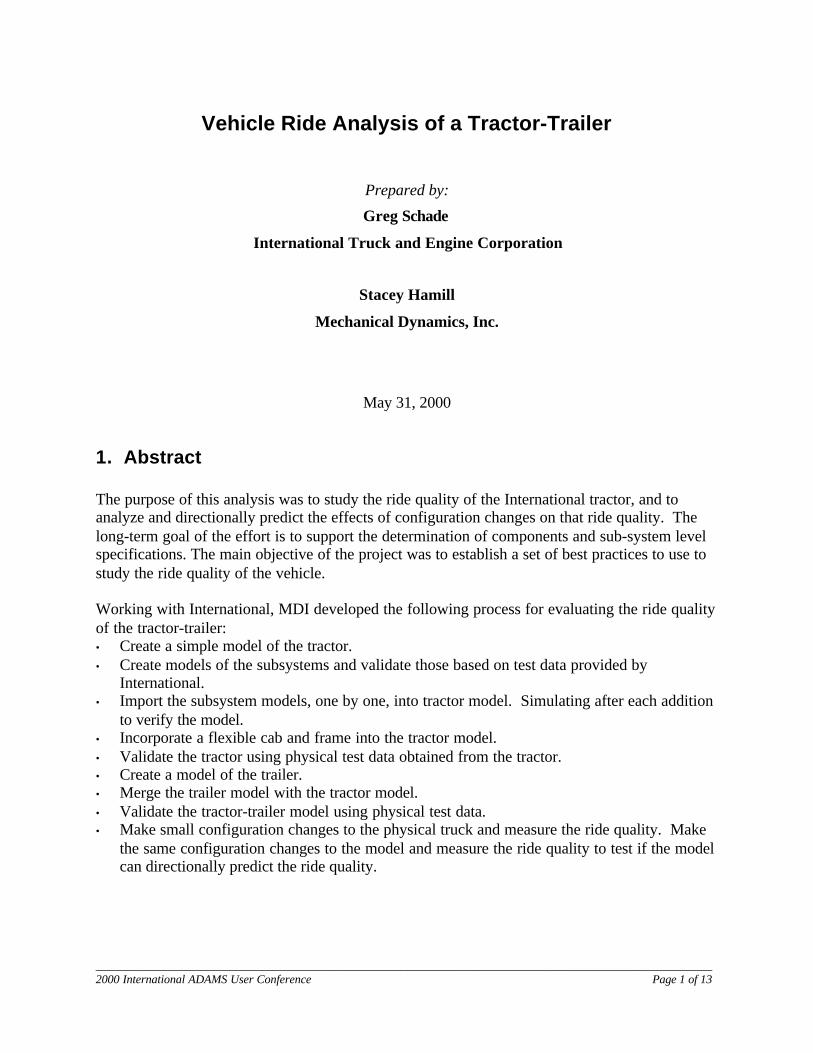
One way in which International is using ADAMS is to perform a ride analysis on theInternational 9400i Class 8 heavy duty truck. Mechanical Dynamics, Inc. worked withInternational to build the ADAMS model of the full vehicle, including a trailer. The long termgoal of the project was to produce a model that could be used to determine the component andsystem level specifications. In studying the ride analysis, it was hoped that the model could beused to analyze and directionally predict the effects of configuration changes on the ride quality.As the project progressed, best practices for modeling a tractor-trailer to analyze ride qualitywere developed.
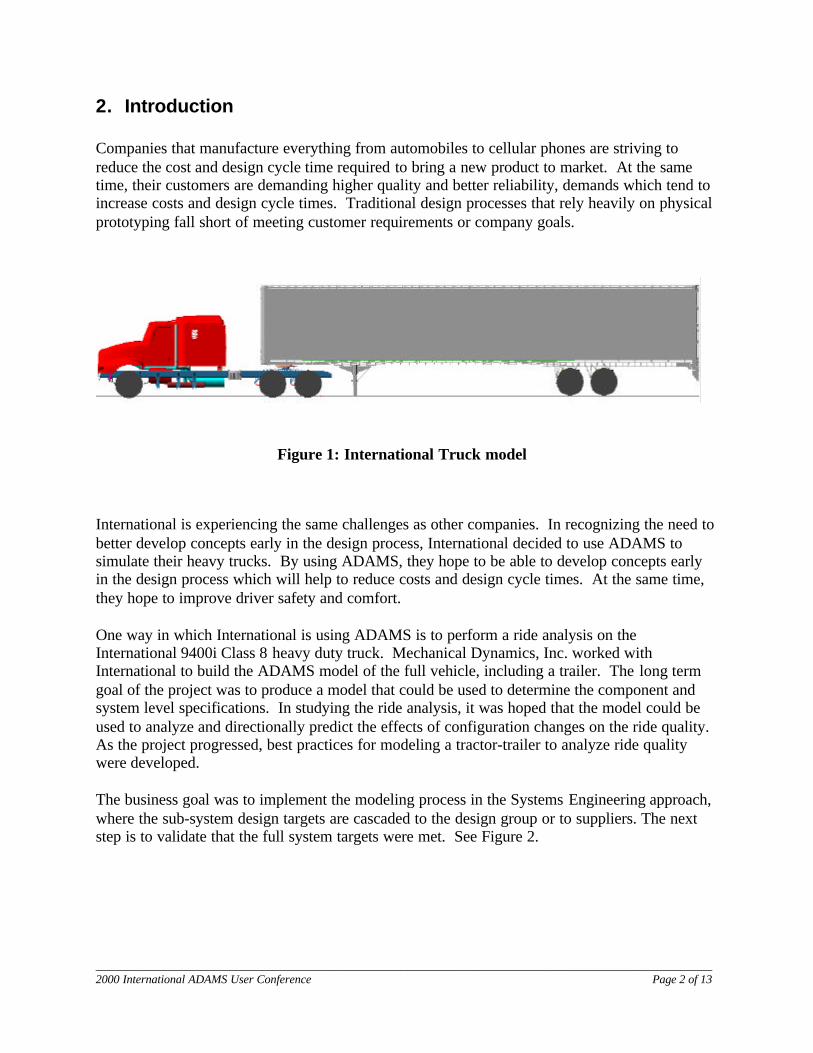
The business goal was to implement the modeling process in the Systems Engineering approach,where the sub-system design targets are cascaded to the design group or to suppliers. The nextstep is to validate that the full system targets were met. See Figure 2.
Figure 1: International Truck model
_______________________________________________________________________________________________________2000 International ADAMS User Conference Page 3 of 13
Figure 2: System engineering approach
_______________________________________________________________________________________________________2000 International ADAMS User Conference Page 4 of 13
3. Building a Virtual Prototype
The first step in building the virtual prototype of a tractor-trailer in ADAMS was to start with asimple model of the tractor. The sub-systems were built and correlated individually. They werethen added to the tractor model, one at a time. The model was compared to test data before thenext sub-system was added. This section discusses the model-building process.
3.1 Building and Correlating Sub-Systems
The truck was broken down into sub-systems for front suspension, rear suspension, cabsuspension, engine and transmission, flexible frame, and flexible cab. The physical sub-systemswere tested separately, and the data was used to validate the ADAMS models. In some cases,components in the sub-systems were modeled and validated separately prior to being added tothe sub-system models.
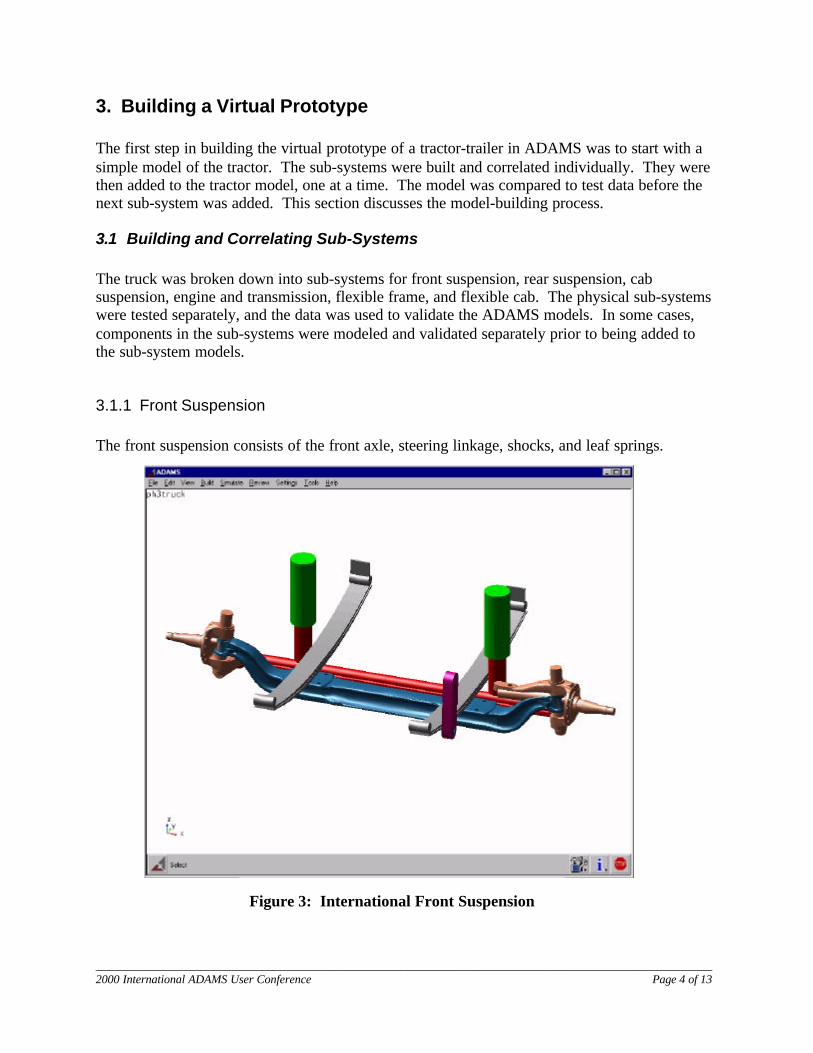
3.1.1 Front Suspension
The front suspension consists of the front axle, steering linkage, shocks, and leaf springs.
Figure 3: International Front Suspension
_______________________________________________________________________________________________________2000 International ADAMS User Conference Page 5 of 13
The leaf springs for the front suspension were built using a module of ADAMS specifically forbuilding leaf springs. Each leaf is a series of parts connected with beams. The leaves areconnected with bushings at the leaf seat. Vector forces define the contact forces between theleaves with impact statements. The same vector forces also define the friction between theleaves. A STEP function based on the relative velocity of the leaves at the point of contact isused to define the direction of the friction force. The leaf springs were validated separatelybefore being added to the front suspension model.
International tested the shocks. The resulting force-velocity data was fit to a curve and used todefine an ADAMS spline. The shocks were validated prior to being added to the frontsuspension model.
3.1.2 Engine and Transmission
The engine and transmission were modeled as a sub-system. The engine and transmission aremodeled as two rigid bodies, attached with a fixed joint. The engine is attached to the framewith four vector forces that emulate the engine mounts.
_______________________________________________________________________________________________________2000 International ADAMS User Conference Page 6 of 13
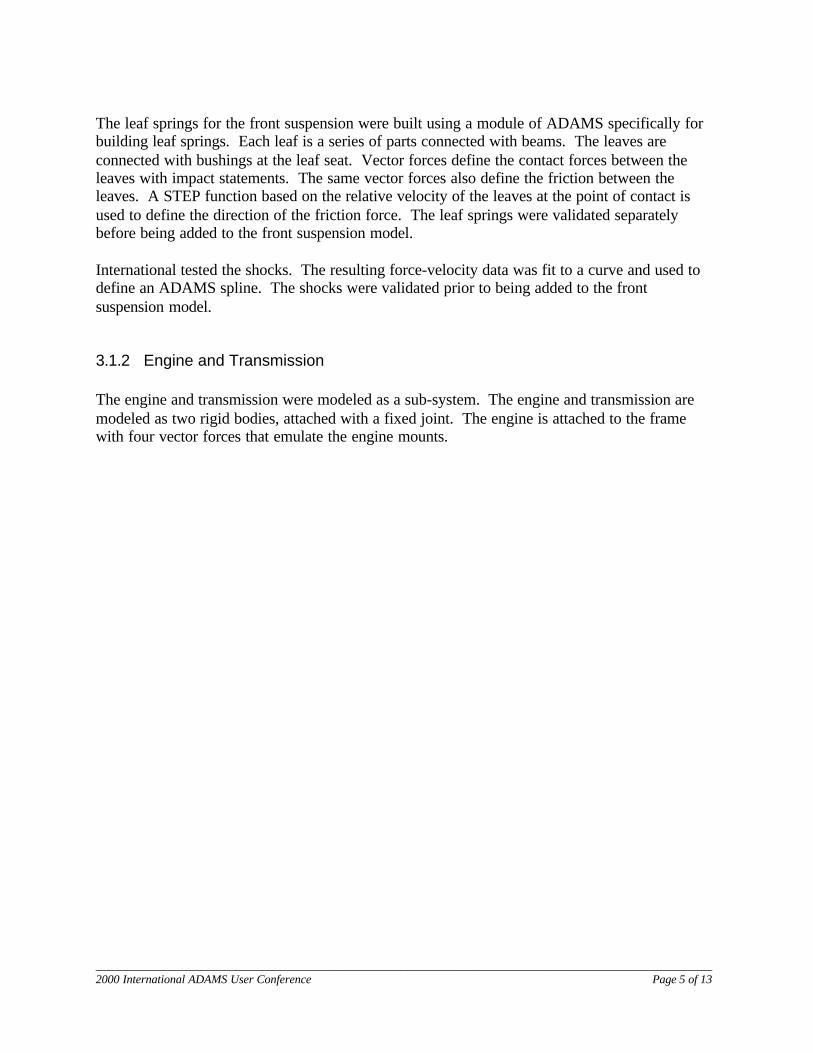
3.1.3 Cab Suspension
The cab suspension is an air suspension that supports the rear of the cab.
The air bags are modeled as preloaded linear springs. The force-velocity data for the shocks wascurve-fit and used to define a spline.
The cab suspension was validated and the results were compared to data that was measured bythe cab suspension supplier.
3.1.4 Rear Suspension
The rear suspension is a tandem axle air suspension. The axles are attached to the frame viaflexible main support members. The main support members were modeled in NASTRAN andimported into ADAMS. They are attached to the frame with bushings. The axles are eachmodeled as two rigid parts that are connected with a spherical joint and a bushing in order toaccount for axle flexibility. As with the other shocks on the truck, the rear suspension shocks
Figure 4: International Cab Suspension
_______________________________________________________________________________________________________2000 International ADAMS User Conference Page 7 of 13
were modeled with an ADAMS spline that was generated from test data. The air bags were alsomodeled with an ADAMS spline that was generated from test data.
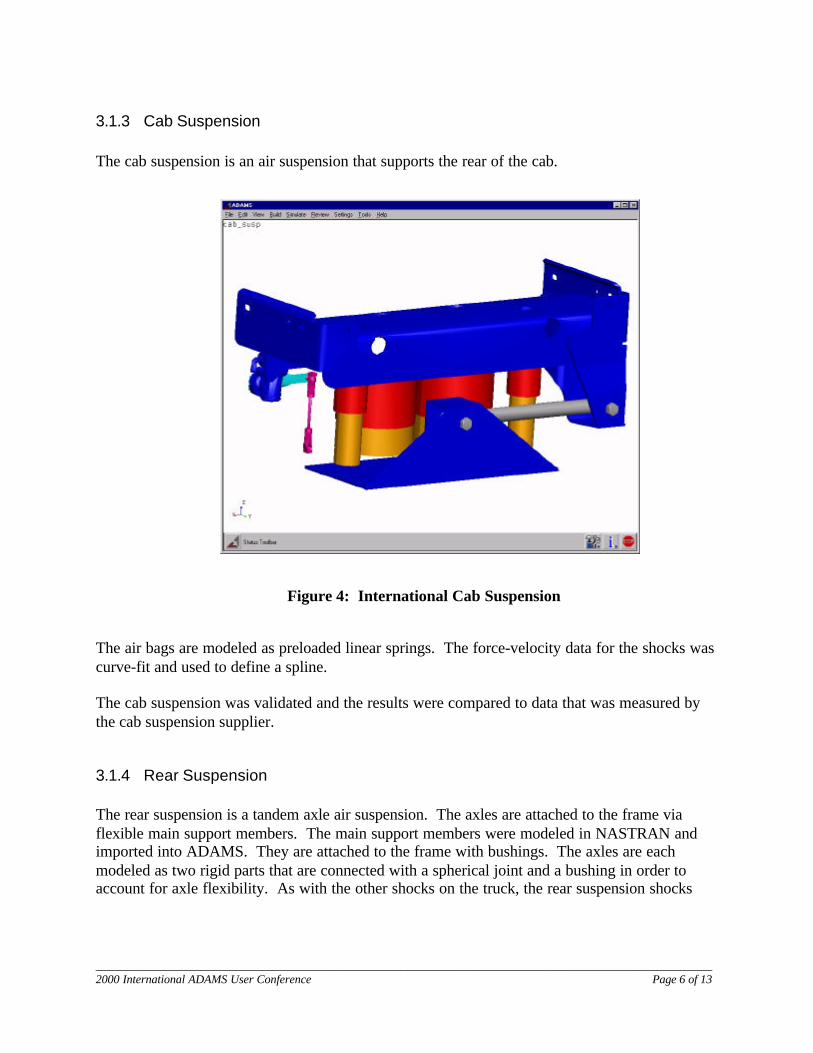
3.1.5 Flexible Frame
A flexible frame is necessary to accurately capture the behavior of the vehicle for ride analysis.The frame was modeled in NASTRAN, and the modal content was extracted from the finiteelement model. The flexible frame was validated by comparing the results of an ADAMS/Linearanalysis and the NASTRAN analysis.
The flexible frame had more than 200 modes that had corresponding frequencies over 10,000 Hz.Enabling all of the modes for the flexible frame was not an option because of the simulation timerequired. Also, the accuracy of the modes at the higher frequencies was not known. Therefore,the strain energy technique was used to determine which modes should be enabled.
Figure 5: Flexible Frame
_______________________________________________________________________________________________________2000 International ADAMS User Conference Page 8 of 13
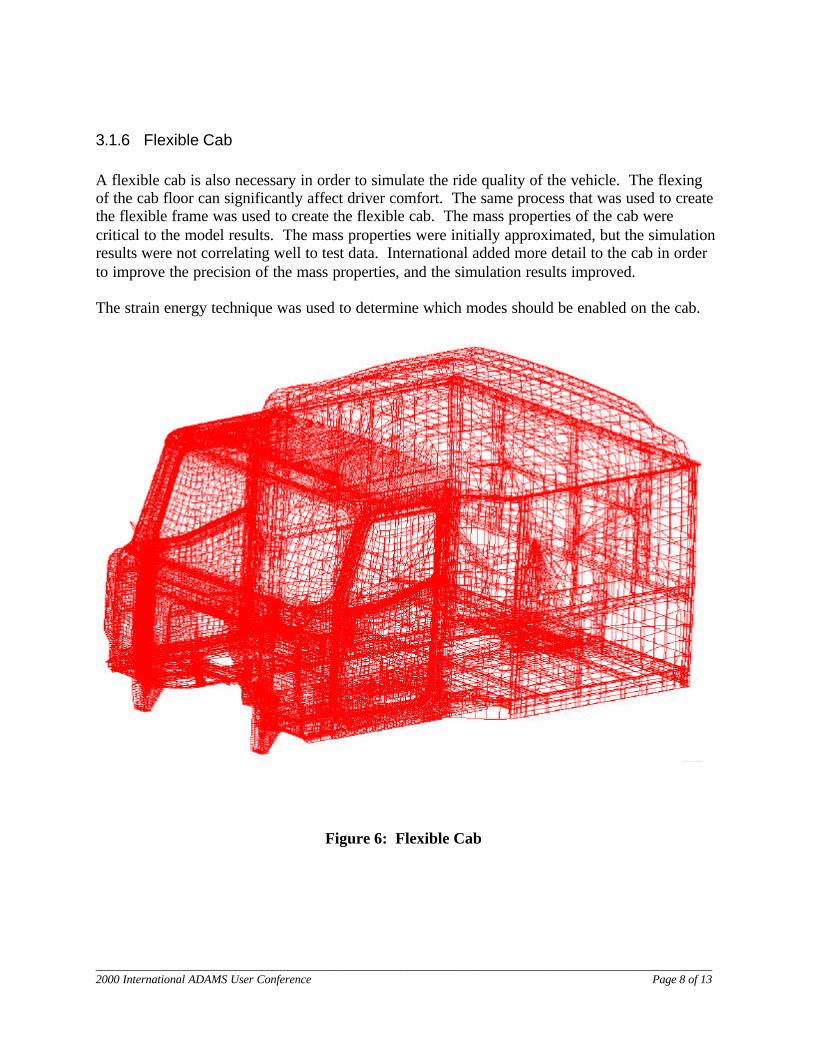
3.1.6 Flexible Cab
A flexible cab is also necessary in order to simulate the ride quality of the vehicle. The flexingof the cab floor can significantly affect driver comfort. The same process that was used to createthe flexible frame was used to create the flexible cab. The mass properties of the cab werecritical to the model results. The mass properties were initially approximated, but the simulationresults were not correlating well to test data. International added more detail to the cab in orderto improve the precision of the mass properties, and the simulation results improved.
The strain energy technique was used to determine which modes should be enabled on the cab.
Figure 6: Flexible Cab
_______________________________________________________________________________________________________2000 International ADAMS User Conference Page 9 of 13
3.2 Building the Full Vehicle Model
Two full vehicle models were created. The first was the "bobtail" model. A bobtail is a tractorwith an attached load frame rather than a trailer.
The bobtail model was composed by merging the initial simple tractor model with the subsystemmodels. After each subsystem addition, the model was simulated to ensure that the model resultswere as expected.
As the bobtail model was being completed, a separate trailer model was built. The trailer wasinitially built as a rigid part. The rigid trailer was eventually replaced with a flexible part.
When the bobtail model results were satisfactory, the load frame was removed and the trailermodel was merged in to complete the tractor-trailer model.
_______________________________________________________________________________________________________2000 International ADAMS User Conference Page 10 of 13
4.0 Validating
The model validation took place throughout the building process. The sub system models werecorrelated to test data before they were added to the full vehicle model. The full vehicle modelwas correlated as the sub systems were added. Final model tuning took place after the subsystemand components were in place.
4.1 Validating the Subsystems
The subsystem models were correlated according to how the physical subsystem was tested. Themodels were set up to emulate the physical test. International and International's suppliersprovided the data for the subsystems.
The front, rear, and cab suspension models were validated based on vertical force-deflectiondata. The rear suspension was also validated based on roll stiffness and roll-steer data.
The engine and transmission subsystem was correlated to accelerations that were measured onthe physical truck during road tests.
The flexible cab and frame were correlated to the NASTRAN models.
4.2 Validating the Full Vehicle Model
In order to validate the model, extensive data was needed to understand the truck's behavior. Thetruck was instrumented with 70 accelerometers. It was then driven on three different roads andon the test track at various speeds. Of the 70 channels of data, some were inputs for the modeland some were outputs depending on the configuration of the truck. Rather than adding tires tothe model, the model was driven at the axles with data measured at the same locations on thetruck axles, as if the truck were on a test rig. For the bobtail model, 21 channels were measuredon the axles to provide inputs to the model. In the model, requests were created at the other 49accelerometer locations. The model results were compared directly to the test data.
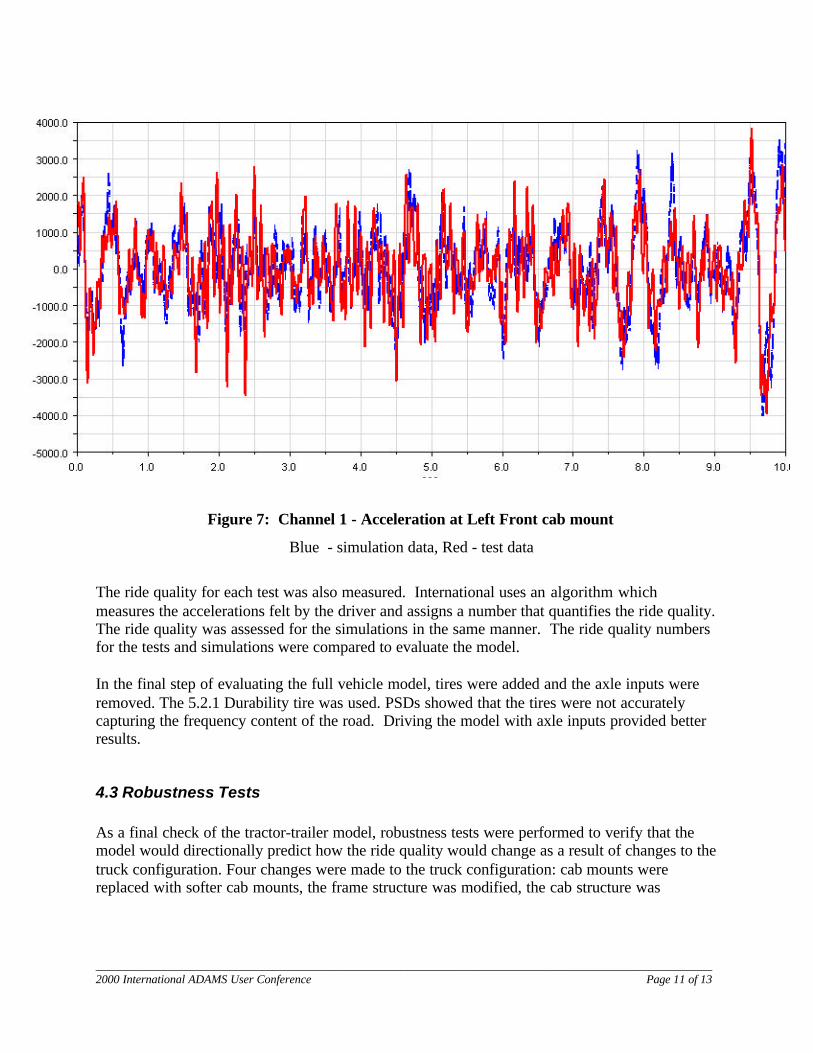
For the tractor-trailer model, 24 channels were measured on the truck and trailer axles to provideinputs to the model. As in the bobtail model, requests were created at the remaining 46accelerometer locations. An example of the results from the tractor-trailer model is shown inFigure 7. It shows the vertical acceleration of the left front cab mount on the cab side. The redcurve is the test data, and the blue curve is the simulation data.
_______________________________________________________________________________________________________2000 International ADAMS User Conference Page 11 of 13
The ride quality for each test was also measured. International uses an algorithm whichmeasures the accelerations felt by the driver and assigns a number that quantifies the ride quality.The ride quality was assessed for the simulations in the same manner. The ride quality numbersfor the tests and simulations were compared to evaluate the model.
In the final step of evaluating the full vehicle model, tires were added and the axle inputs wereremoved. The 5.2.1 Durability tire was used. PSDs showed that the tires were not accuratelycapturing the frequency content of the road. Driving the model with axle inputs provided betterresults.
4.3 Robustness Tests
As a final check of the tractor-trailer model, robustness tests were performed to verify that themodel would directionally predict how the ride quality would change as a result of changes to thetruck configuration. Four changes were made to the truck configuration: cab mounts werereplaced with softer cab mounts, the frame structure was modified, the cab structure was
Figure 7: Channel 1 - Acceleration at Left Front cab mount
Blue - simulation data, Red - test data
_______________________________________________________________________________________________________2000 International ADAMS User Conference Page 12 of 13
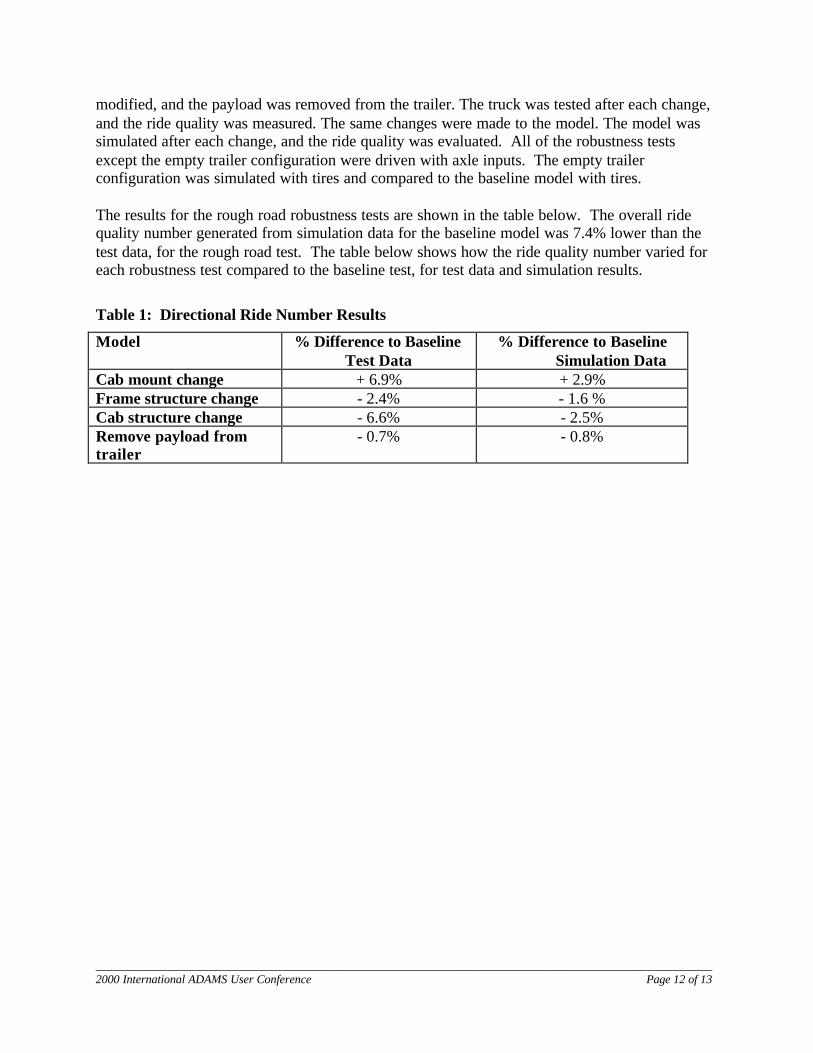
modified, and the payload was removed from the trailer. The truck was tested after each change,and the ride quality was measured. The same changes were made to the model. The model wassimulated after each change, and the ride quality was evaluated. All of the robustness testsexcept the empty trailer configuration were driven with axle inputs. The empty trailerconfiguration was simulated with tires and compared to the baseline model with tires.
The results for the rough road robustness tests are shown in the table below. The overall ridequality number generated from simulation data for the baseline model was 7.4% lower than thetest data, for the rough road test. The table below shows how the ride quality number varied foreach robustness test compared to the baseline test, for test data and simulation results.
Table 1: Directional Ride Number Results
Model % Difference to BaselineTest Data
% Difference to Baseline Simulation Data
Cab mount change + 6.9% + 2.9%Frame structure change - 2.4% - 1.6 %Cab structure change - 6.6% - 2.5%Remove payload fromtrailer
- 0.7% - 0.8%
_______________________________________________________________________________________________________2000 International ADAMS User Conference Page 13 of 13
5.0 Conclusions
Building a full vehicle model of a tractor-trailer for ride analysis provided many challenges. Thelevel of detail required in the model for ride analysis, the model and vehicle size, and the tractor-to-trailer interaction are some of the challenges.
In the process of building this model, some best practices were learned. The most significant isregarding how to handle flexible parts. Determining which modes should be enabled in theflexible parts is a difficult task. In the end, the strain energy technique was used to determine theenabled modes. The mass properties of major flexible parts, such as the cab, can impact themodel results. Inaccurate mass and inertias lead to poor results for the full vehicle model.
In hindsight, it probably would have been wise to test the truck on a test rig prior to testing onthe road and test track. It might have been easier to validate the truck model with the moresimple data from the simulator. The rear suspension was validated with static data only.Dynamically testing the rear suspension might have led to a better validated model.
5.1 Usefulness of the Model
The model has proven to be useful in directionally predicting changes in the ride quality. It canbe used to quickly evaluate changes to the truck configuration.
The vertical channels correlated well to test data, but the model's lateral and longitudinalresponse can be improved. International is continuing to refine the model.
5.2 Future Use of the Model
The model is being used to build a fully parameterized truck model. The parameterized truckmodel will be used to quickly build and evaluate other truck configurations. The plan is to usethese models for ride analysis and durability.
Future work will include adding a ride analysis tire to the model. A ride tire is expected toproduce better results than the current method of applying accelerations from test data at thespindles.


![MSSP modeling and validation of off-road vehicle ride ... · enhancement in vehicle ride vibration isolations and driver/passengers comfort and health [5-7]. However, the documented](https://img.pdfslide.us/doc/110x75/5ec7819a4a959e2b4d04a98d/mssp-modeling-and-validation-of-off-road-vehicle-ride-enhancement-in-vehicle.jpg)