Embed Size (px)
Citation preview

Vehicle Integrated Propulsion
Research Tests
John Lekki, Gary Hunter, Don Simon, Roger Meredith, John Wrbanek, Mark Woike, Roger Tokars NASA Glenn Research Center
Marianne Guffanti
United States Geological Survey
Captain Eric Lyall
Air Force Research Lab
Propulsion Controls and
Diagnostics Workshop
December 11, 2013
Cleveland, OH
National Aeronautics and Space Administration
www.nasa.gov 1
VIPR Test 1 CDR 2
VIPR Overview
2
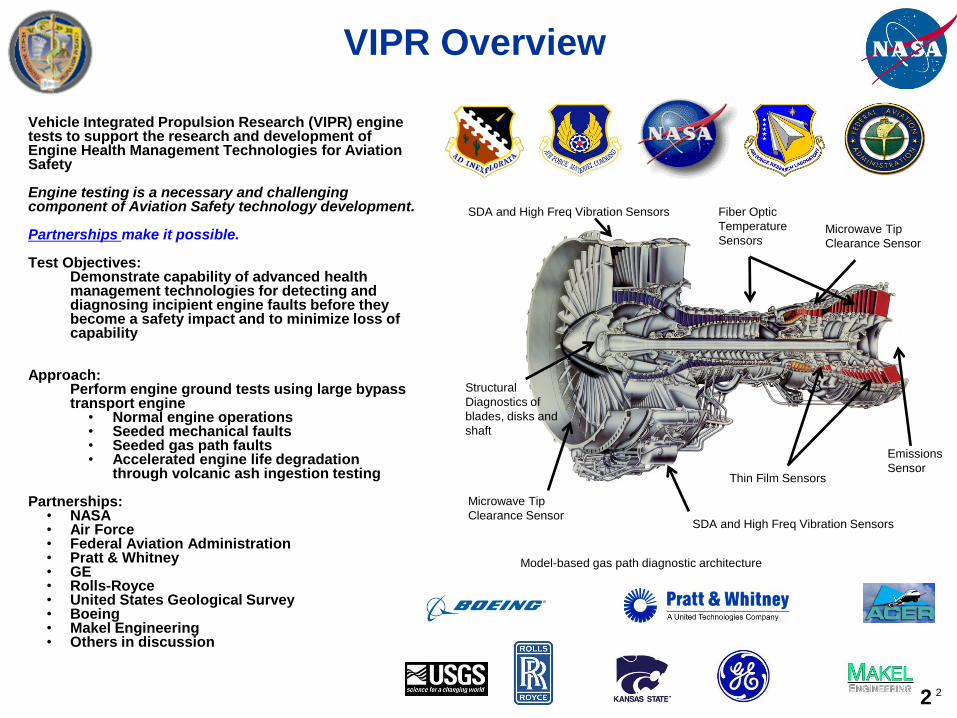
Vehicle Integrated Propulsion Research (VIPR) engine tests to support the research and development of Engine Health Management Technologies for Aviation Safety Engine testing is a necessary and challenging component of Aviation Safety technology development. Partnerships make it possible.
Test Objectives:
Demonstrate capability of advanced health management technologies for detecting and diagnosing incipient engine faults before they become a safety impact and to minimize loss of capability
Approach:
Perform engine ground tests using large bypass transport engine
• Normal engine operations • Seeded mechanical faults • Seeded gas path faults • Accelerated engine life degradation
through volcanic ash ingestion testing Partnerships:
• NASA • Air Force • Federal Aviation Administration • Pratt & Whitney • GE • Rolls-Royce • United States Geological Survey • Boeing • Makel Engineering • Others in discussion
SDA and High Freq Vibration Sensors
SDA and High Freq Vibration Sensors
Microwave Tip
Clearance Sensor
Microwave Tip
Clearance Sensor
Emissions
Sensor
Structural
Diagnostics of
blades, disks and
shaft
Fiber Optic
Temperature
Sensors
Thin Film Sensors
Model-based gas path diagnostic architecture
VIPR Test 1 CDR 3
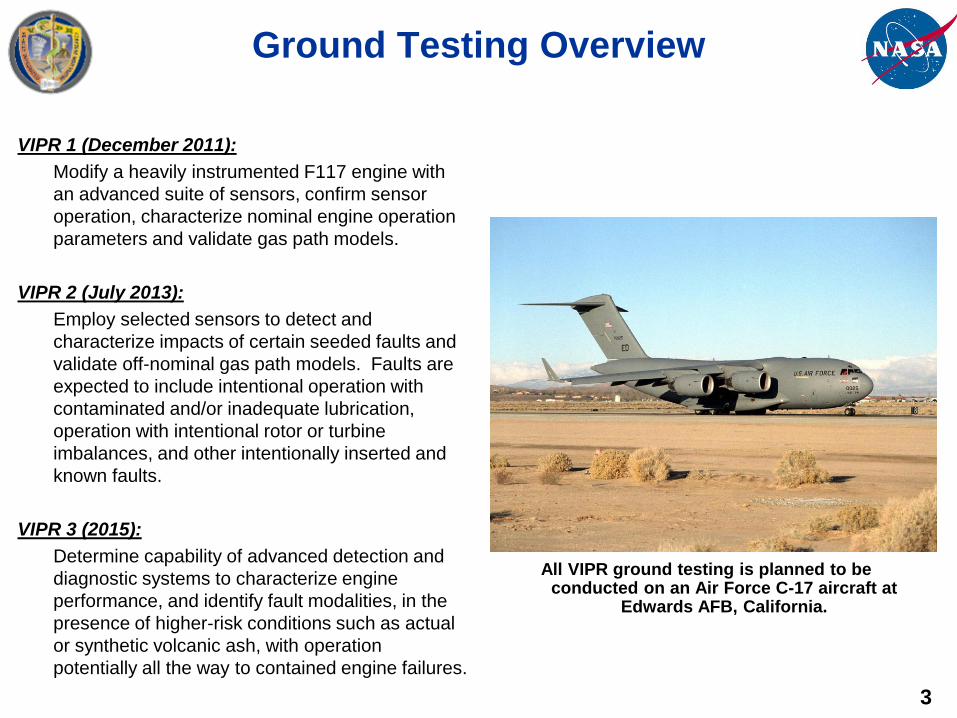
Ground Testing Overview
VIPR 1 (December 2011):
Modify a heavily instrumented F117 engine with
an advanced suite of sensors, confirm sensor
operation, characterize nominal engine operation
parameters and validate gas path models.
VIPR 2 (July 2013):
Employ selected sensors to detect and
characterize impacts of certain seeded faults and
validate off-nominal gas path models. Faults are
expected to include intentional operation with
contaminated and/or inadequate lubrication,
operation with intentional rotor or turbine
imbalances, and other intentionally inserted and
known faults.
VIPR 3 (2015):
Determine capability of advanced detection and
diagnostic systems to characterize engine
performance, and identify fault modalities, in the
presence of higher-risk conditions such as actual
or synthetic volcanic ash, with operation
potentially all the way to contained engine failures.
All VIPR ground testing is planned to be conducted on an Air Force C-17 aircraft at
Edwards AFB, California.
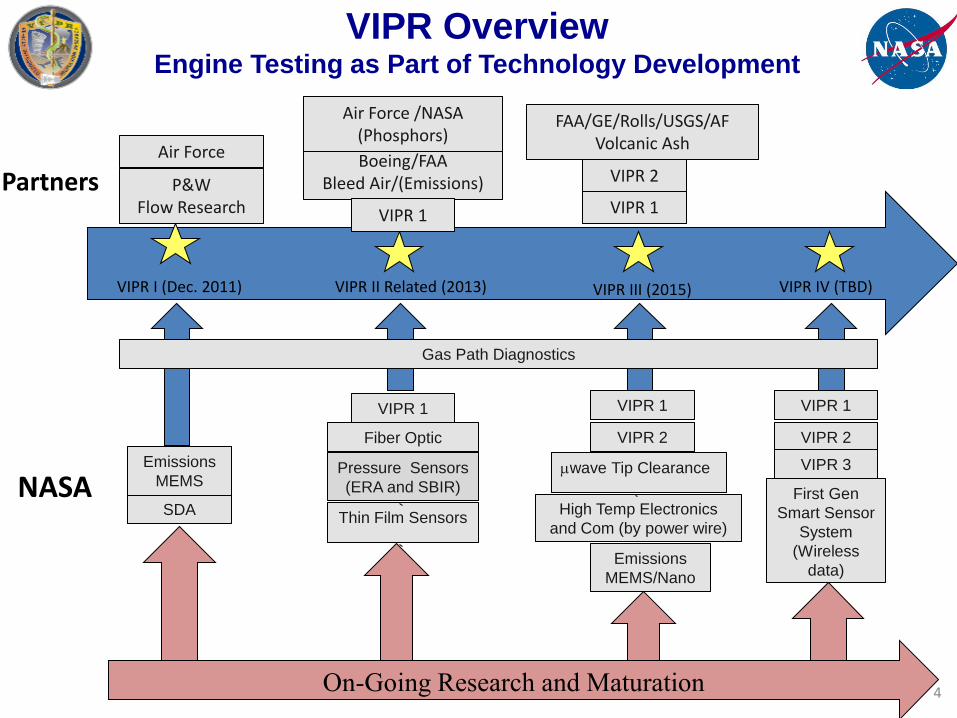
VIPR I (Dec. 2011) VIPR II Related (2013) VIPR III (2015)
Fiber Optic
SDA
Boeing/FAA Bleed Air/(Emissions)
VIPR 1
VIPR 1
Thin Film Sensors
VIPR 2
VIPR 1
Pressure Sensors
(ERA and SBIR)
VIPR IV (TBD)
High Temp Electronics
and Com (by power wire)
VIPR 2
VIPR 1
First Gen
Smart Sensor
System
(Wireless
data)
P&W Flow Research
VIPR 2
VIPR 1
FAA/GE/Rolls/USGS/AF Volcanic Ash
Gas Path Diagnostics
Air Force
Air Force /NASA (Phosphors)
Emissions
MEMS
On-Going Research and Maturation
Emissions
MEMS/Nano
NASA
Partners
VIPR 3
VIPR Overview Engine Testing as Part of Technology Development
mwave Tip Clearance
4
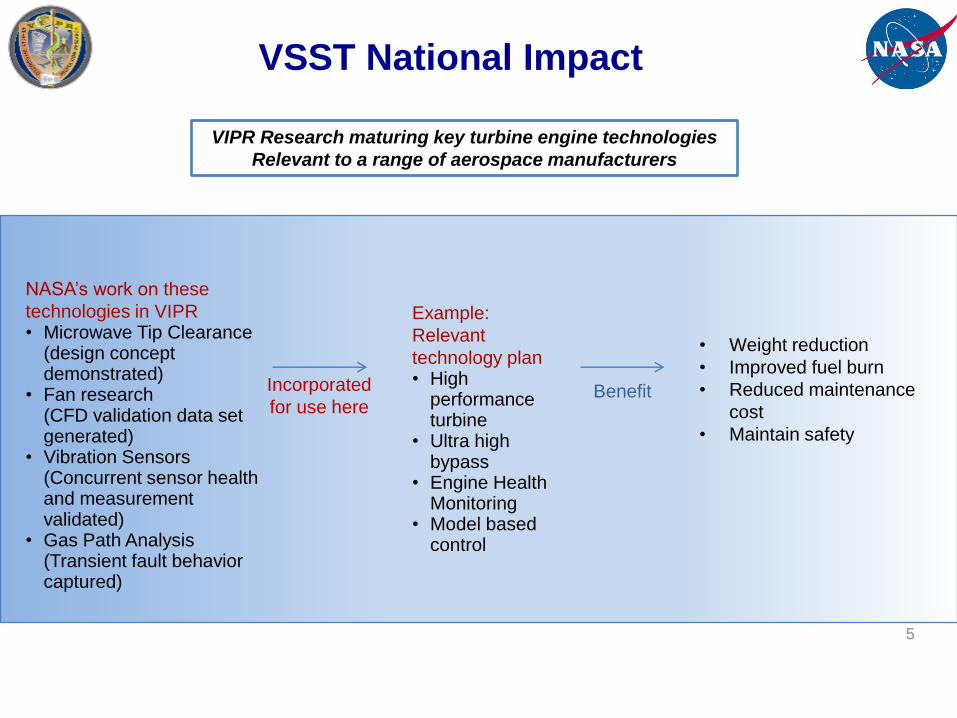
VSST National Impact
VIPR Research maturing key turbine engine technologies
Relevant to a range of aerospace manufacturers
Incorporated
for use here
NASA’s work on these
technologies in VIPR • Microwave Tip Clearance
(design concept demonstrated)
• Fan research (CFD validation data set generated)
• Vibration Sensors (Concurrent sensor health and measurement validated)
• Gas Path Analysis (Transient fault behavior captured)
Benefit
• Weight reduction
• Improved fuel burn
• Reduced maintenance
cost
• Maintain safety
5
Example:
Relevant
technology plan • High
performance turbine
• Ultra high bypass
• Engine Health Monitoring
• Model based control
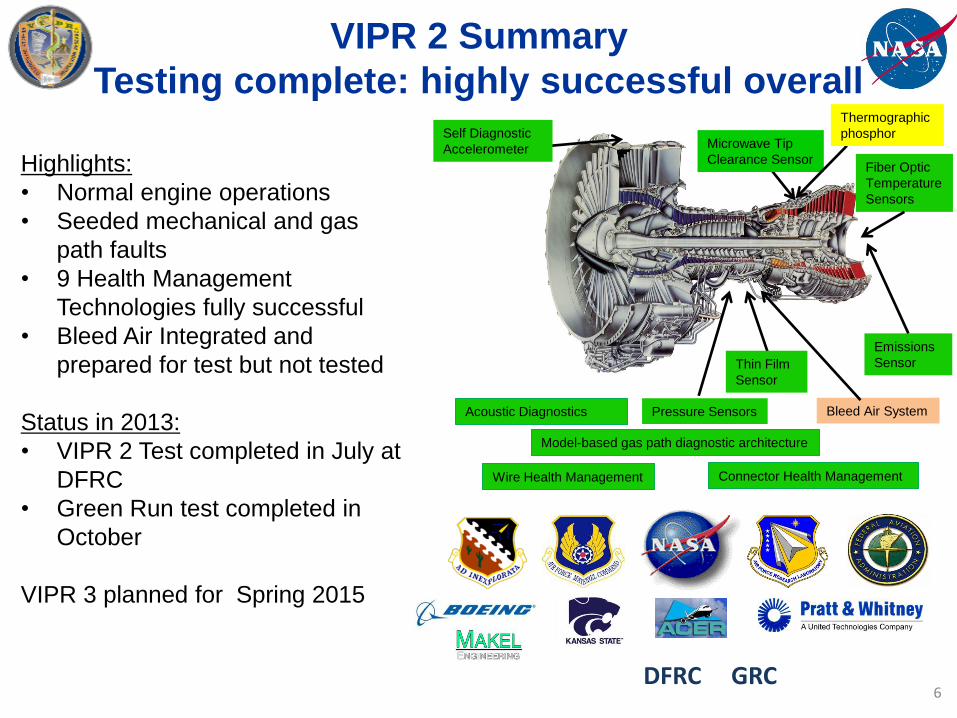
VIPR 2 Summary
Testing complete: highly successful overall
Highlights:
• Normal engine operations
• Seeded mechanical and gas
path faults
• 9 Health Management
Technologies fully successful
• Bleed Air Integrated and
prepared for test but not tested
Status in 2013:
• VIPR 2 Test completed in July at
DFRC
• Green Run test completed in
October
VIPR 3 planned for Spring 2015
Self Diagnostic
Accelerometer
Pressure Sensors
Emissions
Sensor
Fiber Optic
Temperature
Sensors
Model-based gas path diagnostic architecture
Microwave Tip
Clearance Sensor
Thin Film
Sensor
Bleed Air System
DFRC GRC 6
Thermographic
phosphor
Wire Health Management Connector Health Management
Acoustic Diagnostics
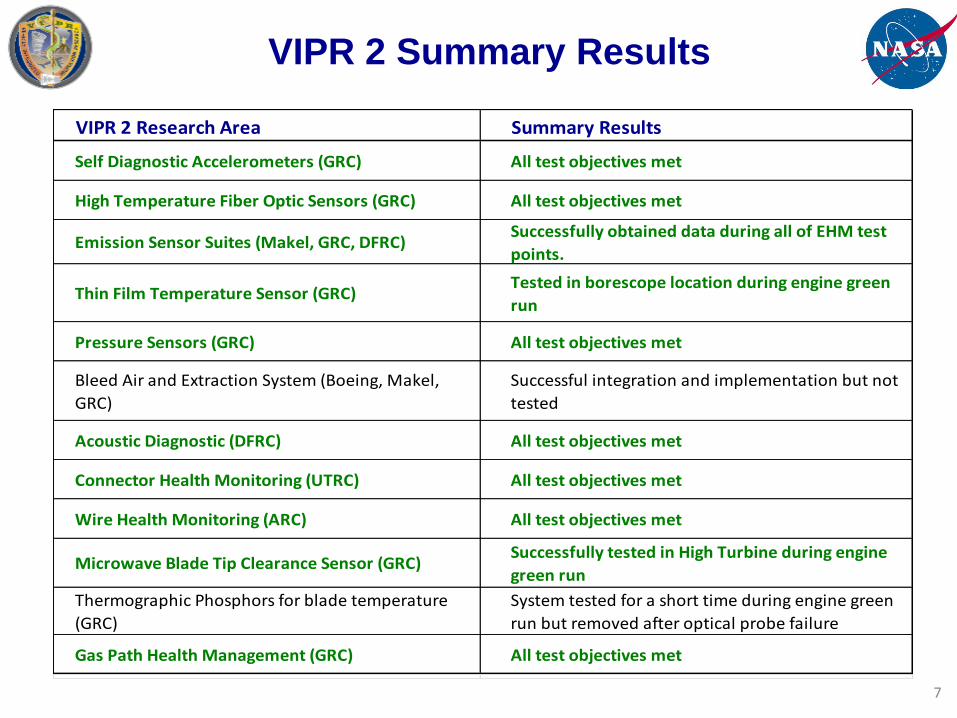
VIPR 2 Summary Results
VIPR 2 Research Area Summary Results
Self Diagnostic Accelerometers (GRC) All test objectives met
High Temperature Fiber Optic Sensors (GRC) All test objectives met
Emission Sensor Suites (Makel, GRC, DFRC)Successfully obtained data during all of EHM test
points.
Thin Film Temperature Sensor (GRC)Tested in borescope location during engine green
run
Pressure Sensors (GRC) All test objectives met
Bleed Air and Extraction System (Boeing, Makel,
GRC)
Successful integration and implementation but not
tested
Acoustic Diagnostic (DFRC) All test objectives met
Connector Health Monitoring (UTRC) All test objectives met
Wire Health Monitoring (ARC) All test objectives met
Microwave Blade Tip Clearance Sensor (GRC)Successfully tested in High Turbine during engine
green run
Thermographic Phosphors for blade temperature
(GRC)
System tested for a short time during engine green
run but removed after optical probe failure
Gas Path Health Management (GRC) All test objectives met
7
Ceramic Multifunctional
Sensor on Alumina Test
Beam
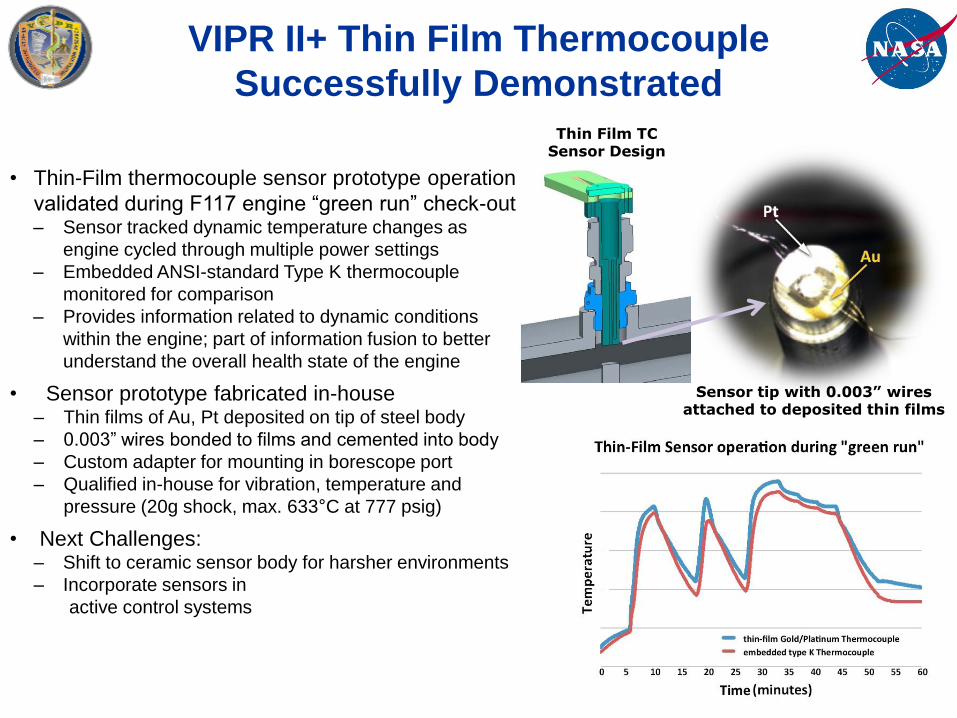
VIPR II+ Thin Film Thermocouple
Successfully Demonstrated
Sensor tip with 0.003” wires attached to deposited thin films
• Thin-Film thermocouple sensor prototype operation
validated during F117 engine “green run” check-out ‒ Sensor tracked dynamic temperature changes as
engine cycled through multiple power settings
‒ Embedded ANSI-standard Type K thermocouple
monitored for comparison
‒ Provides information related to dynamic conditions
within the engine; part of information fusion to better
understand the overall health state of the engine
• Sensor prototype fabricated in-house ‒ Thin films of Au, Pt deposited on tip of steel body
‒ 0.003” wires bonded to films and cemented into body
‒ Custom adapter for mounting in borescope port
‒ Qualified in-house for vibration, temperature and
pressure (20g shock, max. 633°C at 777 psig)
• Next Challenges: ‒ Shift to ceramic sensor body for harsher environments
‒ Incorporate sensors in
active control systems
Thin Film TC Sensor Design
9
Microwave Tip Clearance Sensor
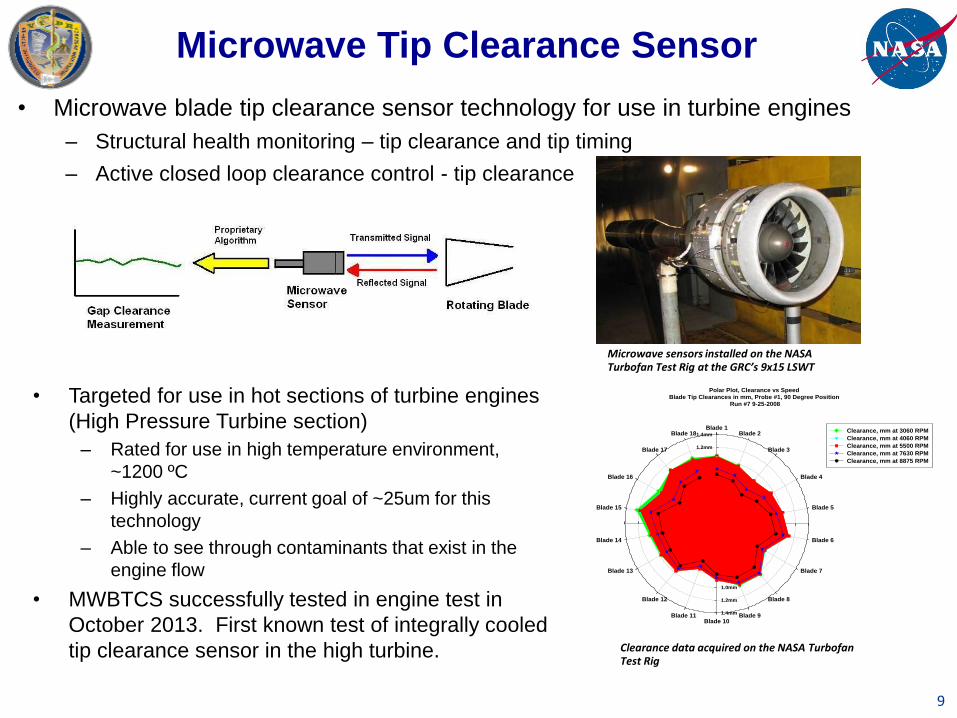
• Microwave blade tip clearance sensor technology for use in turbine engines
– Structural health monitoring – tip clearance and tip timing
– Active closed loop clearance control - tip clearance
• Targeted for use in hot sections of turbine engines
(High Pressure Turbine section)
– Rated for use in high temperature environment,
~1200 ºC
– Highly accurate, current goal of ~25um for this
technology
– Able to see through contaminants that exist in the
engine flow
• MWBTCS successfully tested in engine test in
October 2013. First known test of integrally cooled
tip clearance sensor in the high turbine.
Polar Plot, Clearance vs Speed Blade Tip Clearances in mm, Probe #1, 90 Degree Position
Run #7 9-25-2008
0.0mm
0.2mm
0.4mm
0.6mm
0.8mm
1.0mm
1.2mm
1.4mm
0.0mm
0.2mm
0.4mm
0.6mm
0.8mm
1.0mm
1.2mm
1.4mm
Blade 1Blade 2
Blade 3
Blade 4
Blade 5
Blade 6
Blade 7
Blade 8
Blade 9Blade 10
Blade 11
Blade 12
Blade 13
Blade 14
Blade 15
Blade 16
Blade 17
Blade 18 Clearance, mm at 3060 RPM
Clearance, mm at 4060 RPM
Clearance, mm at 5500 RPM
Clearance, mm at 7630 RPM
Clearance, mm at 8875 RPM
Microwave sensors installed on the NASA Turbofan Test Rig at the GRC’s 9x15 LSWT
Clearance data acquired on the NASA Turbofan Test Rig
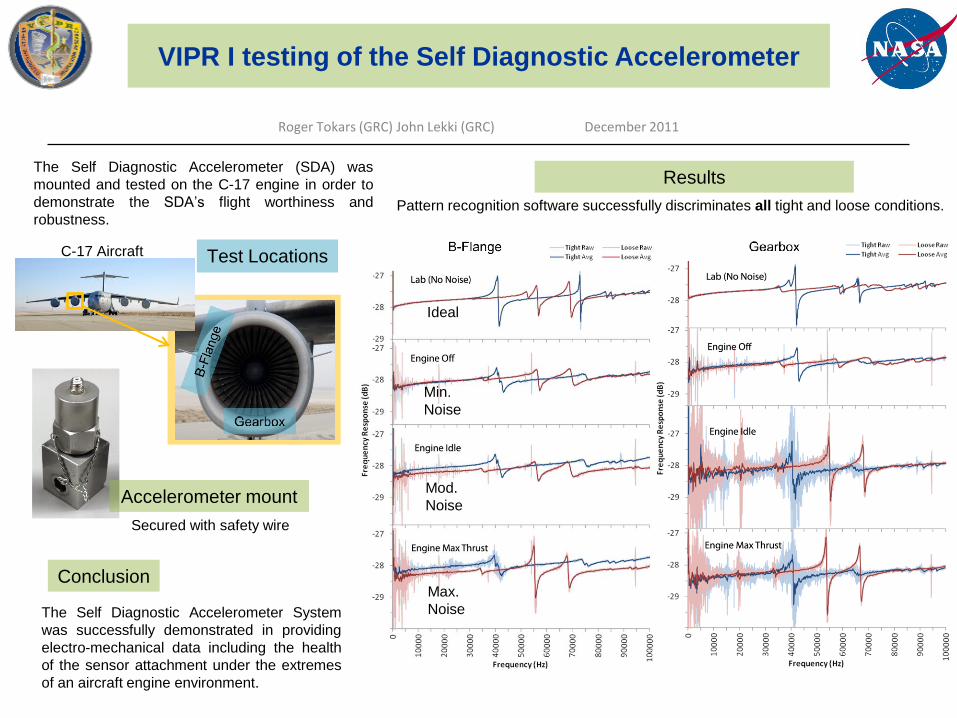
VIPR I testing of the Self Diagnostic Accelerometer
Roger Tokars (GRC) John Lekki (GRC) December 2011
Test Locations C-17 Aircraft
The Self Diagnostic Accelerometer (SDA) was
mounted and tested on the C-17 engine in order to
demonstrate the SDA’s flight worthiness and
robustness.
Results
The Self Diagnostic Accelerometer System
was successfully demonstrated in providing
electro-mechanical data including the health
of the sensor attachment under the extremes
of an aircraft engine environment.
Conclusion
Ideal
Min.
Noise
Mod.
Noise
Max.
Noise
Pattern recognition software successfully discriminates all tight and loose conditions.
Accelerometer mount
Secured with safety wire
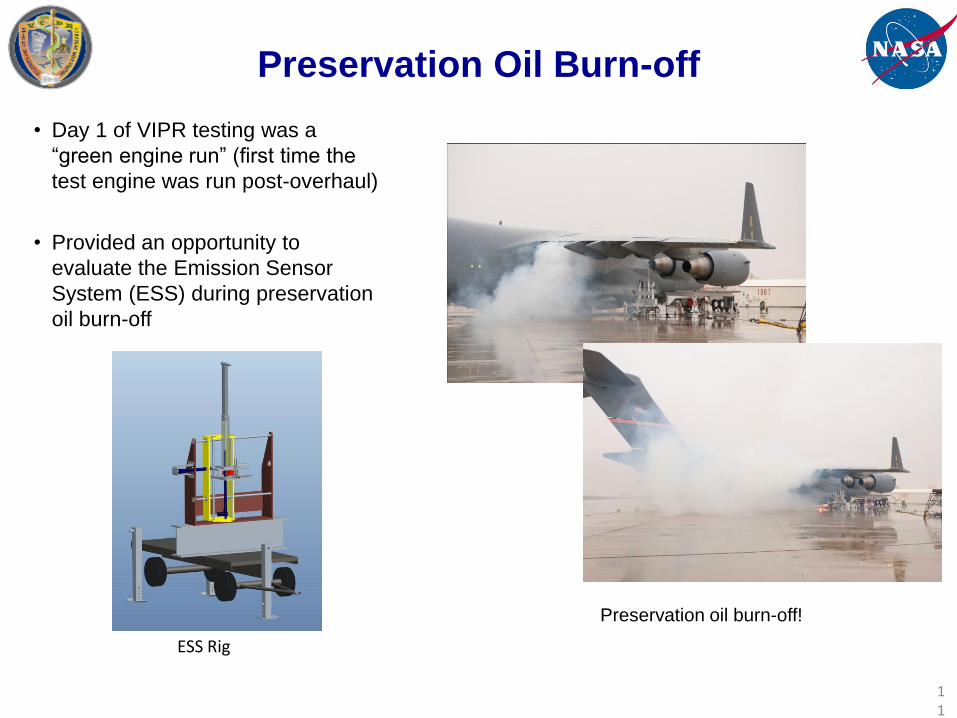
Preservation Oil Burn-off
• Day 1 of VIPR testing was a
“green engine run” (first time the
test engine was run post-overhaul)
• Provided an opportunity to
evaluate the Emission Sensor
System (ESS) during preservation
oil burn-off
11
ESS Rig
Preservation oil burn-off!
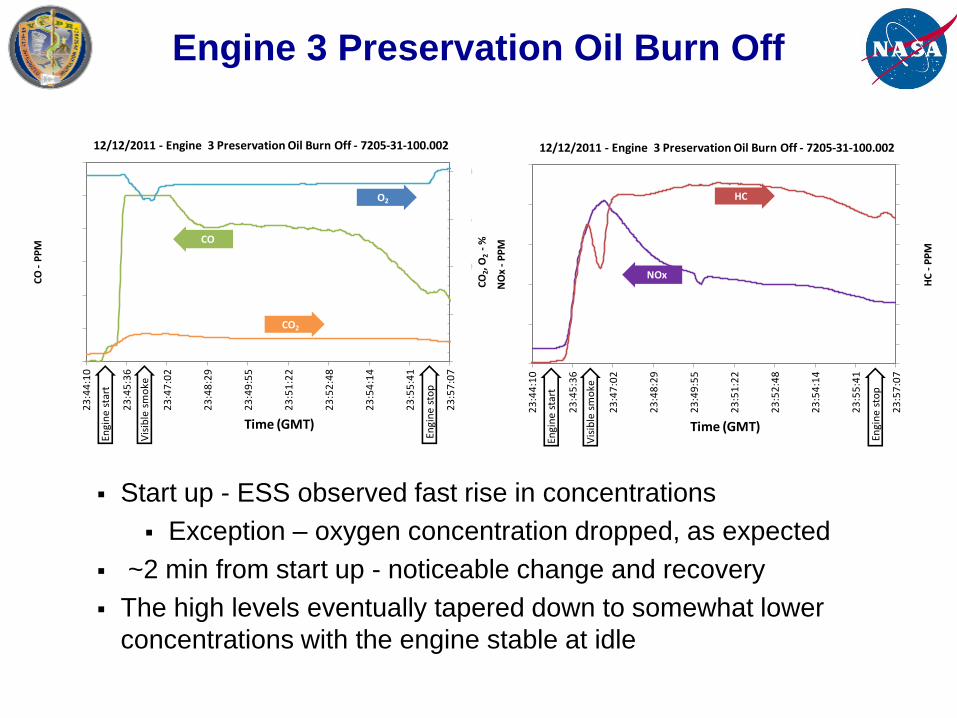
Engine 3 Preservation Oil Burn Off
Start up - ESS observed fast rise in concentrations
Exception – oxygen concentration dropped, as expected
~2 min from start up - noticeable change and recovery
The high levels eventually tapered down to somewhat lower
concentrations with the engine stable at idle
0
5
10
15
20
25
30
35
40
45
50
0
5
10
15
20
25
23
:44
:10
23
:45
:36
23
:47
:02
23
:48
:29
23
:49
:55
23
:51
:22
23
:52
:48
23
:54
:14
23
:55
:41
23
:57
:07
HC
-P
PM
NO
x -
PP
M
Time (GMT)
12/12/2011 - Engine 3 Preservation Oil Burn Off - 7205-31-100.002
NOx
HC
Engi
ne
star
t
Engi
ne
sto
p
Vis
ible
sm
oke
0
5
10
15
20
0
2000
4000
6000
8000
10000
12000
23
:44
:10
23
:45
:36
23
:47
:02
23
:48
:29
23
:49
:55
23
:51
:22
23
:52
:48
23
:54
:14
23
:55
:41
23
:57
:07
CO
2, O
2-
%
CO
-P
PM
Time (GMT)
12/12/2011 - Engine 3 Preservation Oil Burn Off - 7205-31-100.002
O2
CO
CO2
Engi
ne
star
t
Engi
ne
sto
p
Vis
ible
sm
oke
VIPR 3 Volcanic Ash
Background
• Ash ingestion tests were conducted in the 1980’s as outgrowth of nuclear bomb scenarios.
– Tests documented severely damaging effects of high concentrations (100’s of mg/m3) of “dust” (blends of materials, one of several components being volcanic ash).
• Prompted by the situation that developed during the 2010 eruption of Eyjafjallajökull Volcano, we now want to know more about the effect of flying through much lower concentrations—i.e., a few mg/m3.
• Current test is being conducted under the auspices of an ongoing NASA program, Vehicle Integrated Propulsion Research (VIPR), which supports development of sensors and models to measure jet-engine performance and diagnose problems during operation. So, VIPR is well-suited to address ash-ingestion testing.
Ash Concentrations
• Two ash concentrations around the “visible” threshold will be tested,
1 and 10 mg/m3. Want to have data to address the question “How stringent does the mitigation strategy of ash avoidance have to be?”
• Depending on conditions, 1 mg/m3 ash cloud may or may not be visible to the human eye. It also represents the approximate lower limit of what reliably can be injected into the engine in a controlled experiment.
• 10 mg/m3 ash cloud most likely will be visible and the order of magnitude difference in concentrations is expected to cause discernible differences in engine degradation effects.
• This test range also includes the “safety-case” threshold used on ash concentration charts introduced in Europe in 2010 (2-4 mg/m3).
Ash in the Engine
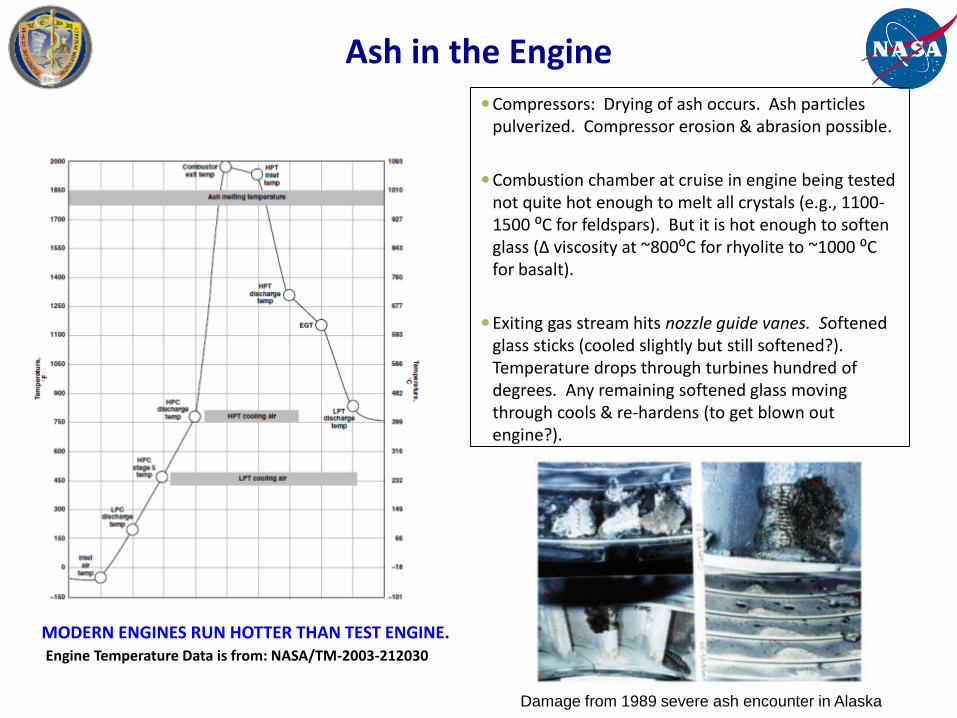
Compressors: Drying of ash occurs. Ash particles pulverized. Compressor erosion & abrasion possible.
Combustion chamber at cruise in engine being tested not quite hot enough to melt all crystals (e.g., 1100-1500 ⁰C for feldspars). But it is hot enough to soften glass (Δ viscosity at ~800⁰C for rhyolite to ~1000 ⁰C for basalt).
Exiting gas stream hits nozzle guide vanes. Softened glass sticks (cooled slightly but still softened?). Temperature drops through turbines hundred of degrees. Any remaining softened glass moving through cools & re-hardens (to get blown out engine?).
Damage from 1989 severe ash encounter in Alaska
MODERN ENGINES RUN HOTTER THAN TEST ENGINE. Engine Temperature Data is from: NASA/TM-2003-212030
Expected Test Results
Proprietary data rights and ITAR*/export control are issues being discussed.
*International Traffic in Arms Regulations– US Govt. regulations that control export & import of defense-related technical data.
However, various results are expected to be publicly available (published) including:
• Normalized performance changes in compressors and turbines.
• Hardware evaluation.
• Borescope inspections from the test.
• Teardown inspections after the test.
Summary
• VIPR 1 successfully completed in 2011
• VIPR 2 successfully completed in 2013
– 2x research from VIPR 1
• VIPR 3 Planned for 2015
– 3x research from VIPR 1
– Inclusion of Volcanic ash testing
– Rapid Engine Degradation with full suite of EHM
technologies installed on Engine
19

Questions
20