Embed Size (px)
Citation preview
217
VI. VEHICLE IMPACT WITH CURB-AND-GUARDRAIL SYSTEMS
6.1 Introduction
It is often necessary to use a curb at a particular location that also warrants a traffic
barrier. Inadequate design of these curb-and-barrier combination systems can result in
vehicles vaulting or under-riding the barrier. While the use of curbs is discouraged on
high-speed roadways, they are often required because of restricted right-of-way, drainage
considerations, access control, delineation and other curb functions. Curb-and-barrier
installations are currently being put in place without a clear understanding of the effects
that such combinations will have on the ability of the barrier to safely contain and
redirect an errant vehicle. There have been a very limited number of full-scale crash tests
on curb-and-barrier combinations and a large percentage of those tests involving the
larger class of passenger vehicles, such as the 2000-kg pickup truck, were
unsuccessful.(28) Even the cases involving the 2000-kg pickup truck that satisfied the
requirements of NCHRP Report 350 resulted in excessive damage to the barrier system
or extreme trajectories and instability of the vehicle.(29)(30)(32)
This chapter discusses the analysis of various curb-and-barrier systems subjected to
impact by a 2000 kg pickup truck (i.e., modified NCAC C2500R pickup truck model)
under three different impact conditions:
1) 100 km/hr and 25 degrees (i.e., NCHRP Report 350 Test 3-11),
2) 85 km/hr and 25 degrees and
218
3) 70 km/hr and 25 degrees (i.e., NCHRP Report 350 Test 2-11) .
The study includes the modified G4(1S) guardrail installed in combination with five curb
types (i.e., AASHTO types B, C, D, G and the 100-mm New York Curb). The analyses
are carried out using the finite element program LS-DYNA and are designed to
investigate the effects of curb type, curb placement and impact speed on the performance
of the barrier system.
6.2 Parametric Study
The modified G4(1S) guardrail model and the modified NCAC C2500R pickup model
(refer to Chapter 4) will be used to determine the impact response of guardrail placed in
combination with various types of curbs. There are a limited number of analyses that can
be conducted due to feasibility and time constraints, however, very useful information
can be achieved from the results of selected cases.
The analyses will involve the modified G4(1S) guardrail placed in combination with the
most commonly used types of AASHTO curbs and, additionally, the 100-mm New York
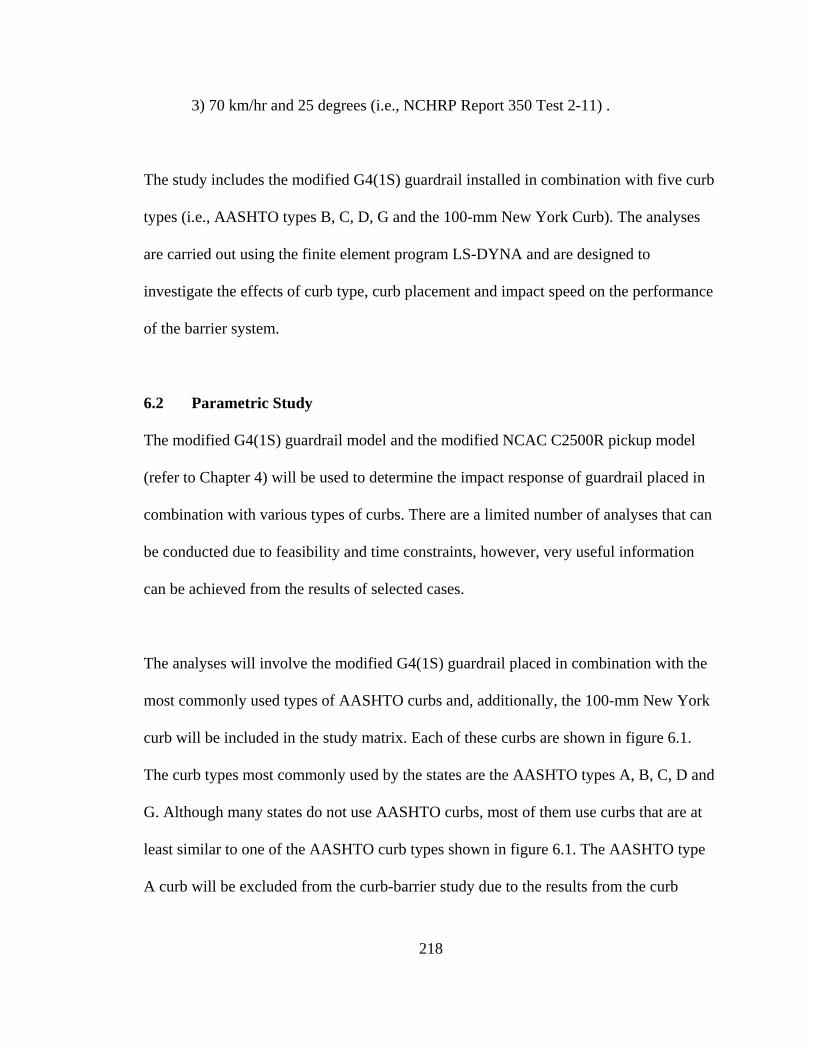
curb will be included in the study matrix. Each of these curbs are shown in figure 6.1.
The curb types most commonly used by the states are the AASHTO types A, B, C, D and
G. Although many states do not use AASHTO curbs, most of them use curbs that are at
least similar to one of the AASHTO curb types shown in figure 6.1. The AASHTO type
A curb will be excluded from the curb-barrier study due to the results from the curb
219
Figure 6.1: Curb types used in curb study.(1)
tracking study in chapter 5 in which the results of the analyses involving the AASHTO
type A curb were considered inconclusive.
Three curb placement scenarios will be investigated. One scenario will involve each of
the curbs placed behind the face of the barrier with the front of the curb flush with the
front of the w-beam where possible. These combinations are consistent with the
recommendations of the FHWA memorandum of Feb 28, 1992, and will provide useful
information to the states about the performance of these currently advocated curb-barrier
combinations.(28) Two other curb-placement scenarios will be investigated to determine
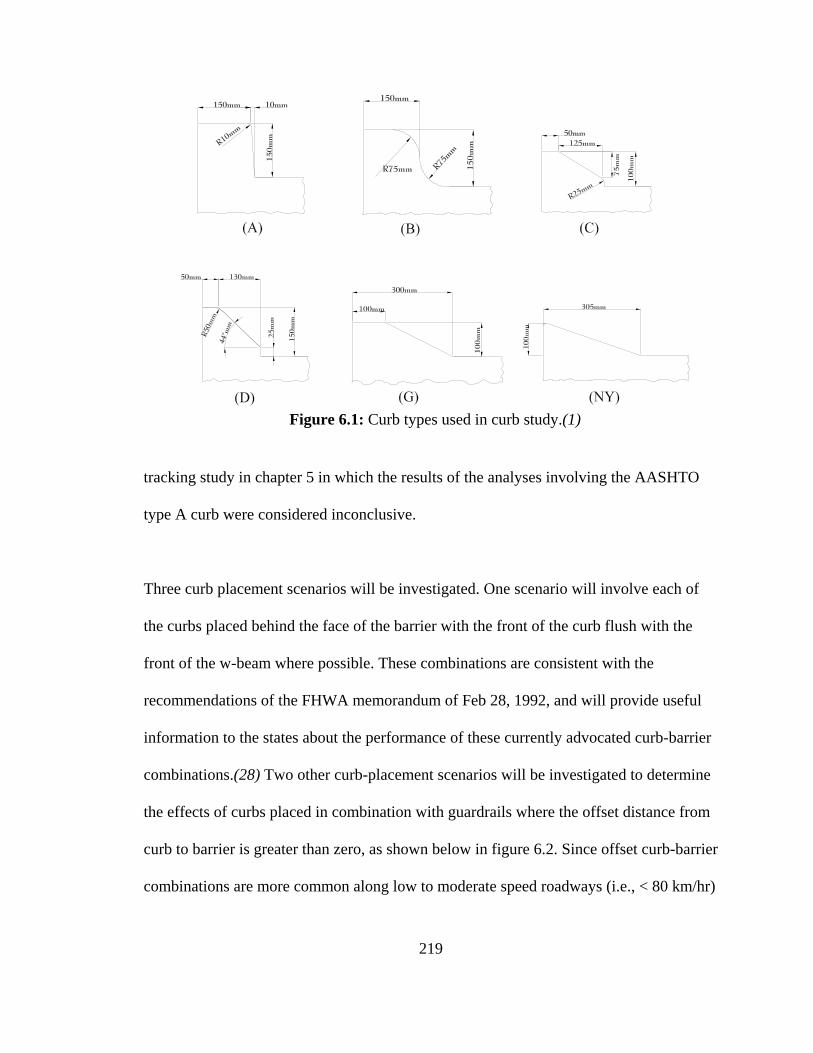
the effects of curbs placed in combination with guardrails where the offset distance from
curb to barrier is greater than zero, as shown below in figure 6.2. Since offset curb-barrier
combinations are more common along low to moderate speed roadways (i.e., < 80 km/hr)
220
Figure 6.2: Schematic drawing to identify curband barrier placement along roadway.
analyses of such combinations
will primarily be conducted for
NCHRP Test level 2 conditions
(i.e., 70-km/hr), although a select
number of impacts with certain
curb-barrier combinations will
be investigated at higher speeds.
The placement of the curbs in
those analyses will be based on the results of the curb-tracking study of Chapter 5 with
consideration given to the clear zone distances that are required for typical roadways.
The backfill and the roadway terrain in the computer model simulations will have a zero
slope. For design speeds of 70-80 km/hr the Roadside Design Guide states that the clear
zone distance ranges from 3.5 m for roadways with an Average Daily Traffic (ADT)
count of less than 750 vehicles per day (vpd) to 6.5 m for roadways with ADT greater
than 6,000 vpd.(2) For design speeds of 100 km/hr the clear zone distance ranges from 5
m to 8.5 m for roadways with less than 750 ADT to roadways with greater than 6,000
ADT, respectively.
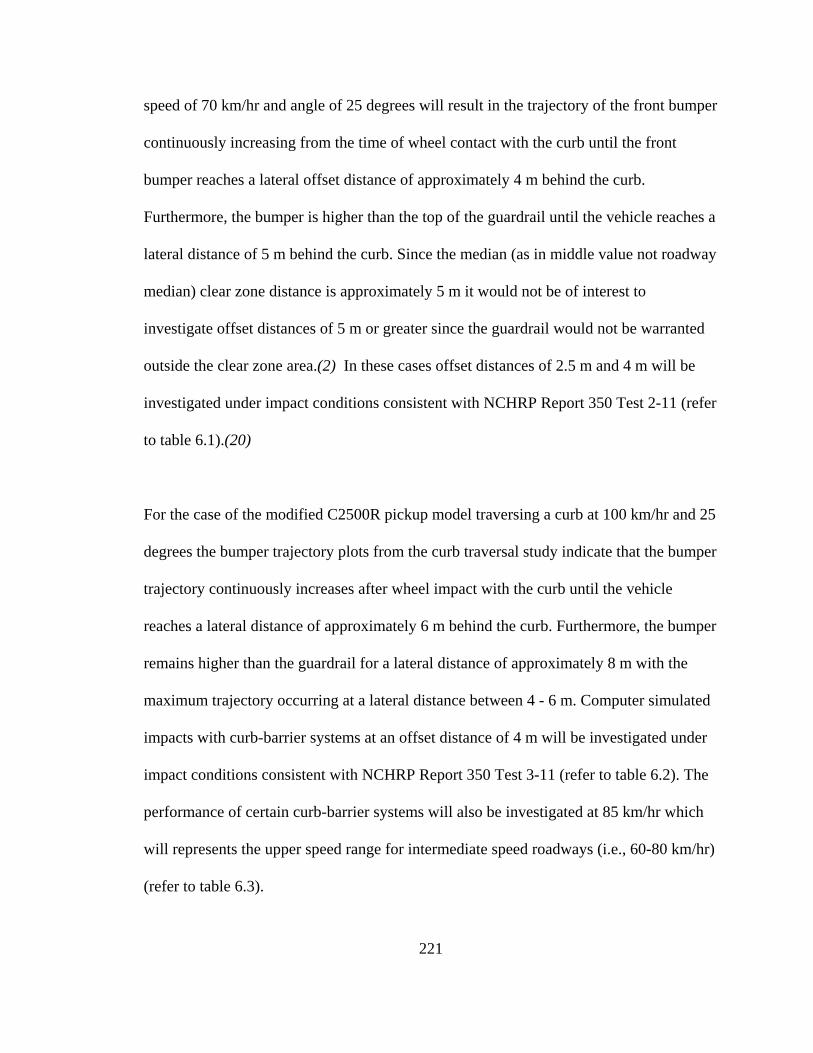
The matrix of simulations shown in Tables 6.1 through 6.3 will be used to investigate the
effects of curbs placed in combination with the G4(1S) guardrail. Based on the bumper
trajectory plots obtained from the curb traversal study in Chapter 5, a vehicle impact
221
speed of 70 km/hr and angle of 25 degrees will result in the trajectory of the front bumper
continuously increasing from the time of wheel contact with the curb until the front
bumper reaches a lateral offset distance of approximately 4 m behind the curb.
Furthermore, the bumper is higher than the top of the guardrail until the vehicle reaches a
lateral distance of 5 m behind the curb. Since the median (as in middle value not roadway
median) clear zone distance is approximately 5 m it would not be of interest to
investigate offset distances of 5 m or greater since the guardrail would not be warranted
outside the clear zone area.(2) In these cases offset distances of 2.5 m and 4 m will be
investigated under impact conditions consistent with NCHRP Report 350 Test 2-11 (refer
to table 6.1).(20)
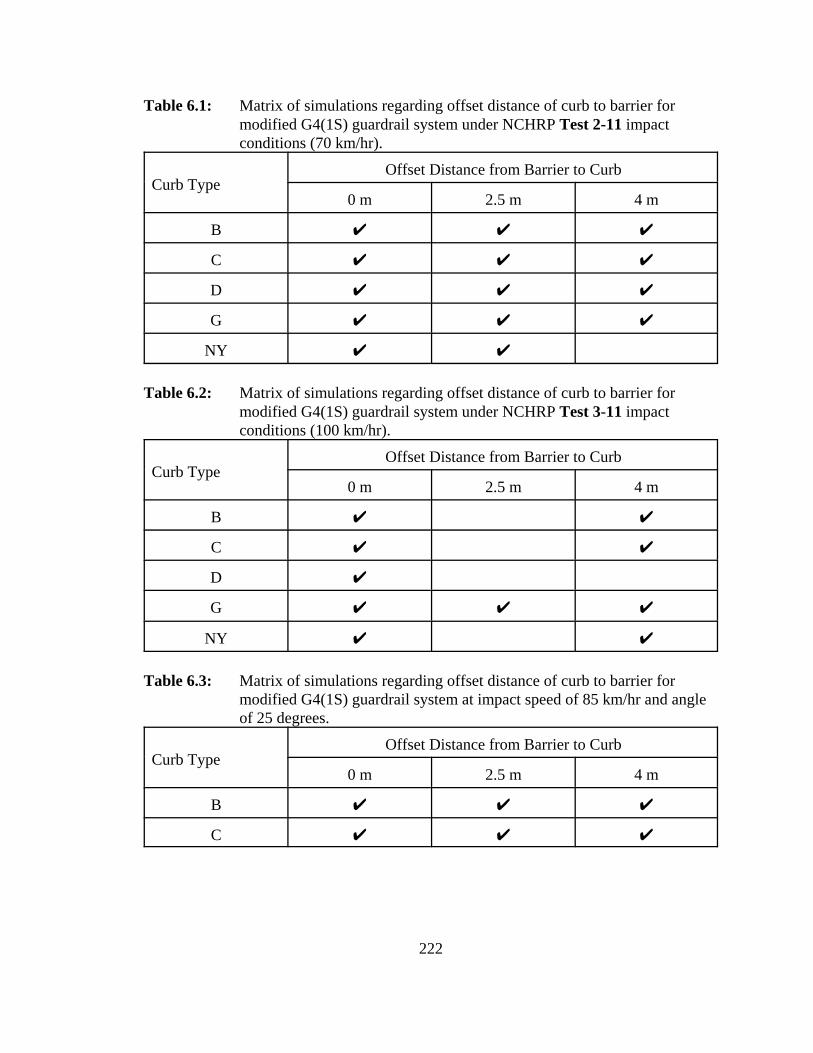
For the case of the modified C2500R pickup model traversing a curb at 100 km/hr and 25
degrees the bumper trajectory plots from the curb traversal study indicate that the bumper
trajectory continuously increases after wheel impact with the curb until the vehicle
reaches a lateral distance of approximately 6 m behind the curb. Furthermore, the bumper
remains higher than the guardrail for a lateral distance of approximately 8 m with the
maximum trajectory occurring at a lateral distance between 4 - 6 m. Computer simulated
impacts with curb-barrier systems at an offset distance of 4 m will be investigated under
impact conditions consistent with NCHRP Report 350 Test 3-11 (refer to table 6.2). The
performance of certain curb-barrier systems will also be investigated at 85 km/hr which
will represents the upper speed range for intermediate speed roadways (i.e., 60-80 km/hr)
(refer to table 6.3).
222
Table 6.1: Matrix of simulations regarding offset distance of curb to barrier formodified G4(1S) guardrail system under NCHRP Test 2-11 impactconditions (70 km/hr).
Curb TypeOffset Distance from Barrier to Curb
0 m 2.5 m 4 m
B U U U
C U U U
D U U U
G U U U
NY U U
Table 6.2: Matrix of simulations regarding offset distance of curb to barrier formodified G4(1S) guardrail system under NCHRP Test 3-11 impactconditions (100 km/hr).
Curb TypeOffset Distance from Barrier to Curb
0 m 2.5 m 4 m
B U U
C U U
D U
G U U U
NY U U
Table 6.3: Matrix of simulations regarding offset distance of curb to barrier formodified G4(1S) guardrail system at impact speed of 85 km/hr and angleof 25 degrees.
Curb TypeOffset Distance from Barrier to Curb
0 m 2.5 m 4 m
B U U U
C U U U
223
6.3 Data Collected
The information collected from the analyses is being used to determine the effectiveness
of the guardrail to safely contain and redirect the vehicle during impact with the curb-
barrier system. The data that were collected are listed below and are included as
Appendices to this document. They include:
Appendix 8. Sequential snapshots of the impact event,
Appendix 9. Acceleration-time histories,
Appendix 10. Yaw-, pitch- and roll-time histories,
Appendix 11. W-beam tensile force-time histories, and
Appendix 12. Test Risk Assessment Program Results.
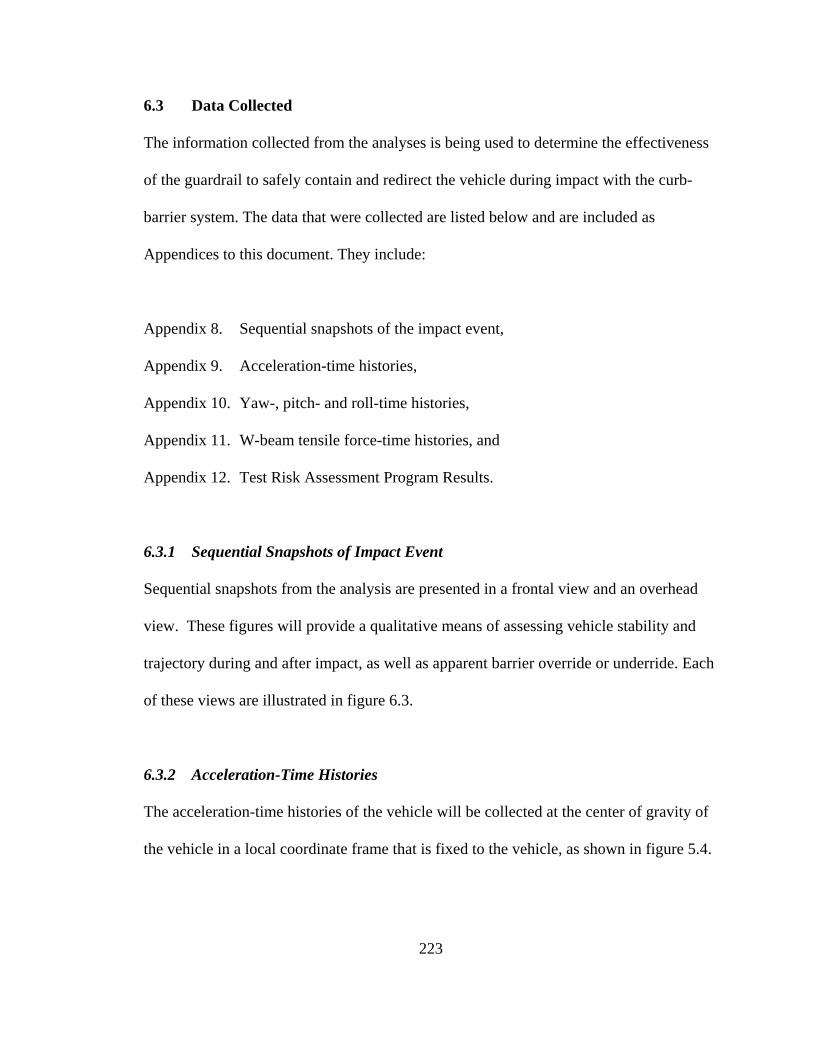
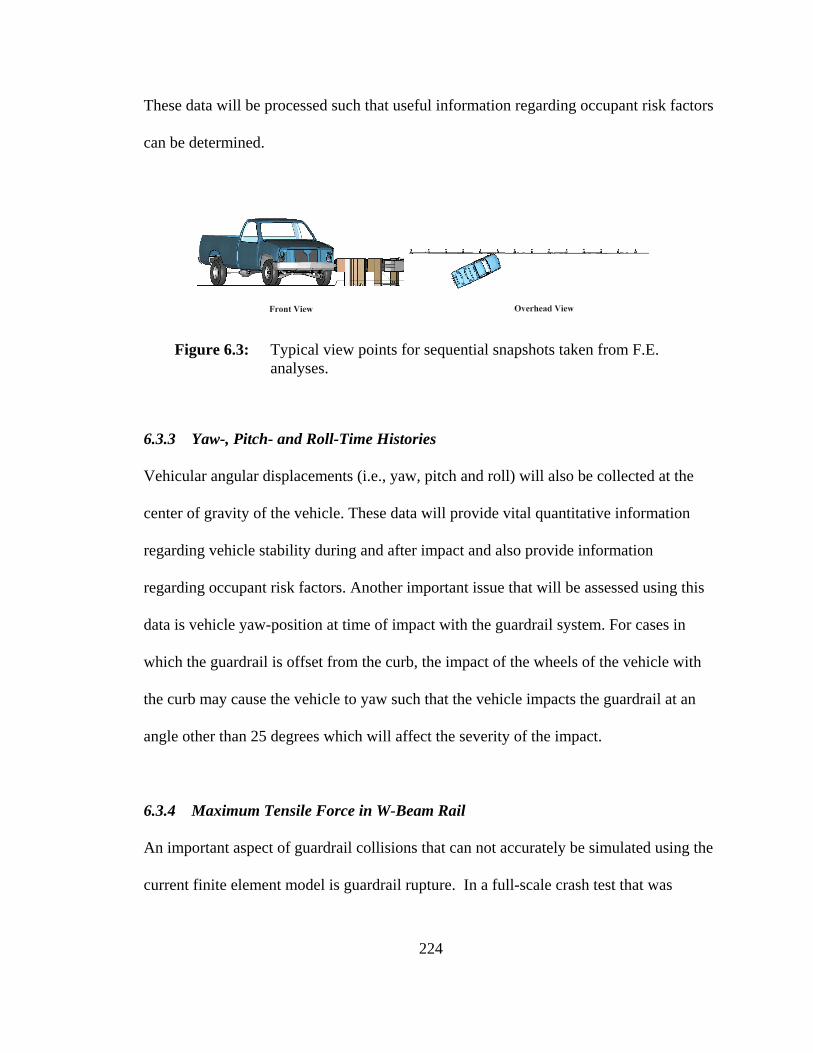
6.3.1 Sequential Snapshots of Impact Event
Sequential snapshots from the analysis are presented in a frontal view and an overhead
view. These figures will provide a qualitative means of assessing vehicle stability and
trajectory during and after impact, as well as apparent barrier override or underride. Each
of these views are illustrated in figure 6.3.
6.3.2 Acceleration-Time Histories
The acceleration-time histories of the vehicle will be collected at the center of gravity of
the vehicle in a local coordinate frame that is fixed to the vehicle, as shown in figure 5.4.
224
Figure 6.3: Typical view points for sequential snapshots taken from F.E.analyses.
These data will be processed such that useful information regarding occupant risk factors
can be determined.
6.3.3 Yaw-, Pitch- and Roll-Time Histories
Vehicular angular displacements (i.e., yaw, pitch and roll) will also be collected at the
center of gravity of the vehicle. These data will provide vital quantitative information
regarding vehicle stability during and after impact and also provide information
regarding occupant risk factors. Another important issue that will be assessed using this
data is vehicle yaw-position at time of impact with the guardrail system. For cases in
which the guardrail is offset from the curb, the impact of the wheels of the vehicle with
the curb may cause the vehicle to yaw such that the vehicle impacts the guardrail at an
angle other than 25 degrees which will affect the severity of the impact.
6.3.4 Maximum Tensile Force in W-Beam Rail
An important aspect of guardrail collisions that can not accurately be simulated using the
current finite element model is guardrail rupture. In a full-scale crash test that was
225
conducted at the Midwest Roadside Safety Facility in May of 1998, a guardrail-curb
combination was tested under NCHRP Report 350 test 3-11 conditions, which resulted in
the guardrail rupturing at a splice connection.(28) Such failure can be assessed with FEA,
however, the model used in the current analyses did not incorporate a failure criteria on
the w-beam rail elements. This is because accurate simulation of rupture using
Lagrangian finite element methods requires a refined mesh (i.e., very small elements) in
the fracture region which would result in a very small time-step in order to obtain a stable
solution using the explicit time-integration scheme.
Since failure conditions are typically based on failure strain, which is very sensitive to
mesh density, it is common practice to exclude failure in the full-scale simulation and
rely the results of the full-scale simulation to identify the critical regions in the system
(e.g., post and w-beam connections) that may have a potential for failure. Sub-models of
these components could then be developed in order to thoroughly assess the performance
of those components. This method, however, would severely limit the number of curb-
barrier impact scenarios that could be investigated.
Another means of assessing the potential for guardrail rupture is to examine tensile forces
in the w-beam during collision. Guardrail rupture is often associated with relatively large
displacement of the anchor system which leads to “pocketing”. Pocketing is a term used
to describe a situation in which there is large lateral displacement of the rail concurrent
with a decrease in guardrail tension downstream of the vehicle which causes the rail
226
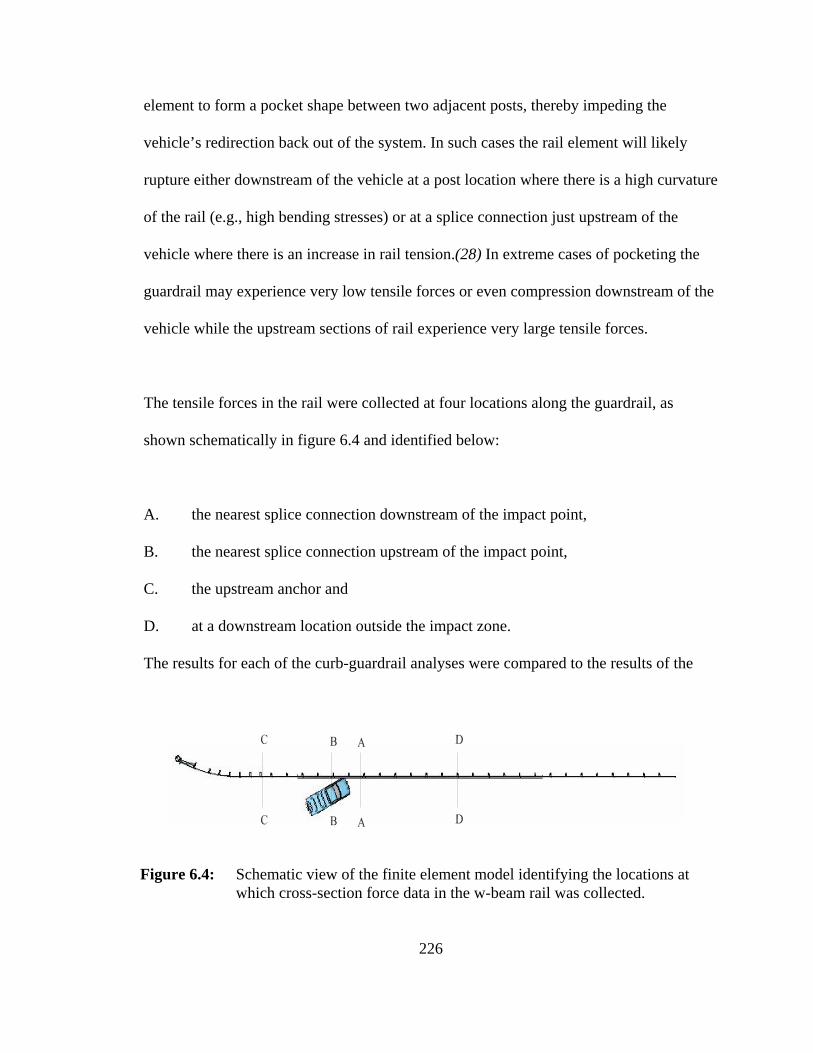
Figure 6.4: Schematic view of the finite element model identifying the locations atwhich cross-section force data in the w-beam rail was collected.
element to form a pocket shape between two adjacent posts, thereby impeding the
vehicle’s redirection back out of the system. In such cases the rail element will likely
rupture either downstream of the vehicle at a post location where there is a high curvature
of the rail (e.g., high bending stresses) or at a splice connection just upstream of the
vehicle where there is an increase in rail tension.(28) In extreme cases of pocketing the
guardrail may experience very low tensile forces or even compression downstream of the
vehicle while the upstream sections of rail experience very large tensile forces.
The tensile forces in the rail were collected at four locations along the guardrail, as
shown schematically in figure 6.4 and identified below:
A. the nearest splice connection downstream of the impact point,
B. the nearest splice connection upstream of the impact point,
C. the upstream anchor and
D. at a downstream location outside the impact zone.
The results for each of the curb-guardrail analyses were compared to the results of the
227
guardrail analyses without a curb present. Previous results from finite element analysis
and crash tests on the modified G4(1S) without a curb imply that the forces in the
guardrail under NCHRP Report 350 test 3-11 impact conditions are close to the
maximum capacity that the guardrail can withstand without rupture or without causing
excessive anchor movement.(56) If the rail forces are significantly higher in the curb-
guardrail simulations than they are in the simulations without a curb present, then there
may be a potential for rupture in those cases.
6.3.5 Test Risk Assessment Program (TRAP) Results
The acceleration data and displacement-time history data discussed above will be used in
the Test Risk Assessment Program (TRAP).(46) NCHRP Report 350 requires that the
occupant impact velocity (OIV) in the longitudinal direction should not exceed 12 m/s
and the occupant ridedown acceleration (ORA) (i.e., the maximum vehicle acceleration
averaged over 10 ms interval after occupant impact) in the longitudinal direction should
not exceed 20 G’s. Both the NCHRP occupant risk factors and the CEN risk factors will
be reported, however, the CEN data are not required by the Federal Highway
Administration and will not be considered in the performance evaluation of the curb-
barrier systems.
6.4 Results
At the beginning of each analysis the vehicle was aligned to impact post 14 of the
guardrail system. This point is 2.4 m upstream of a splice connection. The exact impact
228
point may vary in some cases where the barrier is offset from the curb depending on the
yaw angle of the vehicle after impact with the curb. The results of the finite element
analyses are presented in the Appendices of this report. Animations of the impact events
are provided on the NCHRP 22-17 project web site at:
http://cee.wpi.edu/Roadsafe/Curbs/Curb-Guardrail_AVIS/ . Summary tables and
graphs of the results of the study are presented below.
6.4.1 Sequential Snapshots of the Impact Event
Sequential snapshots of the impact event are shown in Appendix 8. These images provide
a qualitative means of evaluating the general behavior of vehicle interaction with the
guardrail as well as the important safety issues regarding vehicle kinematics such as
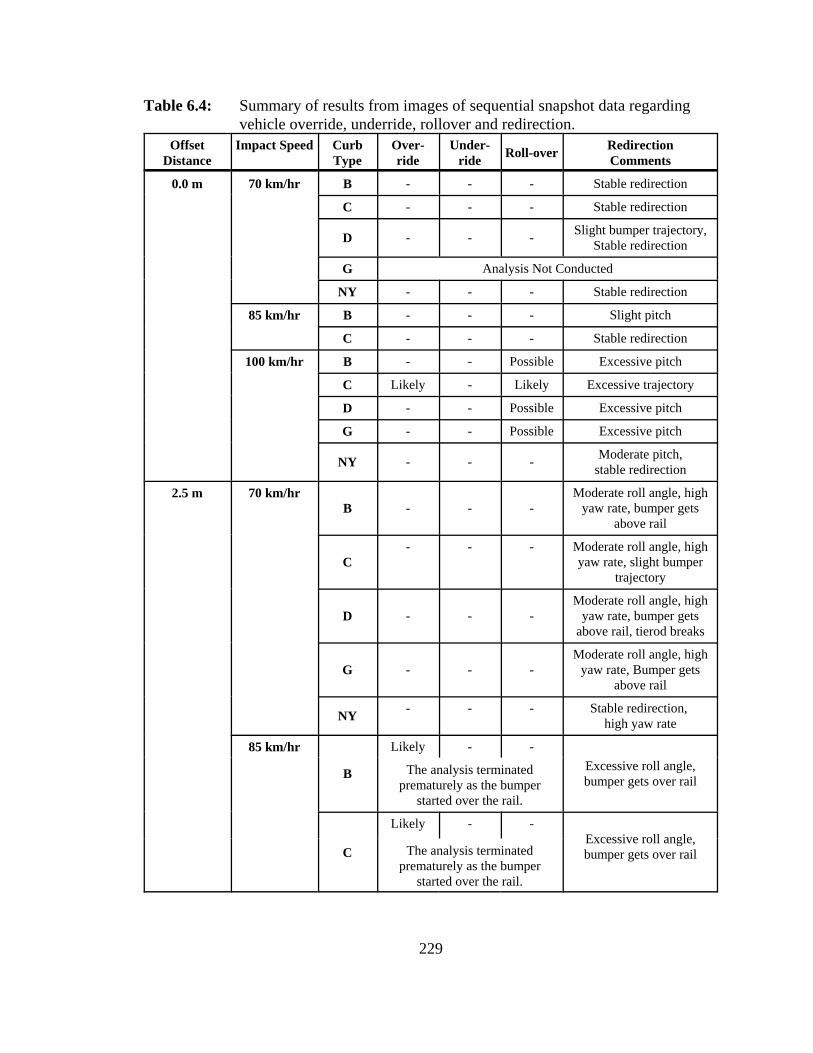
barrier override, barrier underride, vehicle overturn, and vehicle redirection. Table 6.4
summarizes the results based upon the images in Appendix 8. It is important to note that
vehicle impact into roadside barriers is highly nonlinear which means that small
variations in the system may lead to different results. Such variations may include impact
conditions, impact location on the barrier, vehicle suspension properties, soil conditions,
barrier connections, and barrier component properties to name only a few. Because of the
nature of these factors the results of the finite element analyses should only be viewed as
a tool for assessing the performance of the system, and are thus only representative of a
possible outcome for the conditions specified.
229
Table 6.4: Summary of results from images of sequential snapshot data regardingvehicle override, underride, rollover and redirection.
OffsetDistance
Impact Speed CurbType
Over-ride
Under-ride Roll-over Redirection
Comments
0.0 m 70 km/hr B - - - Stable redirection
C - - - Stable redirection
D - - - Slight bumper trajectory,Stable redirection
G Analysis Not Conducted
NY - - - Stable redirection
85 km/hr B - - - Slight pitch
C - - - Stable redirection
100 km/hr B - - Possible Excessive pitch
C Likely - Likely Excessive trajectory
D - - Possible Excessive pitch
G - - Possible Excessive pitch
NY - - - Moderate pitch,stable redirection
2.5 m 70 km/hrB - - -
Moderate roll angle, highyaw rate, bumper gets
above rail
C- - - Moderate roll angle, high
yaw rate, slight bumpertrajectory
D - - -Moderate roll angle, high
yaw rate, bumper getsabove rail, tierod breaks
G - - -Moderate roll angle, high
yaw rate, Bumper getsabove rail
NY - - - Stable redirection, high yaw rate
85 km/hr
B
Likely - -Excessive roll angle,bumper gets over rail
The analysis terminatedprematurely as the bumper
started over the rail.
C
Likely - -Excessive roll angle,bumper gets over railThe analysis terminated
prematurely as the bumperstarted over the rail.
230
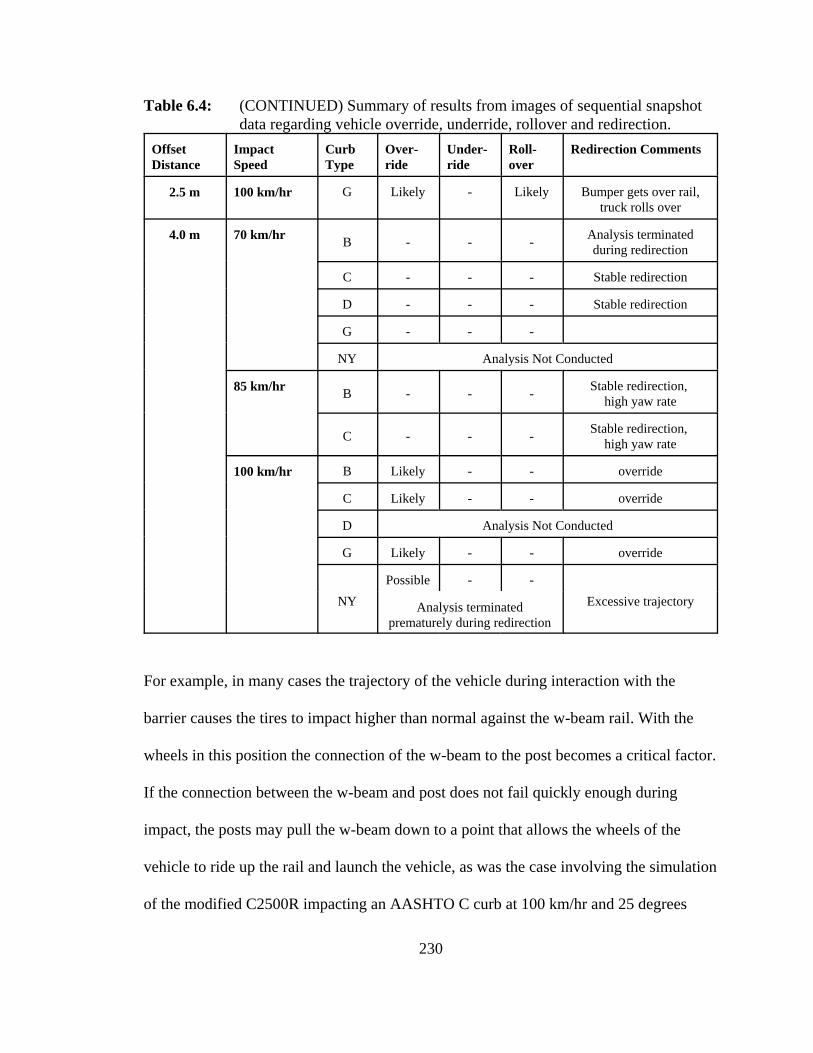
Table 6.4: (CONTINUED) Summary of results from images of sequential snapshotdata regarding vehicle override, underride, rollover and redirection.
OffsetDistance
ImpactSpeed
CurbType
Over-ride
Under-ride
Roll-over
Redirection Comments
2.5 m 100 km/hr G Likely - Likely Bumper gets over rail,truck rolls over
4.0 m 70 km/hr B - - - Analysis terminatedduring redirection
C - - - Stable redirection
D - - - Stable redirection
G - - -
NY Analysis Not Conducted
85 km/hr B - - - Stable redirection, high yaw rate
C - - - Stable redirection, high yaw rate
100 km/hr B Likely - - override
C Likely - - override
D Analysis Not Conducted
G Likely - - override
NYPossible - -
Excessive trajectoryAnalysis terminatedprematurely during redirection
For example, in many cases the trajectory of the vehicle during interaction with the
barrier causes the tires to impact higher than normal against the w-beam rail. With the
wheels in this position the connection of the w-beam to the post becomes a critical factor.
If the connection between the w-beam and post does not fail quickly enough during
impact, the posts may pull the w-beam down to a point that allows the wheels of the
vehicle to ride up the rail and launch the vehicle, as was the case involving the simulation
of the modified C2500R impacting an AASHTO C curb at 100 km/hr and 25 degrees
231
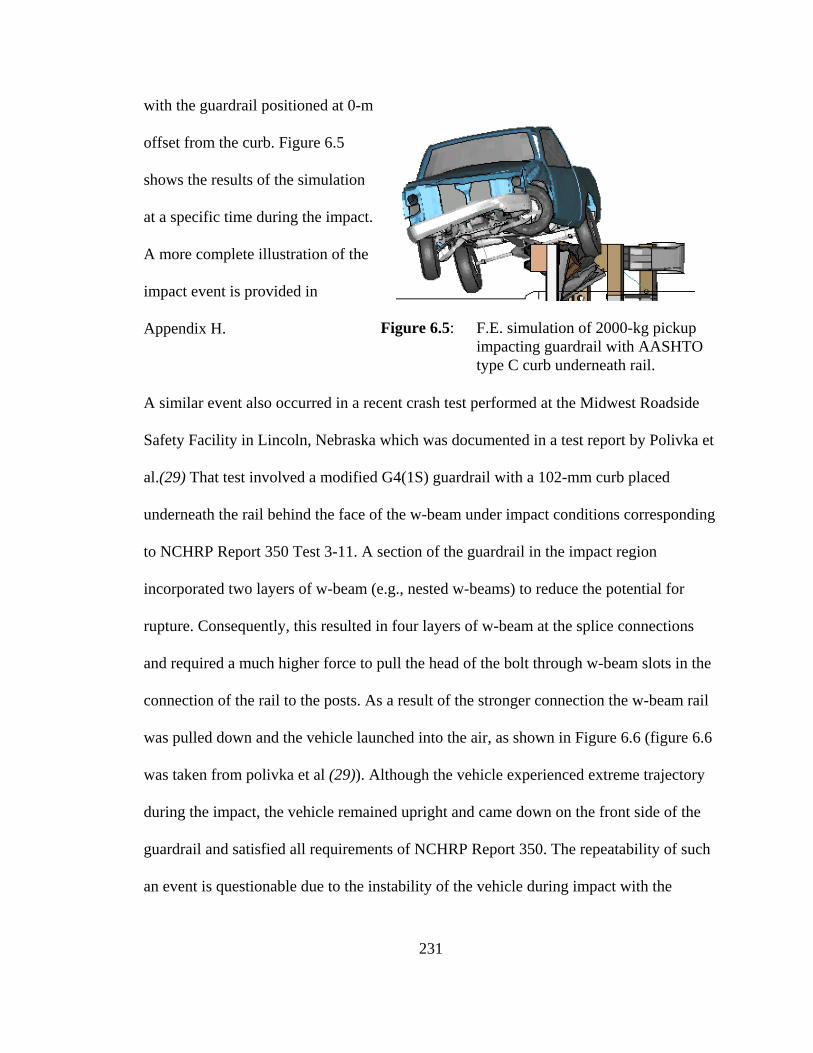
Figure 6.5: F.E. simulation of 2000-kg pickupimpacting guardrail with AASHTOtype C curb underneath rail.
with the guardrail positioned at 0-m
offset from the curb. Figure 6.5
shows the results of the simulation
at a specific time during the impact.
A more complete illustration of the
impact event is provided in
Appendix H.
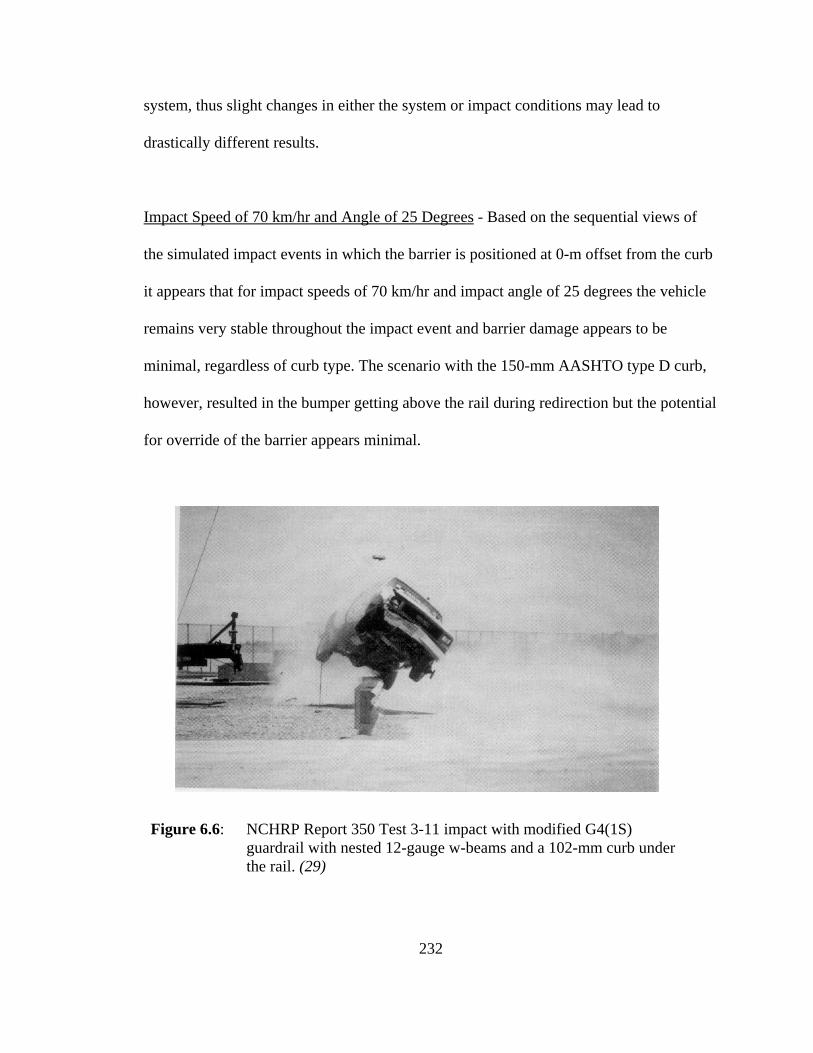
A similar event also occurred in a recent crash test performed at the Midwest Roadside
Safety Facility in Lincoln, Nebraska which was documented in a test report by Polivka et
al.(29) That test involved a modified G4(1S) guardrail with a 102-mm curb placed
underneath the rail behind the face of the w-beam under impact conditions corresponding
to NCHRP Report 350 Test 3-11. A section of the guardrail in the impact region
incorporated two layers of w-beam (e.g., nested w-beams) to reduce the potential for
rupture. Consequently, this resulted in four layers of w-beam at the splice connections
and required a much higher force to pull the head of the bolt through w-beam slots in the
connection of the rail to the posts. As a result of the stronger connection the w-beam rail
was pulled down and the vehicle launched into the air, as shown in Figure 6.6 (figure 6.6
was taken from polivka et al (29)). Although the vehicle experienced extreme trajectory
during the impact, the vehicle remained upright and came down on the front side of the
guardrail and satisfied all requirements of NCHRP Report 350. The repeatability of such
an event is questionable due to the instability of the vehicle during impact with the
232
Figure 6.6: NCHRP Report 350 Test 3-11 impact with modified G4(1S)guardrail with nested 12-gauge w-beams and a 102-mm curb underthe rail. (29)
system, thus slight changes in either the system or impact conditions may lead to
drastically different results.
Impact Speed of 70 km/hr and Angle of 25 Degrees - Based on the sequential views of
the simulated impact events in which the barrier is positioned at 0-m offset from the curb
it appears that for impact speeds of 70 km/hr and impact angle of 25 degrees the vehicle
remains very stable throughout the impact event and barrier damage appears to be
minimal, regardless of curb type. The scenario with the 150-mm AASHTO type D curb,
however, resulted in the bumper getting above the rail during redirection but the potential
for override of the barrier appears minimal.
233
For the cases involving the barrier positioned at 2.5-m offset from AASHTO curb types
B, C, D and G, the sequential views of the impact events suggests that the vehicle will
experience moderate roll angle during impact and a relatively high yaw rate (e.g., the
front of vehicle redirects out of the system before the rear of the vehicle contacts the rail).
Also, for the cases involving 150-mm curb types the bumper of the vehicle gets above the
rail but there is little possibility of override in those cases. The impact scenario involving
the 100-mm New York curb resulted in very stable redirection, however, the yaw rate
appeared somewhat high in this case as well.
For the cases involving the barrier positioned at 4.0-m offset from the curbs the vehicle
remains very stable throughout the impact event and barrier damage appears to be
minimal, regardless of the type of curb used in conjunction with the guardrail. However,
the vehicle appears to experience a high yaw rate during redirection which may increase
risk of occupant injury.
Impact Speed of 85 km/hr and Angle of 25 Degrees - Only two curb types, the 150-mm
AASHTO type B and the 100-mm AASHTO type C curbs, were used in the curb-barrier
scenarios involving impact speed of 85 km/hr and impact angle of 25 degrees. These
cases were analyzed in order to assess the performance of the curb-barrier systems at
speeds corresponding to the upper bound of the moderate-speed range (i.e., 60-80 km/hr)
and the lower bound of the high-speed range (i.e., > 80 m/hr).
234
For the cases involving the barrier positioned at 0.0-m offset from the curbs the
sequential views of the impact suggests that the vehicle will remain relatively stable
during impact. There was a slight pitch of the vehicle when the rear wheels contacted the
150-mm AASHTO type B curb. For the cases with the barrier positioned at 2.5-m offset
from the curb the analyses terminated prematurely due to numerical problems in the
calculations which were related to contact between the w-beam rail and truck fender. The
analyses did continue long enough, however, to conclude that there is a potential for
excessive roll of the vehicle during impact and that the bumper is likely to get over the
w-beam rail. Furthermore, the momentum of the truck combined with the excessive
trajectory of the bumper is sufficient to cause barrier override. For the cases involving the
barrier positioned at 4.0-m offset from the curb the sequential views of the impact events
suggests that the vehicle will remain stable but it is likely to experience a high yaw rate
during redirection.
Impact Speed of 100 km/hr and Angle of 25 Degrees - The sequential views of the impact
events involving the barrier positioned at 0.0-m offset from the curbs indicate that
rollover of the vehicle is possible for each curb-barrier scenario involving the AASHTO
types B, C, D and G curbs due to excessive pitch of the vehicle during redirection.
Although the vehicle did not rollover in the simulations, the amount of damage to the
front impact side wheel during impact and the position of the front wheels during
redirection become a critical factor regarding vehicle stability when the pitch angle of the
vehicle is excessive during redirection. In the simulations the wheels remained
235
undamaged and in straight alignment during redirection. There was one case of barrier
override involving the 100-mm AASHTO type C curb. In this analysis a wheel snag
against a guardrail blockout early in the impact event caused the tierod to break. The
front wheel on the impact side of the vehicle then rotated 90 degrees toward the
guardrail. The w-beam rail was pushed down and the vehicle launched over the guardrail.
The impact scenario involving the 100-mm New York curb resulted in minimal trajectory
of the vehicle with only moderate pitch and a relatively stable redirection.
Only one curb type, the AASHTO type G curb, was used in the case involving the barrier
positioned at 2.5-m offset from the curb. The trajectory of the truck was excessive during
impact and, although the trajectory of the front bumper and the momentum of the vehicle
appeared sufficient to cause the vehicle to override the barrier, the guardrail redirected
the vehicle away from the system where it then proceeded to roll over onto its side. For
the cases involving the barrier positioned at 4.0-m offset from the curb the sequential
views of the impact events suggest that barrier override is likely regardless of curb type.
Note: the analysis involving the 100-mm New York curb resulted in premature
termination due to numerical problems in the calculations which were related to contact
between the front tire and the w-beam, however, at the time the analysis was stopped the
trajectory and roll angle of the truck was excessive enough to suspect barrier override
and/or rollover.
236
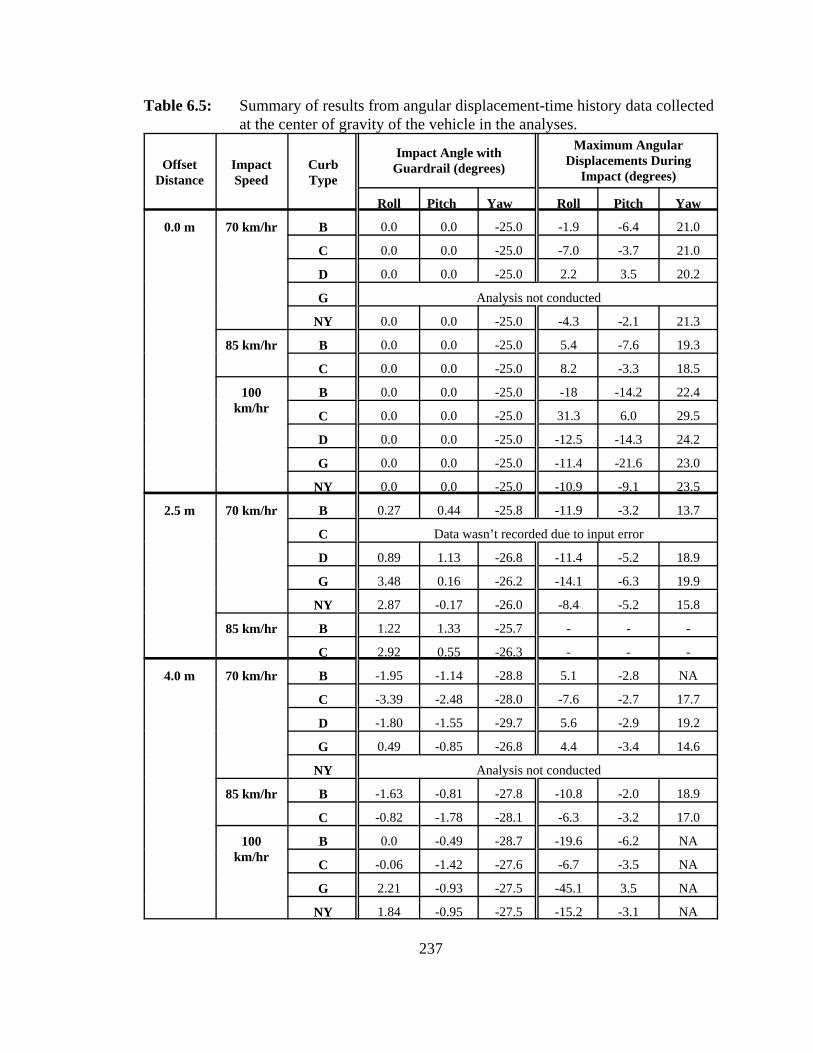
6.4.2 Angular Displacement-Time History Data
The roll, pitch and yaw angle displacement-time history data was collected at the center
of gravity of the vehicle during the impact event and are shown graphically in Appendix
10. Table 6.5 gives a summary of the vehicle angular position at the time of impact with
the guardrail, the maximum roll and pitch angle of the vehicle during the impact event
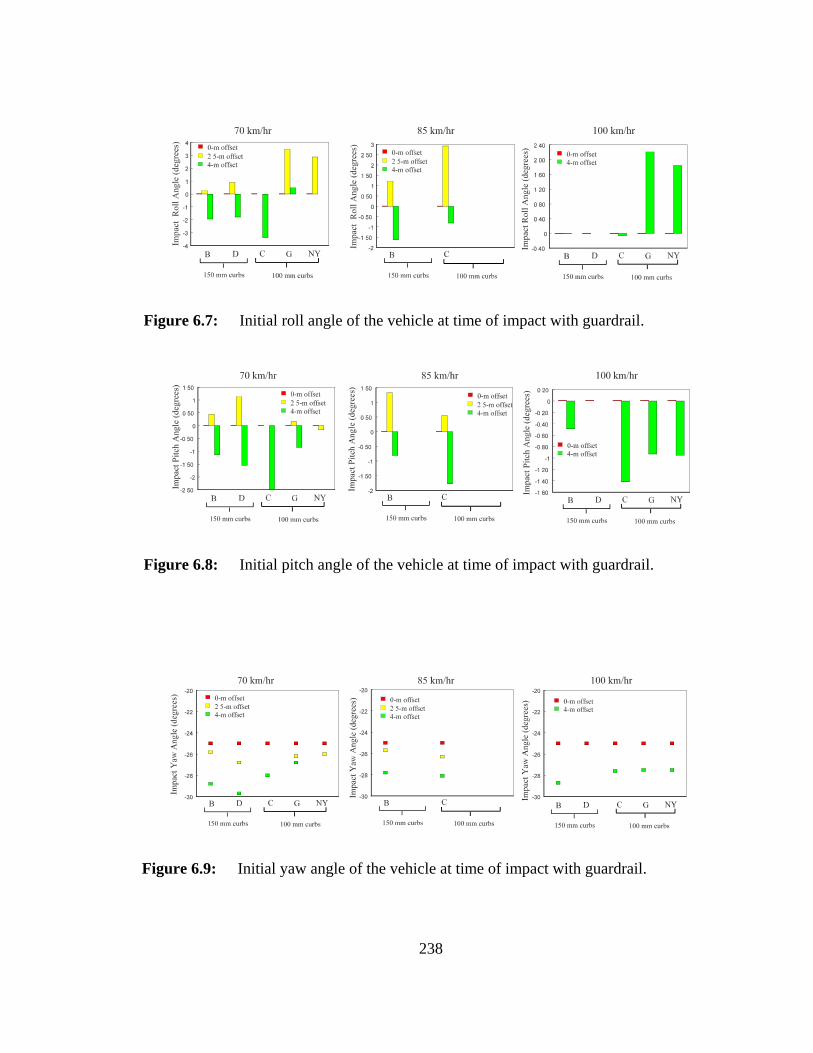
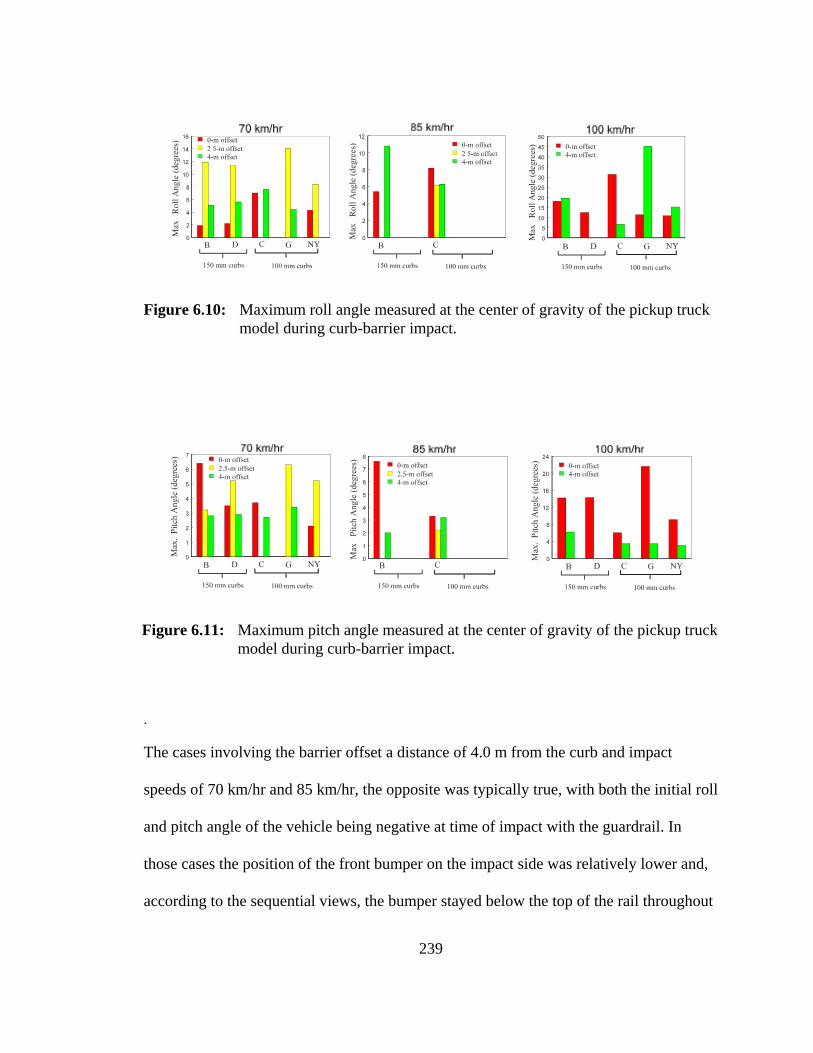
and the yaw angle of the vehicle as it exits guardrail. Figures 6.7, 6.8 and 6.9 illustrate
graphically the initial angular positions of the vehicle at time of impact with guardrail
and figures 6.10 and 6.11 show maximum roll angle and maximum pitch angle for each
of the curb-barrier impact scenarios, respectively.
Figure 6.7 and 6.8 indicate that when the barrier is offset a distance of 2.5 m from the
curb and the truck impacts the system at speeds of 70 km/hr and 85 km/hr the initial roll
and pitch angle of the vehicle at time of impact with the guardrail are typically both
positive (refer to local coordinate system of figure 5.4) with the exception of the 100-mm
New York curb. This results in the position of the front bumper on the impact side of the
vehicle being higher than normal at the time of impact and, according to a qualitative
analysis of the sequential views of the impact, the bumper was above the rail during
impact for each of these cases. The maximum roll angle of the vehicle during impact was
relatively higher in those cases as well, as shown in figure 6.10. The graph corresponding
to impact speed of 85 km/hr is a little misleading since the vehicle overrode the barrier in
those cases and the analysis was terminated before maximum roll was achieved.
237
Table 6.5: Summary of results from angular displacement-time history data collectedat the center of gravity of the vehicle in the analyses.
OffsetDistance
ImpactSpeed
CurbType
Impact Angle withGuardrail (degrees)
Maximum AngularDisplacements During
Impact (degrees)
Roll Pitch Yaw Roll Pitch Yaw
0.0 m 70 km/hr B 0.0 0.0 -25.0 -1.9 -6.4 21.0
C 0.0 0.0 -25.0 -7.0 -3.7 21.0
D 0.0 0.0 -25.0 2.2 3.5 20.2
G Analysis not conducted
NY 0.0 0.0 -25.0 -4.3 -2.1 21.3
85 km/hr B 0.0 0.0 -25.0 5.4 -7.6 19.3
C 0.0 0.0 -25.0 8.2 -3.3 18.5
100km/hr
B 0.0 0.0 -25.0 -18 -14.2 22.4
C 0.0 0.0 -25.0 31.3 6.0 29.5
D 0.0 0.0 -25.0 -12.5 -14.3 24.2
G 0.0 0.0 -25.0 -11.4 -21.6 23.0
NY 0.0 0.0 -25.0 -10.9 -9.1 23.5
2.5 m 70 km/hr B 0.27 0.44 -25.8 -11.9 -3.2 13.7
C Data wasn’t recorded due to input error
D 0.89 1.13 -26.8 -11.4 -5.2 18.9
G 3.48 0.16 -26.2 -14.1 -6.3 19.9
NY 2.87 -0.17 -26.0 -8.4 -5.2 15.8
85 km/hr B 1.22 1.33 -25.7 - - -
C 2.92 0.55 -26.3 - - -
4.0 m 70 km/hr B -1.95 -1.14 -28.8 5.1 -2.8 NA
C -3.39 -2.48 -28.0 -7.6 -2.7 17.7
D -1.80 -1.55 -29.7 5.6 -2.9 19.2
G 0.49 -0.85 -26.8 4.4 -3.4 14.6
NY Analysis not conducted
85 km/hr B -1.63 -0.81 -27.8 -10.8 -2.0 18.9
C -0.82 -1.78 -28.1 -6.3 -3.2 17.0
100km/hr
B 0.0 -0.49 -28.7 -19.6 -6.2 NA
C -0.06 -1.42 -27.6 -6.7 -3.5 NA
G 2.21 -0.93 -27.5 -45.1 3.5 NA
NY 1.84 -0.95 -27.5 -15.2 -3.1 NA
238
Figure 6.7: Initial roll angle of the vehicle at time of impact with guardrail.
Figure 6.9: Initial yaw angle of the vehicle at time of impact with guardrail.
Figure 6.8: Initial pitch angle of the vehicle at time of impact with guardrail.
239
Figure 6.10: Maximum roll angle measured at the center of gravity of the pickup truckmodel during curb-barrier impact.
Figure 6.11: Maximum pitch angle measured at the center of gravity of the pickup truckmodel during curb-barrier impact.
.
The cases involving the barrier offset a distance of 4.0 m from the curb and impact
speeds of 70 km/hr and 85 km/hr, the opposite was typically true, with both the initial roll
and pitch angle of the vehicle being negative at time of impact with the guardrail. In
those cases the position of the front bumper on the impact side was relatively lower and,
according to the sequential views, the bumper stayed below the top of the rail throughout
240
the impact event. For the scenarios involving impact speeds of 100 km/hr the initial roll
angle was typically either zero or positive while the initial pitch angle was typically
negative. In those cases the trajectory and momentum of the vehicle dominated and the
primary result was vehicle override as illustrated in the sequential views. The graph of
maximum roll angle of the vehicle in figure 6.10 is misleading regarding the 4-m offset
scenarios since the analysis was terminated prematurely in each of those cases as the
vehicle began to override the barrier.
In all cases involving the barrier offset at distances of 2.5 m or 4.0 m from the curb, the
curb caused the wheels of the truck to steer toward the guardrail as the vehicle traversed
the curb and resulted in the vehicle impacting the guardrail at a steeper than normal
angle, as shown in figure 6.9. Consequently, for any given curb-barrier case the impact
angle gets steeper as the offset distance increases. A steeper impact angle may increase
the severity of the impact by increasing the potential for failure of the barrier and by
increasing occupant risk factors.
6.4.3 Tensile Force in W-Beam
The tensile force-time history plots of the w-beam cross-section at two critical locations
(e.g., in the impact region of the guardrail and at the upstream anchor) as computed in the
finite element analyses are provided in Appendix 11. Table 6.6 provides a summary of
the maximum values of tensile force at those locations and the results are also illustrated
graphically in figures 6.12 - 6.18. The cases involving the modified C2500R pickup
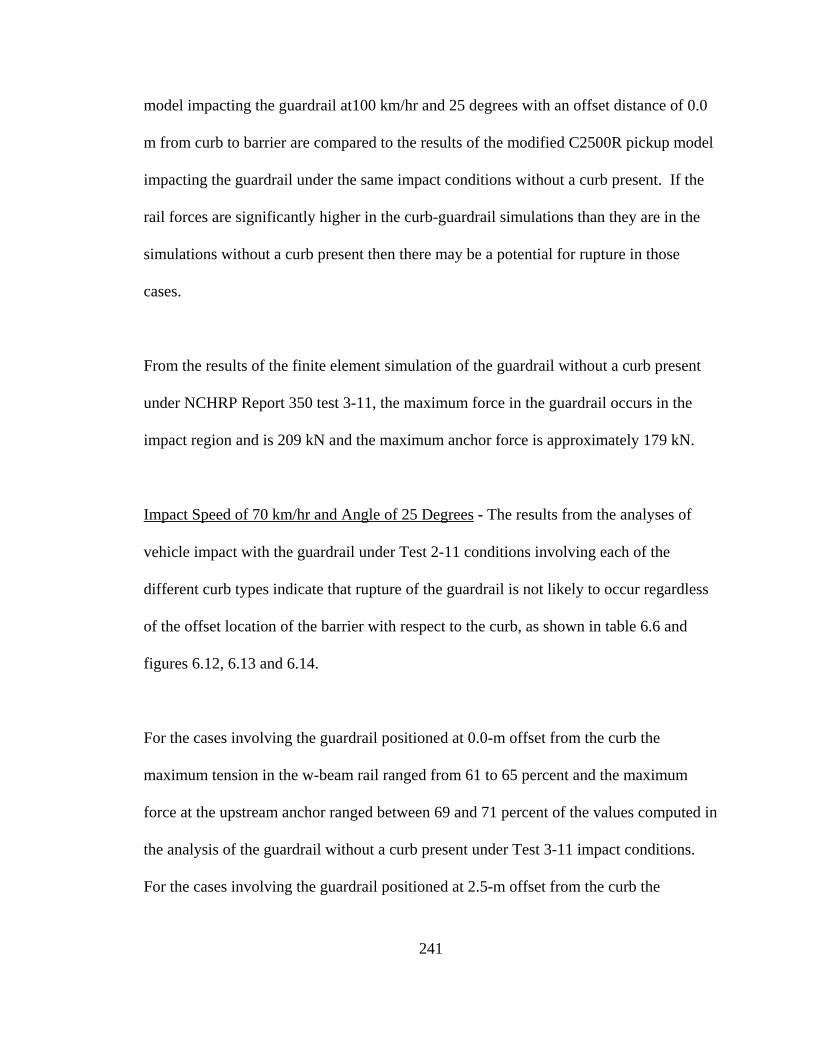
241
model impacting the guardrail at100 km/hr and 25 degrees with an offset distance of 0.0
m from curb to barrier are compared to the results of the modified C2500R pickup model
impacting the guardrail under the same impact conditions without a curb present. If the
rail forces are significantly higher in the curb-guardrail simulations than they are in the
simulations without a curb present then there may be a potential for rupture in those
cases.
From the results of the finite element simulation of the guardrail without a curb present
under NCHRP Report 350 test 3-11, the maximum force in the guardrail occurs in the
impact region and is 209 kN and the maximum anchor force is approximately 179 kN.
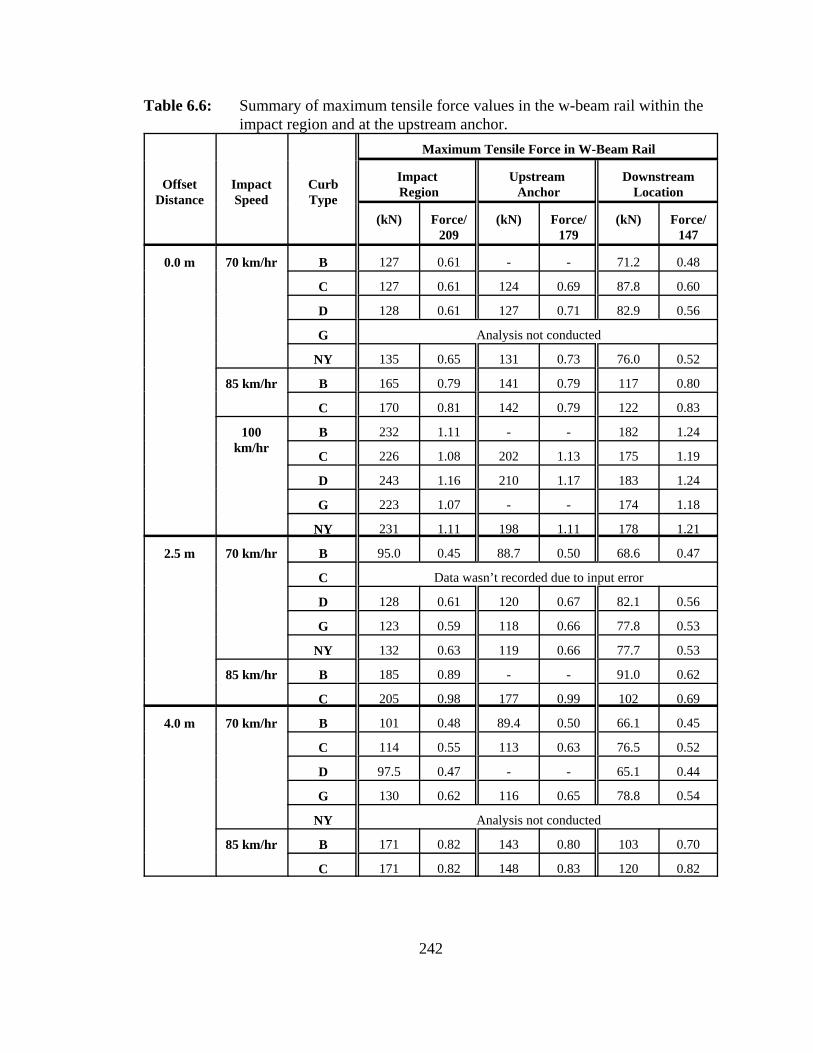
Impact Speed of 70 km/hr and Angle of 25 Degrees - The results from the analyses of
vehicle impact with the guardrail under Test 2-11 conditions involving each of the
different curb types indicate that rupture of the guardrail is not likely to occur regardless
of the offset location of the barrier with respect to the curb, as shown in table 6.6 and
figures 6.12, 6.13 and 6.14.
For the cases involving the guardrail positioned at 0.0-m offset from the curb the
maximum tension in the w-beam rail ranged from 61 to 65 percent and the maximum
force at the upstream anchor ranged between 69 and 71 percent of the values computed in
the analysis of the guardrail without a curb present under Test 3-11 impact conditions.
For the cases involving the guardrail positioned at 2.5-m offset from the curb the
242
Table 6.6: Summary of maximum tensile force values in the w-beam rail within theimpact region and at the upstream anchor.
OffsetDistance
ImpactSpeed
CurbType
Maximum Tensile Force in W-Beam Rail
Impact Region
Upstream Anchor
DownstreamLocation
(kN) Force/209
(kN) Force/179
(kN) Force/147
0.0 m 70 km/hr B 127 0.61 - - 71.2 0.48
C 127 0.61 124 0.69 87.8 0.60
D 128 0.61 127 0.71 82.9 0.56
G Analysis not conducted
NY 135 0.65 131 0.73 76.0 0.52
85 km/hr B 165 0.79 141 0.79 117 0.80
C 170 0.81 142 0.79 122 0.83
100km/hr
B 232 1.11 - - 182 1.24
C 226 1.08 202 1.13 175 1.19
D 243 1.16 210 1.17 183 1.24
G 223 1.07 - - 174 1.18
NY 231 1.11 198 1.11 178 1.21
2.5 m 70 km/hr B 95.0 0.45 88.7 0.50 68.6 0.47
C Data wasn’t recorded due to input error
D 128 0.61 120 0.67 82.1 0.56
G 123 0.59 118 0.66 77.8 0.53
NY 132 0.63 119 0.66 77.7 0.53
85 km/hr B 185 0.89 - - 91.0 0.62
C 205 0.98 177 0.99 102 0.69
4.0 m 70 km/hr B 101 0.48 89.4 0.50 66.1 0.45
C 114 0.55 113 0.63 76.5 0.52
D 97.5 0.47 - - 65.1 0.44
G 130 0.62 116 0.65 78.8 0.54
NY Analysis not conducted
85 km/hr B 171 0.82 143 0.80 103 0.70
C 171 0.82 148 0.83 120 0.82
243
Figure 6.13: Maximum w-beam rail force in impact region of guardrail and at theupstream anchor for the cases involving C2500 impact at 70 km/hr and25 degrees with curb at 2.5-m offset.(a) Maximum tensile force in w-beam and (b) Maximum tensile force in w-beam normalized wrt theforce in w-beam under NCHRP Report 350 Test 3-11 impact conditionswhen curb is not present.
Figure 6.12: Maximum w-beam rail force in impact region of guardrail and at theupstream anchor for the cases involving C2500 impact at 70 km/hrand 25 degrees with curb at 0-m offset.(a) Maximum tensile force inw-beam and (b) Maximum tensile force in w-beam normalized wrt theforce in w-beam under NCHRP Report 350 Test 3-11 impactconditions when curb is not present.
244
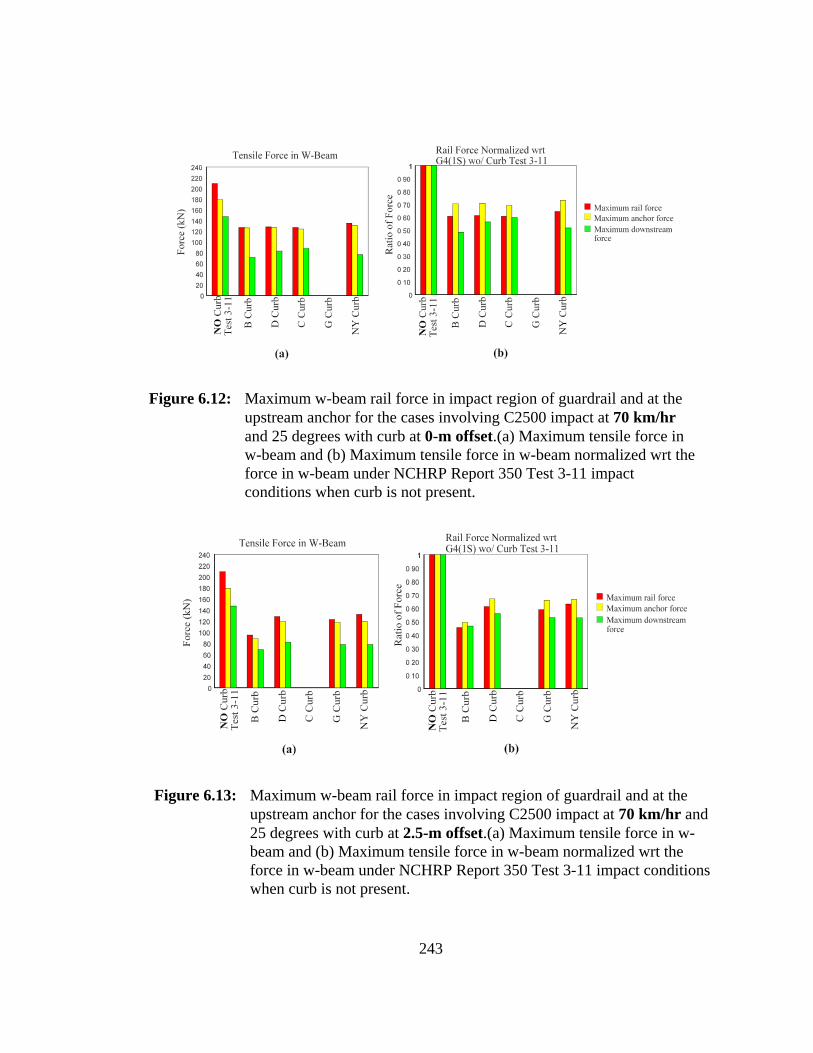
Figure 6.14: Maximum w-beam rail force in impact region of guardrail and at theupstream anchor for the cases involving C2500 impact at 85 km/hr and25 degrees with curb at 0.0-m offset.(a) Maximum tensile force in w-beam and (b) Maximum tensile force in w-beam normalized wrt the forcein w-beam under NCHRP Report 350 Test 3-11 impact conditions whencurb is not present.
Figure 6.15: Maximum w-beam rail force in impact region of guardrail and at theupstream anchor for the cases involving C2500 impact at 70 km/hr and25 degrees with curb at 4.0-m offset.(a) Maximum tensile force in w-beam and (b) Maximum tensile force in w-beam normalized wrt the forcein w-beam under NCHRP Report 350 Test 3-11 impact conditions whencurb is not present.
245
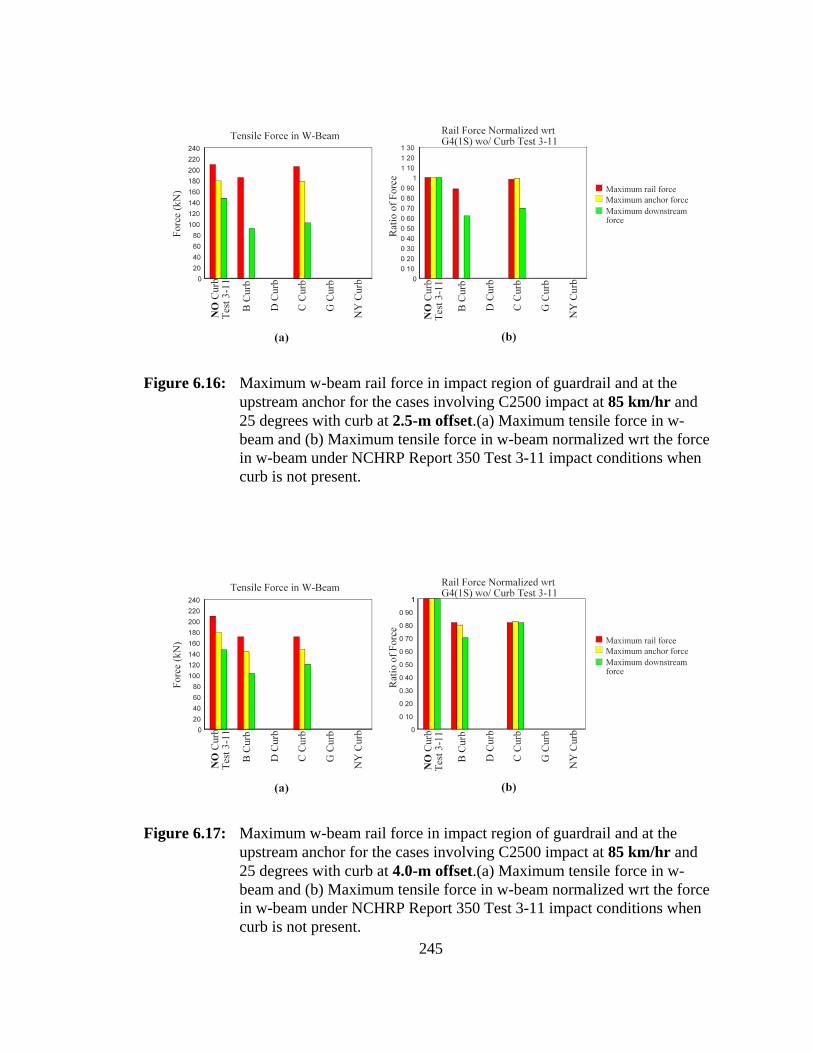
Figure 6.16: Maximum w-beam rail force in impact region of guardrail and at theupstream anchor for the cases involving C2500 impact at 85 km/hr and25 degrees with curb at 2.5-m offset.(a) Maximum tensile force in w-beam and (b) Maximum tensile force in w-beam normalized wrt the forcein w-beam under NCHRP Report 350 Test 3-11 impact conditions whencurb is not present.
Figure 6.17: Maximum w-beam rail force in impact region of guardrail and at theupstream anchor for the cases involving C2500 impact at 85 km/hr and25 degrees with curb at 4.0-m offset.(a) Maximum tensile force in w-beam and (b) Maximum tensile force in w-beam normalized wrt the forcein w-beam under NCHRP Report 350 Test 3-11 impact conditions whencurb is not present.
246
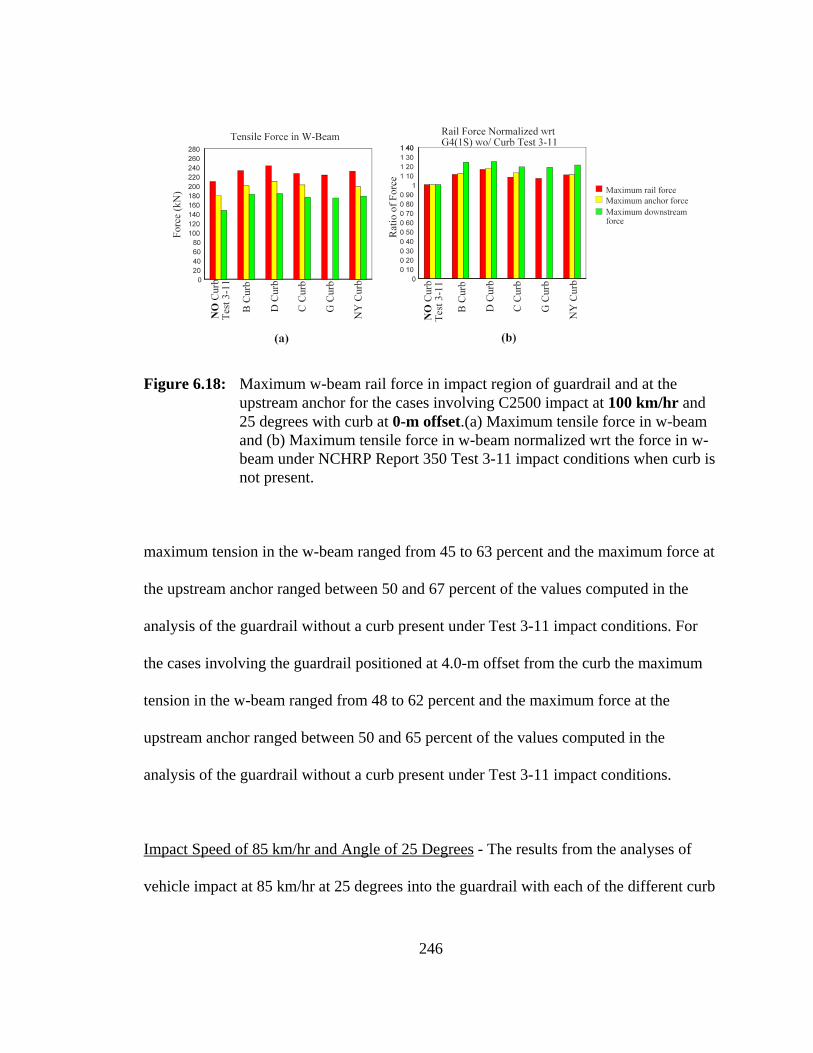
Figure 6.18: Maximum w-beam rail force in impact region of guardrail and at theupstream anchor for the cases involving C2500 impact at 100 km/hr and25 degrees with curb at 0-m offset.(a) Maximum tensile force in w-beamand (b) Maximum tensile force in w-beam normalized wrt the force in w-beam under NCHRP Report 350 Test 3-11 impact conditions when curb isnot present.
maximum tension in the w-beam ranged from 45 to 63 percent and the maximum force at
the upstream anchor ranged between 50 and 67 percent of the values computed in the
analysis of the guardrail without a curb present under Test 3-11 impact conditions. For
the cases involving the guardrail positioned at 4.0-m offset from the curb the maximum
tension in the w-beam ranged from 48 to 62 percent and the maximum force at the
upstream anchor ranged between 50 and 65 percent of the values computed in the
analysis of the guardrail without a curb present under Test 3-11 impact conditions.
Impact Speed of 85 km/hr and Angle of 25 Degrees - The results from the analyses of
vehicle impact at 85 km/hr at 25 degrees into the guardrail with each of the different curb
247
types indicate that rupture of the guardrail is not likely to occur for offset distances of 0
m and 4 m, as shown in table 6.6 and figures 6.15, 6.16 and 6.17. In the cases in which
the guardrail is placed 2.5 m behind the curb the tension in the rail reaches magnitudes
that may be considered critical, however, in those cases there was also bumper override.
For the cases involving the guardrail positioned at 0.0-m offset from the curb the
maximum tension in the w-beam rail ranged from 79 to 81 percent and the maximum
force at the upstream anchor was 79 percent of the values computed in the analysis of the
guardrail without a curb present under Test 3-11 impact conditions. For the cases
involving the guardrail positioned at 2.5-m offset from the curb the maximum tension in
the w-beam ranged from 89 to 98 percent of the values computed in the analysis of the
guardrail without a curb present under Test 3-11 impact conditions. For the cases
involving the guardrail positioned at 4.0-m offset from the curb the maximum tension in
the w-beam was 82 percent and the maximum force at the upstream anchor ranged
between 80 and 83 percent of the values computed in the analysis of the guardrail
without a curb present under Test 3-11 impact conditions.
Impact Speed of 100 km/hr and Angle of 25 Degrees - The analyses of vehicle impact
with the guardrail under Test 3-11 conditions involving each of the different curb types
located at 0-m offset (i.e., under the w-beam rail) resulted in significantly higher forces in
the rail and anchor compared to the case of the guardrail without a curb present, as shown
in table 6.6 and figure 6.18. In all cases, however, there appears to be a potential for
248
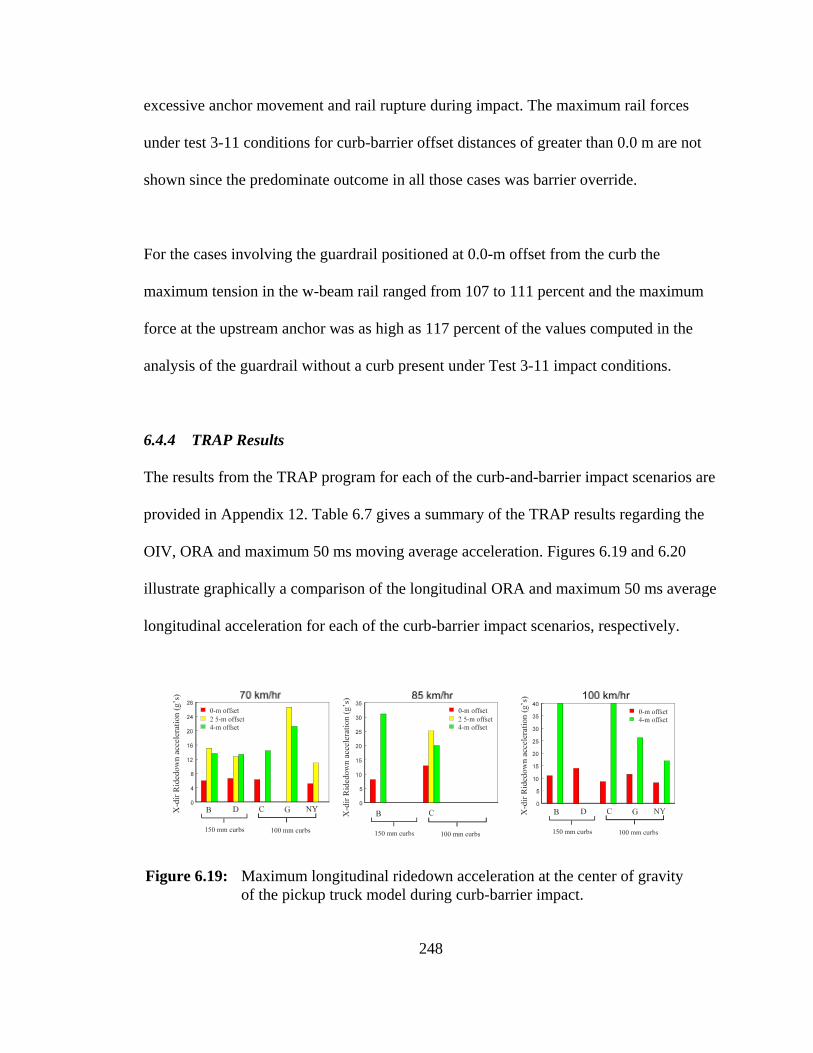
Figure 6.19: Maximum longitudinal ridedown acceleration at the center of gravityof the pickup truck model during curb-barrier impact.
excessive anchor movement and rail rupture during impact. The maximum rail forces
under test 3-11 conditions for curb-barrier offset distances of greater than 0.0 m are not
shown since the predominate outcome in all those cases was barrier override.
For the cases involving the guardrail positioned at 0.0-m offset from the curb the
maximum tension in the w-beam rail ranged from 107 to 111 percent and the maximum
force at the upstream anchor was as high as 117 percent of the values computed in the
analysis of the guardrail without a curb present under Test 3-11 impact conditions.
6.4.4 TRAP Results
The results from the TRAP program for each of the curb-and-barrier impact scenarios are
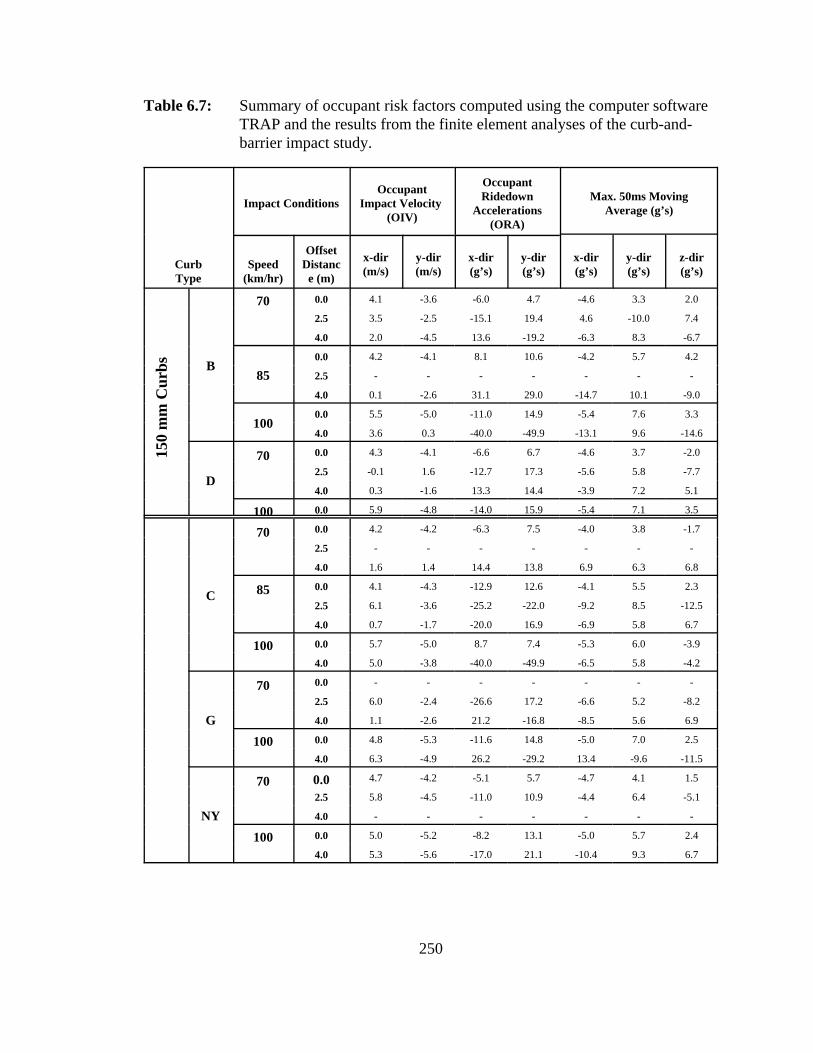
provided in Appendix 12. Table 6.7 gives a summary of the TRAP results regarding the
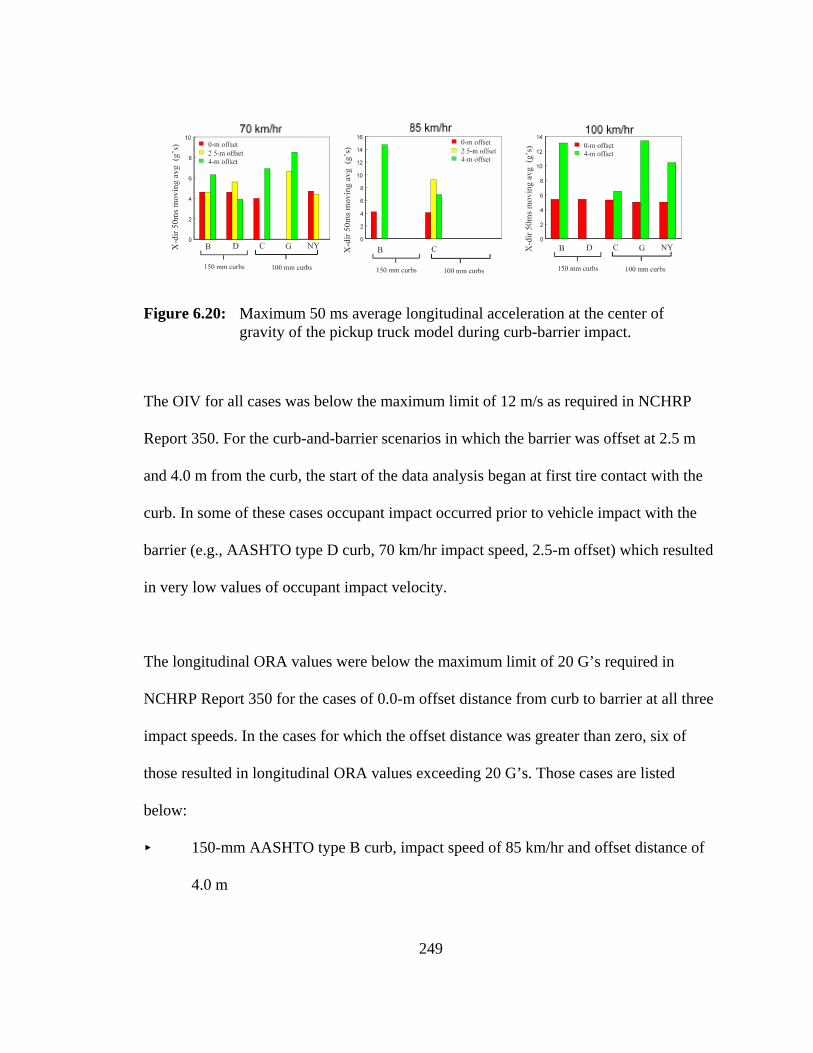
OIV, ORA and maximum 50 ms moving average acceleration. Figures 6.19 and 6.20
illustrate graphically a comparison of the longitudinal ORA and maximum 50 ms average
longitudinal acceleration for each of the curb-barrier impact scenarios, respectively.
249
Figure 6.20: Maximum 50 ms average longitudinal acceleration at the center ofgravity of the pickup truck model during curb-barrier impact.
The OIV for all cases was below the maximum limit of 12 m/s as required in NCHRP
Report 350. For the curb-and-barrier scenarios in which the barrier was offset at 2.5 m
and 4.0 m from the curb, the start of the data analysis began at first tire contact with the
curb. In some of these cases occupant impact occurred prior to vehicle impact with the
barrier (e.g., AASHTO type D curb, 70 km/hr impact speed, 2.5-m offset) which resulted
in very low values of occupant impact velocity.
The longitudinal ORA values were below the maximum limit of 20 G’s required in
NCHRP Report 350 for the cases of 0.0-m offset distance from curb to barrier at all three
impact speeds. In the cases for which the offset distance was greater than zero, six of
those resulted in longitudinal ORA values exceeding 20 G’s. Those cases are listed
below:
< 150-mm AASHTO type B curb, impact speed of 85 km/hr and offset distance of
4.0 m
250
Table 6.7: Summary of occupant risk factors computed using the computer softwareTRAP and the results from the finite element analyses of the curb-and-barrier impact study.
CurbType
Impact ConditionsOccupant
Impact Velocity (OIV)
OccupantRidedown
Accelerations(ORA)
Max. 50ms MovingAverage (g’s)
Speed(km/hr)
OffsetDistanc
e (m)
x-dir(m/s)
y-dir(m/s)
x-dir(g’s)
y-dir(g’s)
x-dir(g’s)
y-dir(g’s)
z-dir(g’s)
150
mm
Cur
bs B
70 0.0 4.1 -3.6 -6.0 4.7 -4.6 3.3 2.0
2.5 3.5 -2.5 -15.1 19.4 4.6 -10.0 7.4
4.0 2.0 -4.5 13.6 -19.2 -6.3 8.3 -6.7
850.0 4.2 -4.1 8.1 10.6 -4.2 5.7 4.2
2.5 - - - - - - -
4.0 0.1 -2.6 31.1 29.0 -14.7 10.1 -9.0
1000.0 5.5 -5.0 -11.0 14.9 -5.4 7.6 3.3
4.0 3.6 0.3 -40.0 -49.9 -13.1 9.6 -14.6
D
70 0.0 4.3 -4.1 -6.6 6.7 -4.6 3.7 -2.0
2.5 -0.1 1.6 -12.7 17.3 -5.6 5.8 -7.7
4.0 0.3 -1.6 13.3 14.4 -3.9 7.2 5.1
100 0.0 5.9 -4.8 -14.0 15.9 -5.4 7.1 3.5
C
70 0.0 4.2 -4.2 -6.3 7.5 -4.0 3.8 -1.7
2.5 - - - - - - -
4.0 1.6 1.4 14.4 13.8 6.9 6.3 6.8
85 0.0 4.1 -4.3 -12.9 12.6 -4.1 5.5 2.3
2.5 6.1 -3.6 -25.2 -22.0 -9.2 8.5 -12.5
4.0 0.7 -1.7 -20.0 16.9 -6.9 5.8 6.7
100 0.0 5.7 -5.0 8.7 7.4 -5.3 6.0 -3.9
4.0 5.0 -3.8 -40.0 -49.9 -6.5 5.8 -4.2
G
70 0.0 - - - - - - -
2.5 6.0 -2.4 -26.6 17.2 -6.6 5.2 -8.2
4.0 1.1 -2.6 21.2 -16.8 -8.5 5.6 6.9
100 0.0 4.8 -5.3 -11.6 14.8 -5.0 7.0 2.5
4.0 6.3 -4.9 26.2 -29.2 13.4 -9.6 -11.5
NY
70 0.0 4.7 -4.2 -5.1 5.7 -4.7 4.1 1.5
2.5 5.8 -4.5 -11.0 10.9 -4.4 6.4 -5.1
4.0 - - - - - - -
100 0.0 5.0 -5.2 -8.2 13.1 -5.0 5.7 2.4
4.0 5.3 -5.6 -17.0 21.1 -10.4 9.3 6.7
251
< 100-mm AASHTO type C curb, impact speed of 85 km/hr and offset distance of
2.5 m
< 100-mm AASHTO type C curb, impact speed of 100 km/hr and offset distance of
4.0 m
< 100-mm AASHTO type G curb, impact speed of 70 km/hr and offset distance of
2.5 m
< 100-mm AASHTO type G curb, impact speed of 70 km/hr and offset distance of
4.0 m
< 100-mm AASHTO type G curb, impact speed of 100 km/hr and offset distance of
4.0 m
6.5 Summary
The finite element program LS-DYNA was used in the analysis of various curb-and-
barrier systems subjected to impact by a 2000 kg pickup truck. The study involved the
modified G4(1S) guardrail model that was validated in Chapter 4 installed inconjunction
with two 150-mm curbs (i.e., AASHTO types B and D) and three 100-mm curbs (i.e.,
AASHTO types C and G and the 100-mm New York Curb).
The backfill terrain and the roadway terrain in the computer model simulations had a zero
slope and the guardrail was positioned at either 0.0 m, 2.5 m or 4.0 m offset from the
curbs. Three different impact conditions were considered:
252
1) 100 km/hr and 25 degrees (i.e., NCHRP Report 350 Test 3-11),
2) 85 km/hr and 25 degrees and
3) 70 km/hr and 25 degrees (i.e., NCHRP Report 350 Test 2-11) .
The data collected in the analyses included sequential snapshots of the impact event,
acceleration-time histories, yaw-, pitch- and roll-time histories, w-beam tensile force-
time histories and occupant risk information using the Test Risk Assessment Program.
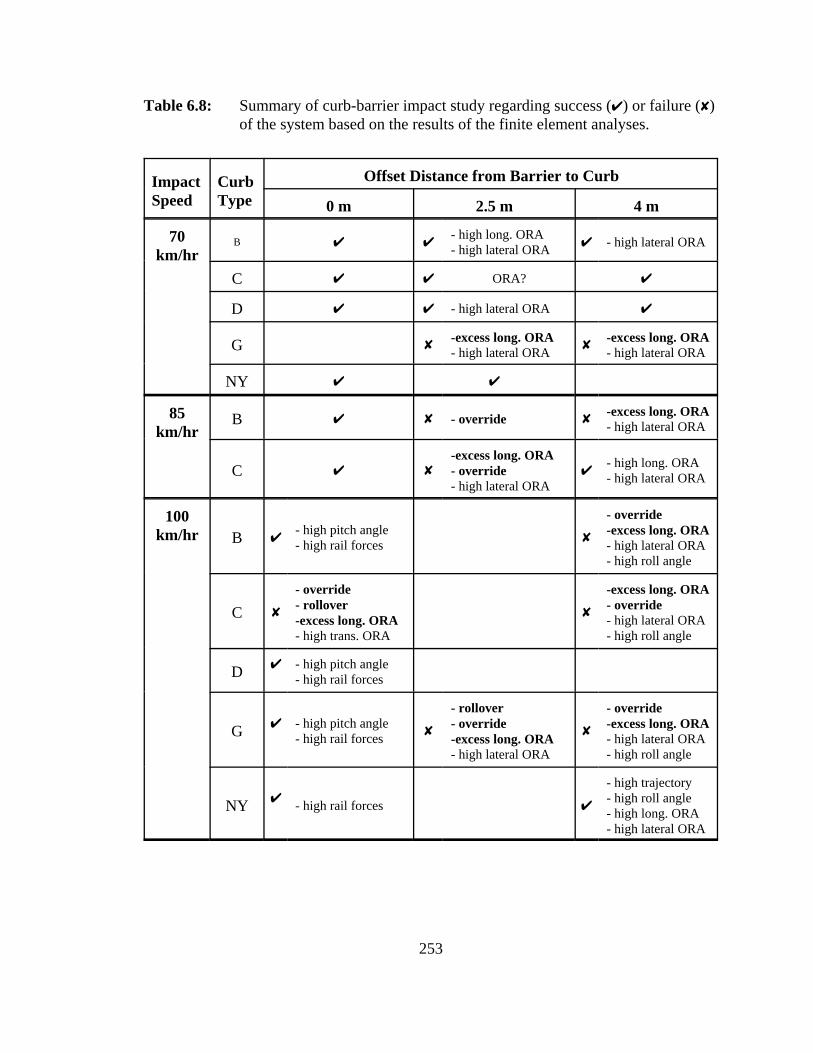
Table 6.8 provides a summary of the results of the curb-and-barrier impact study
regarding success or failure of the system in each case based on the information obtained
from the analyses and figures 6.21 - 6.49 provide a summary of general information
regarding each curb-and-barrier impact simulation.
253
Table 6.8: Summary of curb-barrier impact study regarding success (U) or failure (Y)of the system based on the results of the finite element analyses.
ImpactSpeed
CurbType
Offset Distance from Barrier to Curb
0 m 2.5 m 4 m
70km/hr
B U U- high long. ORA- high lateral ORA U - high lateral ORA
C U U ORA? U
D U U - high lateral ORA U
G Y-excess long. ORA- high lateral ORA Y
-excess long. ORA- high lateral ORA
NY U U
85km/hr
B U Y - override Y-excess long. ORA- high lateral ORA
C U Y-excess long. ORA- override- high lateral ORA
U- high long. ORA- high lateral ORA
100km/hr B U
- high pitch angle- high rail forces Y
- override-excess long. ORA- high lateral ORA- high roll angle
C Y
- override- rollover-excess long. ORA- high trans. ORA
Y
-excess long. ORA- override- high lateral ORA- high roll angle
D U - high pitch angle- high rail forces
G U - high pitch angle- high rail forces Y
- rollover - override-excess long. ORA- high lateral ORA
Y
- override-excess long. ORA- high lateral ORA- high roll angle
NY U - high rail forces U
- high trajectory- high roll angle- high long. ORA- high lateral ORA
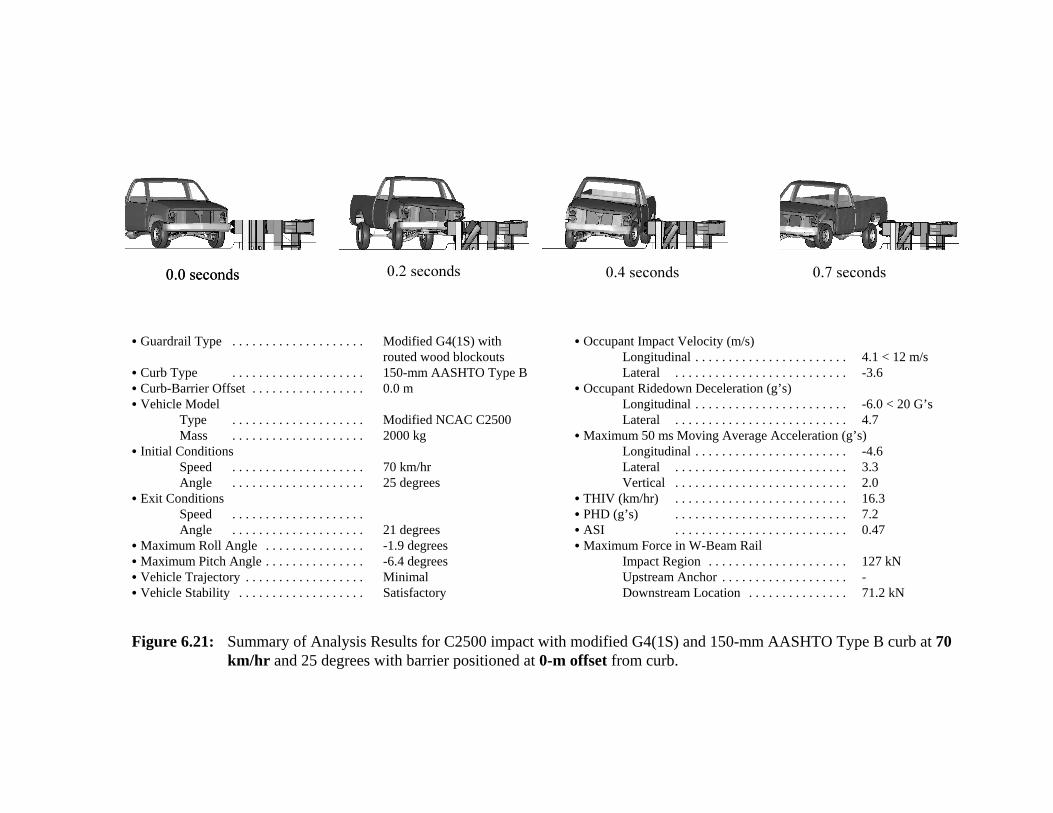
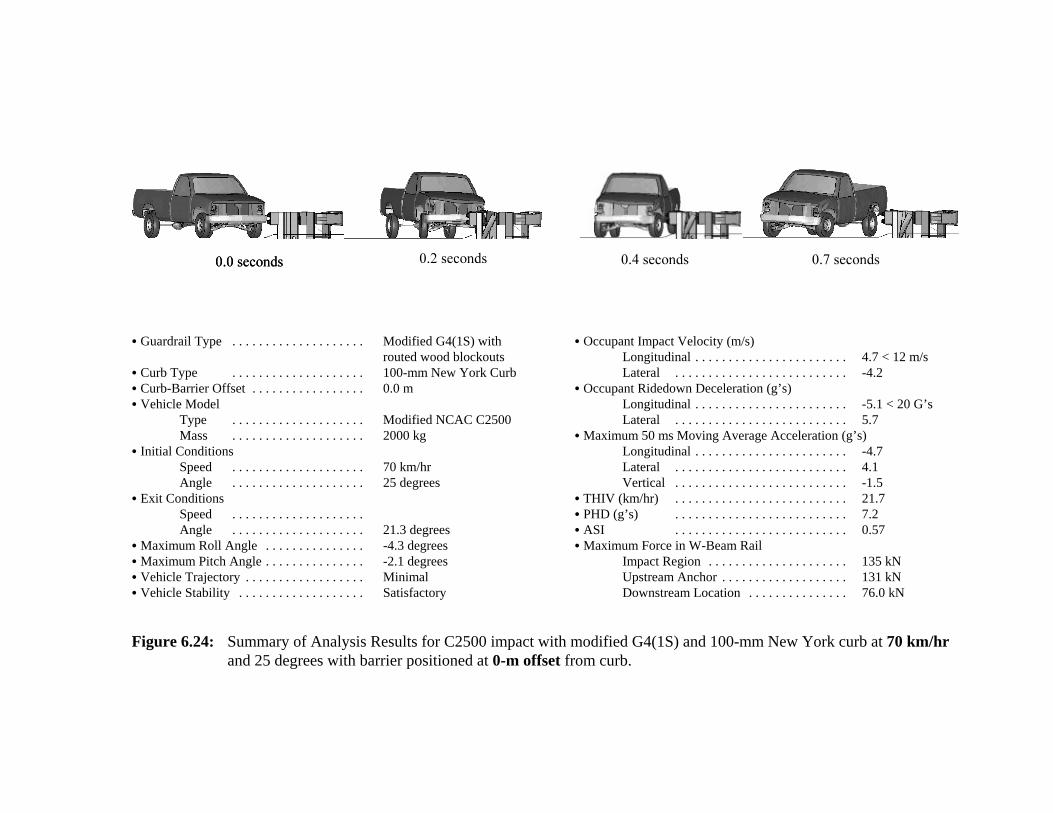
C Guardrail Type . . . . . . . . . . . . . . . . . . . . Modified G4(1S) withrouted wood blockouts
C Curb Type . . . . . . . . . . . . . . . . . . . . 150-mm AASHTO Type BC Curb-Barrier Offset . . . . . . . . . . . . . . . . . 0.0 mC Vehicle Model
Type . . . . . . . . . . . . . . . . . . . . Modified NCAC C2500Mass . . . . . . . . . . . . . . . . . . . . 2000 kg
C Initial ConditionsSpeed . . . . . . . . . . . . . . . . . . . . 70 km/hrAngle . . . . . . . . . . . . . . . . . . . . 25 degrees
C Exit Conditions Speed . . . . . . . . . . . . . . . . . . . .Angle . . . . . . . . . . . . . . . . . . . . 21 degrees
C Maximum Roll Angle . . . . . . . . . . . . . . . -1.9 degreesC Maximum Pitch Angle . . . . . . . . . . . . . . . -6.4 degreesC Vehicle Trajectory . . . . . . . . . . . . . . . . . . MinimalC Vehicle Stability . . . . . . . . . . . . . . . . . . . Satisfactory
C Occupant Impact Velocity (m/s)Longitudinal . . . . . . . . . . . . . . . . . . . . . . . 4.1 < 12 m/sLateral . . . . . . . . . . . . . . . . . . . . . . . . . . -3.6
C Occupant Ridedown Deceleration (g’s)Longitudinal . . . . . . . . . . . . . . . . . . . . . . . -6.0 < 20 G’sLateral . . . . . . . . . . . . . . . . . . . . . . . . . . 4.7
C Maximum 50 ms Moving Average Acceleration (g’s)Longitudinal . . . . . . . . . . . . . . . . . . . . . . . -4.6Lateral . . . . . . . . . . . . . . . . . . . . . . . . . . 3.3Vertical . . . . . . . . . . . . . . . . . . . . . . . . . . 2.0
C THIV (km/hr) . . . . . . . . . . . . . . . . . . . . . . . . . . 16.3C PHD (g’s) . . . . . . . . . . . . . . . . . . . . . . . . . . 7.2C ASI . . . . . . . . . . . . . . . . . . . . . . . . . . 0.47C Maximum Force in W-Beam Rail
Impact Region . . . . . . . . . . . . . . . . . . . . . 127 kNUpstream Anchor . . . . . . . . . . . . . . . . . . . -Downstream Location . . . . . . . . . . . . . . . 71.2 kN
Figure 6.21: Summary of Analysis Results for C2500 impact with modified G4(1S) and 150-mm AASHTO Type B curb at 70km/hr and 25 degrees with barrier positioned at 0-m offset from curb.
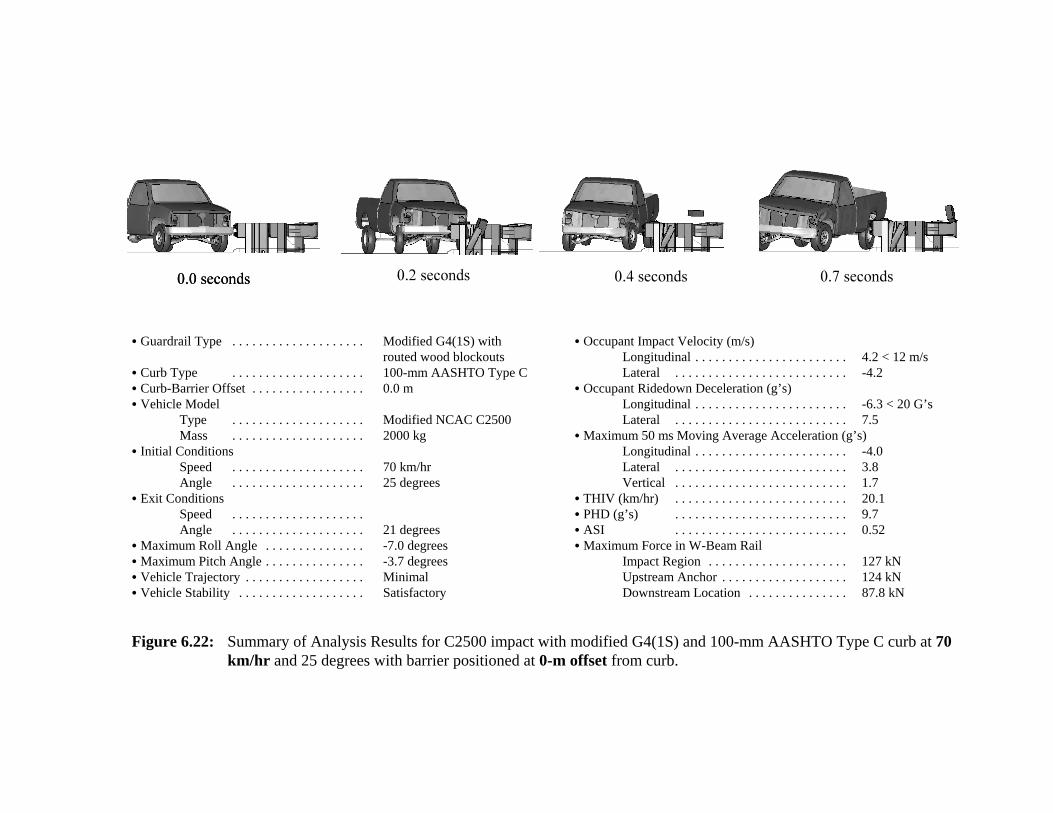
C Guardrail Type . . . . . . . . . . . . . . . . . . . . Modified G4(1S) withrouted wood blockouts
C Curb Type . . . . . . . . . . . . . . . . . . . . 100-mm AASHTO Type CC Curb-Barrier Offset . . . . . . . . . . . . . . . . . 0.0 mC Vehicle Model
Type . . . . . . . . . . . . . . . . . . . . Modified NCAC C2500Mass . . . . . . . . . . . . . . . . . . . . 2000 kg
C Initial ConditionsSpeed . . . . . . . . . . . . . . . . . . . . 70 km/hrAngle . . . . . . . . . . . . . . . . . . . . 25 degrees
C Exit Conditions Speed . . . . . . . . . . . . . . . . . . . .Angle . . . . . . . . . . . . . . . . . . . . 21 degrees
C Maximum Roll Angle . . . . . . . . . . . . . . . -7.0 degreesC Maximum Pitch Angle . . . . . . . . . . . . . . . -3.7 degreesC Vehicle Trajectory . . . . . . . . . . . . . . . . . . MinimalC Vehicle Stability . . . . . . . . . . . . . . . . . . . Satisfactory
C Occupant Impact Velocity (m/s)Longitudinal . . . . . . . . . . . . . . . . . . . . . . . 4.2 < 12 m/sLateral . . . . . . . . . . . . . . . . . . . . . . . . . . -4.2
C Occupant Ridedown Deceleration (g’s)Longitudinal . . . . . . . . . . . . . . . . . . . . . . . -6.3 < 20 G’sLateral . . . . . . . . . . . . . . . . . . . . . . . . . . 7.5
C Maximum 50 ms Moving Average Acceleration (g’s)Longitudinal . . . . . . . . . . . . . . . . . . . . . . . -4.0Lateral . . . . . . . . . . . . . . . . . . . . . . . . . . 3.8Vertical . . . . . . . . . . . . . . . . . . . . . . . . . . 1.7
C THIV (km/hr) . . . . . . . . . . . . . . . . . . . . . . . . . . 20.1C PHD (g’s) . . . . . . . . . . . . . . . . . . . . . . . . . . 9.7C ASI . . . . . . . . . . . . . . . . . . . . . . . . . . 0.52C Maximum Force in W-Beam Rail
Impact Region . . . . . . . . . . . . . . . . . . . . . 127 kNUpstream Anchor . . . . . . . . . . . . . . . . . . . 124 kNDownstream Location . . . . . . . . . . . . . . . 87.8 kN
Figure 6.22: Summary of Analysis Results for C2500 impact with modified G4(1S) and 100-mm AASHTO Type C curb at 70km/hr and 25 degrees with barrier positioned at 0-m offset from curb.
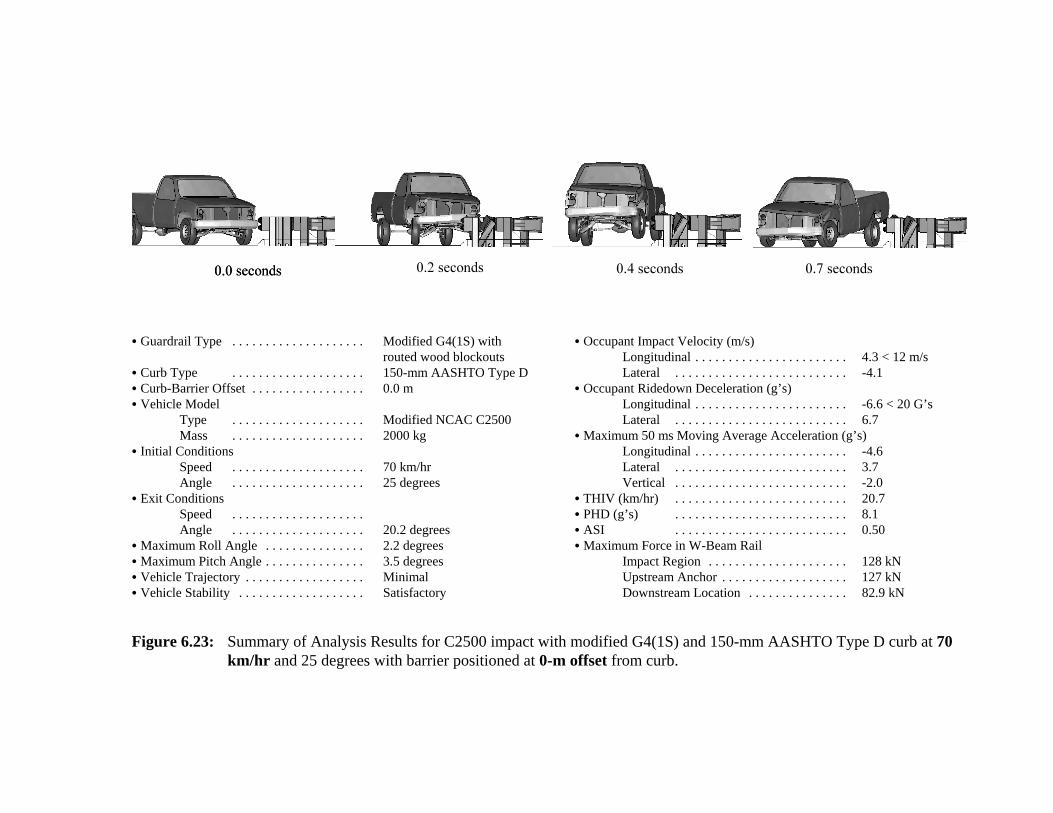
C Guardrail Type . . . . . . . . . . . . . . . . . . . . Modified G4(1S) withrouted wood blockouts
C Curb Type . . . . . . . . . . . . . . . . . . . . 150-mm AASHTO Type DC Curb-Barrier Offset . . . . . . . . . . . . . . . . . 0.0 mC Vehicle Model
Type . . . . . . . . . . . . . . . . . . . . Modified NCAC C2500Mass . . . . . . . . . . . . . . . . . . . . 2000 kg
C Initial ConditionsSpeed . . . . . . . . . . . . . . . . . . . . 70 km/hrAngle . . . . . . . . . . . . . . . . . . . . 25 degrees
C Exit Conditions Speed . . . . . . . . . . . . . . . . . . . .Angle . . . . . . . . . . . . . . . . . . . . 20.2 degrees
C Maximum Roll Angle . . . . . . . . . . . . . . . 2.2 degreesC Maximum Pitch Angle . . . . . . . . . . . . . . . 3.5 degreesC Vehicle Trajectory . . . . . . . . . . . . . . . . . . MinimalC Vehicle Stability . . . . . . . . . . . . . . . . . . . Satisfactory
C Occupant Impact Velocity (m/s)Longitudinal . . . . . . . . . . . . . . . . . . . . . . . 4.3 < 12 m/sLateral . . . . . . . . . . . . . . . . . . . . . . . . . . -4.1
C Occupant Ridedown Deceleration (g’s)Longitudinal . . . . . . . . . . . . . . . . . . . . . . . -6.6 < 20 G’sLateral . . . . . . . . . . . . . . . . . . . . . . . . . . 6.7
C Maximum 50 ms Moving Average Acceleration (g’s)Longitudinal . . . . . . . . . . . . . . . . . . . . . . . -4.6Lateral . . . . . . . . . . . . . . . . . . . . . . . . . . 3.7Vertical . . . . . . . . . . . . . . . . . . . . . . . . . . -2.0
C THIV (km/hr) . . . . . . . . . . . . . . . . . . . . . . . . . . 20.7C PHD (g’s) . . . . . . . . . . . . . . . . . . . . . . . . . . 8.1C ASI . . . . . . . . . . . . . . . . . . . . . . . . . . 0.50C Maximum Force in W-Beam Rail
Impact Region . . . . . . . . . . . . . . . . . . . . . 128 kNUpstream Anchor . . . . . . . . . . . . . . . . . . . 127 kNDownstream Location . . . . . . . . . . . . . . . 82.9 kN
Figure 6.23: Summary of Analysis Results for C2500 impact with modified G4(1S) and 150-mm AASHTO Type D curb at 70km/hr and 25 degrees with barrier positioned at 0-m offset from curb.
C Guardrail Type . . . . . . . . . . . . . . . . . . . . Modified G4(1S) withrouted wood blockouts
C Curb Type . . . . . . . . . . . . . . . . . . . . 100-mm New York CurbC Curb-Barrier Offset . . . . . . . . . . . . . . . . . 0.0 mC Vehicle Model
Type . . . . . . . . . . . . . . . . . . . . Modified NCAC C2500Mass . . . . . . . . . . . . . . . . . . . . 2000 kg
C Initial ConditionsSpeed . . . . . . . . . . . . . . . . . . . . 70 km/hrAngle . . . . . . . . . . . . . . . . . . . . 25 degrees
C Exit Conditions Speed . . . . . . . . . . . . . . . . . . . .Angle . . . . . . . . . . . . . . . . . . . . 21.3 degrees
C Maximum Roll Angle . . . . . . . . . . . . . . . -4.3 degreesC Maximum Pitch Angle . . . . . . . . . . . . . . . -2.1 degreesC Vehicle Trajectory . . . . . . . . . . . . . . . . . . MinimalC Vehicle Stability . . . . . . . . . . . . . . . . . . . Satisfactory
C Occupant Impact Velocity (m/s)Longitudinal . . . . . . . . . . . . . . . . . . . . . . . 4.7 < 12 m/sLateral . . . . . . . . . . . . . . . . . . . . . . . . . . -4.2
C Occupant Ridedown Deceleration (g’s)Longitudinal . . . . . . . . . . . . . . . . . . . . . . . -5.1 < 20 G’sLateral . . . . . . . . . . . . . . . . . . . . . . . . . . 5.7
C Maximum 50 ms Moving Average Acceleration (g’s)Longitudinal . . . . . . . . . . . . . . . . . . . . . . . -4.7Lateral . . . . . . . . . . . . . . . . . . . . . . . . . . 4.1Vertical . . . . . . . . . . . . . . . . . . . . . . . . . . -1.5
C THIV (km/hr) . . . . . . . . . . . . . . . . . . . . . . . . . . 21.7C PHD (g’s) . . . . . . . . . . . . . . . . . . . . . . . . . . 7.2C ASI . . . . . . . . . . . . . . . . . . . . . . . . . . 0.57C Maximum Force in W-Beam Rail
Impact Region . . . . . . . . . . . . . . . . . . . . . 135 kNUpstream Anchor . . . . . . . . . . . . . . . . . . . 131 kNDownstream Location . . . . . . . . . . . . . . . 76.0 kN
Figure 6.24: Summary of Analysis Results for C2500 impact with modified G4(1S) and 100-mm New York curb at 70 km/hrand 25 degrees with barrier positioned at 0-m offset from curb.
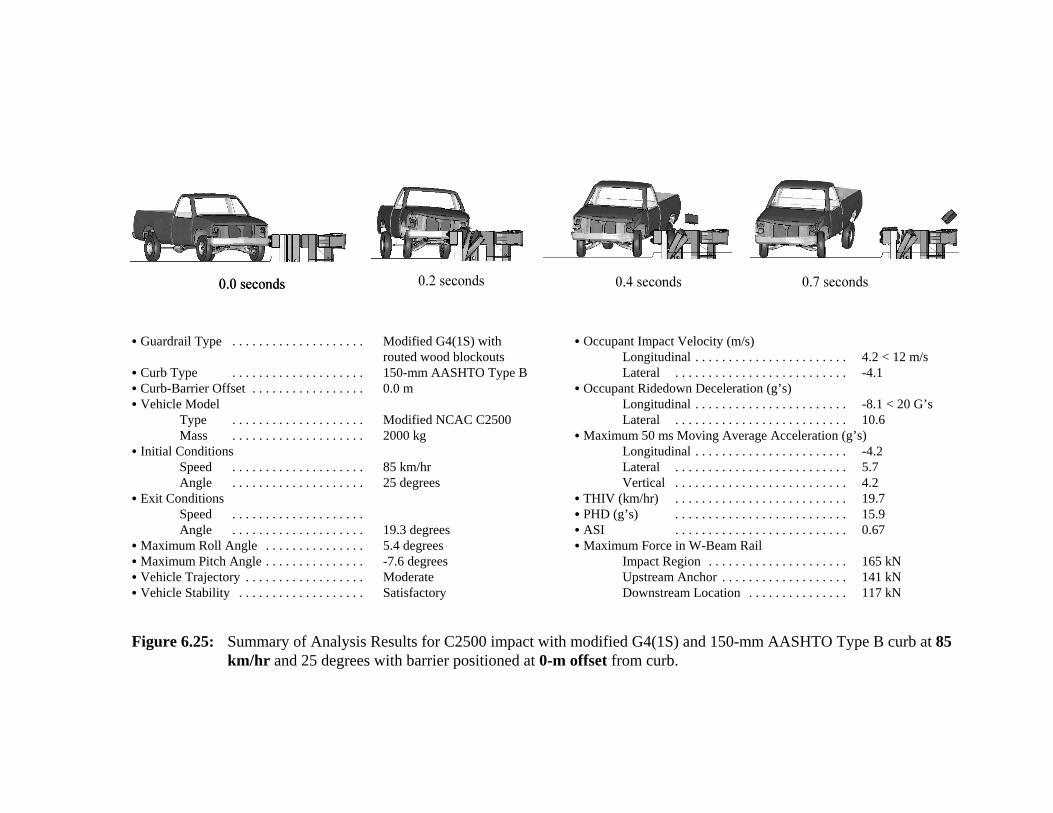
C Guardrail Type . . . . . . . . . . . . . . . . . . . . Modified G4(1S) withrouted wood blockouts
C Curb Type . . . . . . . . . . . . . . . . . . . . 150-mm AASHTO Type BC Curb-Barrier Offset . . . . . . . . . . . . . . . . . 0.0 mC Vehicle Model
Type . . . . . . . . . . . . . . . . . . . . Modified NCAC C2500Mass . . . . . . . . . . . . . . . . . . . . 2000 kg
C Initial ConditionsSpeed . . . . . . . . . . . . . . . . . . . . 85 km/hrAngle . . . . . . . . . . . . . . . . . . . . 25 degrees
C Exit Conditions Speed . . . . . . . . . . . . . . . . . . . .Angle . . . . . . . . . . . . . . . . . . . . 19.3 degrees
C Maximum Roll Angle . . . . . . . . . . . . . . . 5.4 degreesC Maximum Pitch Angle . . . . . . . . . . . . . . . -7.6 degreesC Vehicle Trajectory . . . . . . . . . . . . . . . . . . ModerateC Vehicle Stability . . . . . . . . . . . . . . . . . . . Satisfactory
C Occupant Impact Velocity (m/s)Longitudinal . . . . . . . . . . . . . . . . . . . . . . . 4.2 < 12 m/sLateral . . . . . . . . . . . . . . . . . . . . . . . . . . -4.1
C Occupant Ridedown Deceleration (g’s)Longitudinal . . . . . . . . . . . . . . . . . . . . . . . -8.1 < 20 G’sLateral . . . . . . . . . . . . . . . . . . . . . . . . . . 10.6
C Maximum 50 ms Moving Average Acceleration (g’s)Longitudinal . . . . . . . . . . . . . . . . . . . . . . . -4.2Lateral . . . . . . . . . . . . . . . . . . . . . . . . . . 5.7Vertical . . . . . . . . . . . . . . . . . . . . . . . . . . 4.2
C THIV (km/hr) . . . . . . . . . . . . . . . . . . . . . . . . . . 19.7C PHD (g’s) . . . . . . . . . . . . . . . . . . . . . . . . . . 15.9C ASI . . . . . . . . . . . . . . . . . . . . . . . . . . 0.67C Maximum Force in W-Beam Rail
Impact Region . . . . . . . . . . . . . . . . . . . . . 165 kNUpstream Anchor . . . . . . . . . . . . . . . . . . . 141 kNDownstream Location . . . . . . . . . . . . . . . 117 kN
Figure 6.25: Summary of Analysis Results for C2500 impact with modified G4(1S) and 150-mm AASHTO Type B curb at 85km/hr and 25 degrees with barrier positioned at 0-m offset from curb.
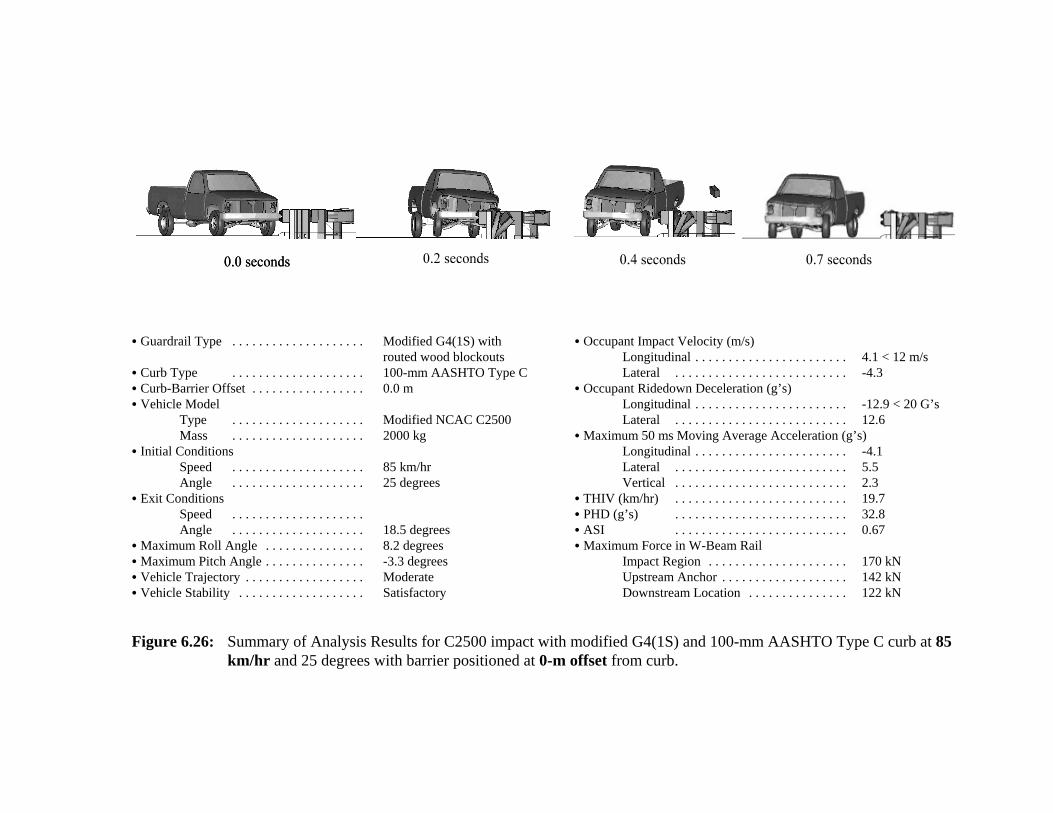
C Guardrail Type . . . . . . . . . . . . . . . . . . . . Modified G4(1S) withrouted wood blockouts
C Curb Type . . . . . . . . . . . . . . . . . . . . 100-mm AASHTO Type CC Curb-Barrier Offset . . . . . . . . . . . . . . . . . 0.0 mC Vehicle Model
Type . . . . . . . . . . . . . . . . . . . . Modified NCAC C2500Mass . . . . . . . . . . . . . . . . . . . . 2000 kg
C Initial ConditionsSpeed . . . . . . . . . . . . . . . . . . . . 85 km/hrAngle . . . . . . . . . . . . . . . . . . . . 25 degrees
C Exit Conditions Speed . . . . . . . . . . . . . . . . . . . .Angle . . . . . . . . . . . . . . . . . . . . 18.5 degrees
C Maximum Roll Angle . . . . . . . . . . . . . . . 8.2 degreesC Maximum Pitch Angle . . . . . . . . . . . . . . . -3.3 degreesC Vehicle Trajectory . . . . . . . . . . . . . . . . . . ModerateC Vehicle Stability . . . . . . . . . . . . . . . . . . . Satisfactory
C Occupant Impact Velocity (m/s)Longitudinal . . . . . . . . . . . . . . . . . . . . . . . 4.1 < 12 m/sLateral . . . . . . . . . . . . . . . . . . . . . . . . . . -4.3
C Occupant Ridedown Deceleration (g’s)Longitudinal . . . . . . . . . . . . . . . . . . . . . . . -12.9 < 20 G’sLateral . . . . . . . . . . . . . . . . . . . . . . . . . . 12.6
C Maximum 50 ms Moving Average Acceleration (g’s)Longitudinal . . . . . . . . . . . . . . . . . . . . . . . -4.1Lateral . . . . . . . . . . . . . . . . . . . . . . . . . . 5.5Vertical . . . . . . . . . . . . . . . . . . . . . . . . . . 2.3
C THIV (km/hr) . . . . . . . . . . . . . . . . . . . . . . . . . . 19.7C PHD (g’s) . . . . . . . . . . . . . . . . . . . . . . . . . . 32.8C ASI . . . . . . . . . . . . . . . . . . . . . . . . . . 0.67C Maximum Force in W-Beam Rail
Impact Region . . . . . . . . . . . . . . . . . . . . . 170 kNUpstream Anchor . . . . . . . . . . . . . . . . . . . 142 kNDownstream Location . . . . . . . . . . . . . . . 122 kN
Figure 6.26: Summary of Analysis Results for C2500 impact with modified G4(1S) and 100-mm AASHTO Type C curb at 85km/hr and 25 degrees with barrier positioned at 0-m offset from curb.
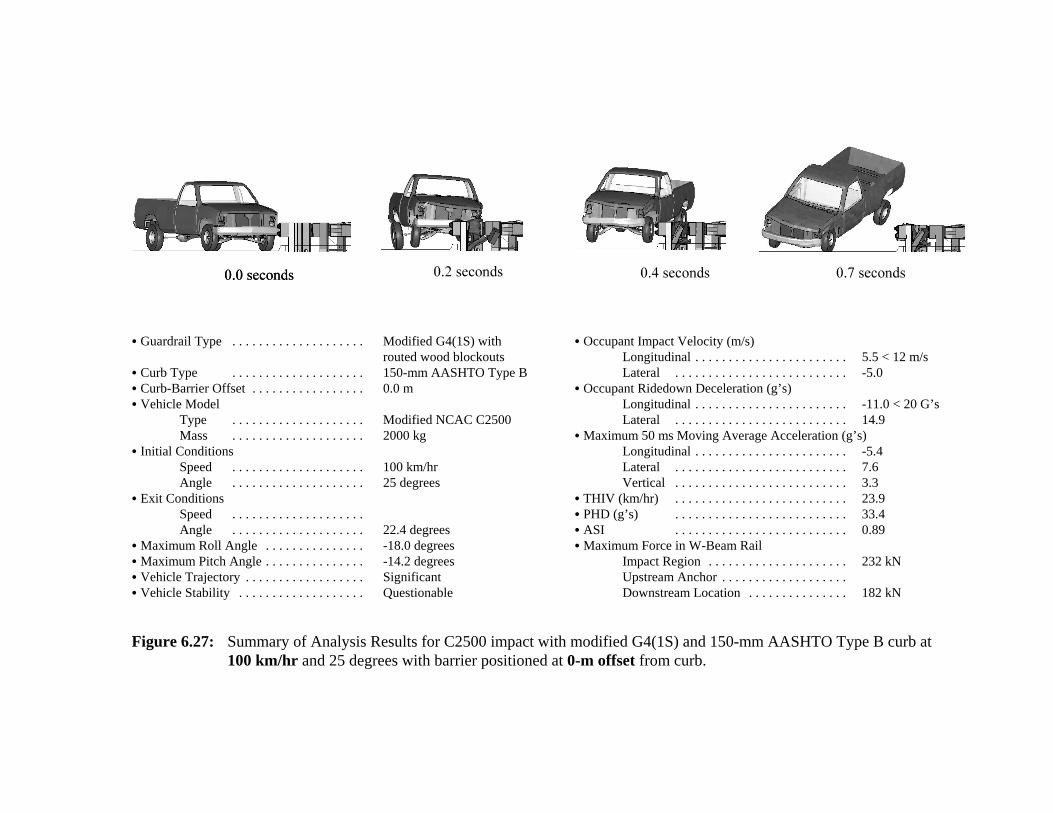
C Guardrail Type . . . . . . . . . . . . . . . . . . . . Modified G4(1S) withrouted wood blockouts
C Curb Type . . . . . . . . . . . . . . . . . . . . 150-mm AASHTO Type BC Curb-Barrier Offset . . . . . . . . . . . . . . . . . 0.0 mC Vehicle Model
Type . . . . . . . . . . . . . . . . . . . . Modified NCAC C2500Mass . . . . . . . . . . . . . . . . . . . . 2000 kg
C Initial ConditionsSpeed . . . . . . . . . . . . . . . . . . . . 100 km/hrAngle . . . . . . . . . . . . . . . . . . . . 25 degrees
C Exit Conditions Speed . . . . . . . . . . . . . . . . . . . .Angle . . . . . . . . . . . . . . . . . . . . 22.4 degrees
C Maximum Roll Angle . . . . . . . . . . . . . . . -18.0 degreesC Maximum Pitch Angle . . . . . . . . . . . . . . . -14.2 degreesC Vehicle Trajectory . . . . . . . . . . . . . . . . . . SignificantC Vehicle Stability . . . . . . . . . . . . . . . . . . . Questionable
C Occupant Impact Velocity (m/s)Longitudinal . . . . . . . . . . . . . . . . . . . . . . . 5.5 < 12 m/sLateral . . . . . . . . . . . . . . . . . . . . . . . . . . -5.0
C Occupant Ridedown Deceleration (g’s)Longitudinal . . . . . . . . . . . . . . . . . . . . . . . -11.0 < 20 G’sLateral . . . . . . . . . . . . . . . . . . . . . . . . . . 14.9
C Maximum 50 ms Moving Average Acceleration (g’s)Longitudinal . . . . . . . . . . . . . . . . . . . . . . . -5.4Lateral . . . . . . . . . . . . . . . . . . . . . . . . . . 7.6Vertical . . . . . . . . . . . . . . . . . . . . . . . . . . 3.3
C THIV (km/hr) . . . . . . . . . . . . . . . . . . . . . . . . . . 23.9C PHD (g’s) . . . . . . . . . . . . . . . . . . . . . . . . . . 33.4C ASI . . . . . . . . . . . . . . . . . . . . . . . . . . 0.89C Maximum Force in W-Beam Rail
Impact Region . . . . . . . . . . . . . . . . . . . . . 232 kNUpstream Anchor . . . . . . . . . . . . . . . . . . .Downstream Location . . . . . . . . . . . . . . . 182 kN
Figure 6.27: Summary of Analysis Results for C2500 impact with modified G4(1S) and 150-mm AASHTO Type B curb at100 km/hr and 25 degrees with barrier positioned at 0-m offset from curb.
C Guardrail Type . . . . . . . . . . . . . . . . . . . . Modified G4(1S) withrouted wood blockouts
C Curb Type . . . . . . . . . . . . . . . . . . . . 100-mm AASHTO Type CC Curb-Barrier Offset . . . . . . . . . . . . . . . . . 0.0 mC Vehicle Model
Type . . . . . . . . . . . . . . . . . . . . Modified NCAC C2500Mass . . . . . . . . . . . . . . . . . . . . 2000 kg
C Initial ConditionsSpeed . . . . . . . . . . . . . . . . . . . . 100 km/hrAngle . . . . . . . . . . . . . . . . . . . . 25 degrees
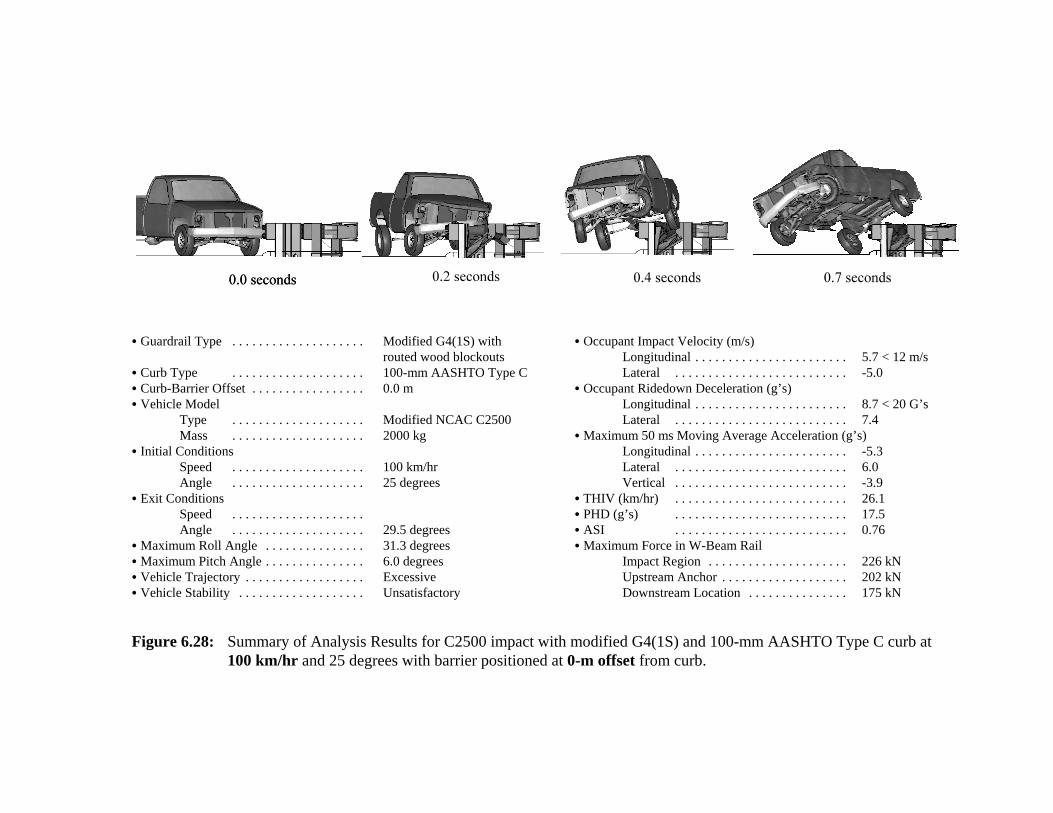
C Exit Conditions Speed . . . . . . . . . . . . . . . . . . . .Angle . . . . . . . . . . . . . . . . . . . . 29.5 degrees
C Maximum Roll Angle . . . . . . . . . . . . . . . 31.3 degreesC Maximum Pitch Angle . . . . . . . . . . . . . . . 6.0 degreesC Vehicle Trajectory . . . . . . . . . . . . . . . . . . ExcessiveC Vehicle Stability . . . . . . . . . . . . . . . . . . . Unsatisfactory
C Occupant Impact Velocity (m/s)Longitudinal . . . . . . . . . . . . . . . . . . . . . . . 5.7 < 12 m/sLateral . . . . . . . . . . . . . . . . . . . . . . . . . . -5.0
C Occupant Ridedown Deceleration (g’s)Longitudinal . . . . . . . . . . . . . . . . . . . . . . . 8.7 < 20 G’sLateral . . . . . . . . . . . . . . . . . . . . . . . . . . 7.4
C Maximum 50 ms Moving Average Acceleration (g’s)Longitudinal . . . . . . . . . . . . . . . . . . . . . . . -5.3Lateral . . . . . . . . . . . . . . . . . . . . . . . . . . 6.0Vertical . . . . . . . . . . . . . . . . . . . . . . . . . . -3.9
C THIV (km/hr) . . . . . . . . . . . . . . . . . . . . . . . . . . 26.1C PHD (g’s) . . . . . . . . . . . . . . . . . . . . . . . . . . 17.5C ASI . . . . . . . . . . . . . . . . . . . . . . . . . . 0.76C Maximum Force in W-Beam Rail
Impact Region . . . . . . . . . . . . . . . . . . . . . 226 kNUpstream Anchor . . . . . . . . . . . . . . . . . . . 202 kNDownstream Location . . . . . . . . . . . . . . . 175 kN
Figure 6.28: Summary of Analysis Results for C2500 impact with modified G4(1S) and 100-mm AASHTO Type C curb at100 km/hr and 25 degrees with barrier positioned at 0-m offset from curb.
C Guardrail Type . . . . . . . . . . . . . . . . . . . . Modified G4(1S) withrouted wood blockouts
C Curb Type . . . . . . . . . . . . . . . . . . . . 150-mm AASHTO Type DC Curb-Barrier Offset . . . . . . . . . . . . . . . . . 0.0 mC Vehicle Model
Type . . . . . . . . . . . . . . . . . . . . Modified NCAC C2500Mass . . . . . . . . . . . . . . . . . . . . 2000 kg
C Initial ConditionsSpeed . . . . . . . . . . . . . . . . . . . . 100 km/hrAngle . . . . . . . . . . . . . . . . . . . . 25 degrees
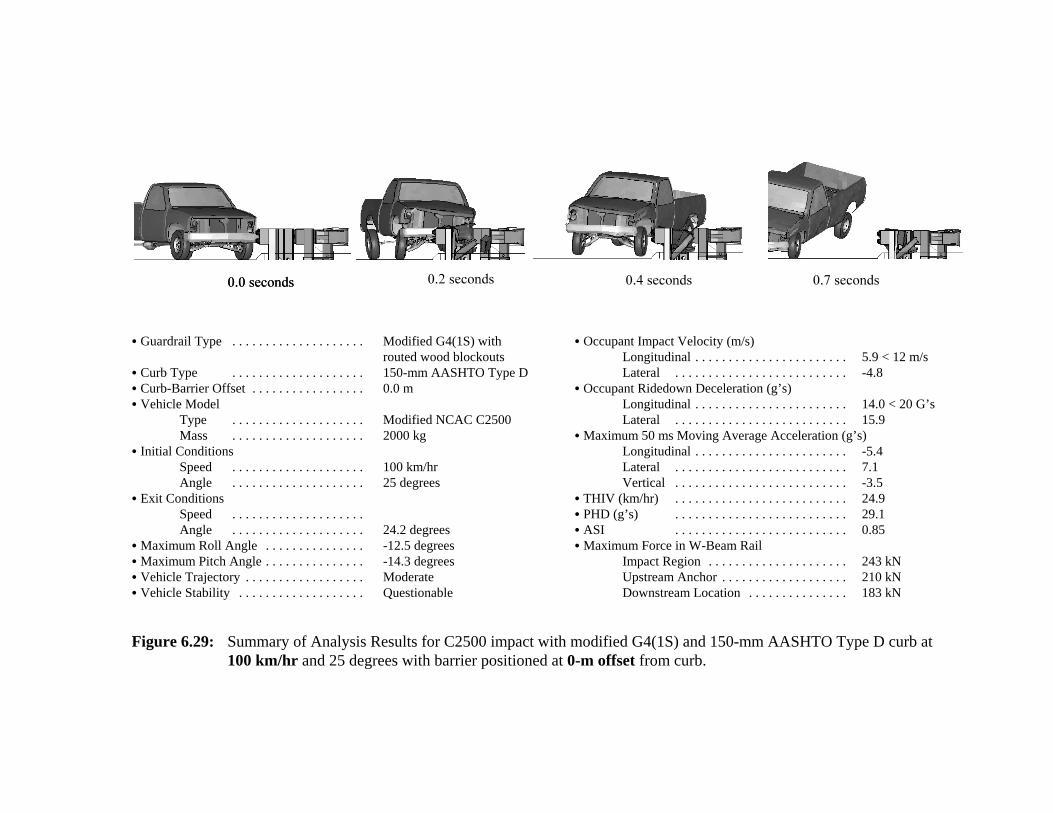
C Exit Conditions Speed . . . . . . . . . . . . . . . . . . . .Angle . . . . . . . . . . . . . . . . . . . . 24.2 degrees
C Maximum Roll Angle . . . . . . . . . . . . . . . -12.5 degreesC Maximum Pitch Angle . . . . . . . . . . . . . . . -14.3 degreesC Vehicle Trajectory . . . . . . . . . . . . . . . . . . ModerateC Vehicle Stability . . . . . . . . . . . . . . . . . . . Questionable
C Occupant Impact Velocity (m/s)Longitudinal . . . . . . . . . . . . . . . . . . . . . . . 5.9 < 12 m/sLateral . . . . . . . . . . . . . . . . . . . . . . . . . . -4.8
C Occupant Ridedown Deceleration (g’s)Longitudinal . . . . . . . . . . . . . . . . . . . . . . . 14.0 < 20 G’sLateral . . . . . . . . . . . . . . . . . . . . . . . . . . 15.9
C Maximum 50 ms Moving Average Acceleration (g’s)Longitudinal . . . . . . . . . . . . . . . . . . . . . . . -5.4Lateral . . . . . . . . . . . . . . . . . . . . . . . . . . 7.1Vertical . . . . . . . . . . . . . . . . . . . . . . . . . . -3.5
C THIV (km/hr) . . . . . . . . . . . . . . . . . . . . . . . . . . 24.9C PHD (g’s) . . . . . . . . . . . . . . . . . . . . . . . . . . 29.1C ASI . . . . . . . . . . . . . . . . . . . . . . . . . . 0.85C Maximum Force in W-Beam Rail
Impact Region . . . . . . . . . . . . . . . . . . . . . 243 kNUpstream Anchor . . . . . . . . . . . . . . . . . . . 210 kNDownstream Location . . . . . . . . . . . . . . . 183 kN
Figure 6.29: Summary of Analysis Results for C2500 impact with modified G4(1S) and 150-mm AASHTO Type D curb at100 km/hr and 25 degrees with barrier positioned at 0-m offset from curb.
C Guardrail Type . . . . . . . . . . . . . . . . . . . . Modified G4(1S) withrouted wood blockouts
C Curb Type . . . . . . . . . . . . . . . . . . . . 100-mm AASHTO Type GC Curb-Barrier Offset . . . . . . . . . . . . . . . . . 0.0 mC Vehicle Model
Type . . . . . . . . . . . . . . . . . . . . Modified NCAC C2500Mass . . . . . . . . . . . . . . . . . . . . 2000 kg
C Initial ConditionsSpeed . . . . . . . . . . . . . . . . . . . . 100 km/hrAngle . . . . . . . . . . . . . . . . . . . . 25 degrees
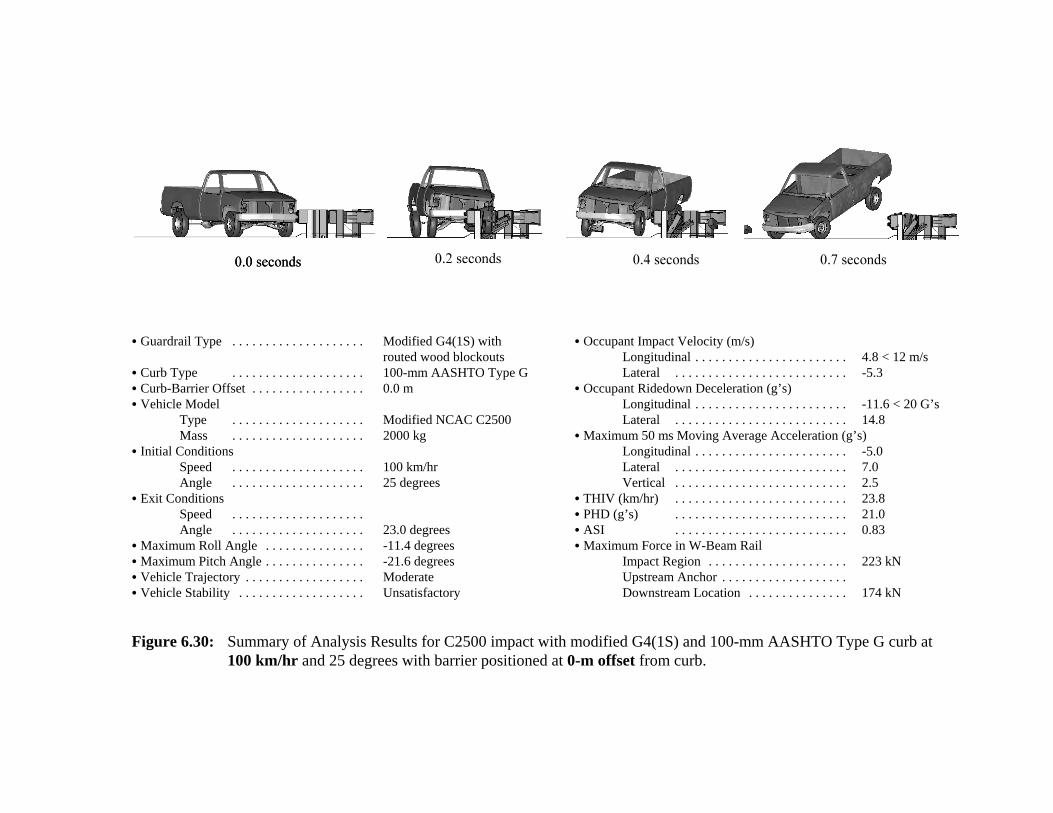
C Exit Conditions Speed . . . . . . . . . . . . . . . . . . . .Angle . . . . . . . . . . . . . . . . . . . . 23.0 degrees
C Maximum Roll Angle . . . . . . . . . . . . . . . -11.4 degreesC Maximum Pitch Angle . . . . . . . . . . . . . . . -21.6 degreesC Vehicle Trajectory . . . . . . . . . . . . . . . . . . ModerateC Vehicle Stability . . . . . . . . . . . . . . . . . . . Unsatisfactory
C Occupant Impact Velocity (m/s)Longitudinal . . . . . . . . . . . . . . . . . . . . . . . 4.8 < 12 m/sLateral . . . . . . . . . . . . . . . . . . . . . . . . . . -5.3
C Occupant Ridedown Deceleration (g’s)Longitudinal . . . . . . . . . . . . . . . . . . . . . . . -11.6 < 20 G’sLateral . . . . . . . . . . . . . . . . . . . . . . . . . . 14.8
C Maximum 50 ms Moving Average Acceleration (g’s)Longitudinal . . . . . . . . . . . . . . . . . . . . . . . -5.0Lateral . . . . . . . . . . . . . . . . . . . . . . . . . . 7.0Vertical . . . . . . . . . . . . . . . . . . . . . . . . . . 2.5
C THIV (km/hr) . . . . . . . . . . . . . . . . . . . . . . . . . . 23.8C PHD (g’s) . . . . . . . . . . . . . . . . . . . . . . . . . . 21.0C ASI . . . . . . . . . . . . . . . . . . . . . . . . . . 0.83C Maximum Force in W-Beam Rail
Impact Region . . . . . . . . . . . . . . . . . . . . . 223 kNUpstream Anchor . . . . . . . . . . . . . . . . . . .Downstream Location . . . . . . . . . . . . . . . 174 kN
Figure 6.30: Summary of Analysis Results for C2500 impact with modified G4(1S) and 100-mm AASHTO Type G curb at100 km/hr and 25 degrees with barrier positioned at 0-m offset from curb.
C Guardrail Type . . . . . . . . . . . . . . . . . . . . Modified G4(1S) withrouted wood blockouts
C Curb Type . . . . . . . . . . . . . . . . . . . . 100-mm New York CurbC Curb-Barrier Offset . . . . . . . . . . . . . . . . . 0.0 mC Vehicle Model
Type . . . . . . . . . . . . . . . . . . . . Modified NCAC C2500Mass . . . . . . . . . . . . . . . . . . . . 2000 kg
C Initial ConditionsSpeed . . . . . . . . . . . . . . . . . . . . 100 km/hrAngle . . . . . . . . . . . . . . . . . . . . 25 degrees
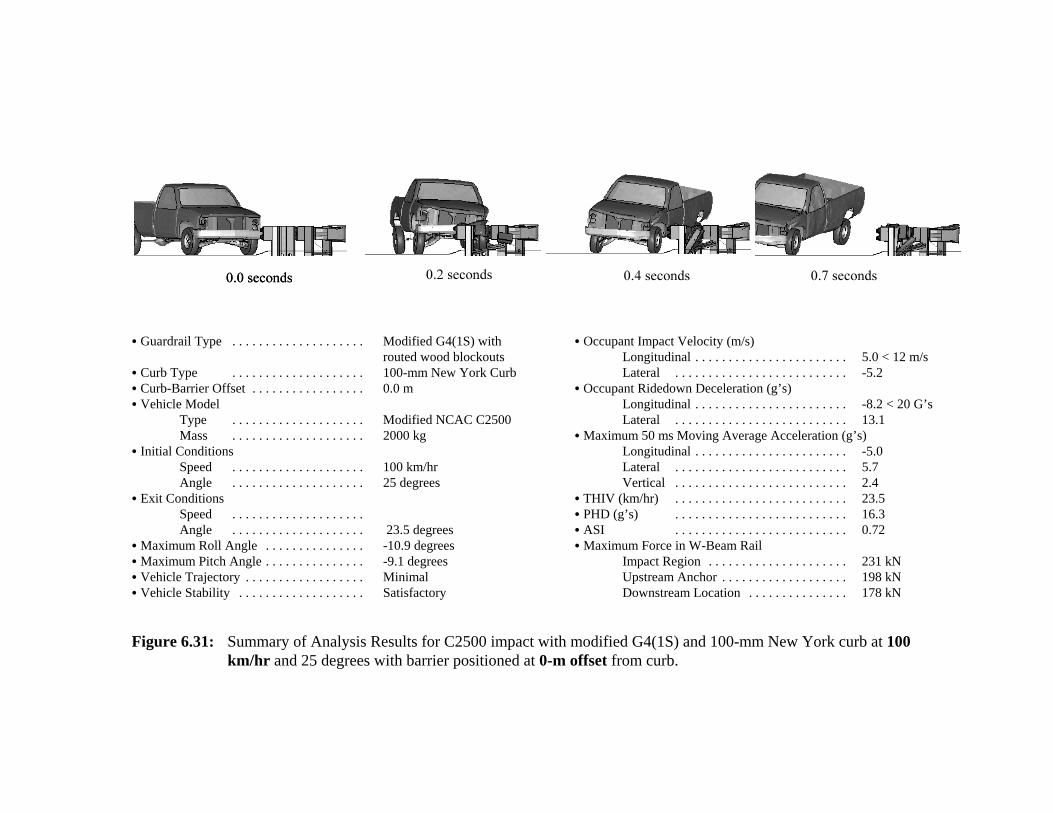
C Exit Conditions Speed . . . . . . . . . . . . . . . . . . . .Angle . . . . . . . . . . . . . . . . . . . . 23.5 degrees
C Maximum Roll Angle . . . . . . . . . . . . . . . -10.9 degreesC Maximum Pitch Angle . . . . . . . . . . . . . . . -9.1 degreesC Vehicle Trajectory . . . . . . . . . . . . . . . . . . MinimalC Vehicle Stability . . . . . . . . . . . . . . . . . . . Satisfactory
C Occupant Impact Velocity (m/s)Longitudinal . . . . . . . . . . . . . . . . . . . . . . . 5.0 < 12 m/sLateral . . . . . . . . . . . . . . . . . . . . . . . . . . -5.2
C Occupant Ridedown Deceleration (g’s)Longitudinal . . . . . . . . . . . . . . . . . . . . . . . -8.2 < 20 G’sLateral . . . . . . . . . . . . . . . . . . . . . . . . . . 13.1
C Maximum 50 ms Moving Average Acceleration (g’s)Longitudinal . . . . . . . . . . . . . . . . . . . . . . . -5.0Lateral . . . . . . . . . . . . . . . . . . . . . . . . . . 5.7Vertical . . . . . . . . . . . . . . . . . . . . . . . . . . 2.4
C THIV (km/hr) . . . . . . . . . . . . . . . . . . . . . . . . . . 23.5C PHD (g’s) . . . . . . . . . . . . . . . . . . . . . . . . . . 16.3C ASI . . . . . . . . . . . . . . . . . . . . . . . . . . 0.72C Maximum Force in W-Beam Rail
Impact Region . . . . . . . . . . . . . . . . . . . . . 231 kNUpstream Anchor . . . . . . . . . . . . . . . . . . . 198 kNDownstream Location . . . . . . . . . . . . . . . 178 kN
Figure 6.31: Summary of Analysis Results for C2500 impact with modified G4(1S) and 100-mm New York curb at 100km/hr and 25 degrees with barrier positioned at 0-m offset from curb.
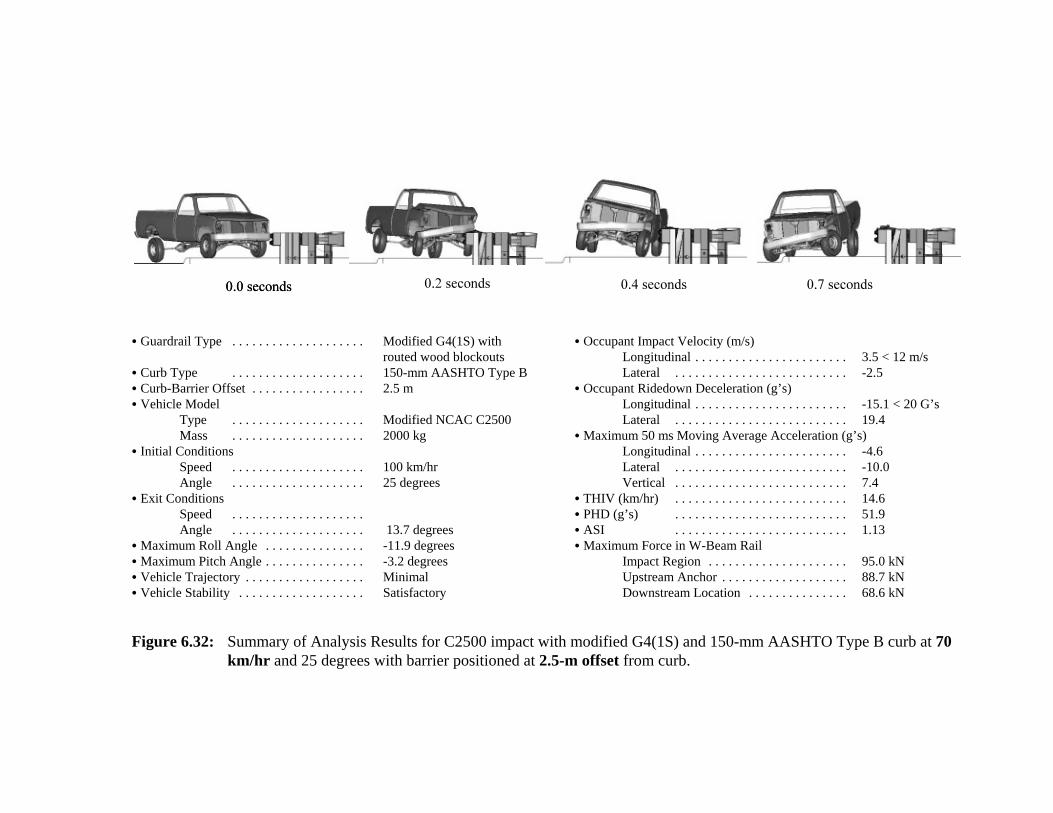
C Guardrail Type . . . . . . . . . . . . . . . . . . . . Modified G4(1S) withrouted wood blockouts
C Curb Type . . . . . . . . . . . . . . . . . . . . 150-mm AASHTO Type BC Curb-Barrier Offset . . . . . . . . . . . . . . . . . 2.5 mC Vehicle Model
Type . . . . . . . . . . . . . . . . . . . . Modified NCAC C2500Mass . . . . . . . . . . . . . . . . . . . . 2000 kg
C Initial ConditionsSpeed . . . . . . . . . . . . . . . . . . . . 100 km/hrAngle . . . . . . . . . . . . . . . . . . . . 25 degrees
C Exit Conditions Speed . . . . . . . . . . . . . . . . . . . .Angle . . . . . . . . . . . . . . . . . . . . 13.7 degrees
C Maximum Roll Angle . . . . . . . . . . . . . . . -11.9 degreesC Maximum Pitch Angle . . . . . . . . . . . . . . . -3.2 degreesC Vehicle Trajectory . . . . . . . . . . . . . . . . . . MinimalC Vehicle Stability . . . . . . . . . . . . . . . . . . . Satisfactory
C Occupant Impact Velocity (m/s)Longitudinal . . . . . . . . . . . . . . . . . . . . . . . 3.5 < 12 m/sLateral . . . . . . . . . . . . . . . . . . . . . . . . . . -2.5
C Occupant Ridedown Deceleration (g’s)Longitudinal . . . . . . . . . . . . . . . . . . . . . . . -15.1 < 20 G’sLateral . . . . . . . . . . . . . . . . . . . . . . . . . . 19.4
C Maximum 50 ms Moving Average Acceleration (g’s)Longitudinal . . . . . . . . . . . . . . . . . . . . . . . -4.6Lateral . . . . . . . . . . . . . . . . . . . . . . . . . . -10.0Vertical . . . . . . . . . . . . . . . . . . . . . . . . . . 7.4
C THIV (km/hr) . . . . . . . . . . . . . . . . . . . . . . . . . . 14.6C PHD (g’s) . . . . . . . . . . . . . . . . . . . . . . . . . . 51.9C ASI . . . . . . . . . . . . . . . . . . . . . . . . . . 1.13C Maximum Force in W-Beam Rail
Impact Region . . . . . . . . . . . . . . . . . . . . . 95.0 kNUpstream Anchor . . . . . . . . . . . . . . . . . . . 88.7 kNDownstream Location . . . . . . . . . . . . . . . 68.6 kN
Figure 6.32: Summary of Analysis Results for C2500 impact with modified G4(1S) and 150-mm AASHTO Type B curb at 70km/hr and 25 degrees with barrier positioned at 2.5-m offset from curb.
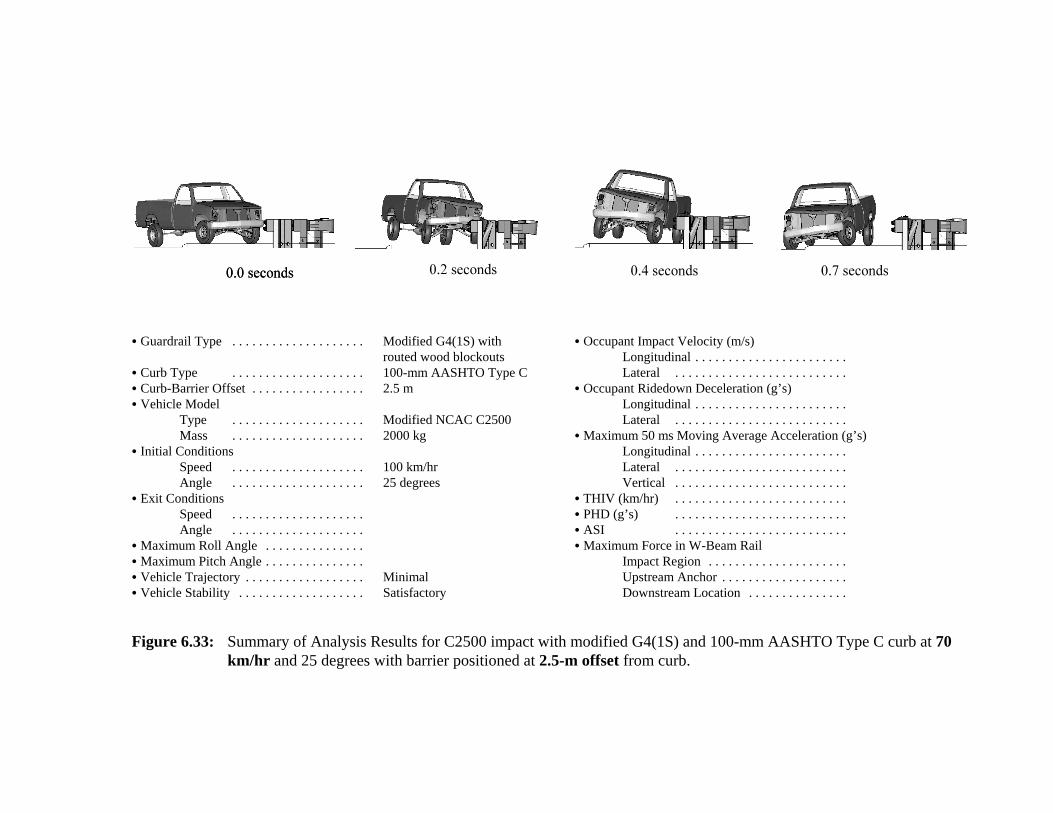
C Guardrail Type . . . . . . . . . . . . . . . . . . . . Modified G4(1S) withrouted wood blockouts
C Curb Type . . . . . . . . . . . . . . . . . . . . 100-mm AASHTO Type CC Curb-Barrier Offset . . . . . . . . . . . . . . . . . 2.5 mC Vehicle Model
Type . . . . . . . . . . . . . . . . . . . . Modified NCAC C2500Mass . . . . . . . . . . . . . . . . . . . . 2000 kg
C Initial ConditionsSpeed . . . . . . . . . . . . . . . . . . . . 100 km/hrAngle . . . . . . . . . . . . . . . . . . . . 25 degrees
C Exit Conditions Speed . . . . . . . . . . . . . . . . . . . .Angle . . . . . . . . . . . . . . . . . . . .
C Maximum Roll Angle . . . . . . . . . . . . . . .C Maximum Pitch Angle . . . . . . . . . . . . . . .C Vehicle Trajectory . . . . . . . . . . . . . . . . . . MinimalC Vehicle Stability . . . . . . . . . . . . . . . . . . . Satisfactory
C Occupant Impact Velocity (m/s)Longitudinal . . . . . . . . . . . . . . . . . . . . . . .Lateral . . . . . . . . . . . . . . . . . . . . . . . . . .
C Occupant Ridedown Deceleration (g’s)Longitudinal . . . . . . . . . . . . . . . . . . . . . . .Lateral . . . . . . . . . . . . . . . . . . . . . . . . . .
C Maximum 50 ms Moving Average Acceleration (g’s)Longitudinal . . . . . . . . . . . . . . . . . . . . . . .Lateral . . . . . . . . . . . . . . . . . . . . . . . . . .Vertical . . . . . . . . . . . . . . . . . . . . . . . . . .
C THIV (km/hr) . . . . . . . . . . . . . . . . . . . . . . . . . .C PHD (g’s) . . . . . . . . . . . . . . . . . . . . . . . . . .C ASI . . . . . . . . . . . . . . . . . . . . . . . . . .C Maximum Force in W-Beam Rail
Impact Region . . . . . . . . . . . . . . . . . . . . .Upstream Anchor . . . . . . . . . . . . . . . . . . .Downstream Location . . . . . . . . . . . . . . .
Figure 6.33: Summary of Analysis Results for C2500 impact with modified G4(1S) and 100-mm AASHTO Type C curb at 70km/hr and 25 degrees with barrier positioned at 2.5-m offset from curb.

C Guardrail Type . . . . . . . . . . . . . . . . . . . . Modified G4(1S) withrouted wood blockouts
C Curb Type . . . . . . . . . . . . . . . . . . . . 150-mm AASHTO Type DC Curb-Barrier Offset . . . . . . . . . . . . . . . . . 2.5 mC Vehicle Model
Type . . . . . . . . . . . . . . . . . . . . Modified NCAC C2500Mass . . . . . . . . . . . . . . . . . . . . 2000 kg
C Initial ConditionsSpeed . . . . . . . . . . . . . . . . . . . . 100 km/hrAngle . . . . . . . . . . . . . . . . . . . . 25 degrees
C Exit Conditions Speed . . . . . . . . . . . . . . . . . . . .Angle . . . . . . . . . . . . . . . . . . . . 18.9 degrees
C Maximum Roll Angle . . . . . . . . . . . . . . . -11.4 degreesC Maximum Pitch Angle . . . . . . . . . . . . . . . -5.2 degreesC Vehicle Trajectory . . . . . . . . . . . . . . . . . . MinimalC Vehicle Stability . . . . . . . . . . . . . . . . . . . Satisfactory
C Occupant Impact Velocity (m/s)Longitudinal . . . . . . . . . . . . . . . . . . . . . . . -0.1 < 12 m/sLateral . . . . . . . . . . . . . . . . . . . . . . . . . . -1.6
C Occupant Ridedown Deceleration (g’s)Longitudinal . . . . . . . . . . . . . . . . . . . . . . . -12.7 < 20 G’sLateral . . . . . . . . . . . . . . . . . . . . . . . . . . 17.3
C Maximum 50 ms Moving Average Acceleration (g’s)Longitudinal . . . . . . . . . . . . . . . . . . . . . . . -5.6Lateral . . . . . . . . . . . . . . . . . . . . . . . . . . 5.8Vertical . . . . . . . . . . . . . . . . . . . . . . . . . . -7.7
C THIV (km/hr) . . . . . . . . . . . . . . . . . . . . . . . . . . 6.1C PHD (g’s) . . . . . . . . . . . . . . . . . . . . . . . . . . 34.2C ASI . . . . . . . . . . . . . . . . . . . . . . . . . . 0.83C Maximum Force in W-Beam Rail
Impact Region . . . . . . . . . . . . . . . . . . . . . 128 kNUpstream Anchor . . . . . . . . . . . . . . . . . . . 120 kNDownstream Location . . . . . . . . . . . . . . . 82.1 kN
Figure 6.34: Summary of Analysis Results for C2500 impact with modified G4(1S) and 150-mm AASHTO Type D curb at 70km/hr and 25 degrees with barrier positioned at 2.5-m offset from curb.
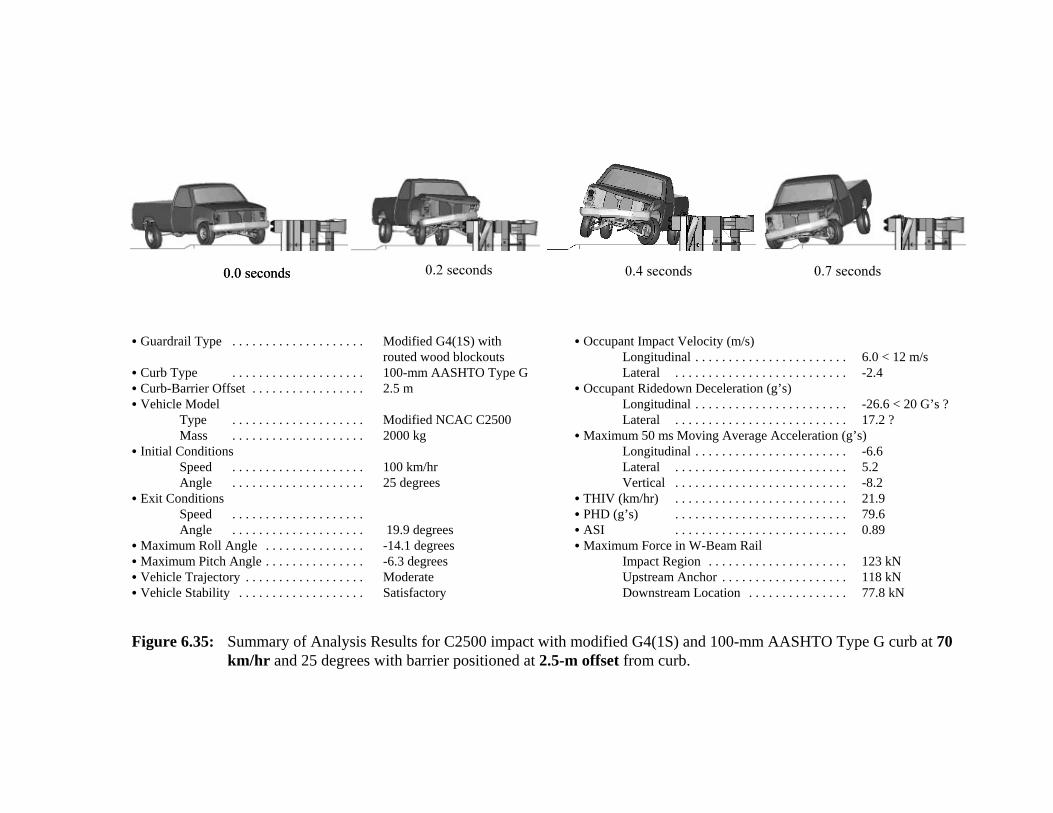
C Guardrail Type . . . . . . . . . . . . . . . . . . . . Modified G4(1S) withrouted wood blockouts
C Curb Type . . . . . . . . . . . . . . . . . . . . 100-mm AASHTO Type GC Curb-Barrier Offset . . . . . . . . . . . . . . . . . 2.5 mC Vehicle Model
Type . . . . . . . . . . . . . . . . . . . . Modified NCAC C2500Mass . . . . . . . . . . . . . . . . . . . . 2000 kg
C Initial ConditionsSpeed . . . . . . . . . . . . . . . . . . . . 100 km/hrAngle . . . . . . . . . . . . . . . . . . . . 25 degrees
C Exit Conditions Speed . . . . . . . . . . . . . . . . . . . .Angle . . . . . . . . . . . . . . . . . . . . 19.9 degrees
C Maximum Roll Angle . . . . . . . . . . . . . . . -14.1 degreesC Maximum Pitch Angle . . . . . . . . . . . . . . . -6.3 degreesC Vehicle Trajectory . . . . . . . . . . . . . . . . . . ModerateC Vehicle Stability . . . . . . . . . . . . . . . . . . . Satisfactory
C Occupant Impact Velocity (m/s)Longitudinal . . . . . . . . . . . . . . . . . . . . . . . 6.0 < 12 m/sLateral . . . . . . . . . . . . . . . . . . . . . . . . . . -2.4
C Occupant Ridedown Deceleration (g’s)Longitudinal . . . . . . . . . . . . . . . . . . . . . . . -26.6 < 20 G’s ?Lateral . . . . . . . . . . . . . . . . . . . . . . . . . . 17.2 ?
C Maximum 50 ms Moving Average Acceleration (g’s)Longitudinal . . . . . . . . . . . . . . . . . . . . . . . -6.6Lateral . . . . . . . . . . . . . . . . . . . . . . . . . . 5.2Vertical . . . . . . . . . . . . . . . . . . . . . . . . . . -8.2
C THIV (km/hr) . . . . . . . . . . . . . . . . . . . . . . . . . . 21.9C PHD (g’s) . . . . . . . . . . . . . . . . . . . . . . . . . . 79.6C ASI . . . . . . . . . . . . . . . . . . . . . . . . . . 0.89C Maximum Force in W-Beam Rail
Impact Region . . . . . . . . . . . . . . . . . . . . . 123 kNUpstream Anchor . . . . . . . . . . . . . . . . . . . 118 kNDownstream Location . . . . . . . . . . . . . . . 77.8 kN
Figure 6.35: Summary of Analysis Results for C2500 impact with modified G4(1S) and 100-mm AASHTO Type G curb at 70km/hr and 25 degrees with barrier positioned at 2.5-m offset from curb.
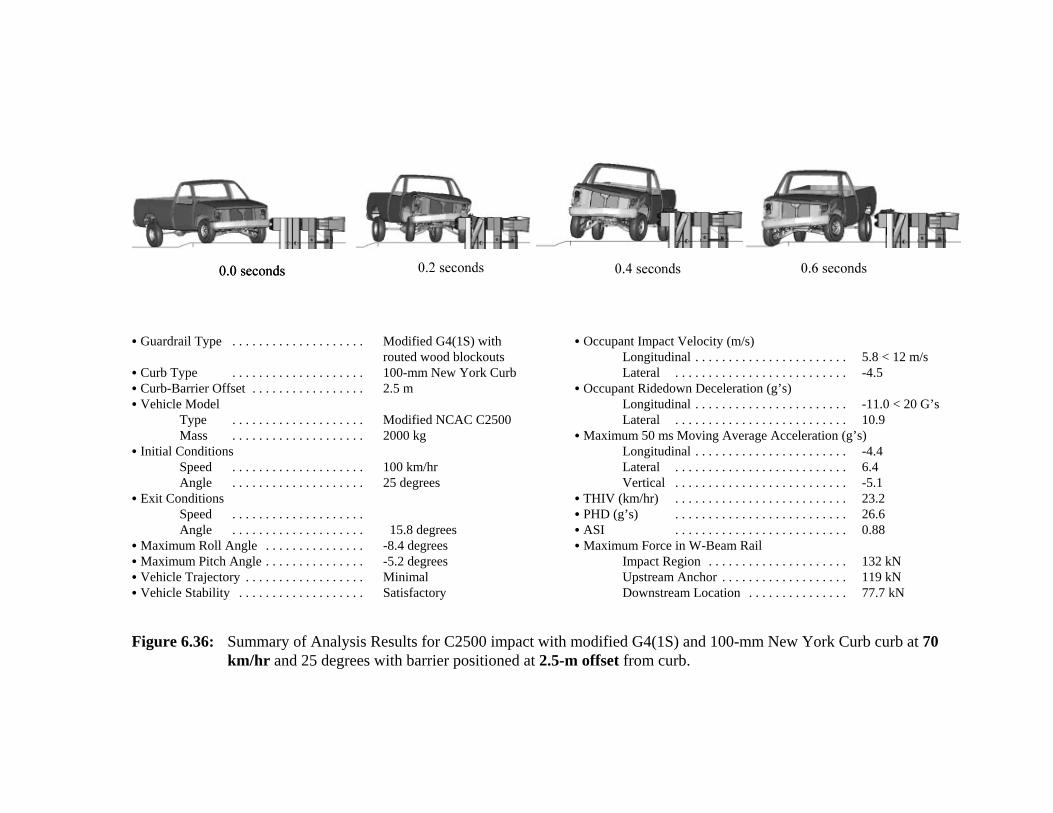
C Guardrail Type . . . . . . . . . . . . . . . . . . . . Modified G4(1S) withrouted wood blockouts
C Curb Type . . . . . . . . . . . . . . . . . . . . 100-mm New York CurbC Curb-Barrier Offset . . . . . . . . . . . . . . . . . 2.5 mC Vehicle Model
Type . . . . . . . . . . . . . . . . . . . . Modified NCAC C2500Mass . . . . . . . . . . . . . . . . . . . . 2000 kg
C Initial ConditionsSpeed . . . . . . . . . . . . . . . . . . . . 100 km/hrAngle . . . . . . . . . . . . . . . . . . . . 25 degrees
C Exit Conditions Speed . . . . . . . . . . . . . . . . . . . .Angle . . . . . . . . . . . . . . . . . . . . 15.8 degrees
C Maximum Roll Angle . . . . . . . . . . . . . . . -8.4 degreesC Maximum Pitch Angle . . . . . . . . . . . . . . . -5.2 degreesC Vehicle Trajectory . . . . . . . . . . . . . . . . . . MinimalC Vehicle Stability . . . . . . . . . . . . . . . . . . . Satisfactory
C Occupant Impact Velocity (m/s)Longitudinal . . . . . . . . . . . . . . . . . . . . . . . 5.8 < 12 m/sLateral . . . . . . . . . . . . . . . . . . . . . . . . . . -4.5
C Occupant Ridedown Deceleration (g’s)Longitudinal . . . . . . . . . . . . . . . . . . . . . . . -11.0 < 20 G’s Lateral . . . . . . . . . . . . . . . . . . . . . . . . . . 10.9
C Maximum 50 ms Moving Average Acceleration (g’s)Longitudinal . . . . . . . . . . . . . . . . . . . . . . . -4.4Lateral . . . . . . . . . . . . . . . . . . . . . . . . . . 6.4Vertical . . . . . . . . . . . . . . . . . . . . . . . . . . -5.1
C THIV (km/hr) . . . . . . . . . . . . . . . . . . . . . . . . . . 23.2C PHD (g’s) . . . . . . . . . . . . . . . . . . . . . . . . . . 26.6C ASI . . . . . . . . . . . . . . . . . . . . . . . . . . 0.88C Maximum Force in W-Beam Rail
Impact Region . . . . . . . . . . . . . . . . . . . . . 132 kNUpstream Anchor . . . . . . . . . . . . . . . . . . . 119 kNDownstream Location . . . . . . . . . . . . . . . 77.7 kN
Figure 6.36: Summary of Analysis Results for C2500 impact with modified G4(1S) and 100-mm New York Curb curb at 70km/hr and 25 degrees with barrier positioned at 2.5-m offset from curb.
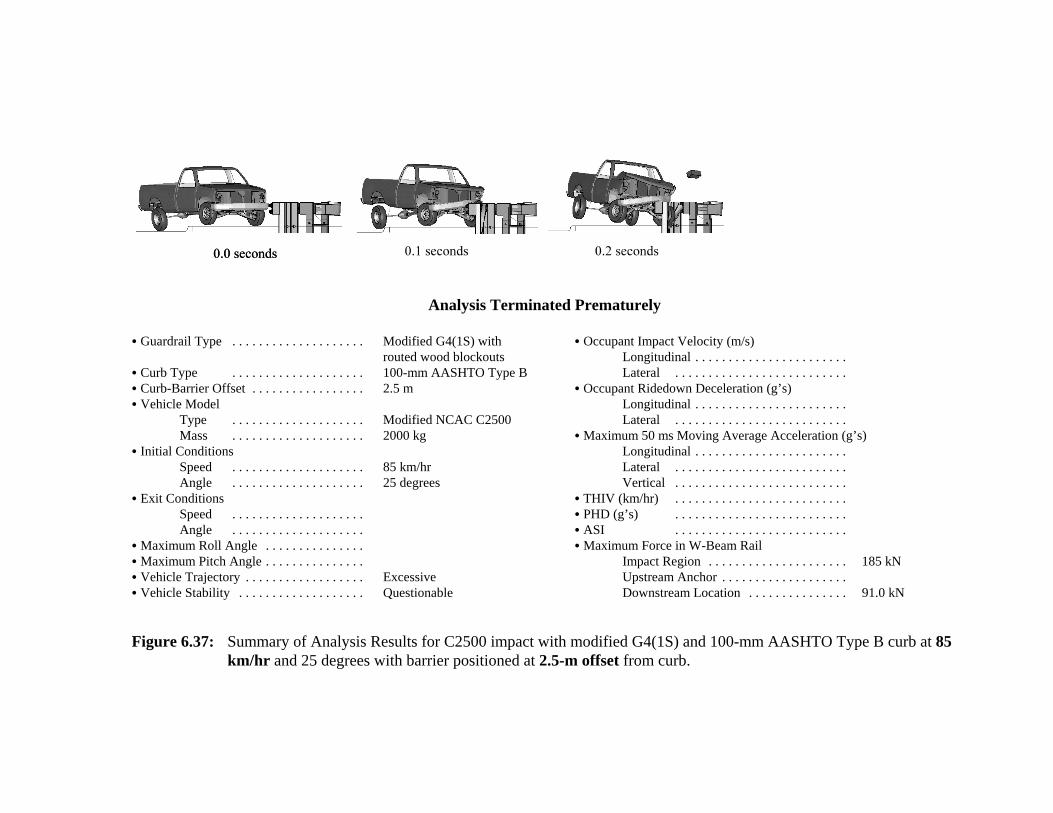
Analysis Terminated Prematurely
C Guardrail Type . . . . . . . . . . . . . . . . . . . . Modified G4(1S) withrouted wood blockouts
C Curb Type . . . . . . . . . . . . . . . . . . . . 100-mm AASHTO Type BC Curb-Barrier Offset . . . . . . . . . . . . . . . . . 2.5 mC Vehicle Model
Type . . . . . . . . . . . . . . . . . . . . Modified NCAC C2500Mass . . . . . . . . . . . . . . . . . . . . 2000 kg
C Initial ConditionsSpeed . . . . . . . . . . . . . . . . . . . . 85 km/hrAngle . . . . . . . . . . . . . . . . . . . . 25 degrees
C Exit Conditions Speed . . . . . . . . . . . . . . . . . . . .Angle . . . . . . . . . . . . . . . . . . . .
C Maximum Roll Angle . . . . . . . . . . . . . . .C Maximum Pitch Angle . . . . . . . . . . . . . . .C Vehicle Trajectory . . . . . . . . . . . . . . . . . . ExcessiveC Vehicle Stability . . . . . . . . . . . . . . . . . . . Questionable
C Occupant Impact Velocity (m/s)Longitudinal . . . . . . . . . . . . . . . . . . . . . . .Lateral . . . . . . . . . . . . . . . . . . . . . . . . . .
C Occupant Ridedown Deceleration (g’s)Longitudinal . . . . . . . . . . . . . . . . . . . . . . .Lateral . . . . . . . . . . . . . . . . . . . . . . . . . .
C Maximum 50 ms Moving Average Acceleration (g’s)Longitudinal . . . . . . . . . . . . . . . . . . . . . . .Lateral . . . . . . . . . . . . . . . . . . . . . . . . . .Vertical . . . . . . . . . . . . . . . . . . . . . . . . . .
C THIV (km/hr) . . . . . . . . . . . . . . . . . . . . . . . . . .C PHD (g’s) . . . . . . . . . . . . . . . . . . . . . . . . . .C ASI . . . . . . . . . . . . . . . . . . . . . . . . . .C Maximum Force in W-Beam Rail
Impact Region . . . . . . . . . . . . . . . . . . . . . 185 kNUpstream Anchor . . . . . . . . . . . . . . . . . . .Downstream Location . . . . . . . . . . . . . . . 91.0 kN
Figure 6.37: Summary of Analysis Results for C2500 impact with modified G4(1S) and 100-mm AASHTO Type B curb at 85km/hr and 25 degrees with barrier positioned at 2.5-m offset from curb.
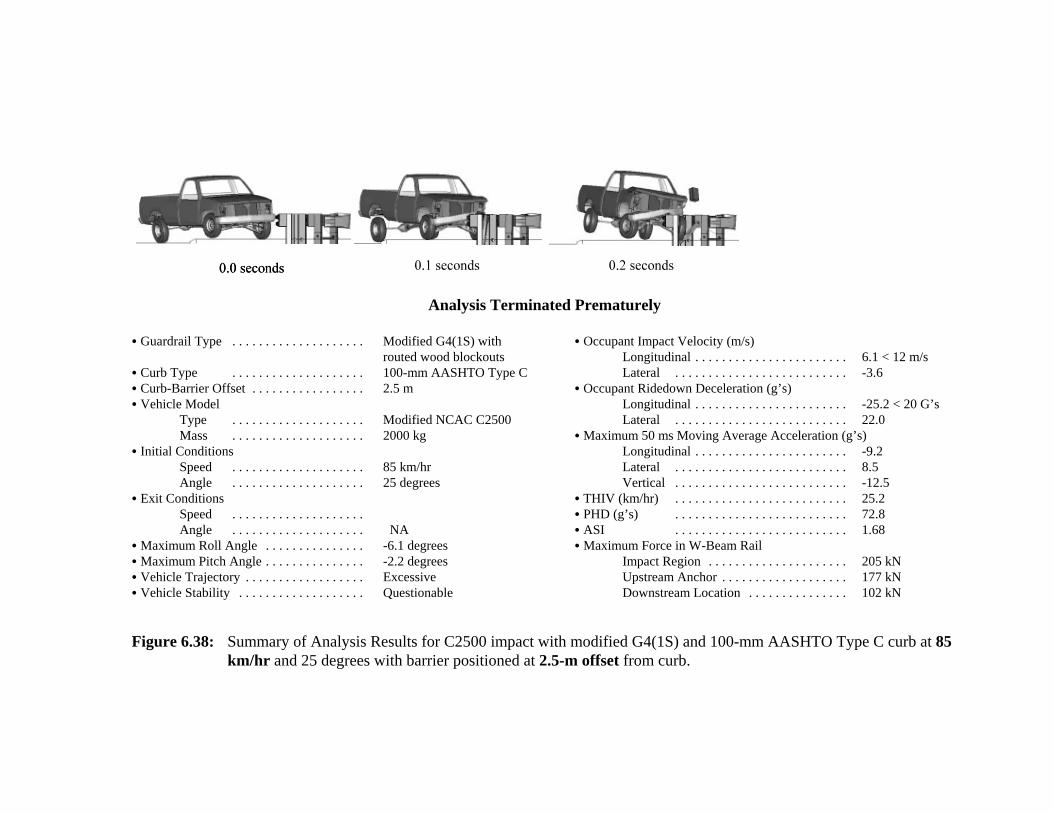
Analysis Terminated Prematurely
C Guardrail Type . . . . . . . . . . . . . . . . . . . . Modified G4(1S) withrouted wood blockouts
C Curb Type . . . . . . . . . . . . . . . . . . . . 100-mm AASHTO Type CC Curb-Barrier Offset . . . . . . . . . . . . . . . . . 2.5 mC Vehicle Model
Type . . . . . . . . . . . . . . . . . . . . Modified NCAC C2500Mass . . . . . . . . . . . . . . . . . . . . 2000 kg
C Initial ConditionsSpeed . . . . . . . . . . . . . . . . . . . . 85 km/hrAngle . . . . . . . . . . . . . . . . . . . . 25 degrees
C Exit Conditions Speed . . . . . . . . . . . . . . . . . . . .Angle . . . . . . . . . . . . . . . . . . . . NA
C Maximum Roll Angle . . . . . . . . . . . . . . . -6.1 degreesC Maximum Pitch Angle . . . . . . . . . . . . . . . -2.2 degreesC Vehicle Trajectory . . . . . . . . . . . . . . . . . . ExcessiveC Vehicle Stability . . . . . . . . . . . . . . . . . . . Questionable
C Occupant Impact Velocity (m/s)Longitudinal . . . . . . . . . . . . . . . . . . . . . . . 6.1 < 12 m/sLateral . . . . . . . . . . . . . . . . . . . . . . . . . . -3.6
C Occupant Ridedown Deceleration (g’s)Longitudinal . . . . . . . . . . . . . . . . . . . . . . . -25.2 < 20 G’s Lateral . . . . . . . . . . . . . . . . . . . . . . . . . . 22.0
C Maximum 50 ms Moving Average Acceleration (g’s)Longitudinal . . . . . . . . . . . . . . . . . . . . . . . -9.2Lateral . . . . . . . . . . . . . . . . . . . . . . . . . . 8.5Vertical . . . . . . . . . . . . . . . . . . . . . . . . . . -12.5
C THIV (km/hr) . . . . . . . . . . . . . . . . . . . . . . . . . . 25.2C PHD (g’s) . . . . . . . . . . . . . . . . . . . . . . . . . . 72.8C ASI . . . . . . . . . . . . . . . . . . . . . . . . . . 1.68C Maximum Force in W-Beam Rail
Impact Region . . . . . . . . . . . . . . . . . . . . . 205 kNUpstream Anchor . . . . . . . . . . . . . . . . . . . 177 kNDownstream Location . . . . . . . . . . . . . . . 102 kN
Figure 6.38: Summary of Analysis Results for C2500 impact with modified G4(1S) and 100-mm AASHTO Type C curb at 85km/hr and 25 degrees with barrier positioned at 2.5-m offset from curb.
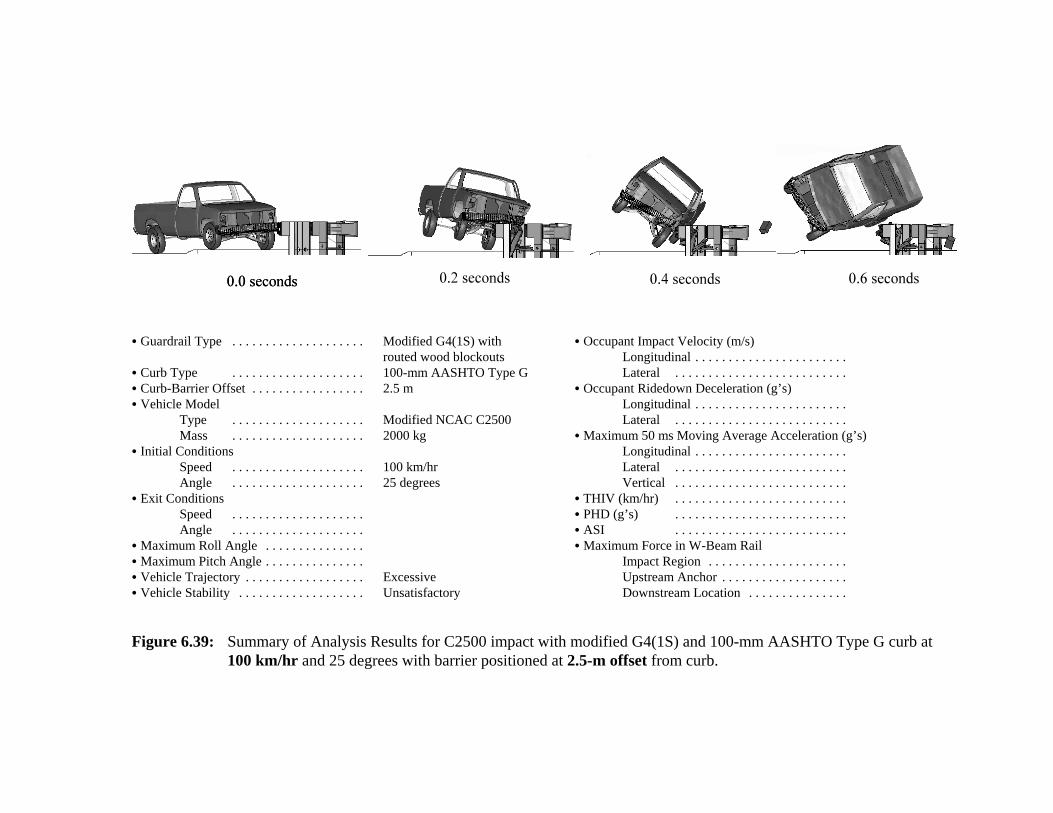
C Guardrail Type . . . . . . . . . . . . . . . . . . . . Modified G4(1S) withrouted wood blockouts
C Curb Type . . . . . . . . . . . . . . . . . . . . 100-mm AASHTO Type GC Curb-Barrier Offset . . . . . . . . . . . . . . . . . 2.5 mC Vehicle Model
Type . . . . . . . . . . . . . . . . . . . . Modified NCAC C2500Mass . . . . . . . . . . . . . . . . . . . . 2000 kg
C Initial ConditionsSpeed . . . . . . . . . . . . . . . . . . . . 100 km/hrAngle . . . . . . . . . . . . . . . . . . . . 25 degrees
C Exit Conditions Speed . . . . . . . . . . . . . . . . . . . .Angle . . . . . . . . . . . . . . . . . . . .
C Maximum Roll Angle . . . . . . . . . . . . . . .C Maximum Pitch Angle . . . . . . . . . . . . . . .C Vehicle Trajectory . . . . . . . . . . . . . . . . . . ExcessiveC Vehicle Stability . . . . . . . . . . . . . . . . . . . Unsatisfactory
C Occupant Impact Velocity (m/s)Longitudinal . . . . . . . . . . . . . . . . . . . . . . .Lateral . . . . . . . . . . . . . . . . . . . . . . . . . .
C Occupant Ridedown Deceleration (g’s)Longitudinal . . . . . . . . . . . . . . . . . . . . . . .Lateral . . . . . . . . . . . . . . . . . . . . . . . . . .
C Maximum 50 ms Moving Average Acceleration (g’s)Longitudinal . . . . . . . . . . . . . . . . . . . . . . .Lateral . . . . . . . . . . . . . . . . . . . . . . . . . .Vertical . . . . . . . . . . . . . . . . . . . . . . . . . .
C THIV (km/hr) . . . . . . . . . . . . . . . . . . . . . . . . . .C PHD (g’s) . . . . . . . . . . . . . . . . . . . . . . . . . .C ASI . . . . . . . . . . . . . . . . . . . . . . . . . .C Maximum Force in W-Beam Rail
Impact Region . . . . . . . . . . . . . . . . . . . . .Upstream Anchor . . . . . . . . . . . . . . . . . . .Downstream Location . . . . . . . . . . . . . . .
Figure 6.39: Summary of Analysis Results for C2500 impact with modified G4(1S) and 100-mm AASHTO Type G curb at100 km/hr and 25 degrees with barrier positioned at 2.5-m offset from curb.
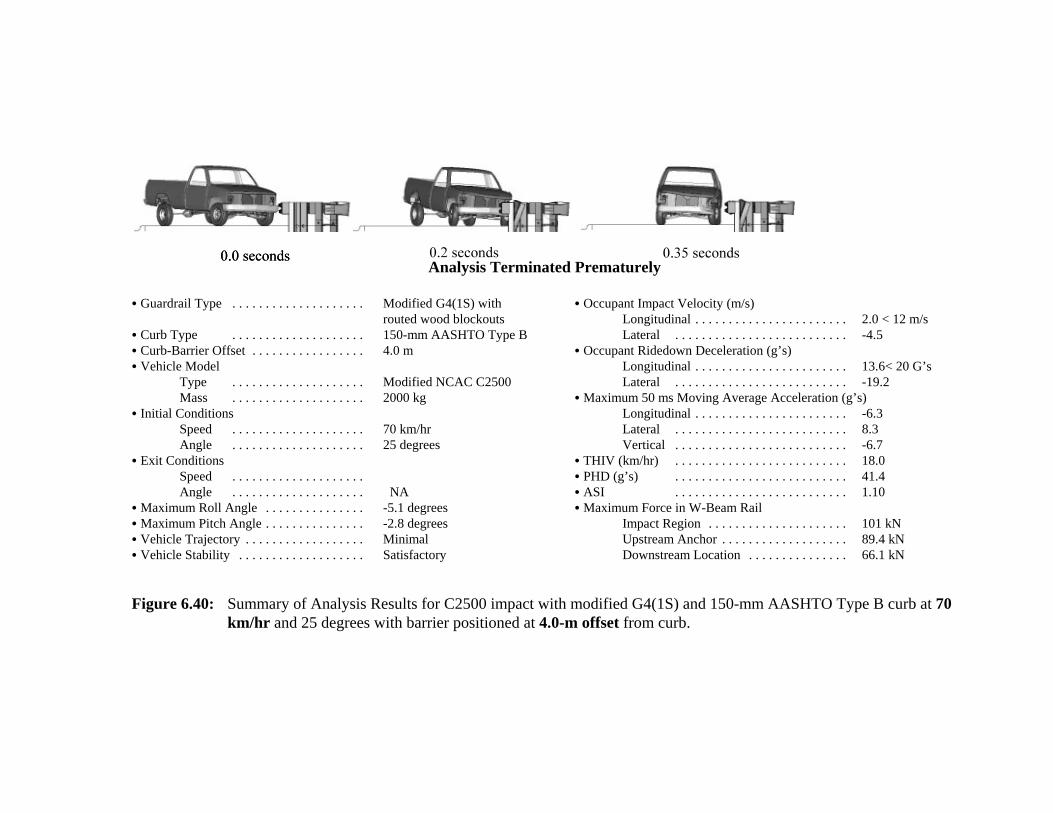
Analysis Terminated Prematurely
C Guardrail Type . . . . . . . . . . . . . . . . . . . . Modified G4(1S) withrouted wood blockouts
C Curb Type . . . . . . . . . . . . . . . . . . . . 150-mm AASHTO Type BC Curb-Barrier Offset . . . . . . . . . . . . . . . . . 4.0 mC Vehicle Model
Type . . . . . . . . . . . . . . . . . . . . Modified NCAC C2500Mass . . . . . . . . . . . . . . . . . . . . 2000 kg
C Initial ConditionsSpeed . . . . . . . . . . . . . . . . . . . . 70 km/hrAngle . . . . . . . . . . . . . . . . . . . . 25 degrees
C Exit Conditions Speed . . . . . . . . . . . . . . . . . . . .Angle . . . . . . . . . . . . . . . . . . . . NA
C Maximum Roll Angle . . . . . . . . . . . . . . . -5.1 degreesC Maximum Pitch Angle . . . . . . . . . . . . . . . -2.8 degreesC Vehicle Trajectory . . . . . . . . . . . . . . . . . . MinimalC Vehicle Stability . . . . . . . . . . . . . . . . . . . Satisfactory
C Occupant Impact Velocity (m/s)Longitudinal . . . . . . . . . . . . . . . . . . . . . . . 2.0 < 12 m/sLateral . . . . . . . . . . . . . . . . . . . . . . . . . . -4.5
C Occupant Ridedown Deceleration (g’s)Longitudinal . . . . . . . . . . . . . . . . . . . . . . . 13.6< 20 G’s Lateral . . . . . . . . . . . . . . . . . . . . . . . . . . -19.2
C Maximum 50 ms Moving Average Acceleration (g’s)Longitudinal . . . . . . . . . . . . . . . . . . . . . . . -6.3Lateral . . . . . . . . . . . . . . . . . . . . . . . . . . 8.3Vertical . . . . . . . . . . . . . . . . . . . . . . . . . . -6.7
C THIV (km/hr) . . . . . . . . . . . . . . . . . . . . . . . . . . 18.0C PHD (g’s) . . . . . . . . . . . . . . . . . . . . . . . . . . 41.4C ASI . . . . . . . . . . . . . . . . . . . . . . . . . . 1.10C Maximum Force in W-Beam Rail
Impact Region . . . . . . . . . . . . . . . . . . . . . 101 kNUpstream Anchor . . . . . . . . . . . . . . . . . . . 89.4 kNDownstream Location . . . . . . . . . . . . . . . 66.1 kN
Figure 6.40: Summary of Analysis Results for C2500 impact with modified G4(1S) and 150-mm AASHTO Type B curb at 70km/hr and 25 degrees with barrier positioned at 4.0-m offset from curb.
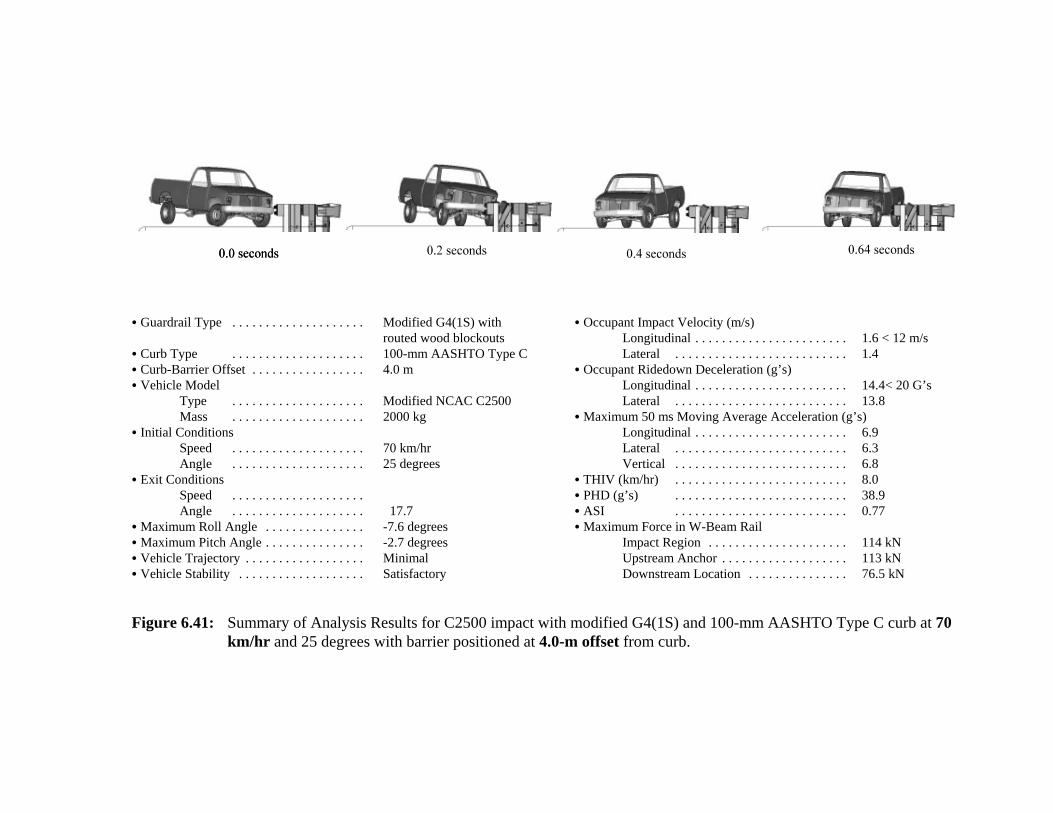
C Guardrail Type . . . . . . . . . . . . . . . . . . . . Modified G4(1S) withrouted wood blockouts
C Curb Type . . . . . . . . . . . . . . . . . . . . 100-mm AASHTO Type CC Curb-Barrier Offset . . . . . . . . . . . . . . . . . 4.0 mC Vehicle Model
Type . . . . . . . . . . . . . . . . . . . . Modified NCAC C2500Mass . . . . . . . . . . . . . . . . . . . . 2000 kg
C Initial ConditionsSpeed . . . . . . . . . . . . . . . . . . . . 70 km/hrAngle . . . . . . . . . . . . . . . . . . . . 25 degrees
C Exit Conditions Speed . . . . . . . . . . . . . . . . . . . .Angle . . . . . . . . . . . . . . . . . . . . 17.7
C Maximum Roll Angle . . . . . . . . . . . . . . . -7.6 degreesC Maximum Pitch Angle . . . . . . . . . . . . . . . -2.7 degreesC Vehicle Trajectory . . . . . . . . . . . . . . . . . . MinimalC Vehicle Stability . . . . . . . . . . . . . . . . . . . Satisfactory
C Occupant Impact Velocity (m/s)Longitudinal . . . . . . . . . . . . . . . . . . . . . . . 1.6 < 12 m/sLateral . . . . . . . . . . . . . . . . . . . . . . . . . . 1.4
C Occupant Ridedown Deceleration (g’s)Longitudinal . . . . . . . . . . . . . . . . . . . . . . . 14.4< 20 G’s Lateral . . . . . . . . . . . . . . . . . . . . . . . . . . 13.8
C Maximum 50 ms Moving Average Acceleration (g’s)Longitudinal . . . . . . . . . . . . . . . . . . . . . . . 6.9Lateral . . . . . . . . . . . . . . . . . . . . . . . . . . 6.3Vertical . . . . . . . . . . . . . . . . . . . . . . . . . . 6.8
C THIV (km/hr) . . . . . . . . . . . . . . . . . . . . . . . . . . 8.0C PHD (g’s) . . . . . . . . . . . . . . . . . . . . . . . . . . 38.9C ASI . . . . . . . . . . . . . . . . . . . . . . . . . . 0.77C Maximum Force in W-Beam Rail
Impact Region . . . . . . . . . . . . . . . . . . . . . 114 kNUpstream Anchor . . . . . . . . . . . . . . . . . . . 113 kNDownstream Location . . . . . . . . . . . . . . . 76.5 kN
Figure 6.41: Summary of Analysis Results for C2500 impact with modified G4(1S) and 100-mm AASHTO Type C curb at 70km/hr and 25 degrees with barrier positioned at 4.0-m offset from curb.
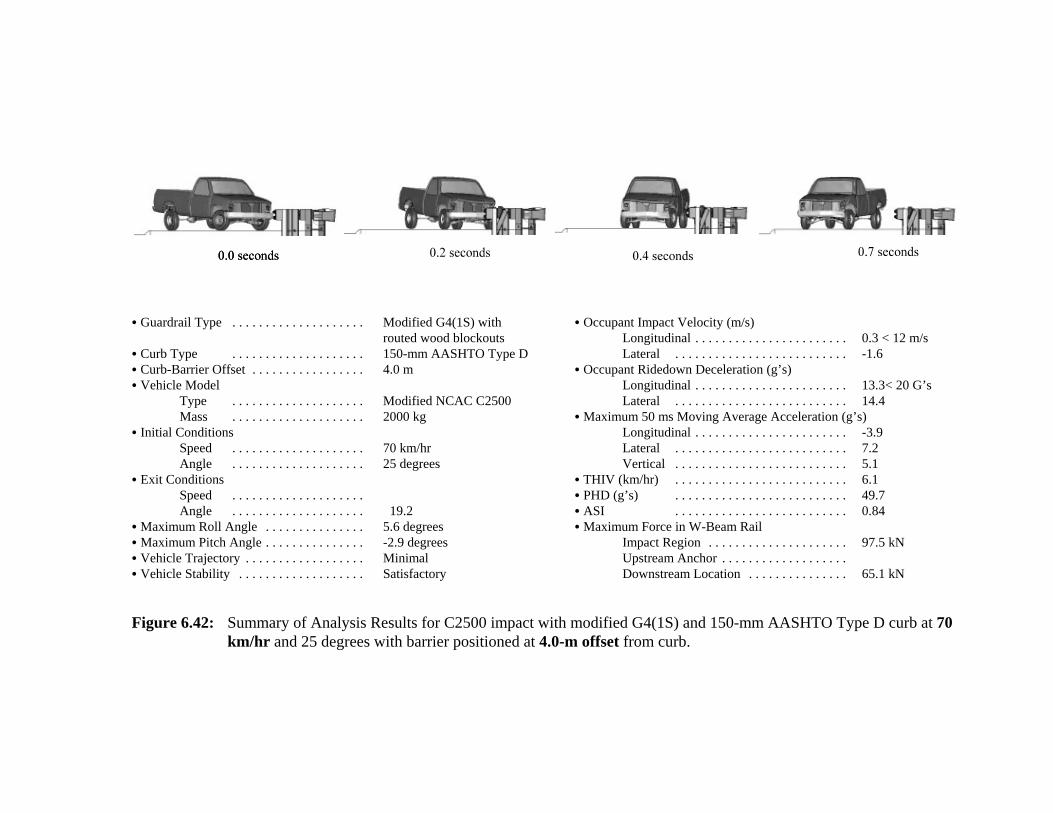
C Guardrail Type . . . . . . . . . . . . . . . . . . . . Modified G4(1S) withrouted wood blockouts
C Curb Type . . . . . . . . . . . . . . . . . . . . 150-mm AASHTO Type DC Curb-Barrier Offset . . . . . . . . . . . . . . . . . 4.0 mC Vehicle Model
Type . . . . . . . . . . . . . . . . . . . . Modified NCAC C2500Mass . . . . . . . . . . . . . . . . . . . . 2000 kg
C Initial ConditionsSpeed . . . . . . . . . . . . . . . . . . . . 70 km/hrAngle . . . . . . . . . . . . . . . . . . . . 25 degrees
C Exit Conditions Speed . . . . . . . . . . . . . . . . . . . .Angle . . . . . . . . . . . . . . . . . . . . 19.2
C Maximum Roll Angle . . . . . . . . . . . . . . . 5.6 degreesC Maximum Pitch Angle . . . . . . . . . . . . . . . -2.9 degreesC Vehicle Trajectory . . . . . . . . . . . . . . . . . . MinimalC Vehicle Stability . . . . . . . . . . . . . . . . . . . Satisfactory
C Occupant Impact Velocity (m/s)Longitudinal . . . . . . . . . . . . . . . . . . . . . . . 0.3 < 12 m/sLateral . . . . . . . . . . . . . . . . . . . . . . . . . . -1.6
C Occupant Ridedown Deceleration (g’s)Longitudinal . . . . . . . . . . . . . . . . . . . . . . . 13.3< 20 G’s Lateral . . . . . . . . . . . . . . . . . . . . . . . . . . 14.4
C Maximum 50 ms Moving Average Acceleration (g’s)Longitudinal . . . . . . . . . . . . . . . . . . . . . . . -3.9Lateral . . . . . . . . . . . . . . . . . . . . . . . . . . 7.2Vertical . . . . . . . . . . . . . . . . . . . . . . . . . . 5.1
C THIV (km/hr) . . . . . . . . . . . . . . . . . . . . . . . . . . 6.1C PHD (g’s) . . . . . . . . . . . . . . . . . . . . . . . . . . 49.7C ASI . . . . . . . . . . . . . . . . . . . . . . . . . . 0.84C Maximum Force in W-Beam Rail
Impact Region . . . . . . . . . . . . . . . . . . . . . 97.5 kNUpstream Anchor . . . . . . . . . . . . . . . . . . .Downstream Location . . . . . . . . . . . . . . . 65.1 kN
Figure 6.42: Summary of Analysis Results for C2500 impact with modified G4(1S) and 150-mm AASHTO Type D curb at 70km/hr and 25 degrees with barrier positioned at 4.0-m offset from curb.
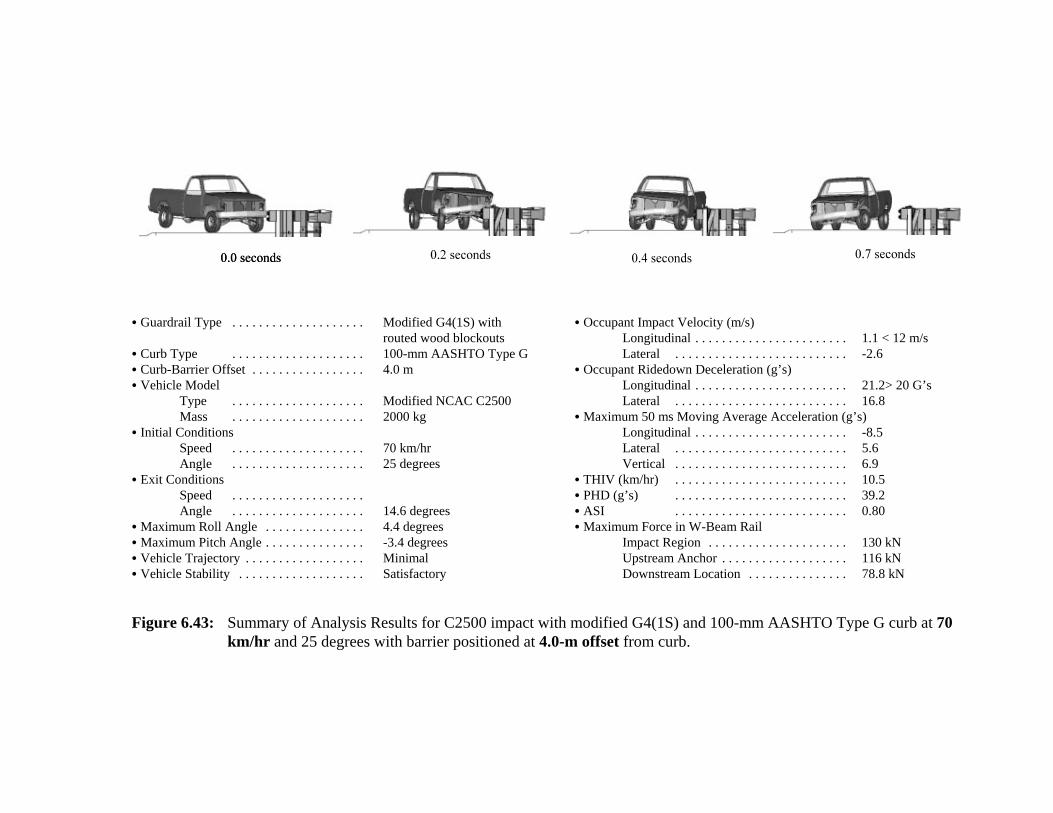
C Guardrail Type . . . . . . . . . . . . . . . . . . . . Modified G4(1S) withrouted wood blockouts
C Curb Type . . . . . . . . . . . . . . . . . . . . 100-mm AASHTO Type GC Curb-Barrier Offset . . . . . . . . . . . . . . . . . 4.0 mC Vehicle Model
Type . . . . . . . . . . . . . . . . . . . . Modified NCAC C2500Mass . . . . . . . . . . . . . . . . . . . . 2000 kg
C Initial ConditionsSpeed . . . . . . . . . . . . . . . . . . . . 70 km/hrAngle . . . . . . . . . . . . . . . . . . . . 25 degrees
C Exit Conditions Speed . . . . . . . . . . . . . . . . . . . .Angle . . . . . . . . . . . . . . . . . . . . 14.6 degrees
C Maximum Roll Angle . . . . . . . . . . . . . . . 4.4 degreesC Maximum Pitch Angle . . . . . . . . . . . . . . . -3.4 degreesC Vehicle Trajectory . . . . . . . . . . . . . . . . . . MinimalC Vehicle Stability . . . . . . . . . . . . . . . . . . . Satisfactory
C Occupant Impact Velocity (m/s)Longitudinal . . . . . . . . . . . . . . . . . . . . . . . 1.1 < 12 m/sLateral . . . . . . . . . . . . . . . . . . . . . . . . . . -2.6
C Occupant Ridedown Deceleration (g’s)Longitudinal . . . . . . . . . . . . . . . . . . . . . . . 21.2> 20 G’s Lateral . . . . . . . . . . . . . . . . . . . . . . . . . . 16.8
C Maximum 50 ms Moving Average Acceleration (g’s)Longitudinal . . . . . . . . . . . . . . . . . . . . . . . -8.5Lateral . . . . . . . . . . . . . . . . . . . . . . . . . . 5.6Vertical . . . . . . . . . . . . . . . . . . . . . . . . . . 6.9
C THIV (km/hr) . . . . . . . . . . . . . . . . . . . . . . . . . . 10.5C PHD (g’s) . . . . . . . . . . . . . . . . . . . . . . . . . . 39.2C ASI . . . . . . . . . . . . . . . . . . . . . . . . . . 0.80C Maximum Force in W-Beam Rail
Impact Region . . . . . . . . . . . . . . . . . . . . . 130 kNUpstream Anchor . . . . . . . . . . . . . . . . . . . 116 kNDownstream Location . . . . . . . . . . . . . . . 78.8 kN
Figure 6.43: Summary of Analysis Results for C2500 impact with modified G4(1S) and 100-mm AASHTO Type G curb at 70km/hr and 25 degrees with barrier positioned at 4.0-m offset from curb.
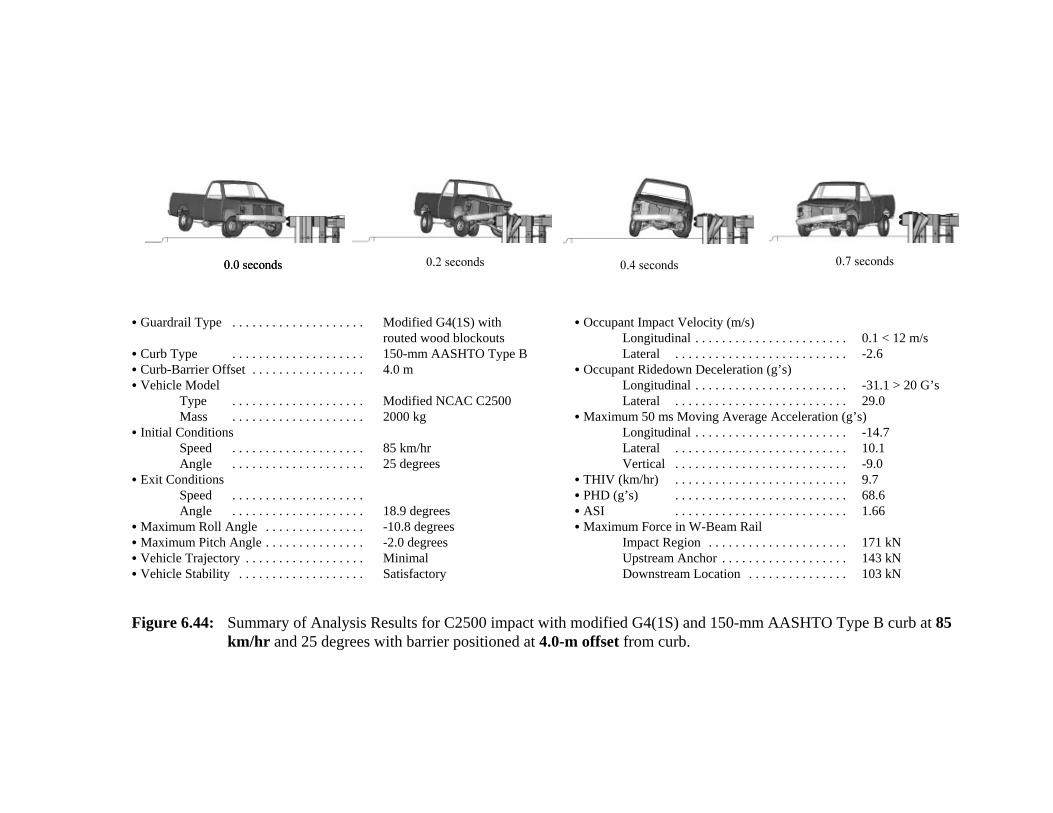
C Guardrail Type . . . . . . . . . . . . . . . . . . . . Modified G4(1S) withrouted wood blockouts
C Curb Type . . . . . . . . . . . . . . . . . . . . 150-mm AASHTO Type BC Curb-Barrier Offset . . . . . . . . . . . . . . . . . 4.0 mC Vehicle Model
Type . . . . . . . . . . . . . . . . . . . . Modified NCAC C2500Mass . . . . . . . . . . . . . . . . . . . . 2000 kg
C Initial ConditionsSpeed . . . . . . . . . . . . . . . . . . . . 85 km/hrAngle . . . . . . . . . . . . . . . . . . . . 25 degrees
C Exit Conditions Speed . . . . . . . . . . . . . . . . . . . .Angle . . . . . . . . . . . . . . . . . . . . 18.9 degrees
C Maximum Roll Angle . . . . . . . . . . . . . . . -10.8 degreesC Maximum Pitch Angle . . . . . . . . . . . . . . . -2.0 degreesC Vehicle Trajectory . . . . . . . . . . . . . . . . . . MinimalC Vehicle Stability . . . . . . . . . . . . . . . . . . . Satisfactory
C Occupant Impact Velocity (m/s)Longitudinal . . . . . . . . . . . . . . . . . . . . . . . 0.1 < 12 m/sLateral . . . . . . . . . . . . . . . . . . . . . . . . . . -2.6
C Occupant Ridedown Deceleration (g’s)Longitudinal . . . . . . . . . . . . . . . . . . . . . . . -31.1 > 20 G’s Lateral . . . . . . . . . . . . . . . . . . . . . . . . . . 29.0
C Maximum 50 ms Moving Average Acceleration (g’s)Longitudinal . . . . . . . . . . . . . . . . . . . . . . . -14.7Lateral . . . . . . . . . . . . . . . . . . . . . . . . . . 10.1Vertical . . . . . . . . . . . . . . . . . . . . . . . . . . -9.0
C THIV (km/hr) . . . . . . . . . . . . . . . . . . . . . . . . . . 9.7C PHD (g’s) . . . . . . . . . . . . . . . . . . . . . . . . . . 68.6C ASI . . . . . . . . . . . . . . . . . . . . . . . . . . 1.66C Maximum Force in W-Beam Rail
Impact Region . . . . . . . . . . . . . . . . . . . . . 171 kNUpstream Anchor . . . . . . . . . . . . . . . . . . . 143 kNDownstream Location . . . . . . . . . . . . . . . 103 kN
Figure 6.44: Summary of Analysis Results for C2500 impact with modified G4(1S) and 150-mm AASHTO Type B curb at 85km/hr and 25 degrees with barrier positioned at 4.0-m offset from curb.
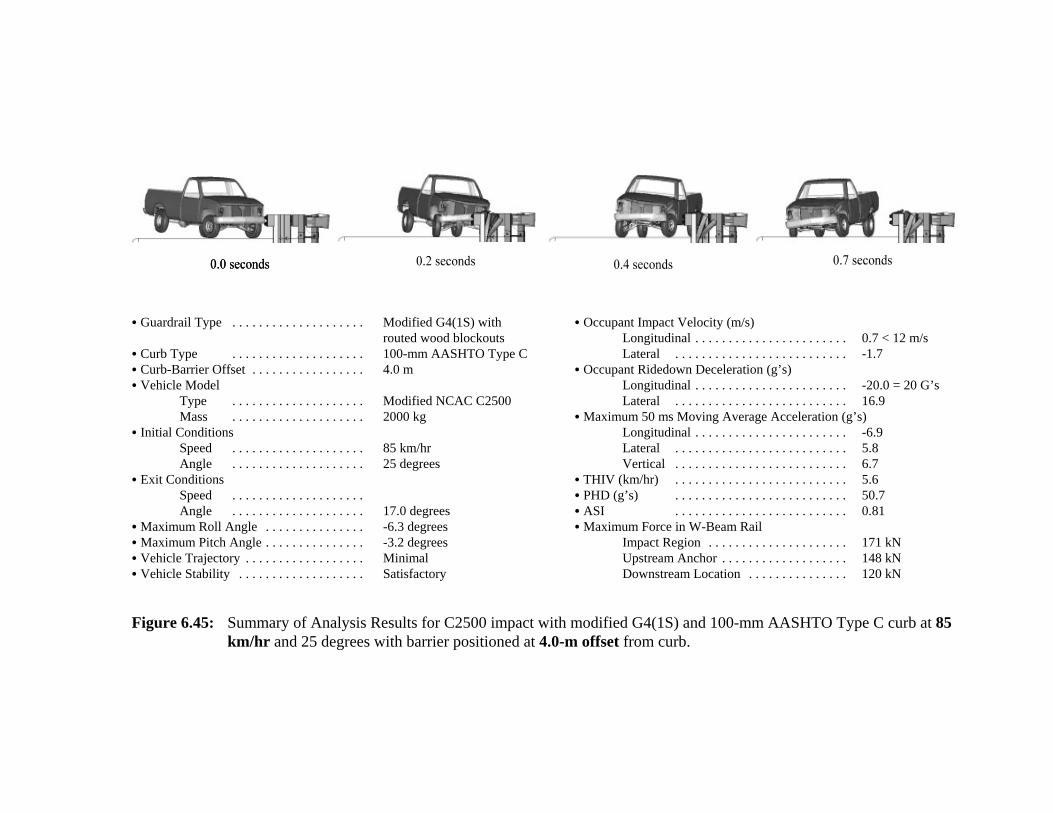
C Guardrail Type . . . . . . . . . . . . . . . . . . . . Modified G4(1S) withrouted wood blockouts
C Curb Type . . . . . . . . . . . . . . . . . . . . 100-mm AASHTO Type CC Curb-Barrier Offset . . . . . . . . . . . . . . . . . 4.0 mC Vehicle Model
Type . . . . . . . . . . . . . . . . . . . . Modified NCAC C2500Mass . . . . . . . . . . . . . . . . . . . . 2000 kg
C Initial ConditionsSpeed . . . . . . . . . . . . . . . . . . . . 85 km/hrAngle . . . . . . . . . . . . . . . . . . . . 25 degrees
C Exit Conditions Speed . . . . . . . . . . . . . . . . . . . .Angle . . . . . . . . . . . . . . . . . . . . 17.0 degrees
C Maximum Roll Angle . . . . . . . . . . . . . . . -6.3 degreesC Maximum Pitch Angle . . . . . . . . . . . . . . . -3.2 degreesC Vehicle Trajectory . . . . . . . . . . . . . . . . . . MinimalC Vehicle Stability . . . . . . . . . . . . . . . . . . . Satisfactory
C Occupant Impact Velocity (m/s)Longitudinal . . . . . . . . . . . . . . . . . . . . . . . 0.7 < 12 m/sLateral . . . . . . . . . . . . . . . . . . . . . . . . . . -1.7
C Occupant Ridedown Deceleration (g’s)Longitudinal . . . . . . . . . . . . . . . . . . . . . . . -20.0 = 20 G’s Lateral . . . . . . . . . . . . . . . . . . . . . . . . . . 16.9
C Maximum 50 ms Moving Average Acceleration (g’s)Longitudinal . . . . . . . . . . . . . . . . . . . . . . . -6.9Lateral . . . . . . . . . . . . . . . . . . . . . . . . . . 5.8Vertical . . . . . . . . . . . . . . . . . . . . . . . . . . 6.7
C THIV (km/hr) . . . . . . . . . . . . . . . . . . . . . . . . . . 5.6C PHD (g’s) . . . . . . . . . . . . . . . . . . . . . . . . . . 50.7C ASI . . . . . . . . . . . . . . . . . . . . . . . . . . 0.81C Maximum Force in W-Beam Rail
Impact Region . . . . . . . . . . . . . . . . . . . . . 171 kNUpstream Anchor . . . . . . . . . . . . . . . . . . . 148 kNDownstream Location . . . . . . . . . . . . . . . 120 kN
Figure 6.45: Summary of Analysis Results for C2500 impact with modified G4(1S) and 100-mm AASHTO Type C curb at 85km/hr and 25 degrees with barrier positioned at 4.0-m offset from curb.
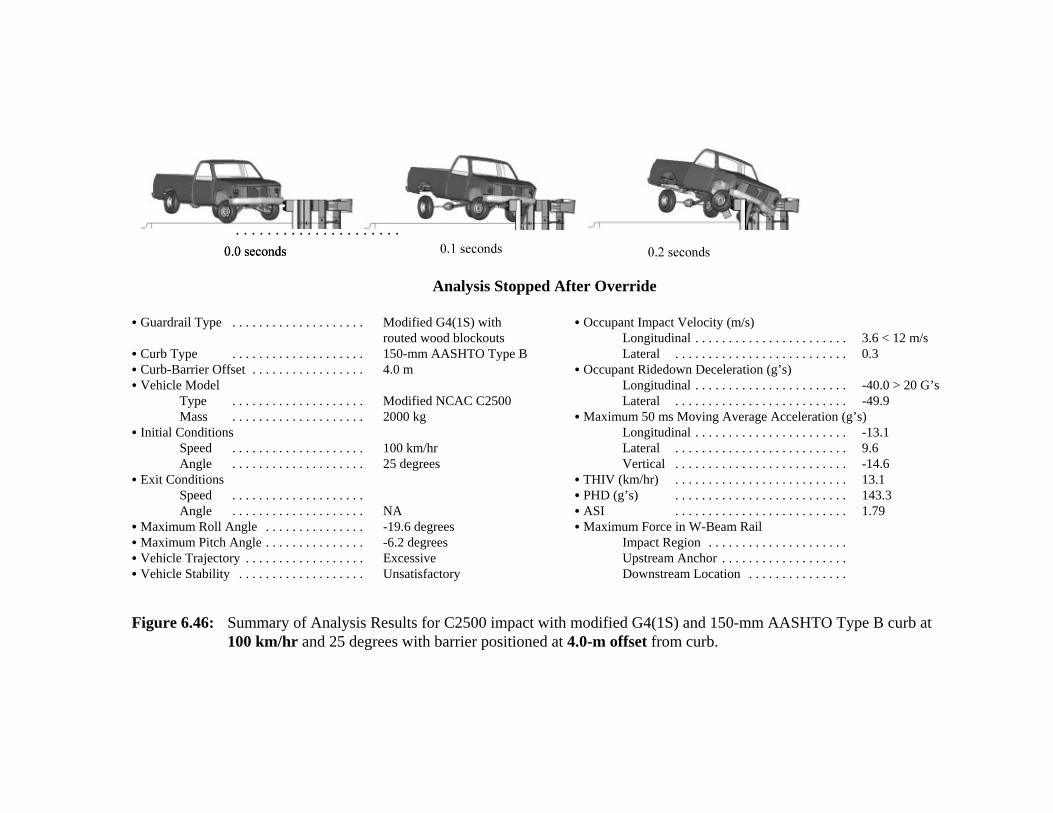
. . . . . . . . . . . . . . . . . . . . .
Analysis Stopped After Override
C Guardrail Type . . . . . . . . . . . . . . . . . . . . Modified G4(1S) withrouted wood blockouts
C Curb Type . . . . . . . . . . . . . . . . . . . . 150-mm AASHTO Type BC Curb-Barrier Offset . . . . . . . . . . . . . . . . . 4.0 mC Vehicle Model
Type . . . . . . . . . . . . . . . . . . . . Modified NCAC C2500Mass . . . . . . . . . . . . . . . . . . . . 2000 kg
C Initial ConditionsSpeed . . . . . . . . . . . . . . . . . . . . 100 km/hrAngle . . . . . . . . . . . . . . . . . . . . 25 degrees
C Exit Conditions Speed . . . . . . . . . . . . . . . . . . . .Angle . . . . . . . . . . . . . . . . . . . . NA
C Maximum Roll Angle . . . . . . . . . . . . . . . -19.6 degreesC Maximum Pitch Angle . . . . . . . . . . . . . . . -6.2 degreesC Vehicle Trajectory . . . . . . . . . . . . . . . . . . ExcessiveC Vehicle Stability . . . . . . . . . . . . . . . . . . . Unsatisfactory
C Occupant Impact Velocity (m/s)Longitudinal . . . . . . . . . . . . . . . . . . . . . . . 3.6 < 12 m/sLateral . . . . . . . . . . . . . . . . . . . . . . . . . . 0.3
C Occupant Ridedown Deceleration (g’s)Longitudinal . . . . . . . . . . . . . . . . . . . . . . . -40.0 > 20 G’s Lateral . . . . . . . . . . . . . . . . . . . . . . . . . . -49.9
C Maximum 50 ms Moving Average Acceleration (g’s)Longitudinal . . . . . . . . . . . . . . . . . . . . . . . -13.1Lateral . . . . . . . . . . . . . . . . . . . . . . . . . . 9.6Vertical . . . . . . . . . . . . . . . . . . . . . . . . . . -14.6
C THIV (km/hr) . . . . . . . . . . . . . . . . . . . . . . . . . . 13.1C PHD (g’s) . . . . . . . . . . . . . . . . . . . . . . . . . . 143.3C ASI . . . . . . . . . . . . . . . . . . . . . . . . . . 1.79C Maximum Force in W-Beam Rail
Impact Region . . . . . . . . . . . . . . . . . . . . .Upstream Anchor . . . . . . . . . . . . . . . . . . .Downstream Location . . . . . . . . . . . . . . .
Figure 6.46: Summary of Analysis Results for C2500 impact with modified G4(1S) and 150-mm AASHTO Type B curb at100 km/hr and 25 degrees with barrier positioned at 4.0-m offset from curb.
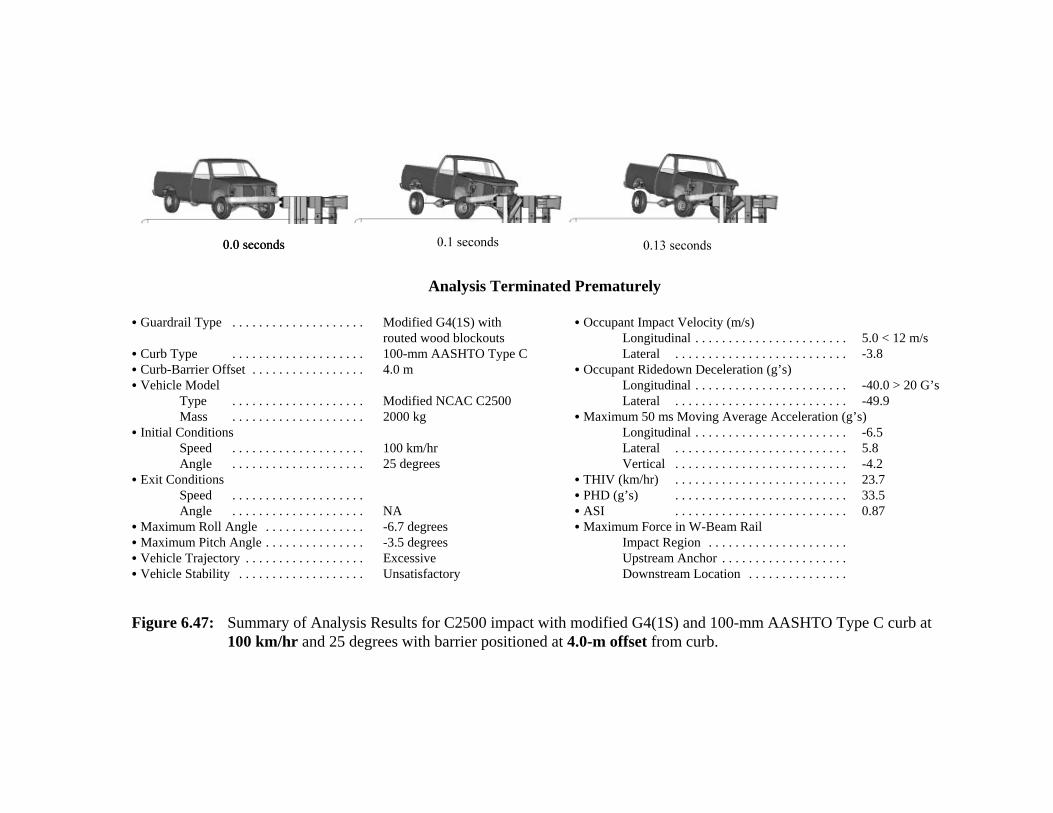
Analysis Terminated Prematurely
C Guardrail Type . . . . . . . . . . . . . . . . . . . . Modified G4(1S) withrouted wood blockouts
C Curb Type . . . . . . . . . . . . . . . . . . . . 100-mm AASHTO Type CC Curb-Barrier Offset . . . . . . . . . . . . . . . . . 4.0 mC Vehicle Model
Type . . . . . . . . . . . . . . . . . . . . Modified NCAC C2500Mass . . . . . . . . . . . . . . . . . . . . 2000 kg
C Initial ConditionsSpeed . . . . . . . . . . . . . . . . . . . . 100 km/hrAngle . . . . . . . . . . . . . . . . . . . . 25 degrees
C Exit Conditions Speed . . . . . . . . . . . . . . . . . . . .Angle . . . . . . . . . . . . . . . . . . . . NA
C Maximum Roll Angle . . . . . . . . . . . . . . . -6.7 degrees C Maximum Pitch Angle . . . . . . . . . . . . . . . -3.5 degrees C Vehicle Trajectory . . . . . . . . . . . . . . . . . . ExcessiveC Vehicle Stability . . . . . . . . . . . . . . . . . . . Unsatisfactory
C Occupant Impact Velocity (m/s)Longitudinal . . . . . . . . . . . . . . . . . . . . . . . 5.0 < 12 m/sLateral . . . . . . . . . . . . . . . . . . . . . . . . . . -3.8
C Occupant Ridedown Deceleration (g’s)Longitudinal . . . . . . . . . . . . . . . . . . . . . . . -40.0 > 20 G’s Lateral . . . . . . . . . . . . . . . . . . . . . . . . . . -49.9
C Maximum 50 ms Moving Average Acceleration (g’s)Longitudinal . . . . . . . . . . . . . . . . . . . . . . . -6.5Lateral . . . . . . . . . . . . . . . . . . . . . . . . . . 5.8Vertical . . . . . . . . . . . . . . . . . . . . . . . . . . -4.2
C THIV (km/hr) . . . . . . . . . . . . . . . . . . . . . . . . . . 23.7C PHD (g’s) . . . . . . . . . . . . . . . . . . . . . . . . . . 33.5C ASI . . . . . . . . . . . . . . . . . . . . . . . . . . 0.87C Maximum Force in W-Beam Rail
Impact Region . . . . . . . . . . . . . . . . . . . . .Upstream Anchor . . . . . . . . . . . . . . . . . . .Downstream Location . . . . . . . . . . . . . . .
Figure 6.47: Summary of Analysis Results for C2500 impact with modified G4(1S) and 100-mm AASHTO Type C curb at100 km/hr and 25 degrees with barrier positioned at 4.0-m offset from curb.
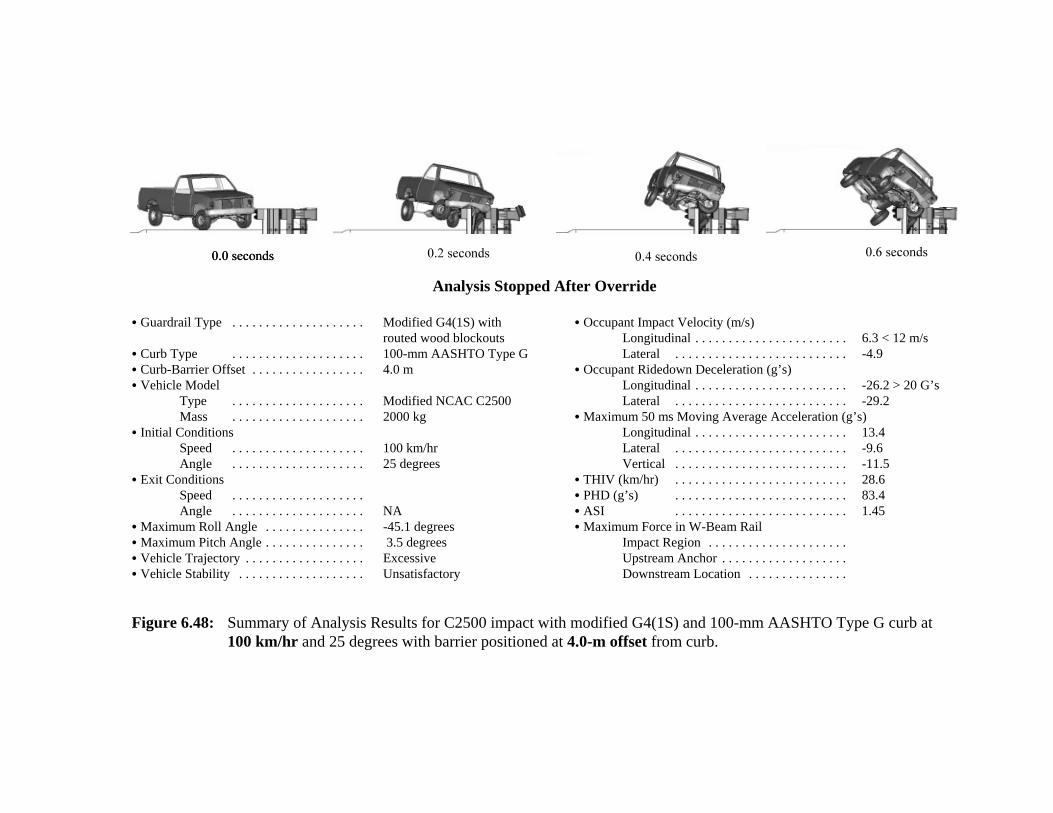
Analysis Stopped After Override
C Guardrail Type . . . . . . . . . . . . . . . . . . . . Modified G4(1S) withrouted wood blockouts
C Curb Type . . . . . . . . . . . . . . . . . . . . 100-mm AASHTO Type GC Curb-Barrier Offset . . . . . . . . . . . . . . . . . 4.0 mC Vehicle Model
Type . . . . . . . . . . . . . . . . . . . . Modified NCAC C2500Mass . . . . . . . . . . . . . . . . . . . . 2000 kg
C Initial ConditionsSpeed . . . . . . . . . . . . . . . . . . . . 100 km/hrAngle . . . . . . . . . . . . . . . . . . . . 25 degrees
C Exit Conditions Speed . . . . . . . . . . . . . . . . . . . .Angle . . . . . . . . . . . . . . . . . . . . NA
C Maximum Roll Angle . . . . . . . . . . . . . . . -45.1 degrees C Maximum Pitch Angle . . . . . . . . . . . . . . . 3.5 degrees C Vehicle Trajectory . . . . . . . . . . . . . . . . . . ExcessiveC Vehicle Stability . . . . . . . . . . . . . . . . . . . Unsatisfactory
C Occupant Impact Velocity (m/s)Longitudinal . . . . . . . . . . . . . . . . . . . . . . . 6.3 < 12 m/sLateral . . . . . . . . . . . . . . . . . . . . . . . . . . -4.9
C Occupant Ridedown Deceleration (g’s)Longitudinal . . . . . . . . . . . . . . . . . . . . . . . -26.2 > 20 G’s Lateral . . . . . . . . . . . . . . . . . . . . . . . . . . -29.2
C Maximum 50 ms Moving Average Acceleration (g’s)Longitudinal . . . . . . . . . . . . . . . . . . . . . . . 13.4Lateral . . . . . . . . . . . . . . . . . . . . . . . . . . -9.6Vertical . . . . . . . . . . . . . . . . . . . . . . . . . . -11.5
C THIV (km/hr) . . . . . . . . . . . . . . . . . . . . . . . . . . 28.6C PHD (g’s) . . . . . . . . . . . . . . . . . . . . . . . . . . 83.4C ASI . . . . . . . . . . . . . . . . . . . . . . . . . . 1.45C Maximum Force in W-Beam Rail
Impact Region . . . . . . . . . . . . . . . . . . . . .Upstream Anchor . . . . . . . . . . . . . . . . . . .Downstream Location . . . . . . . . . . . . . . .
Figure 6.48: Summary of Analysis Results for C2500 impact with modified G4(1S) and 100-mm AASHTO Type G curb at100 km/hr and 25 degrees with barrier positioned at 4.0-m offset from curb.
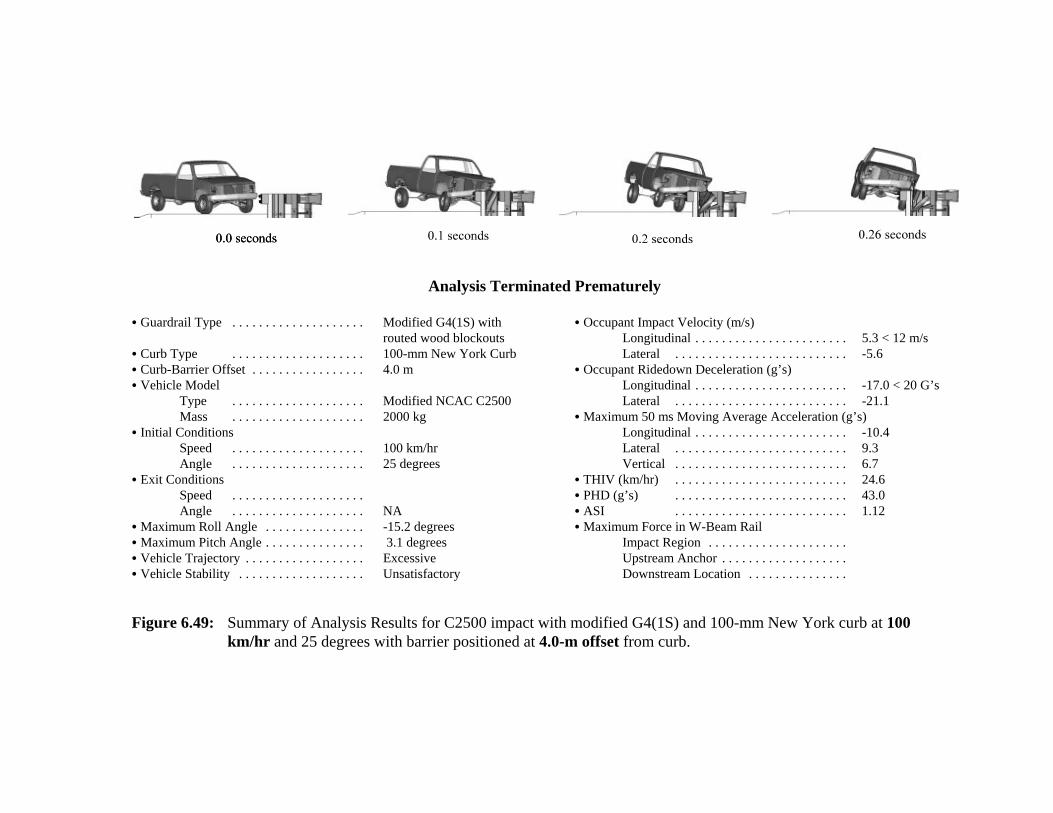
Analysis Terminated Prematurely
C Guardrail Type . . . . . . . . . . . . . . . . . . . . Modified G4(1S) withrouted wood blockouts
C Curb Type . . . . . . . . . . . . . . . . . . . . 100-mm New York CurbC Curb-Barrier Offset . . . . . . . . . . . . . . . . . 4.0 mC Vehicle Model
Type . . . . . . . . . . . . . . . . . . . . Modified NCAC C2500Mass . . . . . . . . . . . . . . . . . . . . 2000 kg
C Initial ConditionsSpeed . . . . . . . . . . . . . . . . . . . . 100 km/hrAngle . . . . . . . . . . . . . . . . . . . . 25 degrees
C Exit Conditions Speed . . . . . . . . . . . . . . . . . . . .Angle . . . . . . . . . . . . . . . . . . . . NA
C Maximum Roll Angle . . . . . . . . . . . . . . . -15.2 degrees C Maximum Pitch Angle . . . . . . . . . . . . . . . 3.1 degrees C Vehicle Trajectory . . . . . . . . . . . . . . . . . . ExcessiveC Vehicle Stability . . . . . . . . . . . . . . . . . . . Unsatisfactory
C Occupant Impact Velocity (m/s)Longitudinal . . . . . . . . . . . . . . . . . . . . . . . 5.3 < 12 m/sLateral . . . . . . . . . . . . . . . . . . . . . . . . . . -5.6
C Occupant Ridedown Deceleration (g’s)Longitudinal . . . . . . . . . . . . . . . . . . . . . . . -17.0 < 20 G’s Lateral . . . . . . . . . . . . . . . . . . . . . . . . . . -21.1
C Maximum 50 ms Moving Average Acceleration (g’s)Longitudinal . . . . . . . . . . . . . . . . . . . . . . . -10.4Lateral . . . . . . . . . . . . . . . . . . . . . . . . . . 9.3Vertical . . . . . . . . . . . . . . . . . . . . . . . . . . 6.7
C THIV (km/hr) . . . . . . . . . . . . . . . . . . . . . . . . . . 24.6C PHD (g’s) . . . . . . . . . . . . . . . . . . . . . . . . . . 43.0C ASI . . . . . . . . . . . . . . . . . . . . . . . . . . 1.12C Maximum Force in W-Beam Rail
Impact Region . . . . . . . . . . . . . . . . . . . . .Upstream Anchor . . . . . . . . . . . . . . . . . . .Downstream Location . . . . . . . . . . . . . . .
Figure 6.49: Summary of Analysis Results for C2500 impact with modified G4(1S) and 100-mm New York curb at 100km/hr and 25 degrees with barrier positioned at 4.0-m offset from curb.
283
VII. SYNTHESIS OF ANALYSIS RESULTS
7.1 Introduction
The analyses of vehicle impact with curbs and curb-barrier combinations conducted in
this study were limited to one vehicle type, a 2000-kg pickup truck. Thus, guidelines
based solely on the results of those analyses would only be applicable to that one type of
vehicle. In order to develop a more general set of guidelines, additional data is needed
that will provide more information about the response of a broader range of vehicle types.
The literature provides an adequate amount of information on the response of various
types of cars traversing curbs and also a limited amount of information from the results of
full-scale crash tests regarding both cars and pickup trucks impacting curb-barrier
combinations. The information from the current study will be synthesized and combined
with the results of prior studies such that general guidelines can be developed for the use
and installation of curbs and curb-barrier combinations along high-speed roadways.
There are many factors that influence vehicle behavior when traversing curbs, such as
abrupt steering caused by the interaction of the front wheels with the curb, loss of contact
between the tires and ground, excessive vehicle accelerations and excessive roll, pitch
and yaw rates of the vehicle during impact. Each of these factors may lead to loss of
control of the vehicle, however, all the data that have been collected from full-scale tests
and computer simulations suggests that total loss of control is unlikely except in extreme
cases. A more important issue, however, may be the effects that these factors precipitate
when curbs are placed in combination with roadside barriers (e.g., guardrail, crash
284
cushions, breakaway poles, etc). The trajectory of a vehicle after crossing a curb may be
insignificant regarding the potential for losing control of the vehicle, but even a slight
increase in bumper height during trajectory may be sufficient to cause the vehicle to
impact a roadside safety device at a point higher or lower than normal, which may lead to
override or underride of roadside barriers or may adversely affect the breakaway
mechanism of roadside hardware devices.
Two of the studies identified in the literature addressed the issue of override and
underride indirectly using both full-scale testing and computer simulation: Olsen et al.
(22) and Holloway et al.(25). In those studies the response of various types of cars
traversing a number of different curb types was obtained and the information was used to
assess vehicle stability and to estimate the potential for barrier override and underride.
The types of data that were collected in their studies were roll and pitch displacement-
time histories and also relative bumper trajectory-time history of the vehicles when
traversing curbs. There were various impact conditions and curb types investigated in
those studies, however, all impact conditions were considered equally likely since data
are not available to discern the most probable impact conditions of roadside accidents.
Only the maximum values of angular displacement and bumper heights during trajectory
from the various studies will be considered when synthesizing the data. It should be
noted that the maximum encroachment angle of both the Olsen et al. study and the
Holloway et al. study was 20 degrees, whereas the maximum encroachment angle used in
the current study was 25 degrees. Furthermore, the vehicle used in the Olsen et al. study
285
was a 1965 Ford four-door sedan and it may be questionable whether or not those results
are representative of the current vehicle fleet. The results and conclusions from Olsen�s
study, however, were similar to those obtained in both the Holloway et al. study and the
current study.
7.2 Vehicle Curb Traversal Tests and Simulation Results
The vehicle encroachment angle and speed in the various studies ranged from 5 degrees
to 25 degrees and 48 km/hr to 120 km/hr, respectively.
7.2.1 Maximum Roll and Pitch Angles
Based on the results of this research and on conclusions made in previous studies the
following statements can be made. Maximum roll angles of vehicles crossing curbs
decrease as encroachment angles increase, and they are only slightly affected by impact
speed. The maximum roll angle also increases as curb height increases, but curb shape
has very little influence on roll angle, especially at higher impact speeds. Maximum pitch
angle increases as encroachment angle increases, but tends to be independent of vehicle
speed. The maximum pitch angle increases slightly as curb height increases, but curb
shape has no discernable influence on pitch angle.
Table 7.1 provides a summary of the maximum roll and pitch angles of vehicles crossing
various types of curbs for particular vehicle types and for a range of impact conditions.
For the cases involving both small and large cars crossing 150 mm high curbs, the
286
maximum roll angle ranged from 11.0 to 12.4 degrees, whereas, the pickup truck crossing
150 mm high curbs resulted in a maximum roll angle of 7.6 degrees. The maximum pitch
angles in all cases of vehicles crossing 150 mm high curbs were very low and ranged
from 1.8 to 3.3 degrees.
For cases involving the small and large cars crossing 100 mm high curbs, the maximum
roll angle ranged from 7.0 to 8.1 degrees, and the maximum roll angle of the pickup truck
was 6.0 degrees. As with the 150-mm curb cases, the maximum pitch angles of vehicles
crossing the 100 mm high curbs were insignificant and ranged from 0.7 to 2.7 degrees.
7.2.2 Front Bumper Trajectory
The trajectory of the front bumper is dependent on curb shape. As curb height increases
and as the slope of the curb face increases, the maximum vertical position of the front
bumper increases. Curb height, however, has much more influence than does the slope of
the curb face. Regarding impact conditions, the maximum vertical component of
trajectory of the bumper is nearly independent of encroachment speed, but it increases as
impact angle increases.
Table 7.1 provides a summary of lateral offset distances for which bumper trajectory
plots indicate a potential for vehicle underride and override of a standard strong-post w-
beam guardrail system. Considering the results from all studies, underride is possible for
cases involving cars impacting 150-mm curbs placed in conjunction with a w-beam
287
guardrail when the barrier is offset at distances less than 1.1 m from the curb. The studies
also suggests, however, that impact with a 100-mm curb placed in conjunction with a
guardrail is not likely to result in underride.
At low encroachment angles (e.g., 5 degrees) onto the 150-mm curbs, the trajectory of
the front bumper was such that its vertical position exceeded the height of a standard
strong-post w-beam guardrail at offset distances as low as 0.5 m for all vehicle types. As
the impact angle increased, so did the lateral distance behind the curb for which the
bumper trajectory was sufficient to override a guardrail. For example, computer
simulations of the pickup truck traversing curbs at 100 km/hr and 25 degrees indicated
that the vertical component of trajectory of the front bumper exceeded the height of a
standard guardrail for offset distances as great as 7.0 m. Based on bumper trajectory data
of vehicles traversing curbs, override of a strong-post w-beam guardrail is probable for
all curb-guardrail cases involving 150-mm curbs when the barrier is placed between 0.5
and 7.0 m behind the curb for the range of impact conditions investigated. The potential
for override is less for 100-mm curbs, however, pickup trucks crossing the curbs may
vault over a guardrail that is positioned at 0.6 - 7.0 m behind the curb.
The curb traversal studies indicate that the most appropriate placement of curbs with
respect to guardrail is to place the curb underneath the guardrail behind the face of the w-
beam.
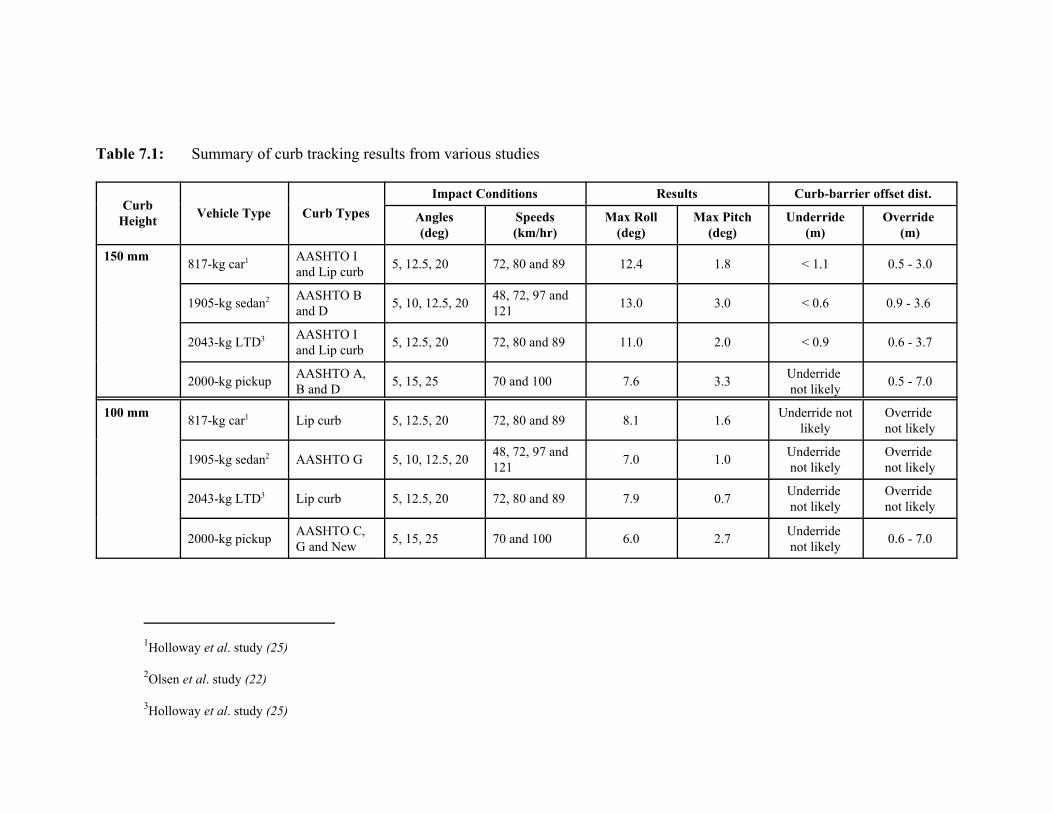
1Holloway et al. study (25)
2Olsen et al. study (22)
3Holloway et al. study (25)
Table 7.1: Summary of curb tracking results from various studies
CurbHeight Vehicle Type Curb Types
Impact Conditions Results Curb-barrier offset dist.
Angles (deg)
Speeds (km/hr)
Max Roll(deg)
Max Pitch(deg)
Underride(m)
Override (m)
150 mm 817-kg car1 AASHTO Iand Lip curb 5, 12.5, 20 72, 80 and 89 12.4 1.8 < 1.1 0.5 - 3.0
1905-kg sedan2 AASHTO Band D 5, 10, 12.5, 20 48, 72, 97 and
121 13.0 3.0 < 0.6 0.9 - 3.6
2043-kg LTD3 AASHTO Iand Lip curb 5, 12.5, 20 72, 80 and 89 11.0 2.0 < 0.9 0.6 - 3.7
2000-kg pickup AASHTO A,B and D 5, 15, 25 70 and 100 7.6 3.3 Underride
not likely 0.5 - 7.0
100 mm 817-kg car1 Lip curb 5, 12.5, 20 72, 80 and 89 8.1 1.6 Underride notlikely
Override not likely
1905-kg sedan2 AASHTO G 5, 10, 12.5, 20 48, 72, 97 and121 7.0 1.0 Underride
not likelyOverride not likely
2043-kg LTD3 Lip curb 5, 12.5, 20 72, 80 and 89 7.9 0.7 Underride not likely
Override not likely
2000-kg pickup AASHTO C,G and New 5, 15, 25 70 and 100 6.0 2.7 Underride
not likely 0.6 - 7.0
289
7.2.3 Non-Tracking Impact
The analysis of non-tracking impacts was beyond the scope of research in this
dissertation, however, there were a few studies identified in the literature review that
addressed this issue using analytical methods, computer simulation and full-scale
tests.(25)(33)(34). Holloway et al. used the HVOSM computer program to simulate non-
tracking impacts of both a small car (e.g., 817 kg) and a large car (e.g., 2043 kg) with a
100-mm lip curb, 150-mm lip curb and the AASHTO type I curb.(25) They found that
these curbs may be traversable over a wide range of vehicle orientations and impact
conditions and that they pose little threat of vehicle rollovers during impact, however,
their models were not validated with test results for those types of impact conditions.
Copperrider et al. used full-scale tests to investigate the rollover propensity of a wide
range of vehicle types tripped by either a 150-mm curb or by soil.(33) Their tests
involved towing the vehicles sideways and releasing them just prior to impact with the
curb or soil. They found that the duration of contact between the tires and the tripping
mechanism (e.g., curb or soil) was the most influential factor affecting vehicle rollover.
Although curb impacts resulted in much higher decelerations, the peak angular velocities
were very similar in both the curb trip tests and the soil trip tests. Consequently, both are
likely to result in vehicle rollover.
Based on the results found in these studies it is difficult to discern whether or not curbs
are of any greater hazzard than a simple soil and sod roadside. A more direct method of
290
testing or simulating non-tracking impacts of vehicles with curbs and of vehicles with
soil-and-sod needs to be undertaken. Realistic vehicle maneuvers representing more
probable impact orientations should also be used in such a test/simulation program.
7.3 Curb-Guardrail Tests and Simulation Results
The conclusions presented in the previous section regarding vehicle override and
underride of guardrail barriers were estimated based on the trajectory of the front bumper
of vehicles traversing curbs. Another factor that must be considered in such an event is
the interaction of the vehicle with the barrier. The results of full-scale crash tests and
finite element simulations demonstrate that vehicle impact with curb-guardrail systems
will result in more severe impact conditions, and thus poorer performance of the
guardrail, than would be the case if a curb were not present. Crash tests and computer
analyses have been conducted in which the curb was placed underneath the rail behind
the face of the w-beam to minimize the potential for a vehicle to strike the curb. The
general outcome in those cases included excessive vertical trajectory of the vehicle and
significant damage to the guardrail.
Table 2.5 in the literature review presented a summary of full-scale crash test results of
curb-guardrail combinations where curbs were located behind the face of the w-beam of
various strong-post guardrail systems. Table 2.5 is repeated here as table 7.2 for
convenience. The impact speed in those tests ranged from 96.1 km/hr to 103.2 km/hr and
impact angles ranged from 20 degrees to 28.6 degrees. The guardrail safely contained and
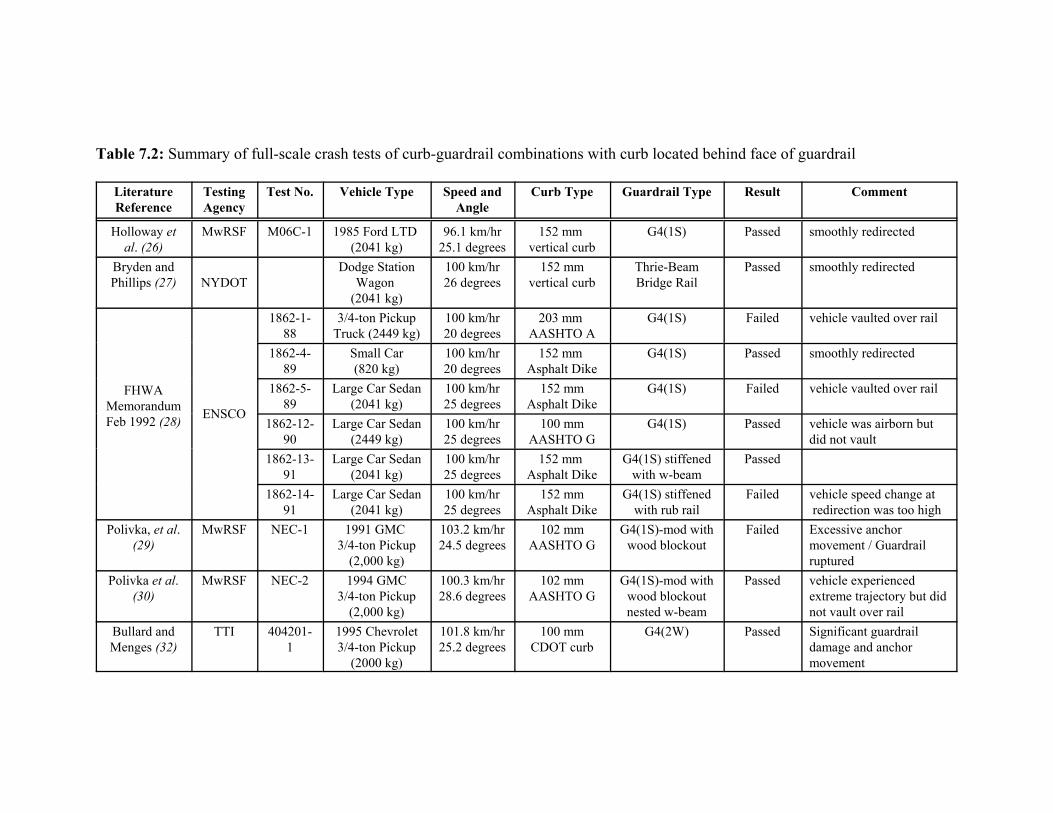
Table 7.2: Summary of full-scale crash tests of curb-guardrail combinations with curb located behind face of guardrail
LiteratureReference
TestingAgency
Test No. Vehicle Type Speed andAngle
Curb Type Guardrail Type Result Comment
Holloway etal. (26)
MwRSF M06C-1 1985 Ford LTD (2041 kg)
96.1 km/hr25.1 degrees
152 mm vertical curb
G4(1S) Passed smoothly redirected
Bryden andPhillips (27) NYDOT
Dodge StationWagon
(2041 kg)
100 km/hr26 degrees
152 mmvertical curb
Thrie-BeamBridge Rail
Passed smoothly redirected
FHWAMemorandumFeb 1992 (28) ENSCO
1862-1-88
3/4-ton PickupTruck (2449 kg)
100 km/hr20 degrees
203 mm AASHTO A
G4(1S) Failed vehicle vaulted over rail
1862-4-89
Small Car(820 kg)
100 km/hr20 degrees
152 mm Asphalt Dike
G4(1S) Passed smoothly redirected
1862-5-89
Large Car Sedan(2041 kg)
100 km/hr25 degrees
152 mmAsphalt Dike
G4(1S) Failed vehicle vaulted over rail
1862-12-90
Large Car Sedan(2449 kg)
100 km/hr25 degrees
100 mmAASHTO G
G4(1S) Passed vehicle was airborn butdid not vault
1862-13-91
Large Car Sedan(2041 kg)
100 km/hr25 degrees
152 mm Asphalt Dike
G4(1S) stiffenedwith w-beam
Passed
1862-14-91
Large Car Sedan(2041 kg)
100 km/hr25 degrees
152 mmAsphalt Dike
G4(1S) stiffenedwith rub rail
Failed vehicle speed change at redirection was too high
Polivka, et al.(29)
MwRSF NEC-1 1991 GMC 3/4-ton Pickup
(2,000 kg)
103.2 km/hr24.5 degrees
102 mmAASHTO G
G4(1S)-mod withwood blockout
Failed Excessive anchormovement / Guardrailruptured
Polivka et al.(30)
MwRSF NEC-2 1994 GMC3/4-ton Pickup
(2,000 kg)
100.3 km/hr28.6 degrees
102 mmAASHTO G
G4(1S)-mod withwood blockoutnested w-beam
Passed vehicle experiencedextreme trajectory but didnot vault over rail
Bullard andMenges (32)
TTI 404201-1
1995 Chevrolet3/4-ton Pickup
(2000 kg)
101.8 km/hr25.2 degrees
100 mmCDOT curb
G4(2W) Passed Significant guardraildamage and anchormovement
292
redirected the vehicle in cases where the wheels of the vehicle did not mount the curb
during impact. Those tests were primarily limited to small cars as test vehicles, however,
some cases involving large car sedans were also successful when vertical curbs were
used or when the guardrail was stiffened. Four full-scale tests were conducted using 3/4-
ton pickup trucks. In each of those tests the tires of the vehicle mounted the curb during
impact and resulted in either excessive vertical trajectory of the vehicle or significant
damage to the guardrail. Two of those tests did not satisfy safety requirements while two
other tests were successful. The failure in one case was due to barrier override and in
another case guardrail rupture was the cause of failure. The two successful tests were: 1)
MwRSF Test NEC-2 which involved a 102-mm curb placed underneath a modified
G4(1S) with wood blockouts and stiffened with nested w-beams and 2) TTI test 404201-
1 which involved a 100-mm curb placed underneath the G4(2W) guardrail. The
repeatability of those tests, however, are questionable due to the excessive vertical
trajectory of the vehicle during impact in test NEC-2 and the excessive damage to the
guardrail in test 404201-1 (refer to figures 2.8 and 2.11).
The analyses conducted in the current research involved the use of finite element
simulation to investigate the response of a 3/4-ton pickup truck impacting curb-barrier
systems in which the modified G4(1S) guardrail with wood blockouts was positioned at
0-m, 2.5-m and 4.0-m offset distances from curbs. The curbs used in the study had
heights of 100 mm and 150 mm. The backfill area behind the curbs was modeled with
rigid elements using a dynamic coefficient of friction of 0.82 between the tires of the
293
vehicle and the ground surface. It should be noted that the interaction between the tires
and ground in these analyses may not accurately represent cases where a backfill material
is composed primarily of soft soil. The impact angle was 25 degrees in all simulations
and impact speeds of 70 km/hr, 85 km/hr and 100 km/hr were investigated (refer to table
6.8 for summary of results).
The results of the pickup truck impacting the curb-barrier combination at 0-m offset
distance (i.e., curbs under the face of the barrier) at speeds of 70 km/hr and 85 km/hr
indicate that the vehicle would remain stable throughout the impact event and that barrier
damage would be minimal regardless of the type of curb used. The bumper of the pickup
was above the rail during redirection in one of the cases involving the 150-mm AASHTO
type D curb, but the potential for override of the barrier was considered minimal (refer to
the figures in Appendix VIII).
At the higher impact speed of 100 km/hr the analyses provided mixed conclusions. In one
case involving the 100 mm high AASHTO type C curb the vehicle vaulted over the
guardrail, whereas vaulting was not a serious issue in the other cases. The difference in
this particular case was attributed to a wheel snag against a blockout early in the impact
event which affected the way the vehicle interacted with the barrier throughout the
remainder of the event. Wheel snag is common in impacts with strong-post w-beam
guardrails and similar results are possible for cases involving any of the curb types. It
was also concluded that vehicle stability may be an issue during redirection due to the
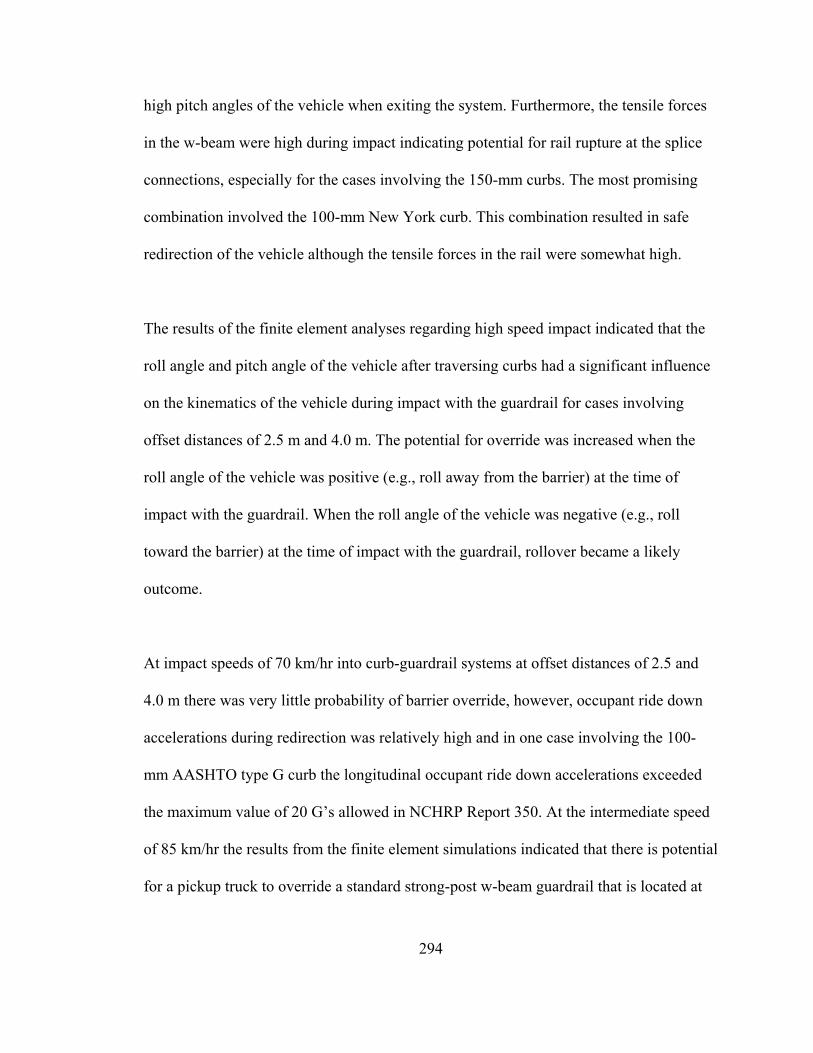
294
high pitch angles of the vehicle when exiting the system. Furthermore, the tensile forces
in the w-beam were high during impact indicating potential for rail rupture at the splice
connections, especially for the cases involving the 150-mm curbs. The most promising
combination involved the 100-mm New York curb. This combination resulted in safe
redirection of the vehicle although the tensile forces in the rail were somewhat high.
The results of the finite element analyses regarding high speed impact indicated that the
roll angle and pitch angle of the vehicle after traversing curbs had a significant influence
on the kinematics of the vehicle during impact with the guardrail for cases involving
offset distances of 2.5 m and 4.0 m. The potential for override was increased when the
roll angle of the vehicle was positive (e.g., roll away from the barrier) at the time of
impact with the guardrail. When the roll angle of the vehicle was negative (e.g., roll
toward the barrier) at the time of impact with the guardrail, rollover became a likely
outcome.
At impact speeds of 70 km/hr into curb-guardrail systems at offset distances of 2.5 and
4.0 m there was very little probability of barrier override, however, occupant ride down
accelerations during redirection was relatively high and in one case involving the 100-
mm AASHTO type G curb the longitudinal occupant ride down accelerations exceeded
the maximum value of 20 G�s allowed in NCHRP Report 350. At the intermediate speed
of 85 km/hr the results from the finite element simulations indicated that there is potential
for a pickup truck to override a standard strong-post w-beam guardrail that is located at
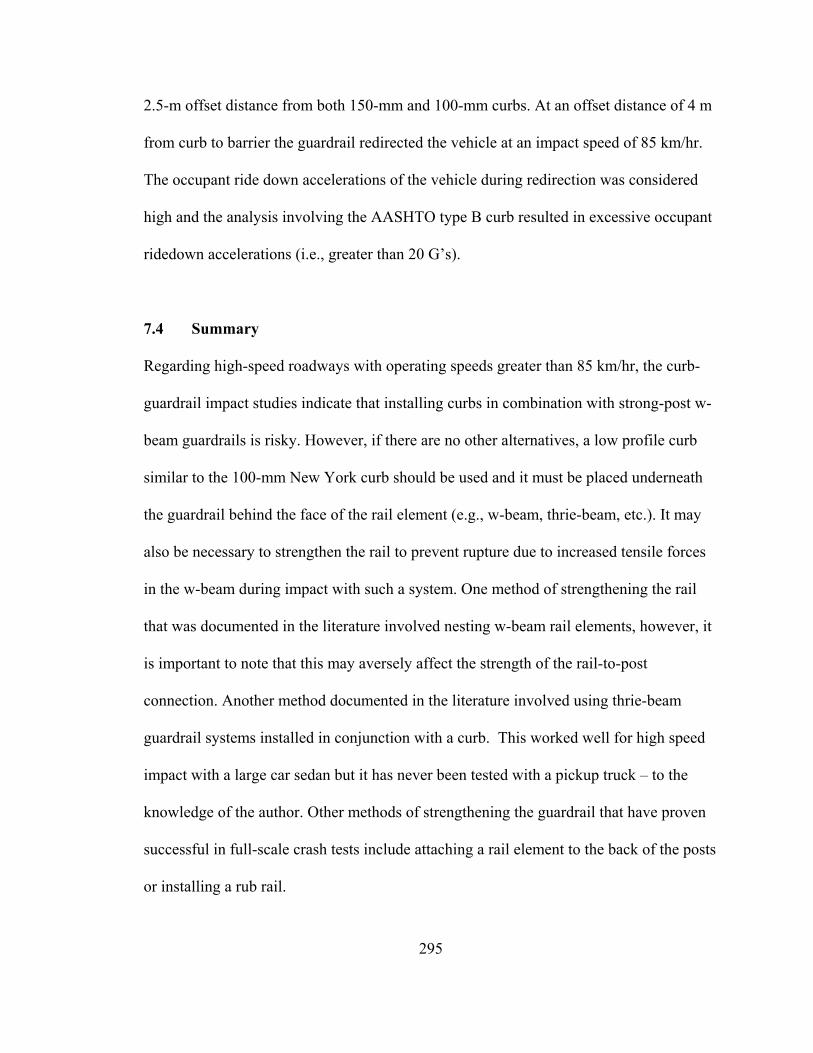
295
2.5-m offset distance from both 150-mm and 100-mm curbs. At an offset distance of 4 m
from curb to barrier the guardrail redirected the vehicle at an impact speed of 85 km/hr.
The occupant ride down accelerations of the vehicle during redirection was considered
high and the analysis involving the AASHTO type B curb resulted in excessive occupant
ridedown accelerations (i.e., greater than 20 G�s).
7.4 Summary
Regarding high-speed roadways with operating speeds greater than 85 km/hr, the curb-
guardrail impact studies indicate that installing curbs in combination with strong-post w-
beam guardrails is risky. However, if there are no other alternatives, a low profile curb
similar to the 100-mm New York curb should be used and it must be placed underneath
the guardrail behind the face of the rail element (e.g., w-beam, thrie-beam, etc.). It may
also be necessary to strengthen the rail to prevent rupture due to increased tensile forces
in the w-beam during impact with such a system. One method of strengthening the rail
that was documented in the literature involved nesting w-beam rail elements, however, it
is important to note that this may aversely affect the strength of the rail-to-post
connection. Another method documented in the literature involved using thrie-beam
guardrail systems installed in conjunction with a curb. This worked well for high speed
impact with a large car sedan but it has never been tested with a pickup truck � to the
knowledge of the author. Other methods of strengthening the guardrail that have proven
successful in full-scale crash tests include attaching a rail element to the back of the posts
or installing a rub rail.
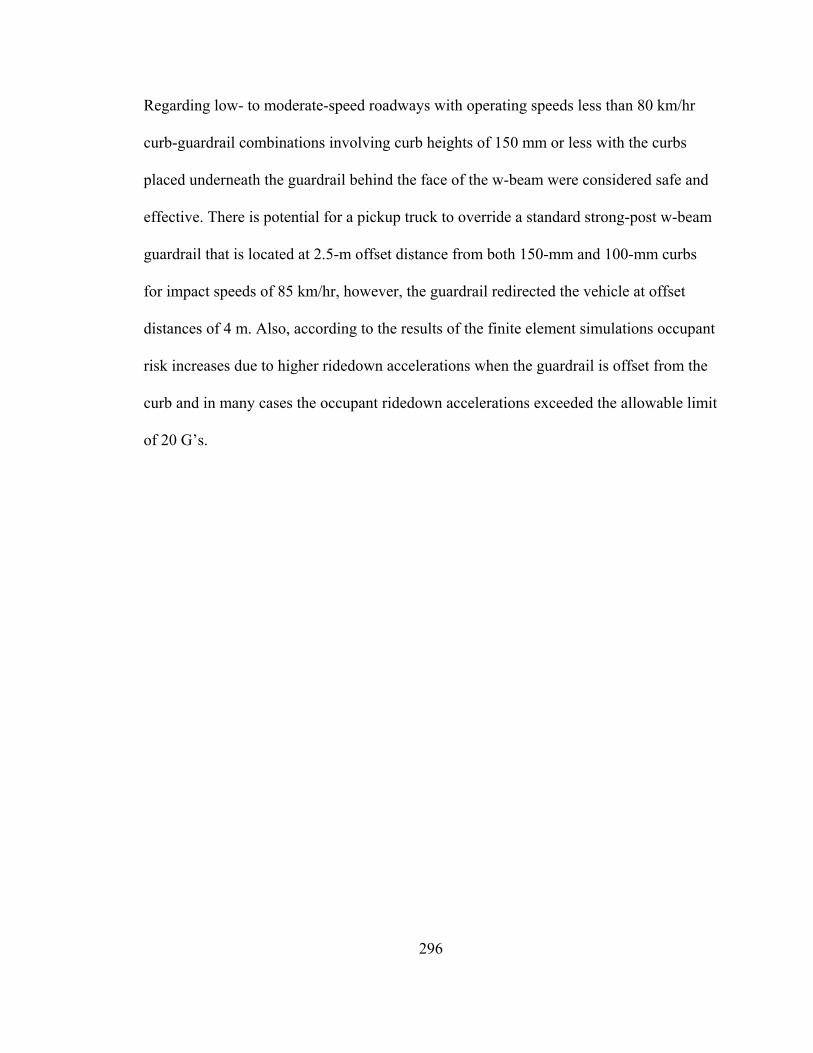
296
Regarding low- to moderate-speed roadways with operating speeds less than 80 km/hr
curb-guardrail combinations involving curb heights of 150 mm or less with the curbs
placed underneath the guardrail behind the face of the w-beam were considered safe and
effective. There is potential for a pickup truck to override a standard strong-post w-beam
guardrail that is located at 2.5-m offset distance from both 150-mm and 100-mm curbs
for impact speeds of 85 km/hr, however, the guardrail redirected the vehicle at offset
distances of 4 m. Also, according to the results of the finite element simulations occupant
risk increases due to higher ridedown accelerations when the guardrail is offset from the
curb and in many cases the occupant ridedown accelerations exceeded the allowable limit
of 20 G�s.
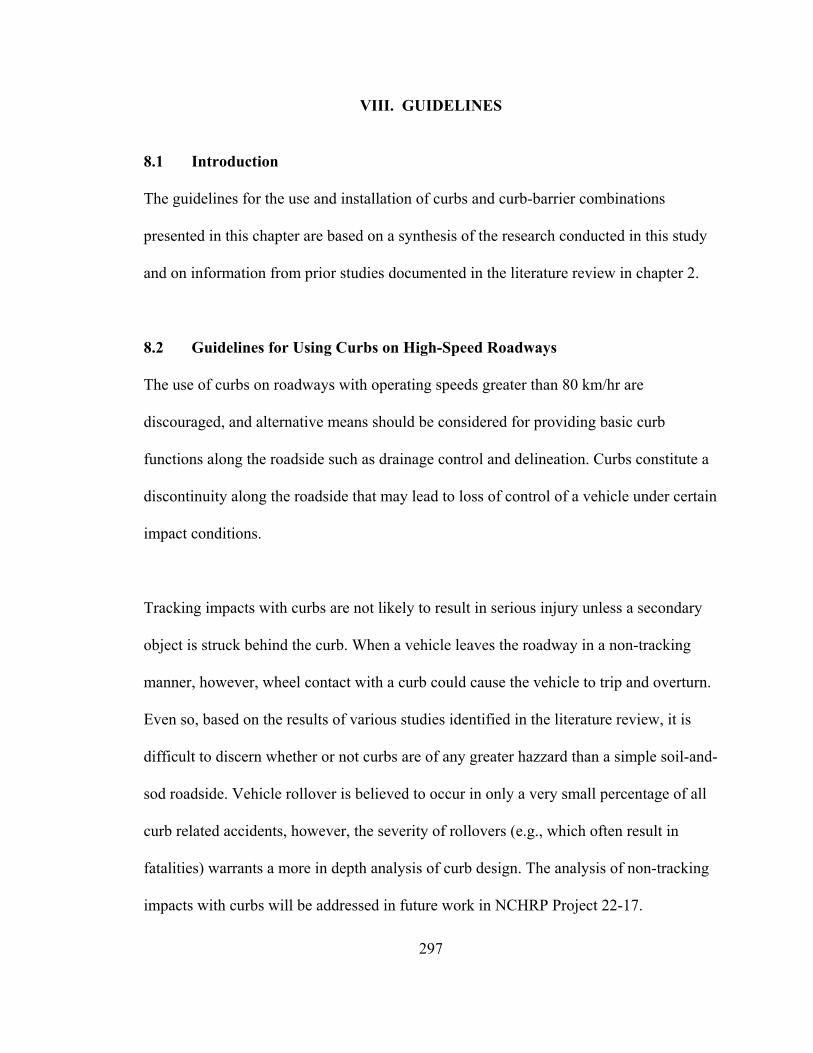
297
VIII. GUIDELINES
8.1 Introduction
The guidelines for the use and installation of curbs and curb-barrier combinations
presented in this chapter are based on a synthesis of the research conducted in this study
and on information from prior studies documented in the literature review in chapter 2.
8.2 Guidelines for Using Curbs on High-Speed Roadways
The use of curbs on roadways with operating speeds greater than 80 km/hr are
discouraged, and alternative means should be considered for providing basic curb
functions along the roadside such as drainage control and delineation. Curbs constitute a
discontinuity along the roadside that may lead to loss of control of a vehicle under certain
impact conditions.
Tracking impacts with curbs are not likely to result in serious injury unless a secondary
object is struck behind the curb. When a vehicle leaves the roadway in a non-tracking
manner, however, wheel contact with a curb could cause the vehicle to trip and overturn.
Even so, based on the results of various studies identified in the literature review, it is
difficult to discern whether or not curbs are of any greater hazzard than a simple soil-and-
sod roadside. Vehicle rollover is believed to occur in only a very small percentage of all
curb related accidents, however, the severity of rollovers (e.g., which often result in
fatalities) warrants a more in depth analysis of curb design. The analysis of non-tracking
impacts with curbs will be addressed in future work in NCHRP Project 22-17.
298
The following guidelines should be considered tentative until the hazards associated with
curbs can be more clearly defined.
For roadways with operating speeds greater than 60 km/hr it is recommended that curb
heights should not exceed 100 mm and that the slope of the curb face be 1:3 or flatter so
that vehicle accelerations will be minimized while traversing the curb. However, the
results of the curb impact study presented in this dissertation, as well as the prior studies
identified in the literature review, indicate that curbs with heights 150 mm or less,
regardless of the slope of the curb face, pose no significant hazard to encroaching
vehicles unless there are secondary objects for the vehicle to encounter in the area behind
the curb. The only objects within the clear zone along the roadside should be those that
satisfy the safety requirements of NCHRP Report 350. If the secondary object is a
guardrail then refer to section 8.3 below to identify proper curb type and placement.
When other roadside devices, such as road signs and breakaway poles, are to be used
with curbs they should be located as far from traffic as possible. If extensive use of a
particular roadside device is to be used with curbing, then computer simulation or full-
scale crash testing should be used to ensure that there are no undue hazards associated
with such a combination.
8.3 Guidelines for Using Curb-Barrier Combinations on High-Speed Roadways
When curbs are used in conjunction with a roadside safety barrier, the barrier must have
adequate strength performance in order to resist excessive lateral dynamic deflections,
299
thus minimizing the risk of a vehicle mounting the curb during impact. The barrier
system should, at a minimum, have the strength performance of a strong-post guardrail
system such as the modified G4(1S) with wood blockouts, the G4(2W), a thrie-beam
guardrail system or similar.
8.3.1 Moderate-Speed Roadways (60 - 80 km/hr)
Any type of sloping curb similar to those listed in the AASHTO Green Book (refer to
Figure 1.1) with heights equal to or less than 150 mm placed underneath the guardrail
behind the face of the rail element can be used safely in combination with strong-post
guardrail systems along roadways with operating speeds of 60 to 80 km/hr.
The most desirable location for curb placement is underneath the guardrail behind the
face of the rail element, however, along roadways with operating speeds of 70 km/hr or
less the barrier may be positioned at a lateral offset distance of 2.5 m or greater behind
the curb for curbs with a height of 150 mm or less. When it is necessary to offset a
guardrail behind a curb along roadways with operating speeds ranging from 70 km/hr to
80 km/hr, the curb may be placed underneath the guardrail behind the face of the rail
element or the barrier must be positioned at a lateral offset distance of 4.0 m or greater
behind a curb and the curb height must not exceed 100 mm.
8.3.2 High-Speed Roadways (over 80 km/hr)
The barrier should not be offset from a curb when curb-barrier combinations are used on
300
roadways with operating speeds greater than 80 km/hr and, further, the use of curbs are
discouraged along high-speed roadways with operating speeds greater than 85 km/hr.
When operating speeds are between 80 and 85 km/hr any type of sloping curb similar to
those listed in the AASHTO Green Book with heights equal to or less than 150 mm can
be used safely with strong-post guardrail systems with the curb placed underneath the
guardrail behind the face of the rail element.
When operating speeds are between 85 and 100 km/hr it may be hazardous to install
curbs in combination with roadside safety barriers, however, if a curb-barrier system is
warranted, the curb should be no higher than 100 mm above the road surface with the
curb face having a slope of 1:3 or flatter. It is also recommended that the modified
G4(1S) guardrail with wood blockouts not be used unless it is properly modified to
increase tensile capacity of the rail element in order to prevent guardrail rupture.
When operating speeds are in excess of 100 km/hr curbs should not be used in
combination with roadside safety barriers and other means should be sought to carry out
the primary functions of the curb.
A summary of the design guidelines for the use of curb-guardrail combinations along
roadways with operating speeds greater than 60 km/hr is presented below in Table 8.1
and in Figure 8.1. The offset distance parameter in Figure 8.1 represents the lateral
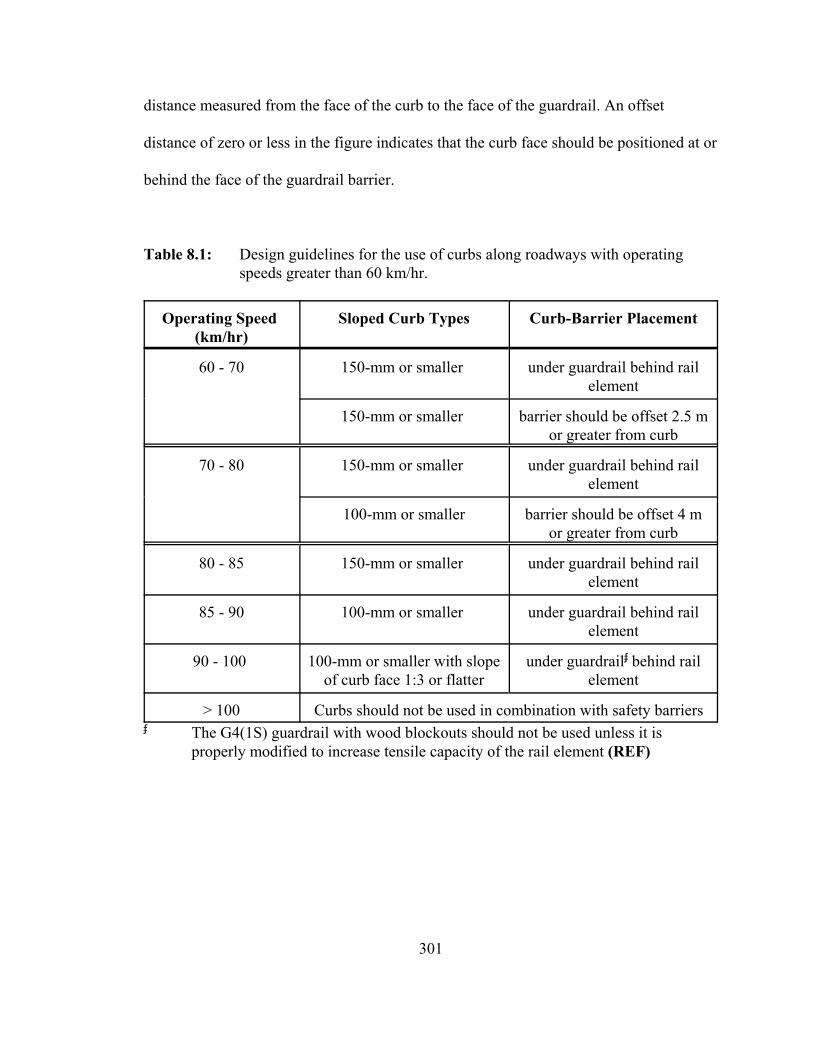
301
distance measured from the face of the curb to the face of the guardrail. An offset
distance of zero or less in the figure indicates that the curb face should be positioned at or
behind the face of the guardrail barrier.
Table 8.1: Design guidelines for the use of curbs along roadways with operatingspeeds greater than 60 km/hr.
Operating Speed (km/hr)
Sloped Curb Types Curb-Barrier Placement
60 - 70 150-mm or smaller under guardrail behind railelement
150-mm or smaller barrier should be offset 2.5 mor greater from curb
70 - 80 150-mm or smaller under guardrail behind railelement
100-mm or smaller barrier should be offset 4 mor greater from curb
80 - 85 150-mm or smaller under guardrail behind railelement
85 - 90 100-mm or smaller under guardrail behind railelement
90 - 100 100-mm or smaller with slopeof curb face 1:3 or flatter
under guardrail– behind railelement
> 100 Curbs should not be used in combination with safety barriers– The G4(1S) guardrail with wood blockouts should not be used unless it is
properly modified to increase tensile capacity of the rail element (REF)
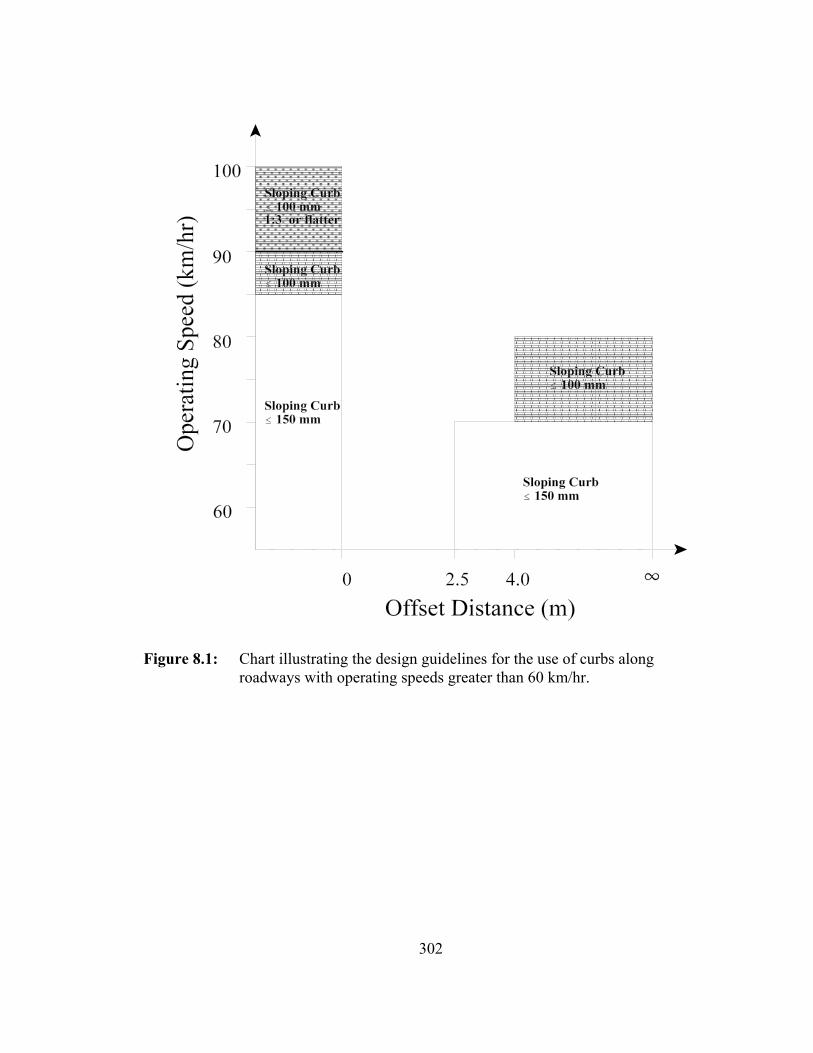
302
Figure 8.1: Chart illustrating the design guidelines for the use of curbs alongroadways with operating speeds greater than 60 km/hr.
303
IX. SUMMARY AND CONCLUSIONS
9.1 Introduction
The results of the studies identified in the literature and the results of the parametric
analyses conducted in this research were synthesized in order to develop a general set of
guidelines for the design and installation of curbs and curb-barrier systems along
roadways with operating speeds greater than 60 km/hr. The guidelines are based on the
results of both computer simulation and full-scale crash tests. The study involved the
analysis of vehicles traversing several commonly used curb types under a variety of
impact conditions, as well as, the analysis of vehicle impact into various curb-guardrail
combinations. The research presented herein identified common types of curbs that could
be used safely and effectively on high-speed roadways and also identified the proper
combination and placement of curbs and barriers that would allow the traffic barriers to
be effective, i.e. safely contain and redirect an impacting vehicle.
9.2 Summary of Previous Research Studies
An in-depth review of published literature was conducted in order to identify information
pertinent to the design, safety and function of curbs and curb/barrier combinations. The
studies that were found in the literature used a variety of vehicle types including small
cars, large cars and pickup trucks. It was found that both the large and small cars crossing
curbs less than150 mm high in a tracking manner are not likely to cause the driver to
loose control of the vehicle or cause the vehicle to become unstable, unless a secondary
impact occurs. The dynamic response of a pickup truck crossing over curbs, however,
304
had never been evaluated in previous studies with either full-scale tests or computer
simulation and was thus unknown.
Errant vehicles leave the roadway in a variety of orientations, however, it is assumed that
the majority of these vehicles encroach onto the roadside in a semi-controlled tracking
manner. In such cases, the left or right front bumper would be the first point of contact
with a roadside object in an impact event. The position of the bumper upon impact has,
therefore, been a primary concern involving impacts with longitudinal traffic barriers,
where it has been assumed that the position of the bumper during impact is a reasonable
indicator of vehicle vaulting or underriding the barrier.
The conclusions from these earlier tests and analyses were in general agreement that
curbs in front of the guardrail could cause vaulting. If curbs were required for drainage
purposes the only alternative was to place the curb behind the face of the barrier. This
arrangement shields the curb from the impact while allowing the curb to channel runoff
water from the roadway. The idea was to locate the curb such that minimal interaction
between the vehicle and curb occurred. This worked well with lighter vehicles such as
the 820-kg small car, but did not prevent vehicle-curb interaction for the larger cars
which have a mass of over 2000 kg, unless the guardrail was retrofit in some manner to
strengthen it and minimize guardrail deflection. To circumvent the problem, one option
that was considered was to use a low profile curb underneath the guardrail in order to
minimize the effects that the curb would have on vehicle trajectory if the wheels of the
305
vehicle managed to make contact with the curb during impact.
Tests were conducted by various organizations in which a low profile curb was placed
behind the face of the guardrail. This design proved successful in tests with the larger
cars, while tests involving pickup trucks resulted in success in some cases and failure in
others. In cases where the test was a failure, it was not clear whether the failure was
induced by vehicle-curb interaction or if it was simply caused by inadequate barrier
performance. It was apparent, however, that curb-barrier systems pose a much greater
hazard to pickup trucks in high-speed impacts than they do to cars, and also that much
more information regarding pickup impact into curb-barrier systems was warranted.
9.3 Summary of Current Research
Finite element analysis was used in this research to conduct a parametric investigation
involving a 2000-kg pickup truck impacting various curbs and curb-barrier combinations
to determine which types of curbs are safe to use on high-speed roadways and to
determine proper placement of a barrier with respect to curbing such that the barrier
remains effective in safely containing and redirecting an impacting vehicle. The curb
types used in the study included the 150-mm AASHTO type A, the 150-mm AASHTO
type B, the 150-mm AASHTO type D, the 100-mm AASHTO type C, the 100-mm
AASHTO type G and the 100-mm New York curb. The longitudinal safety barrier used
in the study was the modified G4(1S) guardrail with wood blockouts, which is one of the
most widely used guardrails in the U.S.
306
Each component of the guardrail model was validated both quantitatively and
qualitatively with laboratory tests, with the exception of the anchor system for which no
test data was available. The modified NCAC C2500R (reduced element) pickup truck
model (i.e., model with modifications made to the suspension system by WPI) was used
to simulate the impact of a 2000-kg pickup truck. The NCAC C2500R model has been
widely used in previous studies to analyze vehicle impact into roadside barriers and
therefore the model has been generally debugged.
The accuracy of the models� results were quantified prior to being used in this study.
The models were first used to simulate a 2000-kg pickup impacting the modified G4(1S)
guardrail at 100 km/hr at an angle of 25 degrees. The results were validated by
comparing them to results obtained from a full-scale crash test documented in the
literature, and it was concluded that the models provide realistic behavior of both the
guardrail and vehicle in such an impact event.
The validated models were then used in a parametric analysis to investigate the effects of
various curb types in tracking impacts with a 2000-kg pickup truck on the stability and
trajectory of the vehicle during simple curb traversals. The parametric analysis involved
six curb types (i.e., AASHTO types A, B, C, D and G and the 100-mm New York curb),
two impact speeds (i.e., 70 and 100 km/hr) and three impact angles (i.e., 5, 15 and 25
degrees).
307
The models were also used in a parametric study to investigate the crashworthiness of
curb-barrier combinations in tracking impacts with the 2000-kg pickup truck. The
parametric analysis involved the modified NCAC C2500R pickup truck model impacting
the modified G4(1S) guardrail model at impact speeds of 70, 85 and 100 km/hr, at an
impact angle of 25 degrees and at offset distances from curb to barrier of 0, 2.5 and 4 m.
The results of the curb traversal study indicated that the stability of the pickup truck
would not be compromised in tracking impacts, however, the trajectory of the front
bumper was sufficient to imply a risk of barrier override when a standard strong-post
guardrail is placed anywhere from 0.5 m to 7.0 m behind 150 mm high curbs or 0.6 m to
7.0 m behind 100 mm high curbs.
The finite element results of the pickup truck model impacting various curb-guardrail
combinations confirmed that the presence of curbs are potentially hazardous. The results
of the parametric study were used to identify certain combinations that were more likely
to result in acceptable, as well as, unacceptable barrier performance, and a table defining
proper curb type and barrier placement was presented. It should be noted that even those
cases that were identified as being successful resulted in poorer performance of the
guardrail and a higher risk of injury for the occupants of the vehicle than was the case
when the curb was not present.
308
9.4 Future Research
While the foregoing dissertation provided a considerable amount of information
regarding the effects of curbs along high-speed roadways there is still a great deal of
information needed in order to develop a more complete set of guidelines for the use and
installation of curbs. The issue of non-tracking impacts with curbs needs further
attention, full-scale tests are needed to confirm computer simulation predictions and an in
depth review of crash data bases is needed to develop a more clear understanding of
extent of the curb related safety problem in the real world.
Finite element analysis is one method that may be useful in the study of non-tracking
impacts with curbs. The lack of detail in the model of the wheel assembly on the vehicle
models, however, may greatly affect the accuracy of their results in simulating the
response of lateral loading on the wheels (e.g., failure of wheel assembly components)
during non-tracking impacts. It is therefore recommended that full-scale testing be used
to investigate such an event, however, it is realized that conducting full-scale non-
tracking tests under impact conditions representing real life conditions are difficult to
achieve without the aid of a live driver.
The advantage of full-scale crash tests is that they are actual physical impact events
where there is little ambiguity about the results. The disadvantage is that they are costly,
and it is seldom feasible to perform very many tests so the testing results usually do not
address a very wide range of conditions. Some full-scale tests should be conducted to
309
validate the results of the computer simulation analyses. For example, select cases of
curb-barrier systems identified in the computer simulation study for which failure or
success of the system would be expected, should be crash tested in order to verify the
computer predictions. If the full-scale tests confirm that the computer simulation results
are accurate then the results of the many computer simulated impacts in the parametric
analysis can be considered a reasonable estimate of performance of the various curb-
barrier systems and, thus, would strengthen the conclusions made in this dissertation.
Currently, as part of NCHRP project 22-17, researchers at Bellomo-McGee, Inc. are
conducting a study of existing crash/geometric databases in order to characterize the
extent and severity of safety problems associated with curb and curb-barrier
combinations on high-speeds roadways. That study is almost complete and when the
final results are available they will be incorporated with the current data which will
further aid in the development of the design guidelines being developed by researchers at
Worcester Polytechnic Institute for NCHRP Project 22-17.
310
X. REFERENCES
1. AASHTO, A Policy on Geometric Design of Highways and Streets, AmericanAssociation of State Highway and Transportation Officials, Washington, D.C.(2001).
2. AASHTO, Roadside Design Guide, American Association of State Highway andTransportation Officials, Washington, D.C. (1996).
3. FHWA, Design Construction and Maintenance of Highway Safety Features andAppurtenances, Federal Highway Administration, Publication No. FHWA-HI-97-026, Washington, D.C. (1997).
4. IA DOT, Design Manual, Iowa Department of Transportation, Ames, IA (1999).
5. Beaton, J.L., and H. Peterson, �A Report on Dynamic Testing of Various Designsof Highway Bridge Curbing � Roadway Barrier Curb Investigation,� CaliforniaDivision of Highways (December 1953).
6. Bronstad, M.E., M.H. Ray, J.B. Mayer, Jr., and C.F. McDevitt, �Guardrail-BridgeRail Transition Evaluations,� Transportation Research Record No. 1133,Transportation Research Board, Washington, D.C. (1987).
7. Ray, M.H. and R.G. McGinnis, Guardrail and Median Barrier Crashworthiness,National Cooperative Highway Research Program Synthesis Report No. 244,Transportation Research Board, Washington, D.C. (1994).
8. Field, R.N. and J.L. Beaton, �Final Report of Full-Scale Dynamic Tests of BridgeCurbs and Rails,� California Division of Highways (December 1957).
9. Henault, G.G. and H. Perron, �Research and Development of a Guide Rail Systemfor a High-Speed Elevated Expressway,� Highway Research Record No. 152,Highway Research Board (1966).
10. Elsholz, J., �Test Concerning the Turn-Away Effect of Curb Stones,� Strasse undAutobahn, Vol. 19, No. 4 (April 1968).
11. Jehu, V.J., �Safety Fences and Kerbs,� Traffic Engineering and Control, Vol. 5,No. 9 (January 1964).
12. Dunlap, D.F., �Barrier-Curb Redirection Effectiveness,� Highway ResearchRecord No. 340, Highway Research Board, Washington, D.C. (1973).
311
13. Hutchinson, J.W. and T.W. Kennedy, �Safety Considerations In Median Design,�Highway Research Record 162 (1966).
14. Navin, F.P.D. and R. Thomson. �Safety and Roadside Curbs,� Society ofAutomotive Engineers, Inc., SAE Paper No. 970964, pp. 365-370 (1997).
15. McHenry, R.R. and N.J. DeLeys, �Determination of Physical Criteria forRoadside Energy Conservation Systems,� Report No. VJ-2251-V-1, CornellAeronautical Laboratory, Inc. (July 1967).
16. Zobel, E.C., D.F. Dunlap, I.W. Kay, J.J. Blass, P Grote, and K.M. Fram,�Investigation of the Dynamic Impact on Roadside Obstacles � Final Report,�College of Engineering, Wayne State University, Detroit, MI (1972).
17. McHenry, R.R. and N.J. DeLeys, �Vehicle Dynamics in Single-Vehicle Accidents� Validation and Extension of a Computer Simulation,� Report No. VJ-2251-V-3,Cornell Aeronautical Laboratory, Inc. (December 1968).
18. Paniati, J.F. and J. True, �Interactive Highway Safety Design Model (IHSDM):Designing Highways with Safety in Mind,� Transportation Research CircularNo. 453 (February 1996).
19. Highway Research Circular 482: Proposed Full-Scale Testing Procedures forGuardrails, Committee on Guardrail and Guide Posts, Highway Research Board,Washington, D.C. (September 1962).
20. Ross, H.E., D.L. Sicking, and H.S. Perrara, �Recommended Procedures for theSafety Performance Evaluation of Highway Appurtenances,� NationalCooperative Highway Research Program Report No. 350, National Academy ofSciences, Washington, D.C (1993).
21. Michie, J.D., �Recommended Procedures for the Safety Performance Evaluationof Highway Appurtenances,� National Cooperative Highway Research ProgramReport No. 230, Transportation Research Board, Washington, D.C. (March 1981).
22. Olson, R.M., G.D. Weaver, H.E. Ross, Jr. and E.R. Post, �Effect of CurbGeometry and Location on Vehicle Behavior,� National Cooperative HighwayResearch Program (NCHRP) Report 150, Transportation Research Board,Washington, D.C. (1974).
23. Dunlap, D.F., �Curb Vaulting Evaluation,� Highway Research Record No. 340,Highway Research Board, Washington, D.C. (1973).
312
24. Ross, H.E., E.R. Post, �Dynamic Behavior of an Automobile Traversing SelectedCurbs and Medians,� Research Report 140-6, Texas Transportation Institute,Texas A&M University, College Station, Texas (January 1975).
25. Holloway, J.D., D.L. Sicking and B.T. Rossen, �Performance Evaluation ofNDOR Mountable Curbs,� Transportation Report No. TRP-03-37-94 (FinalReport), Midwest Roadside Safety Facility, University of Nebraska-Lincoln (June1994).
26. Holloway, J.C. and B.T. Rosson, �Performance Evaluation of Missouri�s 6-inchBarrier Curb Under W-Beam Guardrail,� Final Report to the Missouri Highwayand Transportation Department, Transportation Report No. TRP-03-40-94,Midwest Roadside Safety Facility, University of Nebraska-Lincoln (April 1994).
27. Bryden, J.E. and R.G. Phillips, �Performance of a Thrie-Beam Steel-Post Bridge-Rail System,� New York Department of Transportation, Engineering Research &Development Bur, Transportation Research Record 1024, pp.18-27 (1985).
28. �Memorandum on Performance of Guardrail/Curb Combinations,� February 28,1992, File Designation HNG-14, Federal Highway Administration (FHWA),Washington, D.C. (1992).
29. Polivka, K.A., R.K. Faller, D.L. Sicking, J.R. Rhode, J.D. Reid and J.C.Holloway, �Guardrail and Guardrail Terminals Installed Over Curbs,� MwRSFResearch Report No. TRP-03-83-99, Midwest Roadside Safety Facility,University of Nebraska-Lincoln (September 23, 1999).
30. Polivka, K.A., R.K. Faller, D.L. Sicking, J.R. Rhode, J.D. Reid and J.C.Holloway, �Guardrail and Guardrail Terminals Installed Over Curbs � Phase II,�MwRSF Research Report No. TRP-03-105-00, Midwest Roadside Safety Facility,University of Nebraska-Lincoln (November 5, 2001).
31. Buth, E. et al, �Safer Bridge Railings,� Report FHWA-RD-82-072, FederalHighway Administration, Washington, D.C. (1984).
32. Bullard, D.L. and W.L. Menges, �NCHRP Report 350 Test 3-11 on theG4(2W)Strong Post W.-Beam Guardrail with 100 mm High Asphaltic Curb,�Report No. FHWA-RD-00, Federal Highway Administration, Washington, D.C.(June 2000).
33. Cooperrider, N.K., T.M. Thomas and S.A. Hammoud, �Testing and Analysis ofVehicle Rollover Behavior: Accident Reconstruction: Human, Vehicle andEnvironmental Factors,� SAE Engineers International Congress & Exposition,SAE SP-90-814, pp.125-134, Society of Automotive Engineers (1990).
313
34. Deleys, N.J. and C.P. Brinkman, �Rollover Potential of Vehicles onEmbankments, Sideslopes, and Other Roadside Features,� SAE Paper 870234,Society of Automotive Engineers, Warrendale, PA, pp.149-158 (1987).
35. Allen, R.W., H. Szostak, and T.J. Rosenthal, D.H. Klyde, and K.J. Owens,�Characeteristics Influencing Ground Vehicle Lateral/Directional DynamicStability,� SAE Paper 910234, Society of Automotive Engineers, Warrendale,PA pp.23-48 (1991).
36. Allen, R.W., T.J. Rosenthal, and J.P. Chrstos, �A Vehicle Dynamics Tire Modelfor Both Pavement and Off-Road Conditions,� SAE Paper 970559, Society ofAutomotive Engineers, Warrendale, PA (1997).
37. Allen, R.W., T.J. Rosenthal, D.H. Klyde and J.P. Chrstos, �Vehicle and TireModeling for Dynamic Analysis and Real-Time Simulation,� SAE Paper 2000-01-1620, Society of Automotive Engineers, Warrendale, PA, pp.1-22 (2000).
38. �Guide for Selecting, Locating, and Designing Traffic Barriers,� AmericanAssociation of State Highway and Transportation Officials (AASHTO) (1977).
39. Mak, K.K., R.P. Bligh and W.L. Menges, �Crash Testing and Evaluation ofExisting Guardrail Systems.� Texas Transportation Institute, Test Report No.471470-26, The Texas A&M University, College Station, TX (December 1995).
40. Allen, R.W., H.T. Szostak and T.J. Rosenthal, �Steady State and TransientAnalysis of Ground Vehicle Handling,� SAE Paper No. 870495 (February 1987).
41. Ray, M.H., K. Hiranmayee and S. Kirkpatrick, �Performance Validation of TwoSide Impact Dummies,� International Journal of Crashworthiness, Vol. 4 No. 3,Woodhead Publishing Limited, London, UK (1999).
42. LS-DYNA User�s Manual Volumes 1 and 2 Version 960, Livermore SoftwareTechnology Corporation, Livermore, California (March 2001).
43. Basu, S. and A. Haghighi, �Numerical Analysis of Roadside Design (NARD)Volume III: Validation Procedure Manual,� Report No. FHWA-RD-88-213,Federal Highway Administration (September 1988).
44. Ray, M.H., �Repeatability of Full-Scale Crash Tests and a Criteria for ValidatingSimulation Results,� Transportation Research Record 1528, TransportationResearch Board, Washington D.C. (1996).
45. Geers, T.L., �An Objective Error Message for the Comparison of Calculated andMeasured Transient Response Histories,� The Shock and Vibration Bulletin (June1984).
314
46. Epperson, B., R. Bligh, and H. Ross, Test Risk Assessment Program (TRAP)Version 2.0: User�s Manual, Texas Transportation Institute, College Station, TX(1999).
47. Plaxico, C.A. M.H. Ray, and K. Hiranmayee, �Comparison of the ImpactPerformance of the G4(1W) and G4(2W) Guardrail Systems Under NCHRPReport 350 Test 3-11 Conditions,� Transportation Research Record, Paper No.00-0525, Transportation Research Board, Washington, D.C. (2000).
48. Ray, M.H., �The Use of Finite Element Analysis in Roadside Hardware Design,�International Journal of Crashworthiness, Vol. 3, No.4, Woodhead PublishingCo., London (1997).
49. Engstrand, K.E., �Improvements to the Weak-Post W-Beam Guardrail,� Master�sThesis, Worcester Polytechnic Institute, Worcester, MA (Spring 2000).
50. Ray, M.H., C.A. Plaxico, and K.E. Engstrand, �Performance of W-BeamSplices,� Transportation Research Record 1743, Paper No. 01-2420,Transportation Research Board, Washington D.C. (2001).
51. Ray, M.H., K.E. Engstrand, C.A. Plaxico, and R.G. McGinnis, �Improvements tothe Weak-Post W-Beam Guardrail,� Transportation Research Record 1743,Paper No. 01-2282, Transportation Research Board, Washington D.C. (2001).
52. Buth,E.C., W.W. Menges, and S.K. Schoeneman, �NCHRP Report 350 Test 3-11on the Modified PennDOT Type 2 Guide Rail � Test 3,� Texas TransportationInstitute, Texas A&M University System, College Station, Texas (2000).
53. Buth, E.C., W.L. Menges, and S.K. Schoeneman, �NCHRP Report 350 Test 3-10on the Modified PennDOT Type 2 Guide Rail � Test 3, Texas TransportationInstitute, Texas A&M University System, College Station, Texas (2000).
54. Povlika, K.A., R.K. Faller, D.L. Sicking, J.R. Rhode, J.D. Reid, and J.C.Holloway, �Guardrail and Guardrail Terminals Installed Over Curbs,� MwRSFResearch Report No. TRP-03-83-99, Midwest Roadside Safety Facility,University of Nebraska-Lincoln (September 23, 1999).
55. �Traffic Safety Facts 1996,� US Department of Transportation, National HighwayTraffic Safety Administration, National Center for Statistics and Analysis (1996).
56. Mak, K.K., R. Bligh, and W. Menges, �Testing of State Roadside SafetySystems,� FHWA Contract DTFH61-89-C-00089, Research Study RF471470,Texas Transportation Institute, College Station, Texas (1996).
315
57. Bullard, D., W. Menges, and D. Alberson, �NCHRP Report 350 Compliance Test3-11 of the Modified G4(1S) Guardrail with Timber Blockouts,� FHWA ContractDTFH61-95-C-00090, Research Project 405421-1, Texas TransportationInstitute, College Station Texas (January 1996).
58. TrueGrid Manual version 2.0.0, XYZ Scientific Applications, Inc. (March 2000).
59. AASHTO-ARTBA-AGC, �A Guide to Standardized Highway Barrier Hardware,�American Association of State Highway and Transportation Officials,Washington, D.C. (1995).
60. Wright, A. and M.H. Ray, �Characterizing Roadside hardware Materials for LS-DYNA Simulations,� Report No. FHWA-RD-96-108, Federal HighwayAdministration (1996).
61. Hallquist, J.O., �LS-DYNA Theoretical Manual,� Livermore SoftwareTechnology Corporation, Livermore, CA. (1998).
62. Jones, N., Structural Impact, Cambridge University Press (1989).
63. Calladine, C.R. and R.W. English, �Strain Rate and Inertia Effects in the Collapseof Two Types of Energy-Absorbing Structures,� International Journal ofMechanical Science, Volume 26, No.11-12, pp. 689-701 (1984).
64. Plaxico, C.A., G.S. Patzner, and M.H. Ray, �Finite Element Modeling ofGuardrail Timber Posts and the Post-Soil Interaction,� Transportation ResearchRecord, Paper No. 980791, Transportation Research Board, Washington, D.C.(1998).
65. Patzner, G.S., C.A. Plaxico, and M.H. Ray, �Effect of Post and Soil Strength onthe Performance of the Modified Eccentric Loader Breakaway cable Terminal,�Transportation Research Record, Paper No. 990046, Transportation ResearchBoard, Washington, D.C. (1999).
66. Tabiei, A. and J. Wu, �Evaluation of a G4 Strong-Post W-Beam Gurardrail forTruck Rollover and Snagging Using Finite Element Simulation,� ResearchReport, The University of Cincinnati, Dept. of Aerospace Engineering andEngineering Mechanics, Cincinnati, OH (January 2000).
67. Coon, B.A., J.D. Reid, and J.R. Rhode, �Dynamic Impact Testing of GuardrailPosts Embedded in Soil,� Research Report No. TRP-03-77-98, MidwestRoadside Safety Facility, University of Nebraska-Lincoln, Lincoln, Nebraska(July 21, 1999).
316
68. Plaxico, C.A., F.Mozzarelli, and M.H. Ray, �Tests and Simulation of a W-BeamRail-To-Post Connection,� Unpublished Paper, Worcester Polytechnic Institute(2002).
69. Tiso, P., �Improvements to the Suspension of the NCAC C2500 Pickup TruckFinite Element Model,� Master�s Thesis, Worcester Polytechnic Institute,Worcester, MA (2001).
70. Tiso, P., C.A. Plaxico, and M.H. Ray, �An Improved Truck Model for RoadsideSafety Simulations: Part II � Suspension Modeling,� Transportation ResearchRecord (in press), Transportation Research Board, Washington, D.C. (2002).
71. Bronstad, M.E., L.R. Calcote, K.L. Hancock, and J.B. Mayer, Jr., �Effects ofChanges in Effective Rail Height on Barrier Performance,� Federal HighwayAdministration, Report No. FHWA-RD-86-191, Washington, D.C. (April 1987).
72. Road Design Details, Iowa Department of Transportation, Project DevelopmentDivision Ames, Iowa.
73. Consolazio, G.R., J.H. Chung, and K.R. Gurley, �Development of a Low ProfileWork Zone Barrier Using Impact Finite Element Simulation,� (submitted forreview), Transportation Research Board, Washington, D.C. (2002).
74. Giola, A., �Performance of a High-Density Polyethylene Pull-Through EnergyDissipator,� Master�s Thesis, Worcester Polytechnic Institute, Worcester, MA(2001).