Embed Size (px)
Citation preview

~'~-~:~:~t A . q u a t i c . . , ;~ .~ l ,~ o o t a n y E LS EV I ER Aquatic Botany 48 (1994) 121-132
Vegetative propagule production and allocation of carbon and nitrogen by monoecious IIydrilla
verticillata (L.f.) Royle grown at two photoperiods
D a v i d Spencer*, Lars Anderson , Greg Ksander , Steve Kla ine ~, F r a n k Bailey
USDA-ARS Aquatic Weed Laboratory, Section of Plant Biology, Robbins Hall, University of California, Davis, CA 95616, USA
(Accepted 1 February 1994)
Abstract
Plants of Hydrilla verticii/ata (L.f.) Royle were grown under two photoperiods ( 11 or 15 h) in a greenhouse. Under the 11 h photoperiod, Hydrilla produced geotropic shoots after 34 days, tubers were first observed at 48 days, and turions after 76 days. During this study, Hydrilla plants grown under the 11 h photoperiod produced 317 tubers, and those grown under the 15 h photoperiod produced two tubers. C and N were directed from other plant structures, especially shoots and roots, into newly formed tubers and turions. C was allocated to new tubers at a rate that was about 43 times that for N. After 12 weeks, about 15 times more C and N were allocated to tuber production than to turion production. Nutrient use efficiency for N increased significantly in both photoperiods. N use efficiency was not a good indicator of the onset of tuber or turion production.
1. Introduction
Hydrilla verticillata (L.f.) Royle is a submersed aquatic plant. Under some conditions it grows abundantly and has become a serious aquatic weed. Seed pro- duction occurs in monoecious plants (Langeland and Smith, 1984) but, as with many other rooted aquatic macroph~¢es Hydrilla appears to reproduce chiefly by vegetative means (Sculthorpe, 1967). Hydrilla produces two types of vegetative propagules: subterranean turions (i~ereafter called tubers) and axillary turions
*Corresponding author. IPresent address: TIWET, PO Box 709, Pendleton, SC 29670, USA.
Elsevier Science B.V. SSD10304-3770 (94) 00382-V

122 D. Spencer et al. / Aquatic Botany 48 (1994) 121-132
(hereafter called turions) (but see Pieterse, 1981, 1983 ). In natural populations, the relative abundance of tubers and turions varies considerably. Sutton and Pot- tier (1985) reported that mean annual abundance of tubers was greater than that ofturions for four of five south Florida water bodies they sampled. In three lakes in North Carolina, Harlan et al. (1985) reported that tubers were from I0 to 40 times more abundant than turions. In Florida ponds, tuber density was about four times that of turion density (Hailer and Sutton, 1975). Tuber density was about ten times that ofturions in lakes in India (Mitra, 1955).
Tubers and turions appear to represent different reproductive strategies (Spen- cer et al., 1987), and may pose different problems for managing growth of Hy- drilla. Turions are produced on stems in the water column and are smaller than tubers, which are produced on geotropic shoots underground (Spencer et al., 1987). Limited data indicate that plants grown from turions are also smaller and less competitive than those grown from tubers (Spencer and Rejmanek, 1989; Spencer and Ksander, 1991 ).
The ability to predict reproduction by submersed aquatic plants would benefit management efforts and aid understanding of their distribution and abundance (Titus and Hoover, 1991 ). Previous work demonstrated that photoperiod influ- enced growth and vegetative propagule production by monoecious Hydrilla (Spencer and Anderson, 1986; Steward and Van, 1987; Van, 1989). Pieterse et al. (1984) reported that low levels of nitrogen and phosphorus in the water col- umn stimulated production of turions by Hydrilla grown under an 8 h photoper- iod. (The plants studied by Pieterse et al. (1984) were apparently monoecious plants since they produced male and female flowers. ) Pieterse et al. (1984) sug- gested that turion production was a response to nutrient stress. There is other evidence implicating nutrient stress in aquatic plant reproduction. Richards (1982) and Watson and Brochier (1988) have reported that exposing the float- ing aquatic plant Eichhornia crassipes (Mart.) Solms to low nutrient levels stim- ulated flowering. We conducted this study to examine the timing of tuber and turion production, and to determine if temporal changes in tissue carbon or ni- trogen concentrations could be used as markers for the onset of tuber or turion formation.
2. Materials and methods
Monoecious Hydrilla tubers from cultures maintained at the USDA Aquatic Weed Laboratory were sorted by size and placed in water-filled flasks in growth chambers that were set at 25°C with about 970/~E m -2 s-i photosynthetically active radiation (PAR). Tubers sprouted within 1 week and were planted in in- dividual plastic containers (volume about 1 1) filled with modified UC Mix (Spencer and Anderson, 1986). Average starting dry weight for the sprouted tub- ers was 78 mg (standard deviation (SD) 17 rag, N = 10). This was on average 13.8% of the fresh weight. Initial carbon and nitrogen tissue concentrations were 36.7% (SD= 1.2%, N = 10) and 1.4% (SD=0.3%, N = 10), respectively. Each
D. Spencer et al. /Aquatic Botany 48 (1994) 121-132 123
plant was randomly assigned to a position in either of two photoperiod chambers: ! 30 plants were used in the experiment. Each chamber held about 13161 of water from an underground well. Water circulation between the two chambers main- tained similar water quality for both. Although water column nutrient levels were not measured during this experiment, water from the source used in this study typically has the following characteristics: PO4, 0.15 mg 1-1; NO3, 6 mg l-m; K, 2 mg l-m; SO4, 20 mg 1-1; Ca, 34 mg l-m; Fe, 0.05 mg l-m; Mg, 35.2 mg l-m; total alkalinity, 4.3 meq l -m, pH 7.8; conductivity, 560/~mho cm -m. Water lost as a result of evaporation was replaced each week. During a 2 week period at the start of the experiment, temperature was measured at 30 rain intervals with a Data- sonde II H (Hydrolab Inc., Houston, TX) and the mean was 22.8 ± 0.6 °C ( ± SD, N= 727). Illumination was provided by four metal halide lamps mounted on the top of each chamber (Sylvania 400, Metalarc R, MS400/3K/HOR). Light inten- sity was measured simultaneously in each chamber with a separate LI-193SA spherical sensor (LI-COR, Lincoln, NB) located 13 cm below the surface of the water, and connected to an Easy Logger (Omnidata, Logan, UT) programmed to record at 30 min intervals. Light intensities in the 11 h and 15 h photopedod chambers were 66_+ 10/zE m -2 s-! ( N - 1036) and 60_+ 8 ~E m-2 s-i (N= 1564) respectively. Initially, both chambers were set at a 14:10 h L:D cycle. After 20 days, the photoperiods were changed to 11 or 15 h. These photoperiods were chosen because of their known effects on propagule production. Following the switch in photoperiods, five randomly chosen plants were harvested from each chamber at approximately 2 week intervals. Plant lengths were recorded and plants were separated into various parts (original tuber, shoots, l-cm shoot tips, roots, geotropic shoots, tubers, and turions), and dried for 48 h at 80°C. Weights were recorded and samples from each part were analyzed for percent C and N with a Perkin-Elmer 2400 Elemental CHN Analyzer.
Nutrient use efficiency (NUE) is defined as the amount of biomass produced per unit of nutrient. High values of NUE mean that more biomass has been pro- duced per unit nutrient. High NUE values are common for plaW.s exposed to low nutrient availability conditions. The concept was initially applied to nutrient concentrations in mature leaves, but NUE can also be calculated on a whole plant basis (Chapin and Van Cleve, 1989). Nitrogen concentrations were multiplied by dry weights to estimate weight of plant parts as milligrams N. We used these data to calculate NUE for nitrogen on both a whole plant and mature leaf basis, by dividing the dry biomass by the mass of nitrogen.
We used the general linear model procedure of the Statistical Analysis Systems Institute Inc. (SAS Institute Inc., 1988) to test the effects of time, photoperiod, and interactions on nitrogen NUE. We also estimated daily C and N loading rates for new tubers and turions by linear regression of tuber or turion weight (mg N or C) versus time (days). The resulting slope has units of milligrams C or N per day.

124 D. Spencer et aL /Aquatic Botany 48 (1994) 121-132
3. Results and discussion
Hydrilla weight increased over time under both photoperiods (Fig. I A ). Length increased initially and declined toward the end of the experiment. (Fig. IB). Tubers were produced before turions. The first evidence of tuber formation was noted 34 days after the photoperiod was changed when geotropic shoots were observed on plants grown under short day conditions. Ten tubers on five plants were observed 14 days later, on Day 48. Plants growing at the short photoperiod produced a total of 317 tubers during this experiment and those at the long pho- topedod produced two tubers. Van (1989) reported that after 6 weeks, monoe- cious Hydrilla produced tubers under both a 10 and 16 h photoperiod, but tuber production was greatly enhanced by the 10 h photoperiod. On day 76, seven tur- ions were observed. In the current study, only plants growing under the 11 h pho- toperiod produced turions for a total of 32 turions during the experiment. The timing ofturion production agrees with an earlier report that 56-day-old Hydrilla produced tubers but not turions and that 96-day-old Hydrilla produced both tub- ers and turions, when cultured outdoors under a naturally decreasing photoper- iod (Spencer and Ksander, 1991 ). Others have reported that turions were pres- ent within 42 or 56 days in cultures grown under short photoperiods (Pieterse et al., 1984; Thullen, 1990), but the plants in these experiments were grown from shoot cuttings and not sprouted tubers as in the present study. Depending on culture conditions from which they were taken, Hydrilla cuttings may have more or less stored reserves and may respond differently to nutrient stress than plants grown from sprouted tubers.
A i: I 1200 [
I .~ 800
600
400
200
20 40
Total
I I h
Total
15h
Tuber
I I h
Tuber
15h
60 80 100 120
7o
B
40
~ 30 ,-1
0 20 40 60 80 100 120
Days Days
I I h
15h
Fig. 1. Plant weight and tuber weight (A) and plant length (B) for Hydrilla grown under two photoperiods.

D. Spencer et aL / Aquatic Botany 48 (1994) 121-132 125
~0 co p_
e- (9
#.
100
80
,~0
40
20
0
100
80
60
I I Turion Tuber GSht
I---'1 Root Shotip Shoot
1 0 r g t r b
- - i
o 2~ 34 4'8 ~ ~'6 90
D a y s
Fig. 2. Allocation of total C to plant parts (Orgtrb, original tuber; Root, roots; GSht, geotropic shoots; Shoot, shoots; Shotip, 1 cm shoot tips; Tuber, new tubers; Turion, new turions) of Hydrilla grown under an 11 h (upper) or 15 h (lower) photoperiod. Values are the means of five replications, except for geotropic shoots, tubers, and turions which varied because not all plants produced these structures.
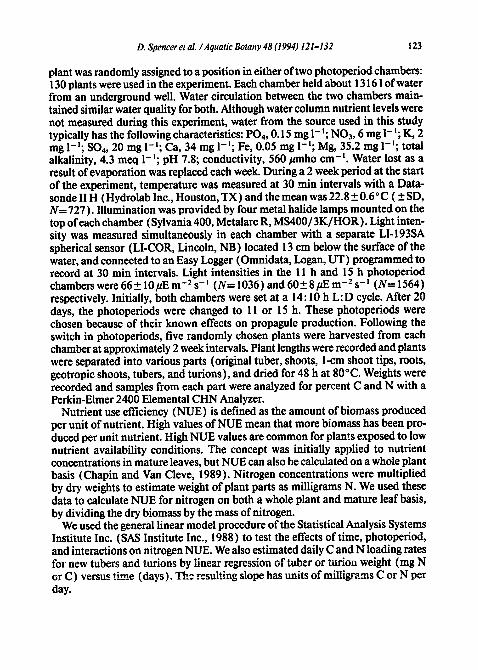
The concentration of C varied with plant part and age (Table 1 ). Tissue C levels reported here are similar to those reported for shoots (36 or 37%) of 56- day-old Hydrilla by Spencer and Ksander ( 1991 ). Carbon from the original tuber was initially allocated to shoots and roots (Ryan and Holmberg, 1990)..Plants grown under the short photoperiod shifted carbon from production of new shoots and roots into production of new tubers and subsequently into new turions (Figs. 2 and 3).
Tissue N levels also varied with plant part and age (Table 1 ). Young shoot tips had the highest levels of N. Shoot N levels were similar to those from 56-day-old Hydrilla (2.02 or 2.31%; Spencer and Ksander, 1991 ), and from 56-day-old or 112-day-old Hydrilla (0.92-1.51% and 1.19-1.59%, respectively; Sutton and Portier, 1991 ). Sutton and Portier (1983) reported that shoot N levels varied from 1.8 to 3.3% for Hydrilla collected from five locations in Florida. The pattern of N allocation to various plant parts was similar to that observed for C (Figs. 3 and 4).
Nitrogen use efficiency increased over time (F~2,56)= 147.08; P<0.0001 ) for plants grown at both photoperiods (Fig. 5), suggesting that N may have been

126 D. Spencer et aL / Aquatic Botany 48 (1994) 121-132
Table 1 Changes in C and N concentration in Hydrilla structures over time for plants grown under two pho- ~o~riods. Most values are based on five samples except geotropic shoG's, new tubers, and new tur- ions, which varied because not all plants produced these structures
Photoperiod Plant part Time C (%) N (%) (days)
Mean Standard Mean Standard error error
Original tuber 20 35.47 1.21 2.37 0.07 34 31.58 0.82 2.35 0.29 49 . . . . 62 . . . . 76 . . . . 90 . . . .
Shoots 20 36.91 0.26 3.34 O. 17 34 35.52 0.55 3.29 0.19 49 35.64 1.00 3.06 0.21 62 35.84 0.28 2.10 0.29 76 35.60 0.31 2.14 0.22 90 34.74 0.27 2.25 0.17
Shoot tips 20 39.89 0.35 4.94 0.10 34 36.27 1.05 4.14 0.15 49 32.44 1.73 3.30 0.12 62 36.45 0.97 2.98 0.10 76 37.10 0.24 2.96 0.10 90 36.28 0.28 2.73 0.19
Roots 20 36.54 0.65 2.22 0.28 34 32.30 0.38 2.16 0.17 49 32.65 2.20 1.41 0.13 62 29.76 1.45 1.28 0.09 76 33.12 0.13 1.61 0.08 90 34.65 0.31 1.51 0.05
Geotropic shoots 20 . . . . 34 32.97 2.87 2.20 0.29 49 33.31 1.01 1.24 0.06 62 34.18 0.50 0.96 0.04 76 33.87 0.43 1.02 0.14 90 35.55 0.60 1.12 0.08
New tuber 20 . . . . 34 . . . . 49 38.63 0.18 1.43 0.06 62 39.39 0.49 0.99 0.08 76 40.48 0.73 0.95 0.06 90 40.95 0.46 0.97 0.08
New turion 20 . . . . 34 . . . . 49 . . . . 62 . . . . 76 40.19 0.05 1.02 0.06 90 40.30 0.55 0.96 0.06
D. Spencer et al. /Aquatic Botany 48 (1994) 121-132
Table 1. Continued.
127
Photoperiod Plant part Time C (%) N (%) (days)
Mean Standard Mean Standard error error
Original tuber 20 34 49 62 76 90
Shoots 20 34 49 62 76 90
Shoot tips 20 34 49 62 76 9O
Roots 20 34 49 62 76 9O
Geotropic shoots 20 34 49 62 76 90
New tuber 20 34 49 62 76 9O
New turion 20 34 49 62 76 9O
35.20 2.00 2.24 0.39 30.16 3.06 1.55 0.38
37.87 0.85 3.54 0.22 34.75 0.35 2.62 0.15 35.05 1.14 2.31 0.12 35.13 0.30 1.76 0.09 35.75 0.57 1.62 0.07 36.58 0.48 1.45 0.13 40.86 0.54 4.97 0.06 37.07 2.34 4.17 0.27 35.93 0.88 3.44 0.06 37.20 0.53 2.95 0.05 37.16 0.30 2.9. ~ 0.13 38.34 0.37 2.36 0.04 35.67 0.83 2.67 0.18 35.39 0.95 2.00 0.18 34.96 0.81 1.68 0.15 33.97 0.60 1.73 0.06 33.64 0.31 1.57 0.08 32.52 1.95 1.52 0.18
32.26 - 1.57 - 32.71 - 0.77 -
35.92 - 1.12 -
38.07 - 2.74 - 38.35 - 1.22 -

128 D. Spencer et aL / Aquatic Botany 48 (1994) 121-132
600
500 03 E 400
¢~ 300
m 200 o
100
00
o,a.C
20 40 60 80 100 Time (Days)
35 3O
03 25 E = 20 O 03 15 2 z 10
5
Tota~l N ~
00 2"0 40 60 80 100
Time (Days)
Fig. 3. Distribution of carbon (upper) and nitrogen (lower) in Hydri/la and two plant fractions for plants growing under tuber-inducing conditions: total plant, roots+shoots, and new tubers. Plotted values are the means of five replications.
limiting to Hydrilla growth. Calculated on a whole-plant basis, nitrogen use effi- ciency did not differ between photoperiods (F(2.s6)= 0.86; P< 0.35 ). When cal- culated on the basis of mature leaves, nitrogen use efficiency was greater for plants grown under the long photoperiod (F(2,s6) = 60.23; P< 0.0008), indicating that these plants may have been more N-limited.
Turions were produced after tubers and were associated with a higher nitrogen use efficiency (Fig. 5). The data from the short photoperiod in this study agree with those reported by Pieterse et al. (1984) in that turions were associated with higher nitrogen use efficiency and presumably greater nitrogen limitation. How- ever, the present data support the idea that if stimulation ofturion production by nitrogen limitation occurs, it is secondary to the effect of photoperiod. Plants grown under long photoperiods did not produce turions even though they appar- ently experienced greater nitrogen limitation (as indicted by the higher nitrogen

D. Spencer et aL /Aquatic Botany 48 (1994) 121-132 129
100
6O
z I 4O
~9 2o 0 0 , r
C 100
,, ,,
60
20 =
Days
m Tudon Tuber
D G Sht EEl Root B ShotiD I ~ Shoot
Orgtrb
Fig. 4. Allocation of total N to plant parts (Orgtrb, original tuber; Root, roots; GSht, geotropic shoots; Shoot, shoots; Shotip, 1 cm shoot tips; Tuber, new tubers; Turion, new turions) of Hydrilla grown at an 11 h (upper) or 15 h (lower) photoperiod. Values are the means of five replications, except for geotropic shoots, tubers, and turions which varied because not all plants produced these structures.
use efficiencies). It should be noted however, that throughout the present exper- iment shoot tip N concentrations were above the 1.4% level that may indicate N limitation for some species of rooted aquatic plants (Gerloff and Krombholtz, 1966). It is also possible that the plants studied by Pieterse et al. (1984) were limited by a nutrient other than N, so it is not possible to completely reconcile their findings and those reported here. However, the present results demonstrate that when Hydrilla of similar nitrogen use efficiencies were grown at two photo- periods, only those grown at the short photoperiod produced turions.
Once tuber formation began C and N were directed to new tubers and turions apparently at the expense of producing new shoots and roots (Figs. 2, 3 and 4). C was stored in new tubers at a rate about 43 times that for N (Table 2). The estimated rates of C avd N allocation to new turions were about one-tenth those for tubers (Table 2). By the end of the experiment, 53% of total plant C was allocated to new tubers or turions by plants grown under the 11 h photoperiod (Figs. 2 and 3). About 3% of plant C was allocated to turions. About 32% of plant N was allocated to new tuber and turion production (Figs. 3 and 4). Again, much

130 D. Spencer et al. / Aquatic Botany 48 (1994) 121-132
~E ILl
::)
¢33 =o z
80
70
60
50
40
30
200
1 1 h ..4_.
1 5 h
a~ b I c~
Plant
20 40 60 80 100
Time (Days)
o>, 90 '- 80
o ~
e~ 60 f f l
~ 50 e -
g 40
° ~
z 200
1 1 h -e-..
1 5 h
a I b I c l
f f ~ Leaves
20 40 60 80 100
Time (Days) Fig. 5. Nitrogen use efficiency, calculated on a whole-plant (upper) or mature-leaf (lower) basis for Hydrilla grown at two photoperiods. Arrows indicate timing of important phenological events for plants grown at the short photoperiod: (a) geotropic shoots formed; (b) tubers formed; (c) turions formed.
Table 2 C and N loading rates for newly formed tubers and turions
Propagule type and Rate Significance of t-test 95% confidence component (rag day-' ) for hypothesis that rate limits
is equal to zero
C into new tubers 6.903 0.0001 5.115-8.690 N into new tubers 0. ! 62 0.0001 0.114-0.210 C into new turions 0.669 0.010 0.224-1.114 N into new turions 0.016 0.016 0.005-0.028
less N was allocated to turions (2%) than tubers. Van ( 1989 ) reported that mon- oecious Hydrilla grown in outdoor experiments in Florida allocated 11% or 16% of total biomass to new tubers. Madsen ( 1991 ) reported that for herbaceous and

D. Spencer et al. ~Aquatic Botany 48 (1994) 121-132 131
overwintering perennial aquatic macrophytes, on average more resources were allocated to asexual (25%) than sexual propagation (5%). The present data in- dicate that relative allocation to two types of asexual propagules, tubers and tur- ions, by Hydrilla also differs considerably.
The timing of tuber and turion production observed in this study may partially explain the greater abundance of tubers than turions reported for several natural Hydrilla populations (Mitra, 1955; Hailer and Sutton, 1975; Sutton and Portier, 1985; Harlan et al., 1985). Not only would starting tuber production earlier result in more tubers than turions, but turion production may be reduced or halted al- together by adverse conditions (e.g. desiccation) that may develop later in the season.
The present results indicate that: ( 1 ) Hydrilla produced tubers before turions; (2) C and N were directed into newly formed tubers and turions instead of new shoots and roots; (3) once tuber formation had begun the C loading rate into new tubers was about 43 times that for N; (4) for plants grown for 12 weeks, about 15 times more C and N went to tuber production than to turion produc- tion; (5) in the absence of information on photoperiod, nutrient use efficiency for N was not a good indicator of the onset of tuber or turion production.
Acknowledgments
We appreciate the comments of Larry Mitich, Frederick Ryan, Kurt Getsinger, John Madsen, and two reviewers who read an earlier version of the manuscript. Linda Whitehand, USDA Biometrics Unit, Albany, CA provided assistance with the statistical analysis. The participation of Steve Klaine and Frank Bailey was subtended by funds from the US Army Corps of Engineers, Aquatic Plant Con- trol Research Program and the US Department of Agriculture, Agricultural Re- search Service. Mention of a tradename does not constitute a warranty, guaran- tee, or an endorsement of the product by the US Department of Agriculture.
References
Chapin, F.S. and van Cleve, K., 1989. Approaches to studying nutrient uptake, use and loss in plants. In: R.W. Pearcy, J.R. Ehleringer, H.A. Mooney and P.W. Rundel (Editors), Plant Physiological Ecology: Field Methods and Instrumentation. Chapman and Hall, New York, pp. 185-207.
Gedoff, G.C. and Krombholtz, P.H., 1966. Tissue analysis as a measure of nutrient availability for the growth of angiosperm aquatic plants. Limnol. Oceanogr., 11: 529-537.
HaUer, W.T. and Sutton, D.L., 1975. Community structure and competition between Hydrilla and Val;isneria. Hyacinth Control J., 13: 48-50.
Harlan, '~3.M., Davis, GJ . and Pesacreta, G.J., 1985. Hydrilla in three North Carolina lakes. J. Aquat. Plant Manage., 23: 68-71.
Langeland, K.A. and Smith, C.B., 1984. Hydrilla produces viable seed in North Carolina Lakes--a mechanism for long distance dispersal. Aquatics, 6:20-21.
Madsen, J.D., 1991. Resource allocation at the individual plant level. Aquat. Bot., 41: 67-86. Mitra, E., 1955. Contributions to our knowledge of Indian freshwater plants. 1. On some aspects of
132 D. Spencer et al. /Aquatic Botany 48 (1994) 121-132
the structure and life history of Hydrilla verticillata Presl with notes on its autecology. J. Asiatic Soc., 2: !-!6.
Pieterse, A.H., 1981. Hydrilla vertici!lata--a review. Abstr. Trop. Agric., 7:9-34. Pieterse, A.H., ! 983. Announcement. Aquat. Bot., 16:313. Pieterse, A.H., Staphorst, H.P.M. and Verkleij, J.A.C., ! 984. Some effects of nitrogen and phosphorus
concentration on the phenology ofHydrilla verticillata (L.f.) Royle. J. Aquat. Plant Manage., 22: 62-63.
Richards, J., 1982. Developmental potential of axillary buds of water hyacinth, Eichhornia crassipes Solms (Pontederiaceae). Am. J. Bot., 69: 615-622.
Ryan, EJ. and Holmberg, D.L., 1990. Forms of nitrogen in turions of Hydrilla verticillata during the overwintering period. Physiol. Plant., 79: A85.
Sculthorpe, C.D., 1967. The Biology of Aquatic Vascular Plants. Edward Arnold, London, 610 pp. Spencer, D.F. and Anderson, L.W.J., 1986. Photoperiod responses in monoecious and dioecious Hy-
drilla verticillata. Weed Sci., 34:55 !-557. Spencer, D.F. and Rejmanek, M., 1989. Propagules type influences competition between two sub-
mersed aquatic macrophytes. Oecologia, 81: 132-137. Spencer, D.F. and Ksander, G.G., 1991. Comparative growth and propagule production by Hydrilla
verticillata grown from axillary turions or subterranean turions. Hydrobiologia, 222:153-158. Spencer, D.F., Anderson, L.W.J., Ames, M.D. and Ryan, F.J., 1987. Variation in Hydrilla verticillata
(L.f.) Royle propagule weight. J. Aquat. Plant Manage., 25:11-14. Statistical Analysis Systems Institute Inc., 1988. SAS/Stat User's Guide, Release 6.03 edn. SAS Insti-
tute Inc., Cary, NC, 1028 pp. Steward, K.K. and Van, T.K., 1987. Comparative studies of monoecious and dioecious hydri!la (Hy-
drilla verticillata) biotypes. Weed Sci., 35:204-2 ! 0. Sutton, D.L. and Portier, K.M., 1983. Variation of nitrogen, phosphorus, and potassium contents of
hydrilla in South Florida. J. Aquat. Plant Manage., 21: 87-91. Sutton, D.L. and Portier, K.M., 1985. F~n~ity of tubers and turions of hydrilla in south Florida. J.
Aquat. Plant Manage., 23: 64-67. Sutton, D.L. and Portier, K.M., 1991. Influence of spikerush plants on growth and nutrient content
ofHydrilla. J. Aquat. Plant Manage., 29:6-11. Thullen, J.S., 1990. Production of axillary turions by the dioecious Hydrilla verticillata. J. Aquat.
Plant Manage., 28:11-15. Titus, J.E. and Hoover, D.T., 199 !. Toward predicting reproductive success in submersed freshwater
angiosperms. Aquat. Bot., 41:111-136. Van, T.K., 1989. Differential responses to photoperiods in monoecious and dioecious Hydrilla verti-
cillata. Weed Sci., 37: 552-556. Watson, M.A. and Brochier, J., 1988. The role of nutrient levels on flowering in water hyacinth. Aquat.
Bot., 31: 367-372.