Embed Size (px)
Citation preview

Vegetative Anatomy of Rhododendron with a Focus on a Comparison between Temperate
and Tropical Species
Tatpong Tulyananda
Dissertation submitted to the faculty of the Virginia Polytechnic Institute and State University in partial fulfillment of the requirements for the degree of
DOCTOR OF PHILOSOPHY
IN
BIOLOGICAL SCIENCES
Erik T. Nilsen (Chair)
Khidir W. Hilu
Dorothea D. Tholl
Audrey Zink-Sharp
SEPTEMBER 02, 2016
VIRGINIA POLYTECHNIC INSTITUTE AND STATE UNIVERSITY, BLACKSBURG, VIRGINIA
KEYWORDS: LEAF ANATOMY, WOOD ANATOMY, HYDRAULIC SAFETY, HYDRAULIC EFFICIENCY, IDIOBLAST, LEAF WATER RELATIONS, ELEVATION, VESSEL ELEMENT
Vegetative Anatomy of Rhododendron with a Focus on a Comparison between
Temperate and Tropical Species
Tatpong Tulyananda
Abstract
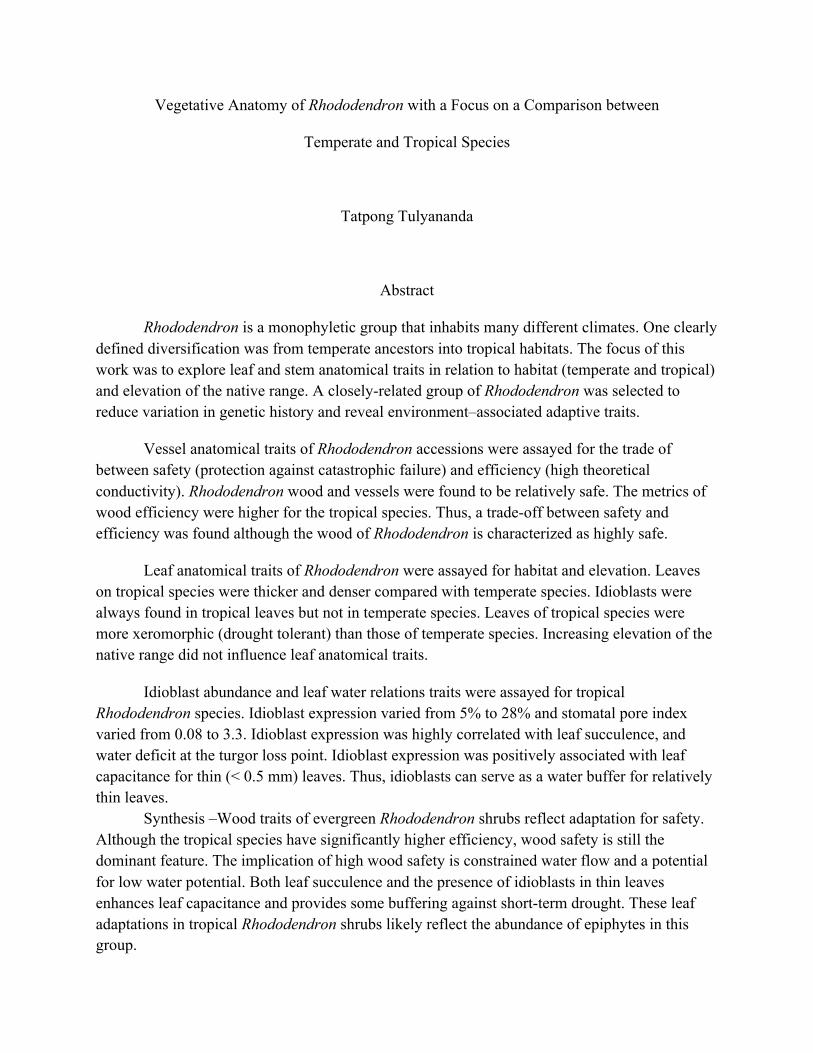
Rhododendron is a monophyletic group that inhabits many different climates. One clearly defined diversification was from temperate ancestors into tropical habitats. The focus of this work was to explore leaf and stem anatomical traits in relation to habitat (temperate and tropical) and elevation of the native range. A closely-related group of Rhododendron was selected to reduce variation in genetic history and reveal environment–associated adaptive traits.
Vessel anatomical traits of Rhododendron accessions were assayed for the trade of between safety (protection against catastrophic failure) and efficiency (high theoretical conductivity). Rhododendron wood and vessels were found to be relatively safe. The metrics of wood efficiency were higher for the tropical species. Thus, a trade-off between safety and efficiency was found although the wood of Rhododendron is characterized as highly safe.
Leaf anatomical traits of Rhododendron were assayed for habitat and elevation. Leaves on tropical species were thicker and denser compared with temperate species. Idioblasts were always found in tropical leaves but not in temperate species. Leaves of tropical species were more xeromorphic (drought tolerant) than those of temperate species. Increasing elevation of the native range did not influence leaf anatomical traits.
Idioblast abundance and leaf water relations traits were assayed for tropical Rhododendron species. Idioblast expression varied from 5% to 28% and stomatal pore index varied from 0.08 to 3.3. Idioblast expression was highly correlated with leaf succulence, and water deficit at the turgor loss point. Idioblast expression was positively associated with leaf capacitance for thin (< 0.5 mm) leaves. Thus, idioblasts can serve as a water buffer for relatively thin leaves. Synthesis –Wood traits of evergreen Rhododendron shrubs reflect adaptation for safety. Although the tropical species have significantly higher efficiency, wood safety is still the dominant feature. The implication of high wood safety is constrained water flow and a potential for low water potential. Both leaf succulence and the presence of idioblasts in thin leaves enhances leaf capacitance and provides some buffering against short-term drought. These leaf adaptations in tropical Rhododendron shrubs likely reflect the abundance of epiphytes in this group.

Vegetative Anatomy of Rhododendron with a Focus on a Comparison between
Temperate and Tropical Species
Tatpong Tulyananda
General Audience Abstract
Rhododendron is a very diverse genus that is found in many different habitats from arctic to tropical. However, most of the species are evergreen with a slow growth rate. The goal of this study was to explore the variation in wood and leaf anatomical traits in order to explain how these plants can succeed in so many different habitats. The vessels in wood of temperate species were found to be very small. Although the size of the vessels increased for tropical species, they were still small relative to many other species. Surprisingly, leaf traits suggested greater drought tolerance for tropical species compared with temperate species. A unique anatomical trait called idioblasts was found only in leaves of tropical species. Idioblasts were very large cells, found just below the upper epidermis, which occupied up to 30% of the leaf volume. Idioblasts were found to help buffer water loss for thin tropical leaves. In summary, Rhododendron wood constrains water flow for plants in all habitats, which will induce water stress in warm or dry areas. Consequently, leaves have drought tolerance traits in tropical regions. Therefore, anatomical traits of wood and leaf help explain how Rhododendron species can occupy a wide diversity of habitats.

iv
ACKNOWLEDGEMENTS
This research could not have been accomplished without countless hours of
guiding, supporting, contributing, encouraging and forgiving from my dearest advisor,
Dr. Erik Nilsen. No words could explain how appreciate I am for everything he has done
for me. It has been such a wonderful time to work with such a role model like him. Huge
thanks to the committee, Drs. Khidir Hilu, Dorothea Tholl, and Audrey Zink-Sharp for
your valuable contributions, and comments. Special thanks to Dr. Audrey Zink-Sharp, for
your kindness to support me with techniques, equipment, and lab space.
The huge gratitude goes to my family, the Tulyanandas, mom, dad, brothers,
grandparents, aunts, uncles, and cousins for your loves and supports. I am so sorry I did
not have chance to say goodbye to some of you.
Financial supports were provided by The Royal Thai Government, Department of
Biological Science, Virginia Tech, The Rhododendron Species Foundation & Botanical
Garden, JSTP scholarship-NSTDA Thailand, and the Tulyanandas. Without their
supports, this study could not be conducted.
Many thanks to technicians, friends and organizations for their supports in both
academic and non-academic way: Dr. Ann Norris, Deborah Wiley, Zhe Bao, Jackson
Mitchell, Alex Sumadijaya, Kyle Mirabile, Alex Jackson, Sandy Janwatin, Rose
Peterson, Karen Nilsen, Alex Gerig, Jack Sismour, Tristan Stoyanof, Wesley Wallner,
David Snyder, Jeff Witten, Tim Smart, Caleb Copeland, Thai Student Association, VT
BGSA, The Marching Virginians, MVBones, VT bands, and all of my Bio Lab students.

v
ATTRIBUTIONS
Chapter 1 –Vegetative functional traits, Rhododendron taxonomy and the research plan:
To present background information needed to understand functional traits of leaves and
stems with a focus on evergreen shrubs and the taxonomic relationships in
Rhododendron. 1) Erik T Nilsen, PhD is currently professor of Plant Ecology in the
Department of Biological Sciences at Virginia Tech. Dr. Nilsen provided mentorship and
literature concerning the genus Rhododendron and functional trait theory.
Chapter 2 - Exploration of wood anatomical traits among accessions of Rhododendron: A
focus on the relationship with the elevation and climate (temperate vs. tropical) of the
native range. 1) Erik T Nilsen, PhD is currently professor of Plant Ecology in the
Department of Biological Sciences at Virginia Tech. Dr. Nilsen assisted with
experimental design, helped attain accession material and assisted in data analyses. 2) Dr.
Ann Norris, and Kyle Mirabile, assisted with stem sectioning, permanent slide preparing,
and Nikon NIS-Elements Basic Research program.
Chapter 3 – Exploring leaf anatomical traits of Rhododendron accessions: A focus on the
relationship with the elevation and habitat (temperate vs. tropical) of the native range. 1)
Erik T Nilsen, PhD is currently professor of Plant Ecology in the Department of
Biological Sciences at Virginia Tech. Dr. Nilsen assisted with experimental design,
helped attain accession material and participated in some sample preparation and
analysis. 2) Melanie Taylor was a MAOP student who helped with sample preparation
and image capture. 3) Courtney Johnson was an undergraduate Biochemistry major who
helped preparing slides.

vi
Chapter 4 - The significance of idioblast to bulk leaf water relations in tropical accessions
of Rhododendron. 1) Erik T Nilsen, PhD is currently professor of Plant Ecology in the
Department of Biological Sciences at Virginia Tech. Dr. Nilsen assisted with
experimental design, helped attain accession material performed the pressure volume
curves, and assisted in data analyses. 2) Melanie Taylor was a MAOP student who helped
with image capture and data base formation. 3) Courtney Johnson was an undergraduate
Biochemistry major who helped preparing slides.

vii
TABLE OF CONTENTS
CHAPTER 1: Vegetative functional traits, Rhododendron taxonomy and the research plan
1.1 Importance of leaf and stem anatomical traits to plant fitness ...………………….…. 1
1.2 Problem of determining the functional significance of anatomical traits …………… 3
1.3 Rhododendron classification ………………….……………………….………….…. 5
1.31 Origin of Rhododendron and its initial range …………….…………….…. 8
1.32 Diversifications of Rhododendron species ………………….…….……...… 9
1.33 Temperate to tropical diversification ...………………….….………....….. 11
1.34 Relict distributions ………………………………………...……………… 11
1.4 Current knowledge of Rhododendron anatomical traits ……………...……………. 12
1.41 Temperate Rhododendron anatomical traits …………...………………… 14
1.42 Tropical Rhododendron anatomical traits ………….….…………………. 15
1.5 Overall goal of this work ……………………….….…………….………………… 17
1.51 Approach Taken in this research effort …...……….….……….……….… 17
1.6 Literature cited …….……………………….….………….…………….….….…… 19
1.7 Tables ………………………………………………….…….……………….….…. 23
1.8 Figure legends ………………………………………….……………………….….. 26
1.9 Figures .…………….…………………………………....……….………...……….. 27
CHAPTER 2: Exploration of vascular anatomical traits among species of Rhododendron
2.1 Introduction …………………………………………….………………….…….…. 32
viii
2.2 Materials and methods ………………………….….……………………………..... 36
2.21 Selected accessions …….…………….….………………………………... 36
2.22 Stem preparation and microtomy ……...……………………………….…. 36
2.23 Staining and dehydration ……….…………..….…………………………. 37
2.24 Xylem traits measured ………………………………….….….…………... 37
2.25 Statistical analyses ………………….….…..…………………..…………..38
2.3 Results …………….….…………………………….…….……...…………………. 39
2.31 ANOVA results ……...…….……………………….………....….…...…… 39
2.32 Regression results ……….………......…….………….………....……..…. 42
2.4 Discussion ……………….……….………….…….……………………...….…….. 46
2.41 Rhododendron wood …….……………………………………….….…..... 46
2.42 Addressing hypothesis one …….………….………….…………………… 47
2.43 Addressing hypothesis two ….…………………….….…………………… 49
2.44 Addressing hypothesis three …….……………….….………….….……... 51
2.45 Implications for Rhododendron ecology ……….…………….………...… 52
2.46 Summary and conclusion ……….……………...............……………....…. 55
2.5 Literature cited …………….….…….….…………………………………….…….. 56
2.6 Tables …………………………………………………………………...……….…. 60
2.7 Figure legends ……………………………………………………….….………….. 68
2.8 Figures ………………………………………………………………….….……….. 70

ix
CHAPTER 3: Exploring leaf anatomical traits of Rhododendron species
3.1 Introduction ................................................................................................................ 80
3.2 Materials and methods ............................................................................................... 84
3.21 Selected accessions ...................................................................................... 84
3.22 Leaf traits surveyed ...................................................................................... 84
3.23 Statistical analysis ....................................................................................... 87
3.3 Results ........................................................................................................................ 87
3.31 Leaf morphology and anatomy.................................................................... 87
3.32 Stomata........................................................................................................ 90
3.33 Idioblasts ...................................................................................................... 91
3.34 Leaf adaxial trichomes ................................................................................. 91
3.35 The relationship between theoretical specific conductivity and leaf stomatal
pore index ........................................................................................................... 92
3.4 Discussion .................................................................................................................. 92
3.41 General leaf structure .................................................................................. 92
3.42 Addressing hypothesis one ........................................................................... 93
3.43 Addressing hypothesis two ........................................................................... 96
3.44 Addressing hypothesis three ........................................................................ 97
3.45 Summary and conclusion............................................................................. 98
3.5 Literature cited ............................................................................................................99
3.6 Tables ....................................................................................................................... 102

x
3.7 Figure legends .......................................................................................................... 110
3.8 Figures ...................................................................................................................... 112
CHAPTER 4: The significance of idioblasts to bulk leaf water relations in tropical
accessions of Rhododendron
4.1 Introduction .............................................................................................................. 124
4.2 Materials and methods ............................................................................................. 127
4.21 Plant growth conditions ............................................................................. 127
4.22 Leaf collection ............................................................................................ 128
4.23 Leaf anatomy .............................................................................................. 128
4.24 Moisture release curves ............................................................................. 130
4.25 Data analysis and statistics ....................................................................... 130
4.3 Results ...................................................................................................................... 131
4.31 Leaf anatomy .............................................................................................. 131
4.32 Water relations .......................................................................................... 131
4.33 Correlations ............................................................................................... 132
4.34 Regressions ................................................................................................ 135
4.35 Stepwise and regression models ................................................................ 135
4.4 Discussion ................................................................................................................ 136
4.41 General anatomical characteristics of the Rhododendron leaf ..……........ 136
4.42 Addressing hypothesis one ......................................................................... 138

xi
4.43 Addressing hypothesis two ......................................................................... 139
4.44 Addressing hypothesis three ...................................................................... 140
4.45 Addressing hypothesis four ........................................................................ 141
4.46 Summary and conclusion ........................................................................... 141
4.5 Literature cited ......................................................................................................... 143
4.6 Tables ....................................................................................................................... 148
4.7 Figure legends .......................................................................................................... 153
4.8 Figures ...................................................................................................................... 154
CHAPTER 5: Synthesis of research result, ecological implication of anatomical traits
5.1 Reflections and relationships with the Leaf Economic Spectrum ........................... 156
5.2 Limitations to productivity....................................................................................... 157
5.3 Consequences to habitat tolerances ......................................................................... 158
5.4 Limitations and potential improvement ................................................................... 160
5.5 General conclusions from this study ........................................................................ 162
5.6 Literature cited ......................................................................................................... 164
5.7 Table ........................................................................................................................ 166

xii
LIST OF TABLES:
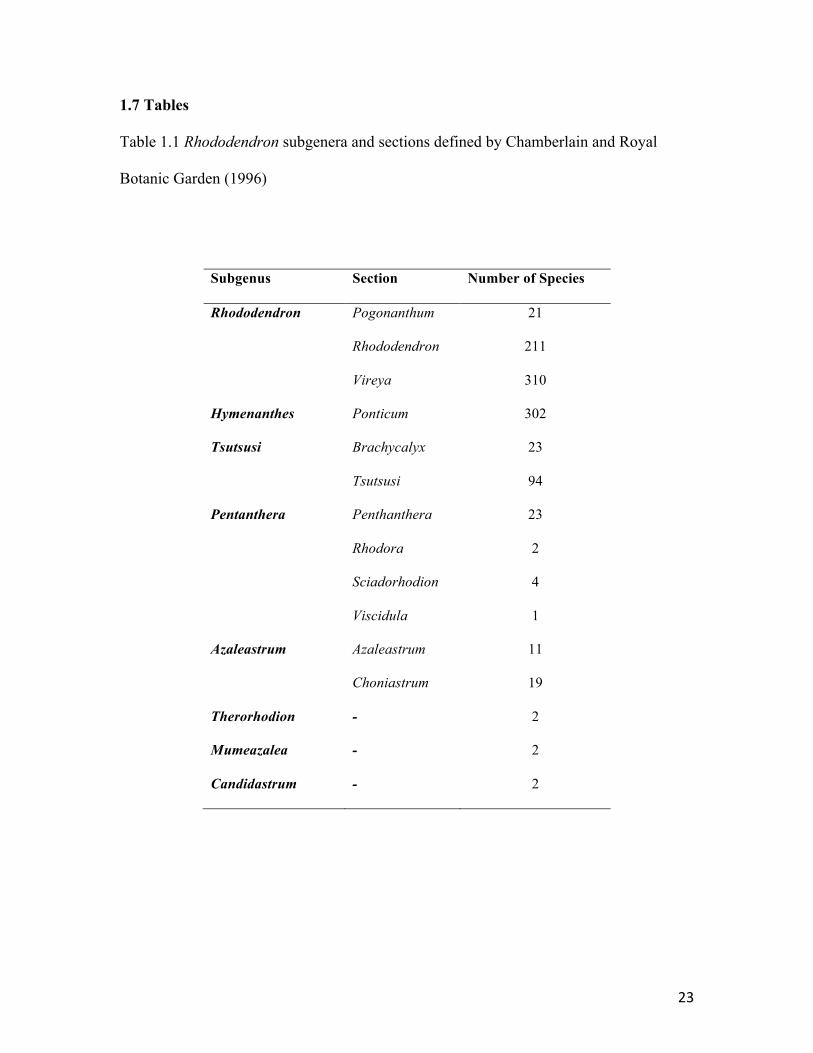
Table 1.1 Rhododendron subgenera and sections ….…….…………………….…….… 23
Table 1.2 A molecular classification of Rhododendron ……………...….….....…….… 24
Table 1.3 The two most recent classifications of tropical Rhododendron ….……..…… 25
Table 2.1 List of the Rhododendron species used in this study …………….…..….…... 60
Table 2.2 Two-way ANOVA table for vessel traits …………...…………….…..…….. 63
Table 2.3 Two-way ANOVA table for skewness and kurtosis ………………..…….…. 64
Table 2.4 Two-way ANOVA table for wood transport efficiency traits .……….……... 65
Table 2.5 Regression results for wood traits against mean elevation …………..….…... 66
Table 2.6 Regression results for wood traits against wood area ……...…..……...…...... 67
Table 3.1 A list of the Rhododendron species used ….………………...….…..…….... 102
Table 3.2 Two-way ANOVA table for leaf morphology traits .……..…...…......…...... 105
Table 3.3 Two-way ANOVA table for stomata traits ….….….……………..….…….. 107
Table 3.4 One-way ANOVA table for idioblast traits .………………….......…..…..... 108
Table 3.5 Regression results for the relationship between SPI and Kstheo ….………..…109
Table 4.1 Results from one-way ANOVA of species effect on leaf traits …….…...…. 148
Table 4.2 Results from one-way ANOVA of species effect on leaf water relations ..... 149
Table 4.3 Correlations among anatomical, stomatal, and water relations ….…….……150
Table 5.1 Comparing greenhouse-grown to field-grown plants ……………………….166

xiii
LIST OF FIGURES:
Figure 1.1 Comparison diagram of Leaf Economic Spectrum ……..…………….……..27
Figure 1.2 A diagrammatic representation of consensus tree based on RPB2-I gene..….28
Figure 1.3 Focus areas for Rhododendron species diversity .…….…….………..….…. 29
Figure 1.4 The geographic distribution of the 7 groups of Vireya ….…..…...…………. 30
Figure 1.5 Climatic conditions in temperate and tropical mountain habitats ….....….… 31
Figure 2.1 A cross section micrograph of R. jasminiflorum stem ……………...……….70
Figure 2.2 Box plots of vessel traits ………………………………………………...…...71
Figure 2.3 Box plots of mean skewness and kurtosis …………….………………...….. 73
Figure 2.4 Box plots of the hydraulic traits ……………………………………...….…. 74
Figure 2.5 Regression of vessel diameter against vessel density ………………...….…. 76
Figure 2.6 Regression of wood area against whole stem area ……………………….… 78
Figure 3.1 Representative cross sections of Rhododendron leaves ……..….…...……. 112
Figure 3.2 Box plots of leaf morphological traits …….…………..…………..…….… 115
Figure 3.3 Box plots of leaf abaxial stomatal traits …….…..………...…………….… 118
Figure 3.4 Box plots of leaf idioblast traits …………….……………………………... 120
Figure 3.5 Distributions of trichome types …………….……………………………... 121
Figure 3.6 Regression plot for the relationship between SPI and Kstheo ………………..123
Figure 4.1 Representative cross section images of leaf lamina …….….….….………. 154
Figure 4.2 Regressions of water relations traits against idioblast expression ……...… 155

1
CHAPTER 1
Vegetative functional traits, Rhododendron taxonomy and the research plan
1.1 Importance of leaf and stem anatomical traits to plant fitness
Vegetative functional traits are characteristics of plants that strongly influence or
regulate important functions related to plant fitness. Arguably, one of the most important
functions of plants is photosynthesis. Most plants acquire carbon resources from
photosynthesis, which in most cases, happens in leaves. Even though photosynthesis is
based on biochemical process, leaves are the physical environments where
photosynthesis occurs. There are many anatomical traits in leaves or other associated
factors such as water balance that influence photosynthesis. Leaf stomata are one
example of a functional anatomical trait, because they control carbon dioxide exchange,
regulate transpiration and influence the water potential gradient. Leaf chemical
characteristics can protect leaves against herbivores that could remove or destroy
photosynthetic potential. The protective chemicals can be accumulated inside the leaf or
outside as in glandular trichomes. Many of these anatomical, morphological or chemical
traits of leaves constitute the phenotypic variation that promotes photosynthesis and plant
fitness in different climatic conditions.
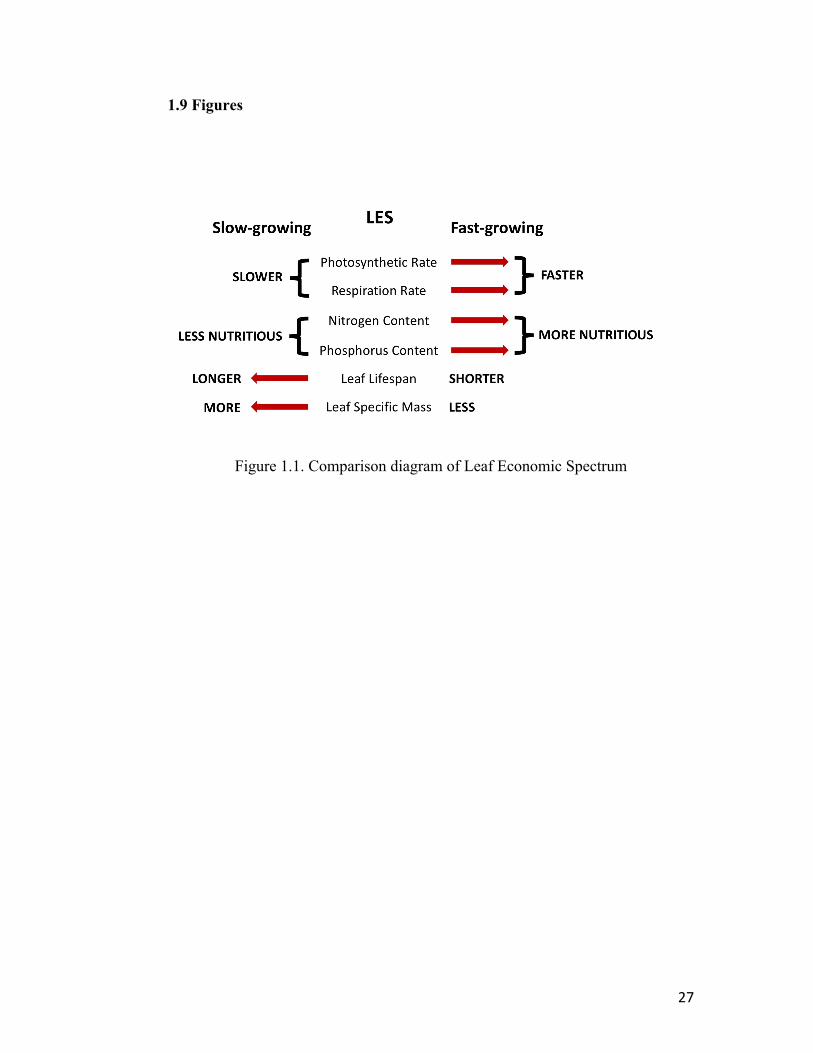
The Leaf Economics Spectrum (LES) hypothesis was clearly described (Reich
2014) as a unifying theory of the relationship between leaf traits and climate. This theory
is based on a trade-off between leaf production investment and plant fitness (Figure 1.1)
Faster growing plants have higher nitrogen content in leaves with a lower investment in
structure and do not last as long, but yield higher photosynthesis rates. Leaves on slow-

2
growing plants tend to last longer, have higher structure (higher mass per area), a lower
nitrogen content, and a lower photosynthetic rate. However, these relationships are based
on log-log plots, which hide the large variation in these correlations within individual
taxonomic groups, climates or habitats. The large amount of hidden variation suggests
that there are other leaf functional traits than those included in the LES that may
determine the variation seen in the LES theory. For example, slow growing evergreen
shrubs reside in a diversity of different habitat types from tropical lowland to arctic shrub
land. Variation in leaf anatomy and morphology among evergreen plants that reside in
these different habitat types may be more important to their respective fitness than simply
the slow-growth syndrome traits defined by the LES.
Xylem traits also are important for determining the fitness of plants in different
climates. A majority of a plant stem is composed of xylem, which is the water
transporting tissue. One of the most important functions of a stem is to transport water
upward and thus supply water to foliage. Vessel elements, which are subunits of xylem
conduits need to maintain hydraulic conductivity from root to shoot. Cavitation in vessel
elements, caused by embolisms inhibits hydraulic conductance. The main reasons for
embolism are drought and freeze-thaw cycles. Larger diameter vessels (> 30 µm) are
more susceptible to embolism compared to smaller vessels. In addition, the greater the
number of vessel wall pits the greater the vulnerability to drought-induced embolism.
Plants in temperate habitats have to cope with frequent freeze-thaw cycles that can induce
embolism during the winter. Species with smaller vessel diameter are considered “safer”
because such plants are less susceptible to embolism (Sperry and Sullivan 1992),
particularly in response to freeze-thaw cycles.

3
In contrast, the potential magnitude of hydraulic capacitance (termed efficiency)
is dependent upon vessel density and vessel diameter. Plants that have larger vessels and
a greater density of functional vessels have greater efficiency. Thus, there is a tradeoff
between “safety”, smaller vessel diameter, and “efficiency”, larger vessel diameter.
Hydraulic safety may be more important to temperate species, while hydraulic efficiency
may be more important to tropical species. Therefore, this trade-off between stem
efficiency and safety may be an important way that evergreen shrubs (for example
Rhododendron species) adapt to major climatic differences such as the difference
between temperate and tropical climates.
1.2 Problem of determining the functional significance of anatomical traits
It is clear that anatomical traits of leaves and stems can be important ways that
plants adapt to their environment. Although this concept has been studied many times,
there is often a complicating factor in these studies. The ultimate cause of variation in
anatomical traits is both the environment and the genome. Environment can induce some
anatomical variation, yet studies in common gardens often point to significant genetic
regulation of anatomical traits. Variation in anatomical traits can often evolve through
microevolution where natural selection is acting upon genetic material. Therefore, the
phylogenetic history of a lineage can be an important cofactor that influences the
variation in traits between environments. This confounding effect of phylogenetic history
is a significant problem when trying to understand if the variation in an anatomical trait
has adaptive significance.

4
Three of the ways of addressing the problem of separating phylogenetic history
from environment-induced microevolution of anatomical traits are:
1) Study anatomical traits of a monophyletic group that has members in each of
the selected environments. If traits are significantly different between the environments,
then these are functionally significant for each environment because the confounding
effect of phylogenetic history is minimized.
2) Study anatomical traits of several different phylogenetic groups in each of the
different environments. If anatomical traits are consistent among different groups within
each environment and significantly different between environments, then the anatomical
differences most likely have functional significance due to convergent evolution among
groups that have independent phylogenetic history.
3) Map anatomical traits on a known phylogenetic diversification from one
environment into another environment. If the anatomical traits change quantitatively
along the diversification axis, then the traits most likely have functional significance.
The goal of this study was to examine how anatomical traits of leaves and stems
vary among members of a monophyletic group (Rhododendron) that has both temperate
and tropical species. Thus, technique one was used to minimize the confounding effect of
phylogenetic history on the comparison of anatomical traits for species in temperate and
tropical habitats.

5
1.3 Rhododendron classification
There are approximately 1,000 species recognized in Rhododendron (Ericaceae),
which encompass a wide diversity of growth forms and growth habitats (Davidian 1995,
Chamberlain and Royal Botanic Garden 1996, Cox and Cox 1997). Growth forms include
ground vines, bog perennials, small epiphytic shrubs, large shrubs, small trees, and large
canopy trees. The native ranges of Rhododendron species occur from sea level to 5,000 m
in elevation (Argent 2006). Rhododendron species are distributed in tropical, temperate,
and arctic habitats and occur in Europe, North America, the Himalayan region and
throughout Asia. The restriction of most Rhododendron species to the northern
hemisphere suggests a Laurasian origin. In fact, there are only two Rhododendron species
in Gondwanan regions (Australia), and those are relatively new colonists.
Efforts to classify species of Rhododendron extends back to Linnaeus who named
the first Rhododendron species including Rhododendron maximum L. (Blacksburg, VA’s
local dominant species). The first thorough treatment of the genus was prepared by
Sleumer (1949), based primarily on herbarium specimens and a few excursions to
Indonesia and Malaysia. Sleumer’s taxonomy of Rhododendron expanded on the
treatment by Linnaeus. These early efforts to classify Rhododendron species were
focused on accounts by explorers, living collections and herbaria specimens in Europe
(Sweden, Netherlands, and British Isles) and culminated in a most thorough treatment
from the Royal Botanic Garden Edinburgh, prepared by Chamberlain (Chamberlain and
Royal Botanic Garden 1996).

6
The morphological classification of Rhododendron used by Chamberlain and
Royal Botanic Garden (1996) is based on leaf scale morphology, leaf longevity
(deciduous or evergreen ), floral morphology and branching architecture. The presence or
absence of leaf scales forms a major dichotomy in Rhododendron resulting in lepidote
species (with leaf scales) referred to as subgenus Rhododendron and elepidote species
(without leaf scales) were placed in several subgenera including Hymenanthes. Subgenus
Rhododendron, which includes almost half of all species in the genus Rhododendron,
includes the majority of tropical species. Subgenus Hymenanthes contains a majority of
all elepidote species. The other 6 subgenera of elipidotes have much fewer species than
Hymenanthes (Table 1.1). Chamberlain grouped Rhododendron into 8 subgenera and 12
sections. Of the 8 subgenera, Rhododendron and Hymenanthes were considered the most
monophyletic and they contained the majority of species in the genus (Table 1.1).
Subgenus Rhododendron was divided into 3 sections (Rhododendron, Pogonanthum, and
Vireya) while subgenus Hymenanthes had only 1 section (Ponticum). Subgenus Vireya
was dominated by tropical species while Pogonanthum and Rhododendron were
dominated by temperate species. A majority of species in Hymenanthes had temperate
range and were distributed among the various continental locations associated with a
Laurasian origin (e.g. Europe, North America, Japan, Taiwan, China, Russia). (Table 1.1)
Over the past 15 years there have been multiple attempts to use molecular
techniques to classify Rhododendron species and define phylogenetic patterns.
Rhododendron has been shown to be a strongly monophyletic group in the Ericaceae and
should include both Ledum and Menziesia (Kron and Judd 1990a). Moreover, subgenus
Therorhodion was a sister group to all other Rhododendron groups (Kron 1997,

7
Kurashige et al. 2001), based on the ITS1 and 2 spacer regions. Later, subgenus
Rhododendron was determined to be polyphyletic and that Pentanthera (deciduous
shrubs) were aligned inside the Rhododendron polyphyletic group (Kron and Johnson
1998). These data were considered preliminary because only a few taxa were used for
each group. A most parsimonious tree for the genus Rhododendron (Goetsch et al. 2005)
was based on consensus sequences of the RPB2-1 nuclear gene from 87 species. The
result of this analysis reduced the number of subgenera to five, but retained subgenus
Rhododendron as a monophyletic group with three sections including Vireya. (Table 1.2)
Throughout the history of morphological and molecular studies of Rhododendron
classification, Vireya has been considered a strong monophyletic group aligned within
subgenus Rhododendron. Chamberlain’s morphological taxonomy was updated by
Argent in relation to section Vireya (Argent 2006). Argent divided Vireya into 7
subsections based mostly on floral and bud traits (Table 1.3). Also, Brown et al. (2006)
published a molecular treatment of Vireya based on ITS sequences that showed many of
the subsections identified by Argent were polyphyletic. In fact, the phylogenetic
relationships seemed to be more governed by geographic range than morphological traits.
In 2011 a new molecular treatment of Vireya was published (Goetsch et al. 2011) that
supported 4 monophyletic subsections in Vireya (Figure 1.2) in ancestral to derived order
(Discovireya, Pseudovireya, Malayovireya, Euvireya). Craven et al. (2011) suggested
that the correct placement of Vireya was at the sectional level under the name Schistanthe
because of historical naming protocols (Table 1.3).
Argent (2015) explains the controversy about the placement of Vireya in
Rhododendron. His placement of this group at the subgenus level follows the original

8
work by Sleumer in 1949. This placement is based on enhancing the ability to name
species and place them into groups based on strong morphological, and chemical
grounds. Therefore, Argent’s 2015 treatment offers a practical way to divide the large
group into subunits so that species can be uniquely identified and named. In contrast,
other efforts exclusively used DNA sequence similarities to identify monophyletic
arrangements of entities in this group (Brown et al. 2006, Craven et al. 2011, Geotsch et
al. 2011). The weak congruence between the morphology and molecular classifications
may be due to the fairly recent diversification of this group into tropical southeast Asia.
In fact, species isolation may be incomplete because Argent (personal communication)
speaks of many hybrid swarms in natural habitats, and entities identified as species easily
hybridize in culture. The group will be defined as subgenus Vireya throughout this report
based on the most recent treatment by Argent (2015). However, when consider how traits
of plants changed during their diversification into the tropical region, the analysis is
based on the molecular evidence (ITS sequence) for that diversification event (Goetsch et
al. 2011). (Table 1.3)
1.31 Origin of Rhododendron and its initial range—Fossils of Rhododendron taxa
pollen were first reported in 1981 (Muller 1981) in the upper Paleocene, which dates to
about 60 million years ago (Zetter and Hesse 1996). Rhododendron pollen is easily
identified because it is found in groups of four (tetrads) simplifying the ability to identify
them. Also, the fossil record indicates that Rhododendron species existed 50 million
years ago in Alaska. Unfortunately, Rhododendron fossils are not abundant, in the record
which may be due to their upland range and well-drained habitat (Irving 1993).

9
The climate was warmer and more stable during early Rhododendron history in
the Laurasian circumboreal forest (Irving 1993). Plants could flourish at relatively high
latitude and elevation compared to the present due to the warmer climate. During this
time, Rhododendron species were uniformly distributed across Laurasia compared to the
recent period. Global climate change, continental drift and the rise of mountains are
considered three major factors that have influenced the diversification of Rhododendron.
These three processes fractured the geographic uniformity of optimal growing conditions
for Rhododendron species (Irving 1993). For example, during continental movement
upland terrains emerged that were hostile habitats for Rhododendron genotypes. About
20 million years ago, North America and Europe were moving apart creating the Atlantic
Ocean and isolating groups of Laurasian species including Rhododendron. Also, the
Himalayas were forming by the movement of the Indian plate into the Asian plate. The
mountain relief and high-island archipelago formed by these continental movements
created new habitat conditions and isolated many relict groups of Laurasian species
(Milne 2004). In general, continental movement and global climate change created many
new environments and new topography that isolated many groups of Rhododendron
species resulting in some diversification events and some relict species (Irving 1993).
1.32 Diversifications of Rhododendron species—At its origin, Rhododendron
ranged throughout moist, warm-temperate areas of the northern hemisphere because of its
original Laurasian heritage in the circumboreal forest. The current diversity and global
distribution pattern of Rhododendron species reflects both its origin, species
diversification into new habitats and isolations resulting in relict distributions. Within the

10
current range, there are two centers of high diversity for Rhododendron that reflects
diversification events. (Figure 1.3)
One center of diversity is located in western China (S in Figure 1.3) in Yunnan
province where more than 500 species have been identified (Feng 1992). The high
diversity of Rhododendron in Yunnan province is most likely due to a varied mountain
relief with many isolated valleys and a complex geological history that resulted from the
collision of the Indian and Asian continental plates.
A second center of diversity is in the tropical archipelago of Malesia (A-Q in
Figure 1.3), which is the area between Southeast Asia and Australia and includes
Malaysia, Indonesia, Philippines, Papua and New Guinea. The Malesian area is
composed of three plates; Pacific, Indo-Australian, and Indo-China (Michaux 1991). The
diversity of topography created by the nexus of these three plates has created a diversity
of habitats and a hot spot for biological diversity for many taxa including Rhododendron.
Rhododendron species are widely spread throughout the archipelago (Brown et al. 2006).
Most Rhododendron species (287 out of 297) in the Malesian area are classified within
subgenus Vireya, which have diversified into this area after SE Asia-Malesia contacted
the Indo-Australian plate (20 million YBP). However, diversification into this region
most likely took place during the past 5 million years (Stevens 1985). The main
characteristics of species in subgenus Vireya are two-tailed wind-dispersed seeds, a
twisted capsule valve when opened, thread-like placentas and idioblast cells below the
adaxial epidermis (Argent 2015).

11
Brown et al. (2006) proposed two possibilities for the origin of subgenus Vireya.
The first hypothesis is that subgenus Vireya is an old group and its ancestors were in
Gondwanan and diversified in Malesia from the Indo-Australian plate. Another
hypothesis is that subgenus Vireya is a younger group, which diversified into Malesia
from the Indo-China plate moving south as Malesia was formed (Brown et al. 2006).
Based on newly reported molecular evidence for subgenus Vireya phylogeography, it is
clear that this group is derived from a northern group (Indo-China ancestral types) and
diversified into the Malesian archipelago (Goetsch et al. 2011).
1.33 Temperate to tropical diversification— Subgenus Vireya, a monophyletic
group, contains seven well-supported monophyletic sub groups (Figure 1.4) as defined by
molecular phylogenetic analyses (Brown et al 2006). These seven groups are based on
similarities in the sequence of cpDNA, but they also have a geographic pattern. In fact,
the basal groups are northerly and the derived groups have a southerly distribution. This
clear diversification pattern becomes an ideal system for studying how functional traits in
this group changed during this diversification event from temperate habitats into tropical
regions (Figure 1.4).
1.34 Relict distributions—There is strong evidence that some of the diversity in
Rhododendron is derived from relict distributions (small range that survives from much
larger range from the past). The best evidence to support relict distributions is for
subgenus Hymenanthes (Milne 2004). Ponticum is the only section in subgenus
Hymenanthes. Of the 24 subsections in section Ponticum, subsection Pontica is the
largest and best-known subsection and probably the oldest group within Hymenanthes.
There is a high possibility that Pontica diverged and existed before or during the

12
distribution of the group in the circumboreal forest of Laurasia, rather than afterward.
Subsection Pontica is composed of 11 species distributed throughout the northern
hemisphere in temperate mountain habitats. Four species are native to Turkey and
surrounding areas (R. caucasicum, R. smirnowii, R. ungernii, and R. ponticum), 2 species
are found in eastern North America (R. maximum and R. catawbiense), 1 species is native
to western North America (R. macrophyllum), and 3 species (R. degronianum, R.
brachycarpum, and R. aureum) are native to northern Asia, including Japan, Korea, and
Taiwan (Milne 2004). The distribution pattern of Hymenanthes changed from wide range
throughout northern hemisphere circa 50 million years ago to the currently more
restricted area mainly because of climate fluctuation and geographic change, i.e.
continental drift (Irving 1993, Milne and Abbott 2002). Since my study concerns the
anatomical traits in temperate and tropical species, the focus of my research is on
diversification from temperate mountain habitat into tropical mountain habitats, although
some taxa from subgenus Hymenanthes were included.
1.4 Current knowledge of Rhododendron anatomical traits
This research project focuses on leaf and stem anatomical traits of Rhododendron.
Many temperate Rhododendron species have thermonastic leaf movement (TLM) under
freezing temperature. The description of TLM is that leaf angle drops at temperature
close to 0 °C and leaf rolling starts rapidly at -2 °C and progresses during further
temperature decrease (Nilsen 1992). It has been proven that thermonastic leaf movement
serves to prevent photoinhibition during winter freezes (Russell et al. 2009) and results in

13
freezing tolerance. Leaf thickness and palisade mesophyll can be a key to plant
adaptation to avoid light injury during unfavorable conditions. R. catawbiense is one
example that possibly copes with winter light and water problems with thermonastic leaf
movement (Wang et al. 2008). It has been suggested that leaf anatomical structures are
associated with physiological functionality in Rhododendron and provide more
competitiveness for each species in different environments (Cai et al. 2014). Leaf scales
were observed in many species of Rhododendron, especially in the subgenus
Rhododendron. The scales vary in size, shape and density. It has been suggested that leaf
scales of Rhododendron help with water conservation through stomata density
interference (Nilsen et al. 2014).
Stem vessel size is associated with hydraulic conductivity (efficiency). Smaller
vessel diameters provide more resistance to freeze-thaw or drought (safety), but at the
same time, reduce hydraulic conductance (efficiency). Temperate Rhododendron species
experiencing more frequent freeze-thaws had smaller vessel diameters than temperate
Rhododendron species experiencing fewer freeze-that events (Cordero and Nilsen 2002).
Therefore, xylem safety is an important trait in Rhododendron for tolerating freeze-thaw
cycles (Lipp and Nilsen 1997, Cordero and Nilsen 2002).
One goal of this study is to understand the change in anatomical traits that
occurred as plants diversified from a temperate region into a tropical region. The
dramatic difference in climate encountered by plants diversifying from temperate origins
into tropical climates ought to result in predictable changes in anatomical traits based on
our knowledge of the functional significance of those anatomical traits to plant fitness. In
temperate regions, the weather strongly fluctuates among seasons of the year compared to

14
seasonal weather changes in tropical regions (Figure 1.5) including frequent freeze events
during the winter (Lipp and Nilsen 1997). In tropical mountain habitats, daily
temperature variation greatly exceeds seasonal variation in temperature and, except at
very high-altitude tropical mountain habitats, freezing does not occur. The frequency of
freeze-thaw events increases with an increase in latitude and with an increase in elevation
(Lipp and Nilsen 1997). Therefore, the work focus on anatomical trait association with
latitude (temperate vs. tropical) and elevation of the native range.
1.41 Temperate Rhododendron anatomical traits—Temperate evergreen
Rhododendron species must be well adapted to cope with large seasonal changes in
temperature if they are to maintain their leaves over the winter. The most fatal damage
caused by harsh condition during the winter in temperate regions is tissue and vascular
damage by freezing. High radiation, at low winter temperature can induce buildup of
reactive oxygen species in leaves, which will have a negative effect on photosynthesis the
next spring. Also, water availability can become a problem during winter in temperate
zones because cold soil limits water availability and the ability of roots to extract water
from the soil.
There are several anatomical traits of Rhododendron that are suggested to be
adaptive to temperate conditions. The 3 most important are thermonastic leaf movements
(Nilsen 1992), osmotic adjustment, and narrow vessel diameter (Cordero and Nilsen
2002). Thermonastic leaf movements have been shown to protect chloroplast integrity
(Bao and Nilsen 1988) and photosynthetic performance in the early spring (Russell et al.
2009). Osmotic adjustment allows for the maintenance of turgor pressure at low bulk leaf
water potential. Also, during freezing temperature, the cell cytosol must remain liquid.

15
Ice crystals in the cell can break the nucleus and cell membrane thereby damaging
important plant organs. Osmotic adjustment can prevent large ice crystal formation by
reducing the leaf freezing point, thereby decreasing the likelihood of freeze-thaw induced
cell damage. Narrow vessels have been shown to prevent freeze-thaw induced embolism
(Cordero and Nilsen 2002). However, the narrow vessels reduce the capacity of the stem
to carry water during the main growing season, which constrains overall growth rate. As
a result, temperate Rhododendron grow relatively slowly and are sensitive to drought, yet
they are one of the few temperate evergreen shrubs with freeze-thaw tolerance. Narrow
vessels would be a detriment to growth in a tropical environment and this ought to reduce
the capacity of Rhododendron plants to compete with plants that have higher growth rates
in tropical environments. In addition, osmotic adjustment, an energy expensive process,
would not be valuable for tropical environments with ample water availability and no
freeze-thaw events. (Figure 1.5)
1.42 Tropical Rhododendron anatomical traits—In contrast, tropical
environments in the Malesian region are characterized by small seasonal variation in
temperature and soil water availability compared with temperate zone climates. Tropical
mountain habitats, which are home for many tropical Rhododendron species, are
characterized by small seasonal variation in temperature and rare freeze-thaws. Also,
tropical mountain habitats can have high humidity and rainfall because of humidified sea
air moving up in elevation. However, some locations in the Malesian tropics can have
wet and dry seasons.
The warmer temperature, fewer freeze-thaw events and higher water availability
of tropical Malesian environments ought to favor larger vessels than in temperate

16
environments because of the small risk for freeze-induced vascular cavitation. However,
narrow vessels can result in a constraint on productivity. Moreover, if tropical plants
experience drought, either due to a dry season or high demand for water flow, then
drought-induced embolism can become a problem. Therefore, natural selection processes
should favor plants with wider vessels in tropical environments. Moreover, osmotic
adjustment to lower leaf freezing point has a metabolic cost. Therefore, species without
osmotic adjustment in the winter season would have a selective advantage in tropical
climates compared to those who use osmotic adjustment in response to cool temperatures.
Thermonastic leaf movements would provide no selective advantage for species in
tropical environments; however, there may not be any metabolic cost of thermonastic leaf
movements and the movements may be a left over from the temperate origin of the
tropical species.
Tropical Rhododendron species can be epiphytic, while no temperate
Rhododendron species are epiphytic. An epiphytic habit results in unique water
management problems. The medium, organic matter on a branch, does not retain water
for long periods. Therefore, epiphytes are likely to experience frequent short duration
drought. This is one reason why many epiphytes or succulent (orchids, ferns, stonecrops),
use CAM photosynthesis or have leaf architectural mechanisms for storing water
(bromeliads). Tropical epiphytic Rhododendron species exclusively use C3
photosynthesis, do not have architecture conducive for storing water, but may have
anatomic mechanisms for buffering water balance with succulence such as thick leaves
with high water content. Large cells found just below the adaxial epidermis in some

17
tropical Rhododendron species called idioblast may serve as a water buffer system,
particularly for species that have an epiphytic growth habitat.
1.5 Overall goal of this work
The goal of this research is to discover plant leaf and stem anatomical traits that
are associated with adaptation of Rhododendron to temperate or tropical environments.
Rhododendron is one of a few plant genera that are distributed globally in both tropical
and temperate regions. The closely-related groups of Rhododendron with similar leaf
morphology were selected for this study to reduce variation in genetic history and thus
reveal environment–associated adaptive traits
1.51 Approach Taken in this research effort—A survey approach was used to
address hypotheses about the relationships between wood or leaf anatomical traits and
habitat.
1) Wood anatomical traits in more than 60 species of Rhododendron were
measured. The effects of habitat type (temperate vs. tropical) and elevation were
tested with two-way ANOVA and regression.
2) Leaf anatomical traits among 80 accessions of Rhododendron were
measured. The effects of habitat type (temperate vs. tropical) and elevation were
tested with two-way ANOVA and regression.
3) Adaxial idioblast expression and leaf water relation traits were measured
in 61 plants covering 17 species of Rhododendron. The relationships between
18
idioblast expression (and other leaf anatomical traits) and plant water relation traits
were evaluated with regression and stepwise analysis.
4) Overall patterns in leaf and wood anatomical traits in Rhododendron were
summarized. The relationship with habitat (temperate vs. tropical) and elevation was
considered in light of Rhododendron ecology and plant water relations.

19
1.6 Literature Cited
Argent, G. 2006. Rhododendrons of subgenus Vireya. Royal Horticultural Society in
association with the Royal Botanic Garden.
Argent, G. 2015. Rhododendrons of subgenus Vireya. Royal Horticultural Society in
association with the Royal Botanic Garden.
Bao, Y. J., and E. T. Nilsen. 1988. The ecophysiological significance of leaf movements
in Rhododendron maximum. Ecology 69:1578-1587.
Brown, G. K., G. Nelson, and P. Y. Ladiges. 2006. Historical biogeography of
Rhododendron section Vireya and the Malesian Archipelago. Journal of
Biogeography 33:1929-1944.
Cai, Y. F., S. F. Li, S. F. Li, W. J. Xie, and J. Song. 2014. How do leaf anatomies and
photosynthesis of three Rhododendron species relate to their natural
environments? Botanical Studies 55:9.
Chamberlain, D., and E. Royal Botanic Garden. 1996. The Genus Rhododendron: It's
Classification & Synonymy. Royal Botanic Gardens, Kew.
Cordero, R. A., and E. T. Nilsen. 2002. Effects of summer drought and winter freezing on
stem hydraulic conductivity of Rhododendron species from contrasting climates.
Tree Physiology 22:919-928.
Cox, P. A., and K. N. E. Cox. 1997. The encyclopedia of Rhododendron species.
Glendoick Pub.
Craven, L. A., F. Danet, J. F. Veldkamp, L. A. Goetsch, and B. D. Hall. 2011. Vireya
Rhododendrons: their monophyly and classification (Ericaceae, Rhododendron
section Schistanthe). Blumea 56:153-158.

20
Davidian, H. H. 1995. The Rhododendron Species: Azaleas. Timber Press.
Feng, G. 1992. Rhododendrons of China. Science Press.
Goetsch, L., A. J. Eckert, B. D. Hall, and S. B. Hoot. 2005. The Molecular Systematics of
Rhododendron (Ericaceae): A Phylogeny Based Upon RPB2 Gene Sequences.
Systematic Botany 30:616-626.
Goetsch, L. A., L. A. Craven, and B. D. Hall. 2011. Major speciation accompanied the
dispersal of Vireya Rhododendrons (Ericaceae, Rhododendron sect. Schistanthe)
through the Malayan archipelago: Evidence from nuclear gene sequences. Taxon
60:1015-1028.
Irving, E. 1993. Concerning the origin and distribution of Rhododendrons. American
Rhododendron Society 47.
Kron, K. A. 1997. Phylogenetic relationships of Rhododendroideae (Ericaceae).
American Journal of Botany 84:973-980.
Kron, K. A., and S. L. Johnson. 1998. Using DNA Sequences to Estimate Evolutionary
Relationships Among Rhododendrons and Azaleas. American Rhododendron
Society 52:70-72.
Kron, K. A., and W. S. Judd. 1990. Phylogenetic relationships within the Rhodoreae
(Ericaceae) with specific comments on the placement of Ledum. Systematic
Botany 15:57-68.
Kurashige, Y., J. I. Etoh, T. Handa, K. Takayanagi, and T. Yukawa. 2001. Sectional
relationships in the genus Rhododendron (Ericaceae): Evidence from matK and
trnK intron sequences. Plant Systematics and Evolution 228:1-14.

21
Lipp, C. C., and E. T. Nilsen. 1997. The impact of subcanopy light environment on the
hydraulic vulnerability of Rhododendron maximum to freeze-thaw cycles and
drought. Plant Cell and Environment 20:1264-1272.
Michaux, B. 1991. Distributional patterns and tectonic development in Indonesia:
Wallace reinterpreted. Australian Systematic Botany 4:25-36.
Milne, R. I. 2004. Phylogeny and biogeography of Rhododendron subsection Pontica, a
group with a tertiary relict distribution. Molecular Phylogenetics and Evolution
33:389-401.
Milne, R. I., and R. J. Abbott. 2002. The origin and evolution of tertiary relict floras.
Advances in Botanical Research. Academic Press. 38:281-314.
Muller, J. 1981. Fossil Pollen Records of Extant Angiosperms. Botanical Review 47:1-
142.
Nilsen, E. T. 1992. Thermonastic leaf movements - a synthesis of research with
Rhododendron. Botanical Journal of the Linnean Society 110:205-233.
Nilsen, E. T., D. W. Webb, and Z. Bao. 2014. The function of foliar scales in water
conservation: an evaluation using tropical-mountain, evergreen shrubs of the
species Rhododendron in section Schistanthe (Ericaceae). Australian Journal of
Botany 62:403-416.
Reich, P. B. 2014. The world-wide 'fast-slow' plant economics spectrum: a traits
manifesto. Journal of Ecology 102:275-301.
Royer, D. L. 2008. Nutrient turnover rates in ancient terrestrial ecosystems. Palaios
23:421-423

22
Russell, R. B., T. T. Lei, and E. T. Nilsen. 2009. Freezing induced leaf movements and
their potential implications to early spring carbon gain: Rhododendron maximum
as exemplar. Functional Ecology 23:463-471.
Sleumer, H. 1949. Ein System der Gattung Rhododendron L. — Bot. Jahrb. 74: 511–553.
Sperry, J. S., and J. E. M. Sullivan. 1992. Xylem embolism in response to freeze-thaw
cycles and water-stress in ring-porous, diffuse-porous, and conifer species. Plant
Physiology 100:605-613.
Stevens, P. 1985. Malesian Vireya Rhododendrons: towards an understanding of their
evolution. Notes Roy. Bot. Gard. Edinburgh 43:63-80.
Wang, X., R. Arora, H. T. Horner, and S. L. Krebs. 2008. Structural Adaptations in
Overwintering Leaves of Thermonastic and Nonthermonastic Rhododendron
Species. Journal of the American Society for Horticultural Science 133:768-776.
Zetter, R., and M. Hesse. 1996. The Morphology of Pollen Tetrads and Viscin Threads in
Some Tertiary, Rhododendron-Like Ericaceae. Grana 35:285-294.
23
1.7 Tables
Table 1.1 Rhododendron subgenera and sections defined by Chamberlain and Royal
Botanic Garden (1996)
Subgenus Section Number of Species
Rhododendron Pogonanthum 21
Rhododendron 211
Vireya 310
Hymenanthes Ponticum 302
Tsutsusi Brachycalyx 23
Tsutsusi 94
Pentanthera Penthanthera 23
Rhodora 2
Sciadorhodion 4
Viscidula 1
Azaleastrum Azaleastrum 11
Choniastrum 19
Therorhodion - 2
Mumeazalea - 2
Candidastrum - 2

24
Table 1.2 The classification of Rhododendron based on the 2005 treatment by Goetsch et
al. (2005)
Subgenus Section
Rhododendron Pogonanthum
Rhododendron Rhododendron
Rhododendron Vireya
Hymenanthes
Hymenanthes
Ponticum
Penthanthera
Tsutsusi Brachycalyx
Pentanthera Rhodora
Azaleastrum
Azaleastrum
Tsutsusi
Sciadorhodion
Therorhodion
Choniastrum

25
Table 1.3 The two most recent classifications of Rhododendron section Schistanthe
(Craven et al. 2011, Goetsch et al. 2011) in comparison with subgenus Vireya (Argent
2015)
Craven et al. 2011 Argent 2015
Subgenus Section Subsection Subgenus Section Subsection
Rhododendron Schistanthe Discovireya Vireya Albovireya
Euvireya Discovireya
Malayovireya Hadranthe
Pseudovireya Malayovireya
Pseudovireya
Schistanthe Euvireya
Schistanthe Linnaeopsis
Schistanthe Malesia
Schistanthe Saxifragoidea
Schistanthe Solenovireya
Siphonovireya

26
1.8 Figure legends
Figure 1.1 Comparison diagram of Leaf Economic Spectrum (LES) traits between
fast-growing and slow-growing plants modified from Royer (2008)
Figure 1.2 A diagrammatic representation of the maximum parsimony strict
consensus tree based on RPB2-I gene adapted from Goetsch et al. (2005). The number
represent bootstrap value.
Figure 1.3 Focus areas for Rhododendron species diversity. Adapted from Feng
(1992). Blue circle indicate the range of temperate Rhododendron species used in this
study. Red circle indicate the range of tropical Rhododendron species used in this study.
Figure 1.4 The geographic distribution of the 7 monophyletic groups of Vireya.
Adapted from Goetsch et al. (2011).
Figure 1.5 Seasonal and daily patterns of general climatic conditions in temperate
and tropical mountain habitats. Solid blue lines refer to seasonal mean temperatures and
dashed lines represent the daily variation in temperature. Solid black line refers to 0 °C.
27
1.9 Figures
Figure 1.1. Comparison diagram of Leaf Economic Spectrum

28
Figure 1.2. A diagrammatic representation of consensus tree based on RPB2-I
gene

29
Figure 1.3. Focus areas for Rhododendron species diversity

30
Figure 1.4. The geographic distribution of the 7 groups of Vireya

31
Figure 1.5. Climatic conditions in temperate and tropical mountain habitats
wintersummerwintersummerwinter
Temperate
AirTemperature
warm
cold
Tropical
Seasonalanddailypatternsofmountainclimates
0°C

32
CHAPTER 2
Exploration of vascular anatomical traits among species of Rhododendron
2.1 Introduction
The structure of plant vascular tissue is a major selective trait for plant
distribution and drought tolerance (Anderegg et al. 2016) (Figure 2.1). Larger vessel
diameters lead to more efficient water flow (Sperry et al. 2006), but at the same time,
render the plant more susceptible to vessel embolism after freeze-thaw events (Hargrave
et al. 1994, Cordero and Nilsen 2002). Smaller vessel diameters increase safety against
freeze-thaw induced embolism during the winter (Lens et al. 2013), however, it will
constrain plant productivity due to water flow restriction during the summer. The result is
a potential tradeoff between safety and efficiency of wood (Meinzer et al. 2010).
Temperate plants, or plants at high elevation sites, which will likely face many freeze-
thaw events during the winter, are expected to favor safety over efficiency in vascular
traits. Although there was a lot of support for the trade-off, many studies did not find the
trade-off (Gleason et al. 2016).
There are many characteristics of vessels that influence safety. As stated above
smaller vessels are less likely to embolize due to freezing and may be easier to refill after
freezing (Lens et al. 2013). The characteristics of vessel diameter distribution are also
important for safety. For example, a smaller proportion of vessels with relatively large
diameters promotes safety. Thus, the more positive the skewness (the proportion of the
data sample on one versus the other side of the mean) of the vessel diameter distribution
the safer the vascular system (Medeiros and Pockman 2014). A homogeneous vessel

33
distribution (high kurtosis; the extent of data spread around the mean) are more likely to
suffer catastrophic vascular failure than a heterogeneous distribution (lower kurtosis).
Other elements of vessel safety are a low number of vessel pits, a low connectivity
between adjacent vessels and relatively thick cell walls.
Similarly, there are many facets of vascular efficiency. Primary among these is a
relatively high water transport capacity. High water transport capacity (efficiency) can be
attained by a larger mean hydraulically weight vessel diameter, more connectivity among
vessels or a higher vessel density (Meinzer et al. 2010). Thus, plants with high efficiency
have a high theoretical specific conductivity, a higher proportion of vessels in high
diameter size classes, higher kurtosis and less negative skewness.
If temperate evergreen plants favor safety over efficiency due to a high frequency
of freeze-thaw events, then tropical plants ought to favor efficiency due to a low
frequency of freeze-thaw events. Moreover, a fast growth rate may be a competitive
advantage in a wet-tropical environment. Fast growth for evergreen plants is due to a
high leaf area ratio and an efficient vascular system (Meinzer et al. 2010). Thus, the
vascular system of evergreen shrubs in a wet-tropical habitat should favor efficiency
rather than safety. However, in seasonally dry tropical habitats or higher elevation
tropical habitats the balance of efficiency to safety may be tipped toward safety.
Therefore, the balance of efficiency and safety may be strongly influenced by both
elevation and habitat type.
There are three main ways to determine the functional significance of traits to
different habitats. One possible approach is to broadly select plant samples from many
different families to make sure that the selection covers as many groups as possible and is

34
representative of each habitat under consideration. Another way is to utilize the
comparative method based on a known and well established phylogeny. A third way is to
study these traits in one narrow closely-related monophyletic taxonomic group that exists
across all habitat types. This study focuses on the functional significance of vascular
traits across habitat types in a closely-related monophyletic group of plants.
Subgenus Rhododendron is a well-supported monophyletic clade (93% bootstrap;
Goetsch et al. 2005) in the genus Rhododendron is a good candidate for this research.
The species in this subgenus can be found world-wide in many northern hemisphere
temperate habitats and in tropical regions including Thailand, Malaysia, Indonesia,
Taiwan, Papua, and New Guinea. Moreover, all the species in this group are evergreen
shrubs or small trees (Argent 2015). In addition, there are two major collections of living
Rhododendron germplasm available for research purposes: (1) The Rhododendron
Species Foundation and Botanical Garden, Federal Way, WA, and (2) The Royal Botanic
Garden Edinburgh, UK.
The overall goal of this research was to determine if the balance of safety and
efficiency in stems shifts from an emphasis on safety in temperate Rhododendron species
to an emphasis on efficiency in tropical Rhododendron species. The hypotheses
addressed in this study were:
1) The wood of temperate Rhododendron species is significantly safer than the
wood of tropical species of Rhododendron. This hypothesis would be supported if: a) The
mean vessel diameter for temperate Rhododendron species is significantly smaller than
the tropical counterpart, b) The vessel diameter distribution for temperate Rhododendron
species is skewed toward smaller size than the tropical species, c) The kurtosis of vessel
35
diameter distribution in temperate Rhododendron species is significantly smaller than the
tropical species.
2) The wood of Rhododendron species is significantly safer for those species that
have a higher mean elevation of their native range compare with species that have a
lower mean elevation of their native range. This hypothesis would be supported if: a)
Species with a high native elevation range have a significantly smaller mean vessel
diameter than species with a medium or low mean elevation of the native range, b)
Species with a high native elevation range have a vessel distribution skewed toward
smaller size than species with a medium or low mean elevation of the native range, c)
The vessel distribution for species with a high native elevation range has a significantly
smaller kurtosis than species with a medium or low mean elevation of the native range.
3) The wood of Rhododendron species that have a tropical range has significantly
higher transport efficiency than the wood of Rhododendron species that have a temperate
range. This hypothesis would be supported if: a) The vessels of tropical Rhododendron
species have a significantly larger mean hydraulically weighted diameter (Dh) than that of
temperate Rhododendron species, b) Tropical Rhododendron species have a significantly
higher vessel density (pV) than that of temperate Rhododendron species, c) Tropical
Rhododendron species have a significantly higher theoretical specific conductivity
(Kstheo) than that of temperate Rhododendron species. In addition, the vessel diameter
distribution of tropical species will be skewed toward larger size, while kurtosis is more
positive.
All accession used in this study were from Rhododendron Species Foundation and
Botanical Garden in Federal Way, WA, a common garden in Volcano Village, HI, the

36
Royal Botanic Garden Edinburgh, UK, and Biological Sciences-VBI Plant Growth
Facility (VT-PGF) (Table 2.1). Vessel traits critical to both safety and efficiency were
measured on all specimens. Analysis of variance (ANOVA), and regression were used to
find significant effects of habitat (temperate vs. tropical) and native range elevation on
vascular traits.
2.2 Materials and methods
2.21 Selected accessions—Approximately 60 accessions of Rhododendron were
selected for this research (Table 2.1). The samples include evergreen shrubs that have
temperate or tropical ranges. Wood of accessions was sampled from various sources
including the Rhododendron Species Foundation and Botanical Garden, Federal Way,
WA, a common garden in Volcano Village, HI, the Royal Botanic Garden Edinburgh,
UK, and Biological Sciences-VBI Plant Growth Facility (VT-PGF). One stem was
sampled from each accession.
2.22 Stem preparation and microtomy—Young stems (at least 1.0 cm in diameter
and 20-30 cm long) were excised from the outer canopy of each accession and carefully
labeled. The excised stems were sealed in plastic bags prior to transport to the ecological
physiology lab at Virginia Tech. Upon arrival to the lab, the stems were promptly
refrigerated (4 °C). A 1.5 cm segment was cut from each end of the stem section in order
to have two independent assays of vessel from each stem. Previous research has shown
that Rhododendron vessels elements are less than 3 cm in length, so the selection of
segments at each side of the stem does not include the same vessels. Stem cross-sections
between 15-20 µm thick were made from each end of the stem using lightweight slide

37
microtome (WSL GSL-1, Birmensdorf, Switzerland) (Gartner et al. 2014). Cross sections
were maintained in distilled water until dehydration and staining was done.
2.23 Staining and dehydration—Specimens were gently picked from the distilled
water with a paintbrush and put on metal meshes. A drop of safranin O solution was
applied to the specimen for about 3 seconds before gently flushing with distilled water
three times. Subsequently the samples were dehydrated by sequentially flushing with an
increasing ethanol gradient (50%, 75% 100%) for 5 s each flush followed by a 5 s flush
with toluene. Wet specimens were placed on a pre-cleaned microscopic slide. The
resulting specimens were fixed in Permounttm for later vessel measurements.
2.24 Xylem traits measured—Nikon NIS-Element Basic Research version 4 and
Nikon Eclipse LV100 with digital camera head DS-Fi1 (Nikon Inc., Tokyo, Japan) were
used to observe and to make measurement of the specimen. The measurements were
conducted at 40 x objective lens. The data were exported through Nikon NIS-Element
Basic Research to a spreadsheet for further analysis. The diameter and area of every
vessel in 10 fields of view were determined resulting in about 75 - 125 vessels assayed on
each side of the stem. The total number of vessels measured in the total area of stem (# /
mm2) was considered the vessel density (pV). The hydraulically weighted diameter was
calculated as: Dh = Σ D5 / Σ D4 where D represents vessel diameter (µm) (Sperry and
Saliendra 1994b). The theoretical specific conductivity (Kstheo) was calculated by (((π x Σ
D4) / 128 x η) x ρ) / vascular area (mm2) for each sample where η represents the viscosity
of water (1.002 x 10⁻⁹) and ρ represents the density of water (998.2 kg m-3). The units for
this trait is kg m-1 MPa-1 s-1. Kurtosis and skewness of the data was calculated for each
stem. Kurtosis was interpreted as the evenness of investment in water transport capacity

38
across all vessel diameters. Relatively high skewness was interpreted as relative high
investment in the smallest (less vulnerable to cavitation) compared with the largest (more
vulnerable to cavitation) vessels. Relative vulnerability to freeze-thaw embolism was
determined as in Medeiros and Pockman (2014). Vessel diameter never exceeded 44 µm;
therefore, the cutoff diameter suggested by Davis et al. (1999) and used by Medeiros and
Pockman (2014) cannot be used. Instead, the vessel diameter at 24 µm was chosen as a
reference value (based on personal observation) for calculating relative vulnerability to
freeze-thaw induced embolism. Therefore, the index of relative vulnerability is the
proportion of total water transport accounted for by vessels greater than 24 µm in
diameter. This is a very conservative determination of relative vulnerability to embolism
in comparison to other taxa previously studied.
After the cortex was removed, the basal area of the each sampled stem was
determined as well as the area of pith. The vascular area was calculated as the stem area
minus the pith area.
2.25 Statistical analysis—Accessions were assigned to a habitat (temperate or
tropical) based on their known native range reported in the literature. Tropical species
were those that had ranges between 20 °N and 20 °S latitude. Temperate species had
ranges between 30 °N and 40 °N latitude. An elevation was assigned to each species as
the middle elevation of the native range reported in the literature. In order to convert
these elevation data from continuous to categorical three categories were defined (low =
0 - 1,200 m, medium = 1,201 - 2,400 m, high = 2,401 - 4,200 m). Two-way ANOVA was
used to test the effects of habitat (temperate, tropical), elevation (low, medium, and high)
and their interaction on all vascular traits (JMP Pro 12, SAS Institute Inc., Cary, NC).

39
The effect of either stem area or vascular area (continuous variable) on vessel
traits was determined for stems from each habitat by regression analysis. A significant
regression slope was considered a significant effect of stem or vascular area on vessel
traits. The difference in regression slopes was used to determine if there was a different
relationship between stem or vascular area and vessel traits for temperate or tropical
stems. A similar regression technique was used to determine the effect of the mean
elevation of the native range on the vascular traitss.
2.3 Results
2.31 ANOVA results—The mean and standard deviation of vessel diameter
(Figure 2.2 A) of all data is 16.55 µm ± 2.95. The mean vessel diameter of tropical plants
(18.29 µm ± 3.27) was significantly higher (Table 2.2) than the temperate species (15.47
µm ± 2.15). The mean vessel diameter tended to decrease from low elevation to high
elevation (18.22 µm ± 3.87, 16.99 µm ± 2.94, 15.54 µm ± 2.34 respectively) but the
elevation effect was not significant (Table 2.2). The interaction between habitat and
elevation was not significant. The mean and standard deviation of minimum vessel
diameter (Figure 2.2 B) of all data was 10.25 µm ± 1.79. The tropical plants had a
significantly (Table 2.2) higher minimum vessel diameter (10.47 µm ± 2.16) than that of
the temperate plants (10.11 µm ± 1.54). The minimum vessel diameter significantly
increased (Table 2.2) from the low to the high elevation ranks (9.77 µm ± 2.59, 10.07 µm
± 1.63, 10.60 µm ± 1.69, respectively). The interaction between habitat and elevation was
not significant. The mean and standard deviation of maximum vessel diameter (Figure
2.2 C) of all data was 24.41 µm ± 4.89. The tropical plants had a significantly (Table 2.2)

40
higher maximum vessel diameter (26.71 µm ± 5.23) than that of the temperate plants
(22.98 µm ± 4.13). The maximum vessel diameter tended to decrease from low elevation
to high elevation (27.48 µm ± 5.30, 25.24 µm ± 4.99, 22.54 µm ± 4.01 respectively) but
the elevation effect was not significant (Table 2.2). The interaction between habitat and
elevation on maximum vessel diameter was not significant. The mean and standard
deviation (Figure 2.2 D) of vessel density (pV) of all data is 991.78 µm ± 219.85. The
mean vessel density of temperate plants (1044.76 mm-2 ± 198.30) tended to be higher
than the tropical species (906.55 mm-2 ± 230.16), but the trend was not statistically
significant (Table 2.2). The mean vessel density tended to increase from low, and
medium elevation to high elevation (956.16 mm-2 ± 129.04, 943.03 mm-2 ± 231.30,
1055.83 mm-2 ± 220.55 respectively) but the elevation effect was not significant (Table
2.2). The interaction between habitat and elevation was not significant.
The mean and standard deviation of all vessel diameter distribution skewness
(Figure 2.3 A) was 0.289 ± 0.26. The temperate plants had a significantly (Table 2.3)
higher skewed distribution (0.386 ± 0.221) than that of the tropical plants (0.132 ±
0.256). The skewness of the distribution significantly (Table 2.3) increased from the low
to the high elevation ranks (0.166 ± 0.291, 0.243 ± 0.280, 0.392 ± 0.196, respectively).
The interaction between habitat and elevation was not significant for skewness. The mean
and standard deviation of all vessel diameter distribution kurtosis (Figure 2.3 B) was
0.360 ± 0.59. The tropical plants tended to have higher vessel diameter distribution
kurtosis (0.438 ± 0.613) than the temperate plants (0.311 ± 0.572), but that trend was not
statistically significant (Table 2.3). The mean distribution kurtosis tended to decrease
from low to high elevation (0.508 ± 0.440, 0.403 ± 0.608, 0.266 ± 0.608 respectively),

41
but the elevation effect was not significant (Table 2.3). The interaction between habitat
and elevation was not significant.
The mean and standard deviation of the hydraulically weighted diameter of xylem
(Dh) (Figure 2.4 A) in all data is 17.78 µm ± 3.20. The mean Dh of tropical plants (19.64
µm ± 3.55) was significantly higher (Table 2.4) than the temperate species (16.62 µm ±
2.34). The mean Dh tended to decrease from low elevation to high elevation (19.65 µm ±
4.16, 18.31 µm ± 3.20, 16.61µm ± 2.48 respectively), but the elevation effect was not
significant (Table 2.4). The interaction between habitat and elevation was not significant.
The mean and standard deviation of the theoretical specific conductivity (Figure 2.4 B) in
all data was 2.09 ± 1.09. The mean theoretical specific conductivity of tropical plants
(2.51 ± 1.20 kg m-1 MPa-1 s-1) was significantly higher (Table 2.4) than the temperate
species (1.87± 0.98 kg m-1 MPa-1 s-1). The mean theoretical specific conductivity tended
to decrease from low elevation to high elevation (2.50 ± 1.10, 2.19 ± 61.11, 1.89 ± 1.08
kg m-1 MPa-1 s-1 respectively), but the elevation effect was not significant (Table 2.4).
The interaction between habitat and elevation was significant, therefore the effect of
elevation on theoretical specific conductivity was different for the two habitat types. The
mean and standard deviation of the proportion of theoretical transport in vessel diameter
larger than 24.00 µm (Σ D4 > 24) of all data (Figure 2.4 C) was 7.10 ± 14.15 %. The
tropical plants had a significantly (Table 2.4) higher Σ D4 > 24 (14.52 ± 20.19 %) than
that of the temperate plants (2.50 ± 4.67 %). The Σ D4 > 24 significantly (Table 2.4)
decreased from the low to the high elevation ranks (16.53 ± 27.37, 8.93 ± 13.51, 2.12 ±
4.10, respectively). The interaction between habitat and elevation was not significant.

42
2.32 Regression results—The regression of mean vessel diameter (dependent
variable) against average elevation of the native range (independent variable) was
statistically significant (Table 2.5) when all species were included (R2 = 0.144, negative
slope), and when only temperate species were included (R2 = 0.079, negative slope).
However, this regression was not statistically significant when only tropical species were
included (R2 = 0.032, negative slope). The regression of minimum vessel diameter
against average elevation of the native range was not statistically significant when all
species were included (R2 = 0.013, positive slope), or when only temperate species (R2 =
0.018, positive slope) were included (Table 2.5). This regression was statistically
significant (R2 = 0.140, positive slope) when only tropical species were. The regression
of maximum vessel diameter against average elevation of the native range was
statistically significant (Table 2.5) when all species were included (R2 = 0.167, negative
slope), and when only temperate species were included (R2 = 0.176, negative slope).
However, this regression was not significant (R2 = 0.002, negative slope) when only
tropical species were included. The regression of vessel density (pV) against average
elevation of the native range was statistically significant (Table 2.5) when all species
were included (R2 = 0.062, positive slope). This regression was not statistically
significant when either only temperate species (R2 = 0.009, positive slope) or only
tropical species (R2 = 0.085, positive slope) were included (Table 2.5).
The regression of vessel diameter distribution skewness against average elevation
of the native range was statistically significant when all species were included (R2 =
0.136, positive slope), and when only tropical species were included (R2 = 0.313, positive
slope). However, this regression (R2 = 0.011, positive slope) was not statistically

43
significant (Table 2.5) when only temperate species were included. The regression of
vessel diameter distribution kurtosis against average elevation of the native range was not
statistically significant (Table 2.5) when all species were included (R2 = 0.032, negative
slope), only temperate species were included (R2 = 0.069, negative slope), or when only
tropical species (R2 = 0.036, positive slope), were included.
The regression of hydraulically weighted diameter of xylem (Dh) against average
elevation of the native range was statistically significant when all species are included
(R2 = 0.159, negative slope), and when only temperate species are included (R2 = 0.099,
negative slope). This regression was not statistically significant when only tropical
species (R2 = 0.040, negative slope), were included (Table 2.5). The regression of
theoretical specific conductivity (Kstheo) against average elevation of the native range was
statistically significant when all species were included (R2 = 0.070, negative slope), and
when only temperate species were included (R2 = 0.088, negative slope). This regression
was not statistically significant (Table 2.5) when only tropical species were included (R2
= 0.043, positive slope). The regression of the proportion of theoretical transport in vessel
with larger diameter (> 24.00 µm) (Σ D4 > 24) against average elevation of the native
range was statistically significant (Table 2.5) when all species were included (R2 = 0.142,
negative slope), when only temperate species were included (R2 = 0.153, negative slope),
and when only tropical species were included (R2 = 0.161, negative slope).
The regression of mean vessel diameter (as dependent variable) against vessel
density (as independent variable) was statistically significant (Figure 2.5 A) with a
negative slope when all species were included (p-value = 0.0625, R2 = 0.059). Although
this regression had a negative slope the regression was not significant when only

44
temperate (p-value = 0.54, R2 = 0.010) or only tropical species (p-value = 0.552, R2 =
0.017) were included (Figure 2.5 B, 2.5 C).
The regression of vascular area (as dependent variable) against whole stem cross
section area (as independent variable) was statistically significant (p-value < 0.0001, R2 =
0.950) when all species were included (Figure 2.6 A), when only temperate species were
included (Figure 2.6 B, p-value < 0.0001, R2 = 0.937), and when only tropical species
were included (Figure 2.6 C, p-value < 0.0001, R2 = 0.943). Therefore, vascular area
scaled linearly with stem area.
The regression of mean vessel diameter against vascular area was statistically
significant (Table 2.6) when all species were included (R2 = 0.368, positive slope), when
only temperate species were included (R2 = 0.182, positive slope), and when only tropical
species were included (R2 = 0.334, positive slope). The regression of minimum vessel
diameter against vascular area was not statistically significant (Table 2.6) when all
species were included (R2 = 0.027, positive slope), when only temperate species were
included (R2 = 0.019, positive slope), or when only tropical species were included (R2 =
0.017, positive slope). The regression of maximum vessel diameter against vascular area
was statistically significant (Table 2.6) when all species were included (R2 = 0.371,
positive slope), when only temperate species were included (R2 = 0.269, positive slope),
and when only tropical species were included (R2 = 0.304, positive slope). The regression
of vessel density against vascular area was statistically significant when all species were
included (R2 = 0.047, negative slope). However, this regression was not significant
(Table 2.6) when only temperate species were included (R2 = 0.0003, positive slope), or
when only tropical species were included (R2 = 0.0003, positive slope).

45
The regression of vessel diameter distribution skewness against vascular area was
not statistically significant (Table 2.6) when all species were included (R2 = 0.034,
negative slope), when only temperate species were included (R2 = 0.009, positive slope),
or when only tropical species were included (R2 = 0.004, negative slope). The regression
of diameter distribution kurtosis against vascular area was statistically significant (Table
2.6) when all species are included (R2 = 0.076, positive slope), and when only temperate
species were included (R2 = 0.096, positive slope). This regression was not significant
(Table 2.6) when only tropical species were included (R2 = 0.038, positive slope).
The regression of hydraulically weighted diameter of xylem against vascular area
was statistically significant (Table 2.6) when all species were included (R2 = 0.392,
positive slope), when only temperate species were included (R2 = 0.212, positive slope),
and when only tropical species were included (R2 = 0.356, positive slope). The regression
of theoretical specific conductivity against vascular area was statistically significant
(Table 2.6) when all species were included (R2 = 0.232, positive slope), when only
temperate species were included (R2 = 0.192, positive slope), and when only tropical
species were included (R2 = 0.160, positive slope). The regression of theoretical specific
conductivity in vessel with larger diameter > 24.00 µm against vascular area was
statistically significant (Table 2.6) when all species were included (R2 = 0.371, positive
slope), when only temperate species are included (R2 = 0.262, positive slope), and when
only tropical species are included (R2 = 0.384, positive slope).

46
2.4 Discussion
2.41 Rhododendron wood—All wood sampled for Rhododendron species was
found to be diffuse porous. The proportion of vascular area in stems remained relatively
constant at approximately 65% as stem diameter increased in these samples. In general,
Rhododendron vessel diameters are on the smaller side in comparison to other plants
including, temperate trees and shrubs (Nabeshima et al. 2015), desert plants (Medeiros
and Pockman 2014), or rain forest trees (Olson et al. 2013). The vessel diameter and its
relationship to vascular area in this report are consistent with previous results on other
Rhododendron species (Noshiro et al. 1995). The vessel diameters found in this study are
smaller than most tracheid diameters found for a boreal conifer (Chenlemuge et al. 2015).
Because tracheid diameters are characteristically smaller than vessels this result means
that Rhododendron vessel diameters are particularly small compared to other species with
vessels. Narrow vessel diameter is associated with low stem hydraulic conductance
(Hacke et al. 2009), and tolerance to freezing (Zanne et al. 2014). Hydraulic conductance
of wood depends on vessel diameters, vessel distribution, and vessel density. Plants that
have narrow vessels can compensate for this limitation by increasing vessel density, or
decreasing the skewness to small diameter sizes. The vessel distributions across these
species had a relatively high amount of skewness, Thus, small vessel sizes were not
compensated by decreasing skewness. The data in this study showed relatively high
vessel density indicating that the effect of narrow vessels was partially compensated by
relatively high vessel density.
Vessel density has been found in Rhododendron to decrease from thin to thicker
stems and from trees to shrubs (Noshiro and Suzuki 1995). Differences in plant

47
architecture (trees vs. shrubs) did not influence the results because all the accessions were
shrubs. Noshiro and Suzuki 1995) found a mean vessel density of 882.9 mm-2 for
Rhododendron shrubs in Nepal, which is similar to the average of all the shrub species
used in this study (991.8 mm-2). The stems used for this analysis are in the thinner range
of the Noshiro study (Noshiro and Suzuki 1995), which suggests that the density of
vessels would be significantly lower if larger stems were used in this study.
The net result of this wood analysis is that Rhododendron shrubs are likely to be
constrained to low transpiration rates because of the restriction placed on hydraulic flow
by the small vessel diameters. The limitation to hydraulic flow characteristic of
Rhododendron species, should result in relatively low leaf water potentials under
conditions of high evaporative demand and open stomata because hydraulic flow would
not be able to “keep up with evaporative demand”. Therefore, considering the data set as
a whole, Rhododendron wood is characteristically “safe” because of narrow vessels and
being diffuse porous, which results in low hydraulic conductance, yet Rhododendron
shrubs ought to be vulnerable to the occurrence of low leaf and stem water potentials
because of their wood anatomy.
2.42 Addressing hypothesis one—This hypothesis predicted that the wood of
temperate Rhododendron species would be significantly safer than the wood of tropical
Rhododendron species. The results of this research convincingly supported hypothesis
one. The mean vessel diameter in temperate species was consistently smaller than that in
the tropical species. Also, minimum and maximum vessel diameter in temperate species
were significantly smaller than those of tropical species. Vessel density in temperate
species tended to be lower than that in the tropical species, but not statistically

48
significant. These results suggest that temperate Rhododendron species do not
compensate for their smaller vessel diameter by increasing vessel density to achieve
higher water flow. As a consequence, the theoretical specific conductivity was
significantly lower in temperate species compared to the tropical species.
The vessel distribution of temperate Rhododendron species was skewed toward
smaller diameter vessels compared with the less skewed vessel distribution in tropical
species. This trend has been found in a dominant desert species that ranges across
habitats that have a gradient of air temperature (Medeiros and Pockman 2014). Higher
skewness to the smaller size classes means that a disproportionately high proportion of
vessels are in small size classes compared to a normal distribution. Also, the study on
Larrea species by Medeiros and Pockman (2014) suggested that the kurtosis of the vessel
distribution was lower in colder habitats because high kurtosis would make the wood
vulnerable to a freeze event that induced cavitation in the mean vessel size. Lower
kurtosis of vessel distribution insures that there will be vessels smaller than that affected
by a particular freeze event. Kurtosis of the temperate species in this study trended lower
than that of the tropical species. However, that trend was not statistically significant.
This study on Rhododendron species clearly demonstrated that species in
temperate habitats have greater vascular safety than species in tropical habitats. The
result of that safety is lower potential hydraulic conductance as found with other species
(Choat et al. 2011). The low hydraulic conductance in R. maximum vascular tissue has
been deemed a cause for a characteristically low stomatal conductance (Lipp and Nilsen
1997). Also, Rhododendron vascular tissue in temperate regions can be relatively
sensitive to drought induced embolism, but can have a high potential to recover from
49
either drought induced or freeze-thaw induced embolism (Cordero and Nilsen 2002). This
research and previous studies by others (Lipp and Nilsen 1997, Cordero and Nilsen 2002)
characterized Rhododendron wood in temperate regions as having low hydraulic
conductance, high vulnerability to drought induced embolism and high safety against
freeze-thaw induced embolism. These wood characteristics, along with those from this
research, taken together, demonstrate that temperate Rhododendron wood ought to
restrict Rhododendron species to moderate-low light intensity high water availability
environments.
2.43 Addressing hypothesis two—Elevation has a large effect on climatic
conditions. An increase in elevation causes the air temperature to decrease according to
the adiabatic laps rate. Consequently, dry air decreases temperature by 9.8 °K / km of
elevation change. The rate of temperature decrease with elevation becomes less when air
is humidified. Thus, the dry air adiabatic lapse rate is -0.98 °C / 100 m increase in
elevation while that of humid air is -0.52 °C / 100 m (Wikipedia: lapse rate). Thus,
species with ranges at high elevation will experience colder conditions than species at
low elevation. Moreover, the number of freeze-thaw cycles per winter season increases at
higher elevation and at higher latitude (Lipp and Nilsen 1997). The mean elevation of the
native range for species used in this study varied from 150 - 4,130 m, which would
suggest a decrease in mean air temperature of approximately 20°C across that range. In a
tropical environment, that has a sea level mean temperature of 30 °C would have a mean
annual temperature of 10 °C at 4,000 m elevation. In general, the elevation where freeze-
thaw events occur is at higher elevation in tropical regions than temperate regions,
although there is a lot of variation in the elevation effect on climate because of many

50
mitigation factors (Körner 2007). Therefore, the strength of the elevation effect on plant
traits is likely to be weak because of the variation in mitigating factors affecting the
change in habitat conditions among different mountain ranges. Plants have evolved
specific functional traits to maximize survivorship at specific elevation ranges. Because
wood “safety” is an important adaptation of freeze-thaw events, the wood “safety” is
expected to be higher for species with higher native ranges. Therefore, I hypothesized
that Rhododendron species with a higher elevation of the native range would have safer
wood than those species with a lower native range.
To evaluate this hypothesis, three categories of species with low (0 - 1,200 m),
medium (1,201 - 2,400 m), and high (2,401 - 4,200 m) native ranges were established to
evenly separate species into three categories based on the mean native range reported in
the literature. The wood of higher elevation Rhododendron species was predicted to be
significantly safer than the wood of Rhododendron species from lower elevation because
the frequency of freezes increases with elevation. Overall, the results weakly support this
hypothesis. The mean vessel diameter decreased from the lower to higher elevation rank,
but this was not statistically significant. Minimum vessel diameter is significantly
different among elevation ranks, but the trend is not consistent. Maximum vessel
diameter of species in higher elevation rank is smaller than that of species in the lower
ranks, but the difference is non-significant. This trend is inconclusive for vessel density,
and not statistically significant. Since the ranked elevation for ANOVA analysis lost
some of the information about elevation by making the ranks, a regression analysis was
carried out with mean elevation of the native range as the independent variable against
the wood traits as dependent variables. There was a significant negative relationship
51
between mean native elevation and mean vessel diameter or maximum vessel diameter.
However, the result of the minimum vessel diameter did not support the hypothesis
because there was no significance to the regression. These data suggested that elevation
range has a significant impact on mean and maximum vessel diameter, but not the
minimum vessel diameter. The range of vessel diameter became smaller at higher
elevation.
There was a significant positive regression between vessel density and average
native elevation, which suggested that higher elevation plants tend to have denser vessels
that might partially compensate for the effect of smaller vessels on stem hydraulic
conductance. The vessel distribution skewness is significantly related to native elevation
average, and supported the hypothesis that the higher elevation species will have vessel
distributions skewed to smaller size classes; however, distribution kurtosis is not
significant. One interesting part of the regression analysis was how separation of data into
each habitat affected the interpretation. If the analysis included only temperate or only
tropical species, the relationship in most of the traits will not be as significant as the
analysis as whole. The conclusion is that there is a moderate support for hypothesis two,
because some of the vascular traits suggest higher wood safety at high elevation but
others do not. Perhaps this weak relationship is a consequence of including species from
many different mountains in this analysis. If the wood traits are evaluated among species
on one mountain gradient the results may be clearer such as that found earlier (Noshiro
and Suzuki 1995).
2.44 Addressing hypothesis three—If microevolutionary processes in temperate
habitats have resulted in vascular systems in Rhododendron shrubs that constrain water

52
flow and limit plant growth rate, then these traits would be maladaptive in tropical
habitats. Evergreen plants in tropical habitats will encounter greater competition and
greater potential damage by herbivores. Therefore, a slow growth rate and relatively
long-lived leaves would be maladaptive. There is strong molecular evidence that the main
tropical subgenus of Rhododendron originated in the temperate zone of southwest China
and diversified into tropical habitats (Brown et al. 2006). Thus, I predicted that the wood
of tropical Rhododendron species would have significantly higher transport efficiency
than the wood of temperate Rhododendron species. The third hypothesis was strongly
supported by the data. The vessel diameters and vessel densities of tropical
Rhododendron species were found to be significantly larger than those from temperate
counterpart, which would enhance potential transportation efficiency in the wood.
Moreover, the wood of tropical Rhododendron species had significantly higher
hydraulically weighted diameter of xylem (Dh) and theoretical specific conductivity
(Kstheo) than the temperate species. However, the wood of the tropical species has lost
important “safety” parameters because of the larger mean vessel diameters, lower
skewness of the vessel distribution and the significantly higher proportion of theoretical
transport in vessels diameters > 24 µm (Σ D4 > 24) compared with that of temperate
species.
2.45 Implications for Rhododendron ecology—The results revealed that there is a
significant trade-off between safety and efficiency in Rhododendron wood. Thus, this
research supports the trade-off between safety and the efficiency previously documented
in plants (Gleason et al. 2016) even in a narrow phylogenic group. Gleason et al. (2016)
point out that it is most advantageous for plants to have high safety and high efficiency,

53
but this balance has not been attained by plants. Thus, there must be an efficiency cost of
high safety (Gleason et al. 2016). The Rhododendron species tested fall into the class of
high safety and low efficiency, which is at the far right of the trade-off (Gleason et al.
2016). In accordance, temperate Rhododendron species have safer wood than their
tropical counterparts. The significantly smaller mean, minimum and maximum vessel
diameter make temperate Rhododendron species less susceptible to freeze-thaw induced
embolism. The safe wood provides advantages for Rhododendron species in habitats with
frequent freeze-thaw events in the winter, but there are consequences of safe wood for
hydraulic conductance. The narrow vessel constrains hydraulic conductance and limits
the plant to lower transportation rates. Relatively low hydraulic conductance during
periods of high evaporative demand will induce low water potential in leaves and cause
stomatal closure. Thus, the low hydraulic conductance, characterized by temperate
Rhododendron wood, will be associated with low photosynthetic rates and a slow growth
rate. Moreover, the restriction in theoretical water flow makes the temperate
Rhododendrons species more vulnerable to low water potential and more likely to
experience drought induced embolism. Furthermore, there are very few if any tree form
Rhododendron species in temperate habitats, most likely due to the low hydraulic
conductance of their wood.
As a result of the “safe” wood temperate Rhododendron species are restricted to
moister habitats with more constant water availability. For example, temperate
Rhododendron species can grow successfully along stream margins, valleys bottom and
on north slopes. In contrast, temperate Rhododendron species are uncommon on south
facing slopes or ridge tops where the radiation load is higher. The slower growth rate and

54
restricted distribution range may be associated with poor competitive ability. Yet, there
are several Rhododendron species that have dominance in understory environments in
temperate forests world-wide. For example; R. maximum in the eastern deciduous forest
of the United States, R. ponticum in the deciduous forest of the Black Sea region and R.
brachycarpum in the birch forest of Japan. These species are the only evergreen species
in their respective regions that have strong protection against freezing induced damage in
the winter, yet have the ability to root sprout and form dense colonies that inhibit the
growth of competitors. Thus, the wood of Rhododendron species does constrain their
relative growth rate suggesting low competitive ability, yet a suite of other traits along
with protection against freeze induced wood damage can result in dominant understory
Rhododendron shrubs in temperate habitats.
The wood of tropical Rhododendron species surveyed in this research is biased
toward higher efficiency compared to the temperate species surveyed. The significantly
larger vessel size resulted in higher water transport rate, which can enable a higher
transpiration rate per leaf area. In addition, higher hydraulic conductance can lead to
larger leaf area per wood area (Huber value). The higher transpiration and the ability to
have higher stomatal conductance can lead to higher whole plant carbon gain.
Consequently, the wood of tropical Rhododendron species ought to make these species
more competitive than their temperate counterparts in a tropical habitat. Even though the
tropical Rhododendron wood is biased toward efficiency compared to the wood of
temperate Rhododendron, it is still relatively safe in comparison to many other tropical
plants. This may be one reason why tropical Rhododendron species gain dominance at
higher elevation in the tropics where protection against freezing becomes important.

55
One limitation in this study is the bias in plant specimen wood diameters. There
was a significant effect of habitat on stem diameter. The temperate Rhododendron
species sample had smaller mean stem diameter compared to the tropical Rhododendron
species sampled. Also, larger wood diameter was found to have higher efficiency
irrespective of the species habitat. It is possible that the higher efficiency of wood in
tropical Rhododendron species was biased because of smaller diameter branches in the
sampled temperate species. However, the stems were selected from the same age range.
Thus, the temperate Rhododendron stem is smaller than the tropical Rhododendron stem
at the same age. Therefore, the bias of stem diameter in this study reflects the reality of
stem architecture for species in different habitats and does not detract from the overall
conclusion that wood of tropical Rhododendron species has higher efficiency than wood
of temperate Rhododendron species.
2.46 Summary and conclusion—In summary, the data indicate that stems of
Rhododendron are characteristically “safe” and fall into the high safety and low
efficiency end of the trade of between safety and efficiency. Moreover, there is a
significant trade-off between safety and efficiency in Rhododendron stems if habitat
(temperate vs. tropical) or elevation of the native range is considered. Both evergreen
angiosperms in general and the Ericaceae alone have been found to have a significant
trade-off between safety and efficiency (Gleason et al. 2016). The data add to this general
theory by indicating that even within one narrow phylogenetic group that falls at
extremes of the trade-off between safety and efficiency, there is still a significant trade-
off. Also, this research suggests that the trade-off has important functional significance to
the ecology and distribution of Rhododendron species.

56
2.5 Literature cited
Wikipedia; Adiabatic lapse rate (https://en.wikipedia.org/wiki/Lapse_rate)
Anderegg, W. R. L., T. Klein, M. Bartlett, L. Sack, A. F. A. Pellegrini, B. Choat, and S.
Jansen. 2016. Meta-analysis reveals that hydraulic traits explain cross-species
patterns of drought-induced tree mortality across the globe. Proceedings of the
National Academy of Sciences of the United States of America 113:5024-5029.
Brown, G. K., L. A. Craven, F. Udovicic, and P. Y. Ladiges. 2006. Phylogeny of
Rhododendron section Vireya (Ericaceae) based on two non-coding regions of
cpDNA. Plant Systematics and Evolution 257:57-93.
Chenlemuge, T., B. Schuldt, C. Dulamsuren, D. Hertel, C. Leuschner, and M. Hauck.
2015. Stem increment and hydraulic architecture of a boreal conifer (Larix
sibirica) under contrasting macroclimates. Trees-Structure and Function 29:623-
636.
Choat, B., D. E. Medek, S. A. Stuart, J. Pasquet-Kok, J. J. G. Egerton, H. Salari, L.
Sack, and M. C. Ball. 2011. Xylem traits mediate a trade-off between resistance to
freeze-thaw-induced embolism and photosynthetic capacity in overwintering
evergreens. New Phytologist 191:996-1005.
Cordero, R. A., and E. T. Nilsen. 2002. Effects of summer drought and winter freezing
on stem hydraulic conductivity of Rhododendron species from contrasting
climates. Tree Physiology 22:919-928.
Davis, S. D., J. S. Sperry, and U. G. Hacke. 1999. The relationship between xylem
conduit diameter and cavitation caused by freezing. American Journal of Botany
86:1367-1372.

57
Gartner, H., S. Lucchinetti, and F. H. Schweingruber. 2014. New perspectives for wood
anatomical analysis in dendrosciences: The GSL1-microtome. Dendrochronologia
32:47-51.
Gleason, S. M., M. Westoby, S. Jansen, B. Choat, U. G. Hacke, R. B. Pratt, R. Bhaskar,
T. J. Brodribb, S. J. Bucci, K. F. Cao, H. Cochard, S. Delzon, J. C. Domec, Z. X.
Fan, T. S. Feild, A. L. Jacobsen, D. M. Johnson, F. Lens, H. Maherali, J.
Martinez-Vilalta, S. Mayr, K. A. McCulloh, M. Mencuccini, P. J. Mitchell, H.
Morris, A. Nardini, J. Pittermann, L. Plavcova, S. G. Schreiber, J. S. Sperry, I. J.
Wright, and A. E. Zanne. 2016. Weak tradeoff between xylem safety and xylem-
specific hydraulic efficiency across the world's woody plant species. New
Phytologist 209:123-136.
Hacke, U. G., A. L. Jacobsen, and R. B. Pratt. 2009. Xylem function of arid-land shrubs
from California, USA: an ecological and evolutionary analysis. Plant Cell and
Environment 32:1324-1333.
Hargrave, K. R., K. J. Kolb, F. W. Ewers, and S. D. Davis. 1994. Conduit diameter and
drought-induced embolism in Salvia mellifera Greene (Labiatae). New
Phytologist 126:695-705.
Körner, C. 2007. The use of ‘altitude’ in ecological research. Trends in Ecology &
Evolution 22:569-574.
Lens, F., A. Tixier, H. Cochard, J. S. Sperry, S. Jansen, and S. Herbette. 2013.
Embolism resistance as a key mechanism to understand adaptive plant strategies.
Current Opinion in Plant Biology 16:287-292.

58
Lipp, C. C., and E. T. Nilsen. 1997. The impact of subcanopy light environment on the
hydraulic vulnerability of Rhododendron maximum to freeze-thaw cycles and
drought. Plant Cell and Environment 20:1264-1272.
Medeiros, J. S., and W. T. Pockman. 2014. Freezing regime and trade-offs with water
transport efficiency generate variation in xylem structure across diploid
populations of Larrea sp. (Zygophyllaceae). American Journal of Botany
101:598-607.
Meinzer, F. C., K. A. McCulloh, B. Lachenbruch, D. R. Woodruff, and D. M. Johnson.
2010. The blind men and the elephant: the impact of context and scale in
evaluating conflicts between plant hydraulic safety and efficiency. Oecologia
164:287-296.
Nabeshima, E., T. Kubo, K. Yasue, T. Hiura, and R. Funada. 2015. Changes in radial
growth of earlywood in Quercus crispula between 1970 and 2004 reflect climate
change. Trees-Structure and Function 29:1273-1281.
Noshiro, S., and M. Suzuki. 1995. Ecological wood anatomy of Nepalese Rhododendron
(Ericaceae). 2. Intraspecific variation. Journal of Plant Research 108:217-233.
Noshiro, S., M. Suzuki, and H. Ohba. 1995. Ecological wood anatomy of Nepalese
Rhododendron (Ericaceae). 1. Interspecific variation. Journal of Plant Research
108:1-9.
Olson, M. E., J. A. Rosell, C. Leon, S. Zamora, A. Weeks, L. O. Alvarado-Cardenas, N.
I. Cacho, and J. Grant. 2013. Convergent vessel diameter-stem diameter scaling
across five clades of new and old world eudicots from desert to rain forest.
International Journal of Plant Sciences 174:1062-1078.
59
Sperry, J. S., U. G. Hacke, and J. Pittermann. 2006. Size and function in conifer
tracheids and angiosperm vessels. American Journal of Botany 93:1490-1500.
Sperry, J. S., and N. Z. Saliendra. 1994b. Intra- and inter-plant variation in xylem
cavitation in Betula occidentalis. Plant Cell and Environment 17:1233-1241.
Zanne, A. E., D. C. Tank, W. K. Cornwell, J. M. Eastman, S. A. Smith, R. G. FitzJohn,
D. J. McGlinn, B. C. O'Meara, A. T. Moles, P. B. Reich, D. L. Royer, D. E.
Soltis, P. F. Stevens, M. Westoby, I. J. Wright, L. Aarssen, R. I. Bertin, A.
Calaminus, R. Govaerts, F. Hemmings, M. R. Leishman, J. Oleksyn, P. S. Soltis,
N. G. Swenson, L. Warman, and J. M. Beaulieu. 2014. Three keys to the radiation
of angiosperms into freezing environments. Nature 506:89-+.

60
2.6 Tables
Table 2.1 List of the Rhododendron species used in this study
Species Habitat Average Elevation (m)
R. anthopogon Temperate 3,127
R. augustinii Temperate 2,350
R. campylogynum Temperate 3,508
R. catawbiense Temperate 1,592
R. cinnabarinum Temperate 3,127
R. dalhousiae Temperate 2,364
R. edgeworthii Temperate 2,898
R. forrestii Temperate 3,737
R. galactinum Temperate 3,150
R. hippophaeoides Temperate 3,335
R. huianum Temperate 2,034
R. hyperythrum Temperate 1,060
R. hyperythrum Temperate 1,060
R. keiskei Temperate 1,220
R. keiskei Temperate 1,220
R. keysii Temperate 3,050
R. lepidostylum Temperate 3,355
R. lindleyi Temperate 2,745
R. macrophyllum Temperate 600
R. megeratum Temperate 3,830
R. minus Temperate 1,700
R. minus var. Chapmanii Temperate 150
R. orbiculare Temperate 3,150

61
R. ponticum Temperate 900
R. pronum Temperate 4,130
R. proteoides Temperate 4,118
R. pseudochrysanthum Temperate 2,898
R. racemosum Temperate 3,050
R. ririei Temperate 1700
R. rubiginosum Temperate 3,355
R. sherriffii Temperate 3,661
R. spinuliferum Temperate 2,200
R. strigillosum Temperate 2,828
R. tephropeplum Temperate 3,370
R. trichostomum Temperate 3,400
R. walongense Temperate 1,830
R. williamsianum Temperate 2,800
R. aurigeranum Tropical 1,328
R. bryophilum Tropical 1,448
R. celebicum Tropical 1,900
R. crassifolium Tropical 2,135
R. densifolium Tropical 1,400
R. himantodes Tropical 1,650
R. jasminiflorum Tropical 1,300
R. javanicum Tropical 1,508
R. kawakamii Tropical 1,900
R. kochii Tropical 1,200
R. laetum Tropical 1,968
R. multicolor Tropical 1,500
R. orbiculatum Tropical 1,300

62
R. radians Tropical 1,600
R. rarilepidotum Tropical 2,235
R. rushforthii Tropical 1,650
R. rushforthii Tropical 1,650
R. suaveolens Tropical 1,500
R. taxifolium Tropical 2,650
R. tuba Tropical 2,520
R. verticillatum Tropical 1,100
R. yongii Tropical 2,490
R. zoelleri Tropical 675

63
Table 2.2 Two-way ANOVA table for the effects of habitat, elevation rank, and their
interaction on vessel traits of Rhododendron species. Mean vessel = mean vessel
diameter (µm); Min vessel = minimum vessel diameter (µm); Max vessel = maximum
vessel diameter (µm); Vessel density = the number of vessels per wood area sampled
(mm-2).
Vessel Traits DF SS F Sig.
Mean Vessel
Habitat 1 101.06 15.20 0.0003***
Elevation Rank 2 24.25 1.82 0.17
Habitat x Elevation 2 16.29 1.22 0.30
Min Vessel
Habitat 1 13.45 4.45 0.0394*
Elevation Rank 2 19.07 3.16 0.05*
Habitat x Elevation 2 14.38 2.38 0.10
Max Vessel
Habitat 1 131.36 6.65 0.0127*
Elevation Rank 2 49.09 1.24 0.30
Habitat x Elevation 2 49.85 1.26 0.29
Vessel Density (pV)
Habitat 1 102603.66 2.20 0.14
Elevation Rank 2 63939.97 0.69 0.51
Habitat x Elevation 2 21159.49 0.23 0.80

64
Table 2.3 Two-way ANOVA table for the effects of habitat, elevation rank, and their
interaction on the skewness and kurtosis of vessel diameter distributions in
Rhododendron species stem.
Vessel Distribution DF SS F Sig.
Skewness
Habitat 1 0.36 7.21 0.0096***
Elevation Rank 2 0.45 4.59 0.0145**
Habitat x Elevation 2 0.24 2.41 0.10
Kurtosis
Habitat 1 0.04 0.11 0.75
Elevation Rank 2 0.04 0.05 0.95
Habitat x Elevation 2 0.61 0.87 0.42

65
Table 2.4 Two-way ANOVA table for the effects of habitat, elevation rank, and their
interaction on the wood transport efficiency. Dh = Hydraulically weighted diameter of
xylem, Kstheo = theoretical specific conductivity, Σ D4 > 24 = the proportional of the
theoretic transport in vessels that occurs in vessels greater than 24 µm in diameter.
Wood Transport Efficiency DF SS F Sig.
Dh
Habitat 1 111.32 14.24 0.0004***
Elevation Rank 2 28.88 1.85 0.17
Habitat x Elevation 2 19.06 1.22 0.30
Kstheo
Habitat 1 6.84 6.62 0.0131***
Elevation Rank 2 2.25 1.09 0.34
Habitat x Elevation 2 7.32 3.54 0.0363*
Σ D4 > 24
Habitat 1 1752.65 11.25 0.0015*
Elevation Rank 2 1073.50 3.45 0.0391*
Habitat x Elevation 2 501.57 1.61 0.21

66
Table 2.5 P-values for regressions between wood traits (as dependent variable) and mean
elevation of the native range (as independent variable), including all species (All data),
only temperate species (Temperate), and only tropical species (Tropical). Mean vessel =
mean vessel diameter (µm); Min. vessel = minimum vessel diameter (µm); Max. vessel =
maximum vessel diameter (µm); Vessel density = the number of vessels per wood area
sampled. Dh = Hydraulically weighted diameter of xylem (µm), Kstheo = theoretical
specific conductivity (kg m-1 MPa-1 s-1), Σ D4 > 24 = the proportional of the theoretic
transport in vessels that occurs in vessels greater than 24 µm in diameter (%).
Traits All Data Temperate Tropical
Mean Vessel 0.0028*** 0.0919* 0.41
Min. Vessel 0.37 0.42 0.078*
Max. Vessel 0.0012*** 0.0097*** 0.82
Vessel Density 0.0533* 0.57 0.18
Skewness 0.0037*** 0.53 0.0054***
Kurtosis 0.17 0.11 0.39
Dh 0.0016*** 0.057* 0.36
Kstheo 0.0465 0.0752* 0.38
Σ D4 > 24 0.0029*** 0.0165** 0.0572*

67
Table 2.6 Results of regressions between wood traits (as dependent variable) and vascular
area (as independent variable), including all species (All data), only temperate species
(Temperate), and only tropical species (Tropical). Mean vessel = mean vessel diameter
(µm); Min. vessel = minimum vessel diameter (µm); Max. vessel = maximum vessel
diameter (µm); Vessel density = the number of vessels per wood area sampled. Dh =
Hydraulically weighted diameter of xylem (µm), Kstheo = theoretical specific conductivity
(kg m-1 MPa-1 s-1), Σ D4 > 24 = the proportional of the theoretic transport in vessels that
occurs in vessels greater than 24 µm in diameter (%).
Traits All Data Temperate Tropical
Mean Vessel <0.0001*** 0.0083*** 0.0038***
Min. Vessel 0.21 0.41 0.55
Max. Vessel <0.0001*** 0.001*** 0.0063***
Vessel Density 0.0957* 0.91 0.30
Skewness 0.15 0.56 0.76
Kurtosis 0.0324** 0.0607* 0.37
Dh <0.0001*** 0.0041*** 0.0026***
Kstheo 0.0001*** 0.0067*** 0.0803**
Σ D4 > 24 <0.0001*** 0.0012*** 0.0016***

68
2.7 Figure legends
Figure 2.1 A cross section micrograph at 40 x objective lens of R. jasminiflorum stem.
Vessel element (A), fiber (B), and ray cell (C) are shown.
Figure 2.2 (A) Box plots of mean vessel diameter among all species, separated by
temperate and tropical habitats, and separated by elevation ranks, (B) Box plots of
minimal vessel diameter among all species, separated by temperate and tropical
habitats, and separated elevation ranks, (C) Box plots of maximum vessel
diameter among all species, separated by temperate and tropical habitats, and
separated by elevation ranks, (D) Box plots of mean vessel density among all
species, separated by temperate and tropical habitats, and separated by elevation
ranks. Elevation ranks are low (0 - 1,200 m), medium (1,201 - 2,400 m), and high
(2,401 - 4,200 m).
Figure 2.3 (A) Box plots of mean skewness of the vessel diameter distribution among all
species, separated by temperate and tropical habitats, and separated by elevation
ranks, (B) Box plots of mean kurtosis of the vessel diameter distribution among
all species, separated by temperate and tropical habitats, and separated by
elevation ranks. Skewness and kurtosis were determined using JMP Pro 12.
Elevation ranks are low low (0 - 1,200 m), medium (1,201 - 2,400 m), and high
(2,401 - 4,200 m).
Figure 2.4 (A) Box plots of the hydraulically weighted diameter of xylem (Dh) among all
species, separated by temperate and tropical habitats, and separated by elevation
ranks, (B) Box plots of the mean theoretical specific conductivity (KSTheo) among

69
all species, separated by temperate and tropical habitats, and separated by
elevation ranks, (C) Box plots of the mean and standard deviation of the
proportion of theoretical transport in vessel with larger diameter (> 24.00 µm) (Σ
D4 > 24) among all species, separated by temperate and tropical habitats, and
separated by elevation ranks. Elevation ranks are low (0 - 1,200 m), medium
(1,201- 2,400 m), and high (2,401 - 4,200 m).
Figure 2.5 (A) Regression of vessel diameter (as dependent variable) against vessel
density (as independent variable) including all species (R2 = 0.059), (B) for
temperate species only (R2 = 0.011), (C) for tropical species only (R2 = 0.017).
Figure 2.6 (A) Regression of wood stem cross section area (as dependent variable)
against whole stem area (as independent variable) including all species (R2 =
0.951), (B) for temperate species only (R2 = 0.937), (C) for tropical species only
(R2 = 0.944).

70
2.8 Figures
Figure 2.1. A cross section micrograph of R. jasminiflorum stem

71
Figure 2.2 A
Figure 2.2 B

72
Figure 2.2 C
Figure 2.2 D
Figure 2.2 Box plots of vessel traits

73
Figure 2.3 A
Figure 2.3 B
Figure 2.3. Box plots of mean skewness and kurtosis

74
Figure 2.4 A
Figure 2.4 B

75
Figure 2.4 C
Figure 2.4. Box plots of the hydraulic traits

76
Figure 2.5 A
Figure 2.5 B
12
14
16
18
20
Mea
n ve
ssel
diam
eter
600 800 1000 1200 1400 1600pV (Vessel Density) (#/A)
(μm)
(μm)
VesselDensity(mm-2)
VesselDensity(mm-2)

77
Figure 2.5 C
Figure 2.5. Regression of vessel diameter against vessel density
10
15
20
25
Mea
n ve
ssel
diam
eter
500 600 700 800 900 1000 1100 1200 1300pV (Vessel Density) (#/A)
(μm)
VesselDensity(mm-2)

78
Figure 2.6 A
Figure 2.6 B
(mm2 )
(mm2 )
(mm2)
(mm2)

79
Figure 2.6 C
Figure 2.6. Regression of wood area against whole stem area
(mm2 )
(mm2)

80
CHAPTER 3
Exploring leaf anatomical traits of Rhododendron species: A focus on the
relationship with elevation and habitat (temperate vs. tropical) of the native range.
3.1 Introduction
It is well known that leaf anatomical traits have important implications to plant
fitness through their effects on carbon gain by photosynthesis (Brodribb and Feild 2010).
In particular, the total amount of leaf area per ground area (leaf area index) is highly
related to plant productivity (Ewert 2004). Also, plant growth rate is significantly related
to specific leaf weight (SLW) such that species with relatively thin leaves (low SLW)
usually have a faster growth rate than plants with relatively high SLW (Chapin 1980). In
general, leaves with higher SLW (usually thicker leaves) have a higher carbon cost per
leaf area, but have a lower nitrogen content per leaf area, which results in a low
photosynthetic rate per leaf area and slower whole plant growth rate (Chapin 1980). Also,
plant productivity is related to the capacity for water flow from roots to leaves. The
amount of water flow per vascular area per leaf area is termed leaf hydraulic
conductance. Plants with high leaf hydraulic conductance have a higher plant
productivity than plants with low leaf hydraulic conductance (Tyree 2003). Because leaf
hydraulic conductance is directly related to stomatal pore index and vein density these
leaf functional traits relate directly to plant productivity (Sack et al. 2003). Thus, there
are several leaf morphological and anatomical traits that have been identified as
functional traits that have significant effects on plant growth rate, competitive ability and
distribution on the landscape (Price et al. 2014).

81
The Leaf Economic Spectrum (LES) defines the relationships between key leaf
functional traits and plant resource use efficiency or growth rate (Reich 2014). For
instance, leaf specific weight is linearly related to leaf longevity, and leaf longevity is
linearly related to whole plant growth rate when plants from across the globe including
all biomes are included. Thus, the relationships in the LES define universal fundamental
characteristics across plants in all ecosystems. One important determinant of the LES is
the number of veins per leaf area VLA (Sack et al. 2013), which is directly correlated
with stomatal pore index (SPI) and leaf hydraulic conductance (LHC). Thus, there are
positive significant relationships between SPI or LHC and plant growth rate when a
global view of plants is considered. One limitation of the LES is that the relationships are
presented as log-log plots, which hides some of the variation across the gradient. In fact,
the variation within one end of the gradient may be very important to the ecology of that
group. For example, at one end of the LES gradient are plants that have relatively thick
long-lived leaves, with a low SPI and low LHC that result in a slow growth rate and high
nutrient use efficiency. However, leaf epidermal structures such as scales or trichomes
can greatly influence leaf function for this group (Brodribb and Hill 1997, Nilsen et al.
2014). Therefore, variation in leaf anatomy or morphology within any functional group
may have important implications to plant success. Understanding the variation of
anatomical traits within a functional group and its association with habitat conditions can
yield significant insight to the ecological adaptations of the group.
There are several reasons why species of evergreen Rhododendron constitute a
valuable resource for understanding the effects of variation in anatomical traits within a
functional group on plant functional ecology. The genus Rhododendron is a strongly
82
monophyletic group in the Ericaceae (Kron and Judd 1990b). The group evolved in the
circumboreal forest of Laurasia (Milne 2004). In fact, the vast majority of evergreen
Rhododendron species have the same general growth habit. They have entire leaves and a
woody growth form (Cox 1990). Shoots elongate rapidly and produce leaves in a whorl
near the apex of the stem (Nilsen et al. 1987, Nilsen et al. 2014). Although there is high
consistency in general growth characteristics, there is considerable variation in overall
plant architecture and habitats occupied by Rhododendron species. For example, the
native ranges of Rhododendron species include alpine, arctic, temperate and tropical
regions. Moreover, elevation of the native range varies from sea level to 5,000 m. Plants
have a wide range in leaf size (0.5 cm2 – 3,000 cm2), a diversity of abaxial epidermal
appendages (trichomes), and a wide range in plant height from cushion plant to canopy
tree. Thus, evergreen Rhododendron species reside in one specific location on the LES
(high SLW, long lived leaves, low nitrogen concentration, slow growth rate) yet they
have significant variation in native ranges and plant architecture that should select for
variation in leaf functional traits.
The overall objective of this research was to understand the relationships of
habitat and elevation with leaf anatomical traits in a selection of evergreen Rhododendron
species. Species from tropical and temperate habitats included in this study range from
sea level to 4,200 m elevation. Leaves of tropical species, particularly in wet tropical
regions, are characterized as hygromorphic (Roth 2012). In table 5 on page 422 of Roth
(2012), hygromorphic leaves tend to have the following characteristics: thin lamina, thin
cuticle, thin mesophyll relative to leaf thickness, single epidermis, no water storage cells
below the epidermis, open mesophyll, low stomatal density, large stomata, no stomatal

83
crypts and no hairs (trichomes). Based on the fact that tropical Rhododendron species in
tropical habitats should have more hygromorphic leaves than that of species in temperate
habitats the following hypotheses were posed:
1) Leaves on Rhododendron species that inhabit tropical regions have functional
traits that reflect higher hygromorphy than that of temperate Rhododendron species. This
hypothesis would be supported if: (a) Leaves on tropical Rhododendron species are larger
and thinner than that of temperate species. (b) Leaves on tropical species have lower
stomatal density and larger stomata than that of temperate species. (c) Leaves of tropical
Rhododendron species do not have a hypodermis or water storage cells below the
epidermis.
2) The leaves of Rhododendron species trend toward greater xeromorphy as the
native range of those species increases in elevation. This hypothesis would be supported
if: (a) Leaf area decreases as the elevation of the native range increases. (b) The stomatal
pore index decreases as elevation of the native range increases. (c) There is a higher
likelihood that leaves of plants with a native range at higher elevation have hairs or
stomata in crypts. (d) The incidence of water storage cells increases as the elevation of
the native range increases.
3) The leaf stomatal pore index will increase in accordance to an increase in stem
theoretical specific conductivity. This hypothesis would be supported if: (a) The stomatal
pore index (dependent variable) measured in this chapter has a significant positive
regression with the theoretical specific conductivity (independent variable) of stems
measured in chapter 2 (only for common species sampled in chapter 2 and 3).

84
3.2 Materials and Methods
3.21 Selected accessions—More than 80 accessions (one accession per species)
were selected for this research (Table 3.1). Evergreen shrubs that have either a temperate
(41 out of 86 species) or tropical (45 out of 86 species) range were selected. This
selection effort was used to control overall growth habit and exclude external variables
for temperate and tropical regions species. Leaves of species were collected from various
sources including the Rhododendron Species Foundation in Federal Way, WA, a
common garden in Volcano Village, HI, the Royal Botanic Garden Edinburgh, UK, and
Biological Sciences-VBI Plant Growth Facility (VT-PGF).
3.22 Leaf traits surveyed—Four recently mature leaves from outer canopy in four
directions were collected from each accession. The leaves were sealed in zip-lock plastic
bags and transported to the lab for morphological and anatomical analyses. The leaf
length, width and area were measured for each leaf. Leaf length divided by leaf width
was used as an index of leaf lamina shape (high value = linear, low value = ovoid). Leaf
length times leaf width was used to estimate leaf area from a previously published
regression (Nilsen et al. 2014). A digital image (brand and model of the camera) of the
abaxial leaf surface was recorded at 10 x through stereo microscope (model SZ-ST;
Olympus Optical Co. Ltd., Tokyo, Japan) in order to determine the type of abaxial leaf
surface appendages (trichomes). The abaxial surfaces were defined into the following
categories modified from Argent (2015), and Nilsen et al. (2014): (1) No trichomes
present, (2) Peltate scales (flat wide cap with a short base) present, (3) Cushion scales
(inflated wide cap with short base) present, (4) Cuneate scales (cup shaped cap with
irregular margin and short base) present, (5) Stellate scales (cup shaped cap with long

85
finger like projections and a short base) present, (6) Dendroid trichomes (stellate cap on a
long stalk subtended by a mound of epidermal cells) present, (7) Hair trichomes (long
single cell extension of the epidermis) present, (8) Multi-branched trichomes (long and
branched extension of the epidermis composed of multiple cells leading to a mat of
tangled hairs) present.
The abaxial surface of three leaves were randomly selected for stomatal imprint
(Hilu and Randall 1984). Leaves were painted (between two main lateral veins) with
clear nail polish (product # 504; Clairol Inc., Stamford, Connecticut). When the polish
was dry and hardened, a narrow piece of clear adhesive tape (Scotch brand package
sealing tape) was placed over the nail polish, pressed down firmly, carefully lifted to
remove the dried sheet of nail polish (the peel), placed (with the peel facing upward) on a
microscope slide and covered with a cover-slip. Five randomly located images (25 x
objective lens) of the epidermal peels were captured with a digital camera (model DP-10;
Olympus Optical Co. Ltd., Tokyo, Japan) mounted on a bright field microscope (model
BX50; Olympus Optical Co. Ltd., Tokyo Japan). All stomata were counted in the field of
view of each image to determine stomatal density. Five additional images (40 x objective
lens) were captured from the same epidermal peel for stomatal size. The length of every
stomatal pore and the total number of pores in the field of view were determined using
ImageJ software (National Institutes of Health (NIH), Bethesda, MD). The stomata pore
index (SPI) was calculated for each image as: D (L2). Where D = stomata density (mm-2),
and L = mean stomatal pore length (µm) (Parlange and Waggoner 1970).
Following the removal of nail polish, five sections (each 3 - 5 mm in width) from
the mid-vein to the margin were excised from each leaf (avoiding the nail polish affected

86
area) and preserved in FAA (50% ethanol, 35% water, 10% formalin, 5% glacial acetic
acid). Following complete preservation (approximately 1 week), sections were
sequentially hydrated to remove the FAA, dehydrated in an alcohol gradient (5 steps at
30 minutes each), saturated with xylene (two 1 hr soaks), impregnated with paraffin oil (1
step with 50% paraffin oil and xylene for 1 hr plus 2 steps of 1 hr each of pure paraffin
oil), and equilibrated in hot paraffin (3 steps of 8 hr each). The leaf pieces were trimmed
and mounted in paraffin for laminal cross sections (8 µm) made with a rotary microtome
(model HN 340E; Microm International GmbH, Walldorf, Germany). One ribbon (8 - 10
cross sections) was mounted from one of the leaf pieces from each leaf. The resulting
tissue sections were double stained with safranin O and fast green before permanent
mounting with Permounttm.
Three to five digital images were taken at (10 x objective lens) from the best
sections on each slide (Figure 3.1). The leaf thickness, mesophyll thickness, and number
of adaxial epidermal layers were measured using ImageJ software. Some leaves had
idioblasts on the adaxial surface under or in the epidermis. The length and width of each
idioblast in the image was measured. In leaves that had idioblasts present, the density of
idioblasts per mm of leaf length (ID = # idioblast / length of the section) was calculated.
Also, the area of each idioblast was calculated by using the geometric formula for the
area of an ellipse (IA = pab), where a = length and b= width (Selby 1972). The IAs were
summed and divided by the total area of the section to attain an index of idioblast
expression (IE= ((Σ IA) / total section area) x 100). In addition, the area of the mesophyll
in relation to the area of the leaf (% mesophyll) was determined on each photomicrograph
and averaged for each accession. Also, five replicate lines were placed across the leaf

87
cross-section images. The number of cell walls crossed by each line in the interior of the
leaf divided by two is equal the Ames/A ratio. This value represents the density of
mesophyll cells and reflects the extent of open space in the spongy mesophyll. High
value of Ames/A ratio represent denser spongy mesophyll.
3.23 Statistical analysis—Accessions were assigned to a habitat (temperate or
tropical) based on their known native range reported in the literature. Tropical species
were those that had ranges between 20 °N and 20 °S latitude. Temperate species had
ranges between 30 °N and 40 °N latitude. An elevation was assigned to each species as
the middle elevation of the native range reported in the literature. In order to convert
these elevation data from continuous to categorical three categories were defined (low =
0 - 1,200 m, medium = 1,201 - 2,400 m, and high = 2,401 - 4,200 m). Two-way ANOVA
was used to test the effects of habitat (temperate vs. tropical) and elevation (low,
medium, and high) on all morphological and anatomical traits (JMP Pro 12, SAS Institute
Inc., Cary, NC). One-way ANOVA was used to test for the effect of elevation on
idioblast traits, because idioblast was only found in leaves of tropical species in this
study. Spearman correlation and linear regression analyses were used to determine the
relationship between stomatal pore index (SPI) and theoretical specific conductivity
(Kstheo) in stems of the same species (data from chapter 2).
3.3 Results
3.31 Leaf morphology and anatomy—Rhododendron leaves have big variation in
size yet the shape, defined by the length to width ratio, is relatively constant. One of the
most obvious aspects of Rhododendron leaf anatomy was the presence of idioblasts.

88
Generally, idioblasts were found underneath the adaxial epidermis (Figure 3.1 A [A]), but
in some species, idioblasts can be found underneath abaxial epidermis as well (Figure 3.1
A [C]). Palisade mesophyll was found to vary from one to four layers (Figure 3.1 A [B,
D, and F]). Each layer of palisade mesophyll was very uniform in cell shape and size,
even when disturbed by the presence of idioblasts. Some temperate plants had a
hypodermis, a layer of square cells below the epidermis, which varied from one to three
layers (Figure 3.1 A [F]). No hypodermis was found in any tropical plants included in
this research. Abaxial papillae, short finger like extensions of epidermal cells, can be
found in some temperate plants (Figure 3.1 A [F]). Rhododendron species have a wide
variety of different leaf trichome types (Figure 3.1 B). They were seven different types
found among the sampled species. Stomata shape did not vary much, and most stomata
were randomly distributed on the abaxial surface. Figure 3.1 C [A] shows a uniform
distribution of stomata among papillae surface compare to smooth surface of Figure 3.1 C
[B]. Stomata were located in stomatal crypts for a few species particularly R. himantodes.
All plants were hypostomatous.
The mean and standard deviation of leaf area (Figure 3.2 A) of all data was 16.98
± 14.91 mm2. The mean leaf area of tropical plants (18.46 ± 15.45 mm2) was not
significantly different (Table 3.2) from the temperate species (15.40 ± 14.33 mm2). The
mean leaf area decreased (Figure 3.2 A) from low elevation to high elevation (30.15 ±
17.09 mm2, 16.97 ± 13.02 mm2, and 12.71 ± 13.85 mm2 respectively) and elevation effect
was statistically significant (Table 3.2). The interaction between habitat and elevation
was not significant (Table 3.2). The mean and standard deviation of leaf length to width
(L/W) ratio (Figure 3.2 B) of all data was 2.88 ± 2.50. The mean leaf L/W ratio of

89
tropical plants (3.18 ± 3.39) was not significantly different (Table 3.2) from the temperate
species (2.56 ± 0.71). The mean leaf L/W ratio was from low elevation to high elevation
were 2.49 ± 0.60, 3.11 ± 3.08, and 2.78 ± 2.23 respectively). The elevation and the
interaction between habitat and elevation were not significant (Table 3.2).
The mean and standard deviation of leaf thickness (Figure 3.2 C) of all data was
0.40 ± 0.14 mm. The tropical plants had a significantly (Table 3.2) thicker leaf (0.46 ±
0.13 mm2) than that of the temperate plants (0.31 ± 0.010 mm). The mean leaf thickness
(Figure 3.2 C) from low to high elevation were 0.36 ± 0.08, 0.43 ± 0.15, and 0.35 ± 0.14
mm respectively. The effect of elevation was not significant (Table 3.2). The interaction
between habitat and elevation rank was not significant (Table 3.2). The mean and
standard deviation of mesophyll percentage (Figure 3.2 D) of all data was 68.29.78 ±
10.82 %. The mean mesophyll percentage of temperate and tropical plants was 68.55 ±
7.16, and 68.10 ± 12.84 % respectively, but the effect of habitat was not significant
(Table 3.2). There was an increasing trend in leaf mesophyll percentage from low (64.74
± 9.76%) to medium (68.49 ± 12.15%) to high (69.87 ± 8.79%), but the elevation effect
was not significant (Table 3.2). However, the interaction between habitat and elevation
was statistically significant (Table 3.2). The mean and standard deviation of Ames/A ratio
(Figure 3.2 E) of all data is 9.45 ± 2.70. The mean Ames/A ratio of tropical plants (9.90 ±
2.50) was significantly higher (Table 3.2) than that of the temperate species (8.83 ± 2.89).
The mean Ames/A ratio increased from low elevation to high elevation (8.75 ± 3.38, 9.56
± 2.54, and 9.61 ± 2.68 respectively), but the effect of elevation was not significant
(Table 3.2). However, the interaction between habitat and elevation was significant
(Table 3.2).

90
3.32 Stomata—The mean and standard deviation of abaxial leaf stomatal density
of all plants were 260.45 ± 112.18 mm-2 (Figure 3.3 A). The mean and standard deviation
of abaxial leaf stomatal density of tropical and temperate plants were 257.96 ± 92.14, and
262.81 ± 129.55 mm-2 respectively (Figure 3.3 A). The effect of habitat was not
significant (Table 3.3). The mean and standard deviation of abaxial leaf stomatal density
of low to high elevation were 247.11 ± 104.91 mm-2, 245.93 ± 98.75 mm-2, and 280.09 ±
125.63 mm-2 respectively (Figure 3.3 A). Even though the stomatal density of higher
elevation plants tended to be greater than those of low and medium elevation, the effect
of elevation on stomatal density was not significant (Table 3.3). However, the interaction
between habitat and elevation on stomatal density was significant (Table 3.3). The mean
and standard deviation of abaxial leaf stomatal pore length of all plants were 0.019 ±
0.008 mm (Figure 3.3 B). The stomatal pore length of tropical plants (0.022 ± 0.008 mm)
was significantly larger than that of temperate plants (0.015 ± 0.006 mm) (Table 3.3).
The mean and standard deviation of stomatal pore length of low to high elevation were
0.021 ± 0.008 mm, 0.021 ± 0.008 mm, and 0.016 ± 0.007 mm respectively (Figure 3.3
B). Even though the stomatal pore length of low and medium elevation plants were
greater than that of high elevation, the effect of elevation and the interaction between
habitat and elevation on stomatal pore length were not significant (Table 3.3).
The mean and standard deviation of abaxial leaf stomatal pore index of all plants
were 0.081 ± 0.048 (Figure 3.3 C). The stomatal pore index of tropical plant (0.100 ±
0.048) was significantly larger than that of temperate plants (0.065 ± 0.043) (Table 3.3).
The mean and standard deviation of stomatal pore index of low to high elevation were
0.091 ± 0.036, 0.091 ± 0.055, and 0.071 ± 0.044 respectively (Figure 3.3 C). The

91
stomatal pore index tended to decrease from low to high elevation, but effect of elevation
and the interaction between habitat and elevation on stomatal pore index were not
significant (Table 3.3).
3.33 Idioblasts—There were no idioblasts found in leaves of the temperate species
sampled. Therefore, the test for habitat is not included in the following analysis.
However, based on the sampled accessions in this research, there was a 100% assurance
that idioblasts are only found in tropical species. The mean and standard deviation of leaf
idioblast density in the tropical accessions were 30.73 ± 15.26 mm-2 (Figure 3.4 A). The
mean and standard deviation of leaf idioblast density from low to high elevation were
36.56 ± 15.97, 31.66 ± 15.79, and 21.56 ± 8.92 mm-2 respectively (Figure 3.4 A). The
leaf idioblast density tended to decrease from low to high elevation, but effect of
elevation on idioblast density was not significant (Table 3.4). The mean and standard
deviation of tropical plant leaf idioblast expression were 9.37 ± 5.53 (Figure 3.4 B). The
mean and standard deviation of tropical plant leaf idioblast expression of low to high
elevation were 8.00 ± 3.49, 9.90 ± 5.53, and 8.84 ± 7.18 respectively (Figure 3.4 B). The
effect of elevation on idioblast expression was not significant (Table 3.4).
3.34 Leaf adaxial trichomes—Among all the Rhododendron species evaluated in
this study, peltate scales (type 2) were most abundant (59.8%). Other types of trichomes
were found in comparable frequently between 1.22% - 12.20% of the sampled species. In
4.88% of the samples no epidermal appendages were present (type 1 in Figure 3.5 A).
In temperate plants, peltate scales (type 2) were the most abundant (50.00%). The
two least abundant types of trichome were cushion scales (type 3), and dendroid
trichomes (type 6). The other trichome types occurred at 5.26% - 10.53% of the sampled

92
species. In tropical plants, the most abundant trichome also was type 2 (68.18%) and
dendroid trichomes (Type 6) were least abundant (6.82%). All the tropical species had
trichomes present. Also, hair and multi-branched hair trichomes (types 7, and 8) were
absent in tropical plants surveyed (Figure 3.5 B).
In low elevation plants, peltate scales (type 2) were the most abundant (54.55%).
Other trichome types (1, 4, 5, 7, and 8) were present on approximately 9% each of the
sampled species. Cushion and dendroid trichomes (types 3, and 6) were absent in low
elevation plants. In medium elevation plants, peltate trichomes (type 2) were the most
abundant (69.44%). Only 2.78% of species sampled from medium elevation lacked
trichomes (type 1). Other types of trichome were found in approximately 5.5% of
sampled species. Hairs and multi-branched hairs (types 7, and 8) were absent in the
medium elevation species. In high elevation plants, peltate scales (type 2) again were the
most abundant (50.00%). Cushion scales (Type 3) were least abundant (2.94%). Other
trichome types (1, 4, 5, 6, 7, and 8) were found between 5.88 - 8.82% (Figure 3.5 C).
3.35 The relationship between theoretical specific conductivity and leaf stomatal
pore index—When all species were used in the analysis, there was a significant positive
relationship (Table 3.5, Figure 3.6). However, if the analysis was restricted to only
temperate species or only tropical species, then the relationship was not significant.
3.4 Discussion
3.41 General leaf structure—A wide variation in leaf traits was found for the
sampled species even though they were all evergreen shrubs in one subgenus of
Rhododendron. Evergreen shrubs are generally located at one position (one functional

93
type) on the LES. The LES suggests that evergreen shrubs have thick, dense leaves that
have extended longevity and low gas exchange rates (photosynthesis and transpiration).
However, some of the sampled species did have thick succulent leaves with dense
mesophyll, yet other sampled species had thinner leaves with a relatively open
mesophyll. The adaxial epidermis was most commonly uniserate; however, is some cases
a single hypodermis or multiple hypodermis was present. The most common number of
palisade mesophyll layers was two, yet some sampled species had one layer and others
three. Many different abaxial appendages were found including scales, hairs and papillae.
Moreover, stomatal distribution varied from randomly distributed to completely located
within stomatal crypts. Idioblasts were identified in many species. The idioblast central
vacuole stained with safranin suggesting that there were phenolic compounds in the
lumen of most idioblasts. Some species had idioblast lumens that contained material
resembling polysaccharides. No crystals were found in idioblasts suggesting that the
idioblasts did not function for calcium management. The sum of the variation in leaf
anatomy among leaves of this functional type indicated that leaf anatomical variation
ought to be important for adaptation to the climatic and biotic challenges experienced by
these species in their native ranges. Moreover, these results indicated that the general
LES theory hides important variation in anatomical traits.
3.42 Addressing hypothesis one—Roth (2012) suggested that leaves of tropical
species should tend toward hygromorphic leaf traits. If so, then leaves of Rhododendron
species from tropical habitats should have more hygromorphic leaves that those of
Rhododendron species from temperate habitats. Hygromorphic leaves tend to be large,
thin, have no trichomes, and have fewer but larger stomata (Roth 2012). Leaves of the

94
selected tropical species in this study were larger than leaves on the selected temperate
species, but the difference was not significant. In fact, Rhododendron leaves vary in leaf
area from 0.1 cm2 to 500 cm2 across the genus as a whole (Feng 1992). Both the tropical
and temperate species sampled had leaf areas in the middle of the range in leaf area for
Rhododendron, so no significant difference in size would be expected. In fact, in another
study, a selection of tropical Rhododendron accessions had leaf areas on the smaller side
in relation to the genus as a whole (Nilsen et al. 2014). Therefore, there was no support
for any different in leaf area between habitat.
The leaves of the sampled tropical species were significantly thicker than the
temperate species. This result is counter to the prediction by (Roth 2012) that tropical
leaves have hygromorphic traits. Variation in microhabitat of Rhododendron species
growing in tropical vs. temperate habitats may have caused the observed difference in
leaf thickness. Many tropical Rhododendron species at low and middle elevation are
epiphytes (Argent 2015), but there are no epiphytic temperate Rhododendron. Epiphytes
often have relatively thick leaves (for example; orchids) in response to the frequent
drought experienced by epiphytes. Therefore, leaf succulence may be an important
functional trait for tropical epiphytic Rhododendron while not for temperate
Rhododendron species.
Stomatal density tended to be lower (but not significantly) for sampled tropical
plant leaves than that for the sampled temperate leaves as hypothesized by Roth (2012).
Also, the stomatal pore length was significantly larger in tropical plant leaves than
temperate leaves (Roth 2012). There is a well-documented negative relationship between
stomatal density and stomatal pore length (Hetherington and Woodward 2003).

95
Therefore, the results reflect this negative relationship. Stomatal density of the sampled
Rhododendron species was in the middle of the domain defined by (Hetherington and
Woodward 2003). In fact, the range of stomatal densities for the selected species is a very
common range (100 - 400 mm-2). However, stomatal pore sizes were relatively small
compared to the range presented in (Hetherington and Woodward 2003) and that for
Arabidopsis for example (Dow et al. 2014).
Leaf potential transpiration is highly related to stomatal pore index (SPI), which is
a composite index of stomatal density and pore size (Sack et al. 2003). The general
inverse relationship between size and density can result in no difference in stomatal pore
index because an increase in density will be associated with a decrease in stomatal pore
size. However, the tropical leaves sampled in this study had a significantly higher SPI
than the temperate sample, primarily due to larger stomatal pores, suggesting a
hygromorphic nature. The comparison of stomatal traits between habitats may have been
biased by more high-elevation species in the temperate species selection than the tropical
species selected. However, elevation did not have a significant effect on stomatal traits.
In fact, stomatal density increased with elevation for temperate species and decreased
with elevation for tropical species, which resulted in a significant interaction between
habitat and elevation. Moreover, the proportion of species at high elevation in the tropical
selection was similar to that in the temperate selection. Therefore, a different distribution
of native elevation range between the tropical and temperate samples in this study was
not a cause of the habitat effect on SPI.
The presence of cells between the adaxial epidermis and the palisades deserve
some comment. A hypodermis is considered a layer of dermal shaped cells below the

96
epidermis. Several species in this temperate sample contained either a single or multi-
layer hypodermis. The hypodermis is thought to function for screening ultraviolet
radiation from the palisades cells where much of the leaf photosynthesis occurs.
Therefore, the presence of a hypodermis would be anticipated for species residing in high
light environments at high elevation. Even though the hypodermis was absent in all
tropical plants covered in this research, idioblasts were found, which may have a similar
functional significance. Idioblasts were scattered below the epidermis in all the tropical
species and were much larger than cells of the hypodermis in temperate species. The fact
that the adaxial idioblasts of tropical Rhododendron leaves do not usually occur in a
complete sheet below the epidermis suggests that they do not necessarily serve as an ultra
violet radiation screening mechanism because lots of gaps in the screen would occur. The
large size of the idioblast cells suggests that they may be associated with water storage or
water management in the tropical species. If so this would not be in agreement with Roth
(2012) because hygromorphic leaves are theorized not to contain any water storage cells.
Thus, based on all observations of leaf anatomical traits, tropical Rhododendron species
did not consistently have more hygromorphic traits than the temperate species sampled in
this study thereby rejecting the first hypothesis. Therefore, the tropical leaves tended to
be more xeromorphic than temperate leaves.
3.43 Addressing hypothesis two—The second hypothesis suggested that
Rhododendron leaves trend toward xeromorphy as the native elevation range increases.
Xeromorphic leaf traits would include small leaves, succulence, a hypodermis, dense
mesophyll, low stomatal pore index, and stomatal crypts (Esau 1960, Roth 2012). Leaf
area decreased as the native elevation range increased although leaf form remained

97
unchanged. Leaf thickness was not affected by elevation, but mesophyll percentage and
Ames/A ratio tended to increase with elevation (not significant). In addition, the stomatal
pore index was lowest for species with the highest native range elevation. The stomatal
pore index tended to decrease from low and medium to high elevation, but the different
was not significant. The likelihood of higher elevation Rhododendron leaves to have
trichomes was inconclusive, because almost all species included in this study had
trichomes regardless of the elevation. Idioblast cells are thought to function in herbivore
defense, calcium regulation, or water storage. The idioblast density tended to decrease
from low to high elevation tropical Rhododendron species, but the difference was not
significant. As a result of the data, leaves of Rhododendron species show some signs of
increasing xeromorphy as the native range elevation increases, but that trend is weak in
the sampled species. The influence of elevation on plant traits is usually weak in a multi-
species survey because there are many factors that determine the change in climatic traits
with elevation and because different mountain ranges may have different patterns of
climate change (Körner 2007).
3.44 Addressing hypothesis three—Vascular hydraulic conductivity is coordinated
with transpiration in plants (Meinzer et al. 2010). If vascular conductivity is high, more
transpiration is allowed. Consequently, a positive correlation between vascular
conductivity and transpiration is expected. To address hypothesis three, we looked for a
correlation between theoretical specific conductivity data attained in chapter two and
stomatal pore index data attained in chapter three. Stomatal pore index (SPI) was
positively correlated with stem theoretical specific conductivity (Kstheo) when all data
were included in the analysis. However, there was a lot of scatter in the data and the

98
regression had a low R2 that was significant only at the 0.1 p-value. Moreover, when the
data were separated into temperate and tropical species the correlation was not
significant. Perhaps the range of values for theoretical specific conductivity and stomatal
pore index were too limited within this single functional group to attain a strong
correlation. In fact, the values of both theoretical specific conductivity and stomatal pore
index are small relative to other studies on various plants (Hajek et al. 2016, Sack et al.
2005). Because both stomatal pore index and theoretical specific conductivity are small
relative to other angiosperm, water flow in Rhododendron plants will be low as found
previously (Lipp and Nilsen 1997). Plants with low hydraulic conductance also have low
productivity (Reich 2014), which reduces potential plant growth rate. Consequently,
evergreen Rhododendron shrubs in general will not be very competitive in environments
where fast growth rate is required for successful colonization of a site (Reich 2014).
3.45 Summary and conclusion—There was wide variation in leaf anatomical traits
among species of Rhododendron. Also, there was weak support for fundamental trade off
suggested by the LES. However, the hypotheses were not well supported because tropical
leaves were not strongly differentiated as hygromorphic, and high elevation leaves were
not significantly more xeromorphic than low elevation leaves. Variation in plant response
to microhabitat (e.g. epiphytic) may have made the expected results for comparison
between habitats or along the elevation gradient weak. Overall, leaf anatomical traits of
evergreen Rhododendron shrubs agree with a slow growth rate and low competitive
strength in high resource environments.

99
3.5 Literature cited
Argent, G. 2015. Rhododendrons of subgenus Vireya. Royal Horticultural Society in
association with the Royal Botanic Garden.
Brodribb, T., and R. S. Hill. 1997. Imbricacy and stomatal wax plugs reduce maximum
leaf conductance in Southern Hemisphere conifers. Australian Journal of Botany
45:657-668.
Brodribb, T. J., and T. S. Feild. 2010. Leaf hydraulic evolution led a surge in leaf
photosynthetic capacity during early angiosperm diversification. Ecology Letters
13:175-183.
Chapin, F. S. 1980. The Mineral Nutrition of Wild Plants. Annual Review of Ecology
and Systematics 11:233-260.
Cox, P. A. 1990. The larger Rhododendron species. London: BT Batsford 389p.-illus.,
col. illus., maps.. ISBN 713466359.
Dow, G.J., Bergmann D. C. 2014. Patterning and processes: How stomatal development
defines physiological processes. Current Opinion in Plant Biology 21:67-74
Esau, K. 1960. Anatomy of seed plants. Wiley, New York.
Ewert, F. 2004. Modelling plant responses to elevated CO2: how important is leaf area
index? Annals of botany 93:619-627.
Feng, G. 1992. Rhododendrons of China. Science Press.
Hetherington, A. M., and F. I. Woodward. 2003. The role of stomata in sensing and
driving environmental change. Nature 424:901-908.
Hilu, K. W., and J. L. Randall. 1984. Convenient Method for Studying Grass Leaf
Epidermis. Taxon 33:413-415.

100
Körner, C. 2007. The use of ‘altitude’ in ecological research. Trends in Ecology &
Evolution 22:569-574.
Kron, K. A., and W. S. Judd. 1990. Phylogenetic-relationships within the Rhodoreae
(Ericaceae) with specific comments on the placement of Ledum. Systematic
Botany 15:57-68.
Meinzer, F. C., K. A. McCulloh, B. Lachenbruch, D. R. Woodruff, and D. M. Johnson.
2010. The blind men and the elephant: the impact of context and scale in
evaluating conflicts between plant hydraulic safety and efficiency. Oecologia
164:287-296.
Milne, R. I. 2004. Phylogeny and biogeography of Rhododendron subsection Pontica, a
group with a tertiary relict distribution. Molecular Phylogenetics and Evolution
33:389-401.
Nilsen, E. T., M. R. Sharifi, and P. W. Rundel. 1987. Leaf dynamics in an evergreen and
a deciduous species with even-aged leaf cohorts, from different environments.
American Midland Naturalist 118:46-55.
Nilsen, E. T., D. W. Webb, and Z. Bao. 2014. The function of foliar scales in water
conservation: an evaluation using tropical-mountain, evergreen shrubs of the
species Rhododendron in section Schistanthe (Ericaceae). Australian Journal of
Botany 62:403-416.
Parlange, J. Y., and P. E. Waggoner. 1970. Stomatal dimensions and resistance to
diffusion Plant Physiology (Rockville) 46:337-342.

101
Price, C. A., I. J. Wright, D. D. Ackerly, Ü. Niinemets, P. B. Reich, and E. J. Veneklaas.
2014. Are leaf functional traits ‘invariant’with plant size and what is
‘invariance’anyway? Functional Ecology 28:1330-1343.
Reich, P. B. 2014. The world-wide 'fast-slow' plant economics spectrum: a traits
manifesto. Journal of Ecology 102:275-301.
Roth, I. 2012. Stratification of tropical forests as seen in leaf structure. Springer Science
& Business Media.
Sack, L., P. Cowan, N. Jaikumar, and N. Holbrook. 2003. The ‘hydrology’of leaves: co‐
ordination of structure and function in temperate woody species. Plant, Cell &
Environment 26:1343-1356.
Sack, L., C. Scoffoni, G. P. John, H. Poorter, C. M. Mason, R. Mendez-Alonzo, and L. A.
Donovan. 2013. How do leaf veins influence the worldwide leaf economic
spectrum? Review and synthesis. Journal of Experimental Botany 64:4053-4080.
Selby, S. 1972. Standard Mathematical Tables. Twentieth edition. CRC Press, Cleveland,
Ohio.
Tyree, M. T. 2003. Hydraulic limits on tree performance: transpiration, carbon gain and
growth of trees. Trees-Structure and Function 17:95-100.

102
3.6 Tables
Table 3.1 A list of the Rhododendron species used in this research including the native
habitat (tropical and temperate) and mean elevation.
Species Habitat Average Elevation (m) R. anthopogon Temperate 3,127
R. arboreum Temperate 2,550
R. augustinii Temperate 2,350
R. calostrotum spp. calostrotum Temperate 3,962
R. camplyogonum Temperate 3,508
R. camtschaticum Temperate 1,600
R. catawbiense Temperate 1,592
R. cinnabarinum Temperate 3,127
R. dalhousiae var. rhabdolium Temperate 2,364
R. dauricum Temperate N/A
R. edgeworthii Temperate 2,898
R. fastgiatum Temperate 4,038
R. ferrugineum Temperate 1,900
R. forrestii Temperate 3,737
R. galactinum Temperate 3,150
R. hippophaeoides Temperate 3,335
R. huanum (huianum) Temperate 2,034
R. hyperythrum Temperate 1,060
R. Keiskei Temperate 1,220
R. keysii Temperate 3,050
R. lepidostylum Temperate 3,355
R. lindleyi Temperate 2,745
R. macrophilum Temperate 600
R. maximum Temperate 915
R. megeratum Temperate 3,830

103
R. minus Temperate 1,700
R. minus var. chapmanii Temperate 150
R. orbiculare Temperate 3,150
R. ponticum Temperate 900
R. pronum Temperate 4,130
R. proteoides Temperate 4,118
R. psuedochrysanthum Temperate 2,898
R. racemosum Temperate 3,050
R. ririei Temperate 1,700
R. rubiginosum Temperate 3,355
R. sherriffii Temperate 3,661
R. strigilossum Temperate 2,828
R. tephropoplum Temperate 3,370
R. trichostomum Temperate 3,400
R. williamsianum Temperate 2,800
R. wolongense Temperate 1,830
R. aurigeranum Tropical 1,328
R. blackii Tropical 2,900
R. bryophilum Tropical 1,448
R. burtii Tropical 1,550
R. celebicum Tropical 1,900
R. correoides Tropical 3,700
R. crassifolium Tropical 2,135
R. densifolium Tropical 1,700
R. goodenoughii Tropical 1,150
R. gracilentum Tropical 2,493
R. herzogii Tropical 2,015
R. himantodes Tropical 1,650
R. jasminiflorum Tropical 1,300
R. javanicum Tropical 1,508
R. kawakamii Tropical 1,900

104
R. kochii Tropical 1,200
R. konori Tropical 1,625
R. laetum Tropical 1,968
R. lochiae Tropical 1,360
R. longiflorum Tropical 750
R. loranthiflorum Tropical 840
R. macgregoriae Tropical 2,025
R. majus Tropical 2,885
R. malayanum Tropical 1,015
R. multicolor Tropical 1,500
R. orbiculatum Tropical 1,300
R. polyanthemum Tropical 1,800
R. praetervisum Tropical 1,450
R. quadraseanum Tropical 1,715
R. radians Tropical 1,600
R. rarilepidotum Tropical 2,235
R. rarum Tropical 2,467
R. robinsonii Tropical 1,432
R. rugosum Tropical 2,750
R. rushforthii Tropical 1,650
R. sororium Tropical 1,550
R. stenophyllum Tropical 1,950
R. suaveolens Tropical 1,500
R. superbum Tropical 2,287
R. taxifolium Tropical 2,650
R. tuba Tropical 2,520
R. vaccinioides Tropical 2,250
R. verticillatum Tropical 1,100
R. yongii Tropical 2,490
R. zoelleri Tropical 675

105
Table 3.2 Two-way ANOVA table for the effects of habitat, elevation rank, and their
interaction on leaf morphology traits of Rhododendron species. Habitat = temperate and
tropical. Elevation = low (0 - 1,200 m), medium (1,201 - 2,400 m), and high (2,401 -
4,200 m). Area = mean leaf area (cm2); Leaf L/W ratio = mean leaf length per leaf width;
Leaf thickness = mean leaf thickness (mm2); % mesophyll = proportion of mesophyll
layer thickness per leaf thickness; Ames/A = mean area of the mesophyll per leaf area.
Leaf Morphology-Anatomy DF SS F Sig.
Leaf Area
Habitat 1 <0.00 <0.00 0.99
Elevation Rank 2 2128.09 5.41 0.006**
Habitat x Elevation 2 462.57 1.18 0.31
Leaf L/W Ratio Habitat 1 1.56 0.24 0.63
Elevation Rank 2 2.11 0.16 0.85
Habitat x Elevation 2 9.13 0.70 0.50
Leaf Thickness Habitat 1 0.21 14.47 0.0003***
Elevation Rank 2 0.01 0.45 0.64
Habitat x Elevation 2 0.03 0.88 0.42
% Mesophyll Habitat 1 15.09 0.13 0.72
Elevation Rank 2 220.76 0.97 0.38
Habitat x Elevation 2 585.70 2.57 0.0841*

106
Ames/A
Habitat 1 23.88 3.47 0.0671*
Elevation Rank 2 5.59 0.41 0.67
Habitat x Elevation 2 35.35 2.57 0.0846*

107
Table 3.3 Two-way ANOVA table for the effects of habitat, elevation rank, and their
interaction on stomatal of Rhododendron species. Habitat = temperate or tropical.
Elevation = low (0 - 1,200 m), medium (1,201 - 2,400 m), and high (2,401 - 4,200 m).
SD = stomatal density (mm-2), SPL = stomatal pore length (µm), SPI = stomatal pore
index
Stomata Traits DF SS F Sig.
SD
Habitat 1 8895.27 0.75 0.39
Elevation Rank 2 12334.67 0.52 0.60
Habitat x Elevation 2 92263.36 3.87 0.0254**
SPL Habitat 1 > 0.00 6.39 0.0138**
Elevation Rank 2 > 0.00 1.44 0.24
Habitat x Elevation 2 > 0.00 0.58 0.56
SPI Habitat 1 0.01 5.99 0.0172**
Elevation Rank 2 0.00 0.27 0.76
Habitat x Elevation 2 > 0.00 0.14 0.87
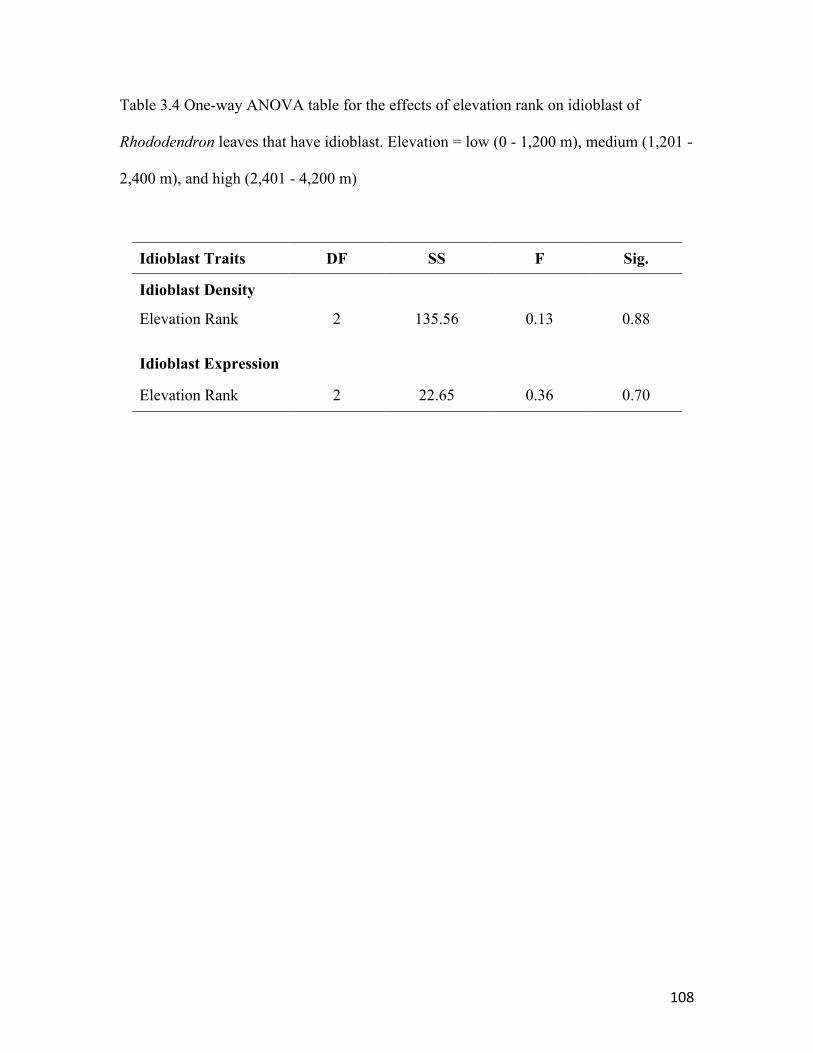
108
Table 3.4 One-way ANOVA table for the effects of elevation rank on idioblast of
Rhododendron leaves that have idioblast. Elevation = low (0 - 1,200 m), medium (1,201 -
2,400 m), and high (2,401 - 4,200 m)
Idioblast Traits DF SS F Sig.
Idioblast Density
Elevation Rank 2 135.56 0.13 0.88
Idioblast Expression Elevation Rank 2 22.65 0.36 0.70
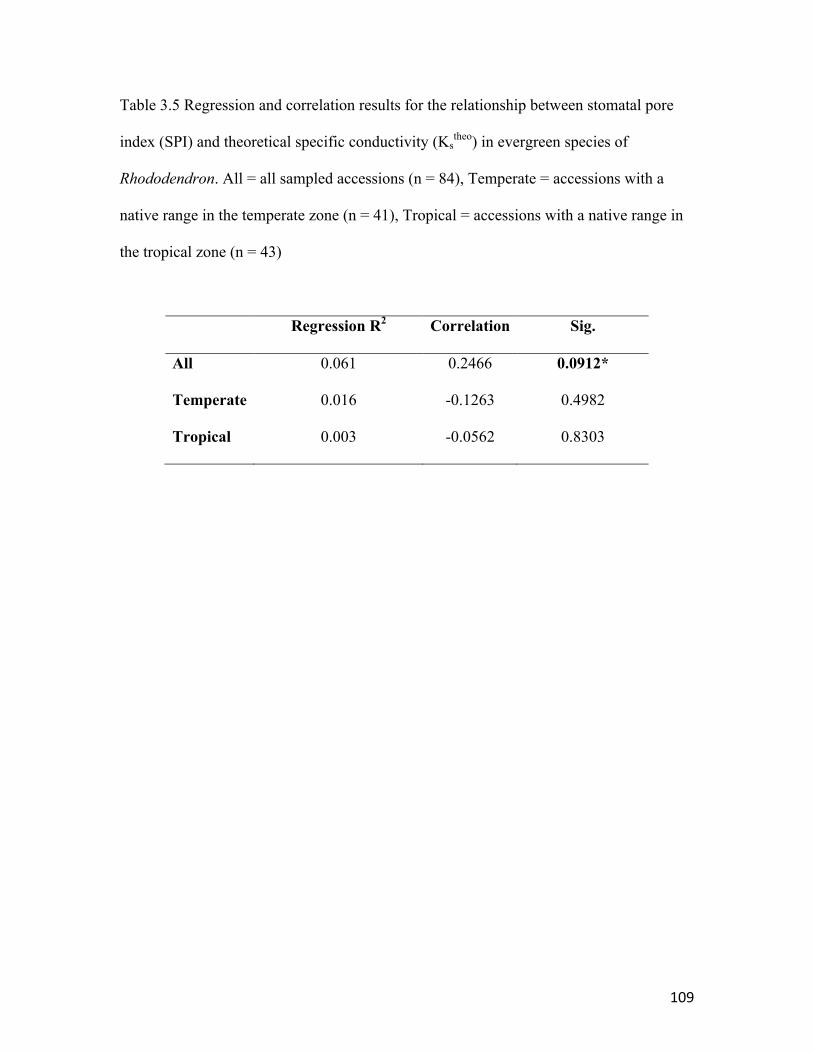
109
Table 3.5 Regression and correlation results for the relationship between stomatal pore
index (SPI) and theoretical specific conductivity (Kstheo) in evergreen species of
Rhododendron. All = all sampled accessions (n = 84), Temperate = accessions with a
native range in the temperate zone (n = 41), Tropical = accessions with a native range in
the tropical zone (n = 43)
Regression R2 Correlation Sig.
All 0.061 0.2466 0.0912*
Temperate 0.016 -0.1263 0.4982
Tropical 0.003 -0.0562 0.8303

110
3.7 Figure legends
Figure 3.1. Representative samples of Rhododendron leaves used in this research: (A);
images A, B, C, D, E are leaf cross sections captured through a 10 x lens, F - cross
section captured through a 4 x lens; (B) Images of abaxial surfaces captured through a
dissecting microscope A- peltate scales, B- cuneate scales, C- cushion scales, D- no
trichomes, E- hairs, F-Multi-branched hairs; (C) Images of abaxial leaf stomata captured
at 40 x, A-stomata among papillae, B- randomly arranged stomata.
Figure 3.2. Box plots of leaf morphological traits for Rhododendron accessions used in
this research. Each plot has a box plot for the whole data set, for the two habitats
(temperate and tropical), and for three elevation ranges (low = 0 - 1,200 m, medium =
1,201 - 2,400 m, high = 2,401 - 4,200 m): (A) Leaf Area (cm2), (B) Leaf length / leaf
width (L/W ratio), (C) Leaf thickness (mm), (D) % of the leaf thickness occupied by
spongy mesophyll.
Figure 3.3. Box plots of leaf abaxial stomatal traits for Rhododendron accessions used in
this research. Each plot has a box plot for the whole data set, for the two habitats
(temperate and tropical), and for three elevation ranges (low = 0 - 1,200 m, medium =
1,201 - 2,400 m, high = 2,401 - 4,200 m): (A) Stomatal density (mm-2), (B) Stomatal pore
length (µm), (C) Stomatal pore index (SPI = density (length2).
Figure 3.4. Box plots of leaf idioblast traits for accessions of Rhododendron used in this
research that had idioblasts present. Each plot has a box plot for the whole data set and

111
for three elevation ranges (low = 0 - 1,200 m, medium = 1,201 - 2,400 m, high = 2,401 -
4,200 m): (A) idioblast density (ID = # idioblasts / length of the section), (B) idioblast
expression (IE= ((Σ IA) / total section area) where IA = idioblast area.
Figure 3.5. The percentage of the sampled species with each trichome type for; (A) all the
species used in this study, (B) separated by habitat type or (C) separated by elevation
rank. Trichome types are; 1= no trichomes, 2 = Peltate scale, 3 = Cushion scale, 4 =
Cuneate scale, 5 = Stellate scale, 6 = Dendroid scale, 7 = Hair, 8 = multi-branched hair.
Elevation ranks = (low = 0 - 1,200 m, medium = 1,201 - 2,400 m, high = 2,401 - 4,200
m).
Figure 3.6. Linear regression between stomatal pore index (dependent variable) and
theoretical water transport per area of stems (dependent variable) SPI = stomatal pore
index = stomatal density (stomatal pore lenght2); Theoretical specific conductivity of
stem = Σ D4 / A, where D = vessel diameter and A = vascular area. Red line represent
regression with R2 = 0.061, and p-value = 0.0912

112
3.8 Figures
Figure 3.1 A

113
Figure 3.1 B

114
Figure 3.1 C
Figure 3.1. Representative cross sections of Rhododendron leaves

115
Figure 3.2 A
Figure 3.2 B

116
Figure 3.2 C
Figure 3.2 D

117
Figure 3.2 E
Figure 3.2. Box plots of leaf morphological traits

118
Figure 3.3 A
Figure 3.3 B

119
Figure 3.3 C
Figure 3.3. Box plots of leaf abaxial stomatal traits

120
Figure 3.4 A
Figure 3.4 B
Figure 3.4. Box plots of leaf idioblast traits

121
Figure 3.5 A
Figure 3.5 B

122
Figure 3.5 C
Figure 3.5 Distributions of trichome types
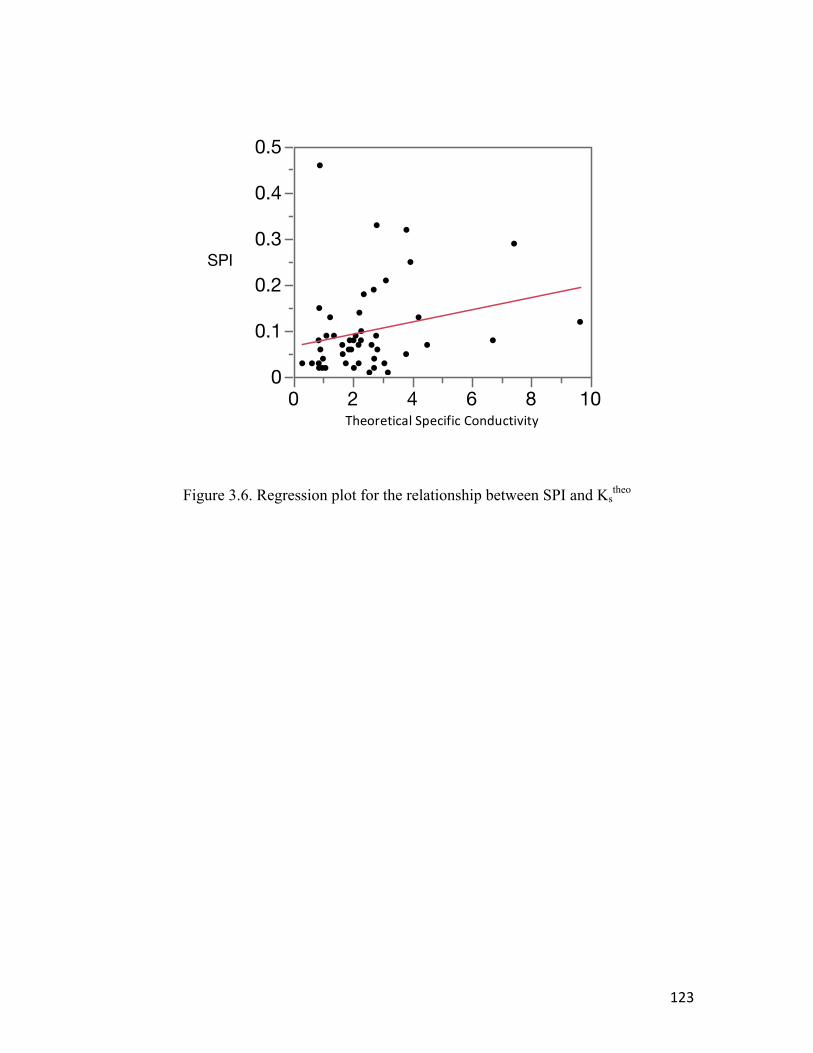
123
Figure 3.6. Regression plot for the relationship between SPI and Kstheo
0
0.1
0.2
0.3
0.4
0.5
SPI
0 2 4 6 8 10Theoretical hydraulic conductanceTheoreticalSpecificConductivity

124
CHAPTER 4
The significance of idioblasts to bulk leaf water relations in tropical accessions of
Rhododendron
4.1 Introduction
Idioblasts are individual cells that are distinctly different in form (usually much
larger) than the surrounding cells of a tissue (Esau 1960). In general, idioblasts can be
found in all plant tissues and are structurally diverse. Some idioblasts are sclereids, others
are secretion cells and others are large storage cells with little or no cytoplasm (Esau
1960). Many idioblasts contain substances such as oils, tannins, mucilage, or calcium
oxalate crystals. These differences in structure and content of idioblasts among species
have been used for taxonomic purposes (Lersten and Curtis 1995). Foliar idioblasts are
found in many plant families including the Alsteromeriaceae (Lyshede 2002),
Brassicaceae (Andreasson et al. 2001), Ericaceae (Nilsen and Scheckler 2003),
Lamiaceae (Lersten and Curtis 1998), Papilionaceae (Sartori and Tozzi 2002),
Polygonaceae (Lersten and Curtis 1992), Scrophulariaceae (Lersten and Curtis 2001)
Sterculiaceae (Lersten and Curtis 1997b) and Solanaceae (Leite et al. 1999) to name a
few. Thus, idioblasts are diverse, widely distributed among plant taxa and significant for
taxonomic purposes. However, the relationship between idioblast cells and leaf
physiological properties remains largely unexplored (Körner et al. 1983, Nilsen and
Scheckler 2003).
The predominant hypotheses for the functional significance of idioblasts are;
secretion (Feio dos Santos et al. 2013), storage of cellular waste products or crystals
125
(Franceschi and Nakata 2005), or defense against herbivores (Leite et al. 1999,
Andreasson et al. 2001, Thangstad et al. 2004). Yet, a large quantity of idioblast cells in a
leaf could have several simultaneous different effects on leaf physiology. For example, a
large proportion of leaf water contained in idioblasts could affect bulk leaf osmotic
potential, capacitance and hydraulic conductance. Also, sub-epidermal idioblasts that
extend into the palisade cell layer could significantly alter the dynamics of light
penetration into leaves and thereby influence leaf absorptivity of light and photosynthetic
response to light (Karabourniotis 1998, Nilsen and Scheckler 2003). Moreover, if
idioblasts increase the ratio of water to air in a leaf then the thermal dynamics of the leaf
will change perhaps buffering the rate by which leaf temperature changes during and
after a sun exposure. In order to understand the broad significances of idioblasts to leaf
physiology, the relationships between idioblast abundance, lamina anatomy, morphology,
and water relations should be understood.
Foliar idioblasts in Rhododendron subgenus Vireya are excellent models for
studying the relationship between idioblast abundance and leaf water relations. All
previously surveyed species of Rhododendron in subgenus Vireya possess idioblasts
(Chapter 3; R. saxifragoides is an exception), but idioblasts have not been found in other
subgenera of Rhododendron (Körner et al. 1983, Nilsen and Scheckler 2003, Argent
2006). Species in subgenus Vireya are found in Malesia, which is a tropical environment.
Malesia is the region between Malaysia and Papua New Guinea. Idioblasts on the adaxial
side of leaves are the most abundant, but abaxial idioblasts can be found clustered around
the base of scales (Nilsen and Scheckler 2003). The abundance, size and expression (total
leaf volume occupied by idioblasts) may vary greatly among species of subgenus Vireya

126
(Nilsen 2003). However, no crystalline structures have been found in idioblasts of Vireya
species, which rules out the potential function as calcium oxalate crystal storage. Adaxial
idioblasts in subgenus Vireya leaves contain primarily water, but can contain oil droplets,
mucilage, and compounds containing phenol groups (positive Safranin O response). The
large water content of these cells suggests that idioblasts may have an impact on bulk leaf
lamina water relations of species in subgenus Vireya, which are tropical species.
The overall goal of this study was to survey idioblast expression (proportion of
leaf lamina occupied by idioblasts) among accessions of Rhododendron species in
subgenus Vireya and utilize a gradient in idioblast expression among accessions to
evaluate the relationships between idioblast expression, leaf morphology, leaf anatomy,
and bulk leaf water relations traits. The following specific hypotheses were addressed in
this study.
1) There are significant differences in idioblast expression among accessions of
subgenus Vireya. Significant differences in idioblast expression among accessions need
to be demonstrated before hypotheses about functional significance can be posed.
2) Idioblast expression increases in accordance with an increase in leaf succulence
among plants. Idioblast expression is a main factor defining leaf succulence because of
the large cells and their water content. We suggest that the greater the proportion of large
water filled cells in the leaf lamina the larger the amount of water in the lamina (leaf
succulence) on an area basis.
3) Stomatal pore index (SPI), a proxy for maximum stomatal conductance,
increases in accordance with an increase in idioblast expression among plants. This third
hypothesis is based on the idea that the larger the volume of total idioblasts in leaf the
127
larger will be the water resource for the leaf. Also, if there is a large water resource in the
leaf, leaf conductance can be higher allowing for a higher stomatal pore index.
4) Leaf capacitance, before the turgor loss point (pre-TLP), increases in
accordance with an increase in leaf idioblast expression among plants. This fourth
hypothesis is based on the concept that a large volume of total idioblast cells will allow
leaf to lose a large amount of water with only a moderate change in bulk leaf water
potential.
This study provides important information about the relationships between leaf
idioblast expression, leaf anatomical traits, leaf morphological traits, and leaf water
relations components. This research documents significant differences in idioblast
expression among species and shows that idioblasts increase leaf succulence and leaf
capacitance for relatively thin leaves.
4.2 Materials and methods
4.21 Plant growth conditions—In order to determine the relationship between
idioblast expression and leaf water relations, 61 plants representing 17 species from
subgenus Vireya were grown on a greenhouse bench in the Biological Sciences-VBI
Plant Growth Facility (VT-PGF), Virginia Tech. The accessions were obtained from the
Rhododendron Species Foundation and Botanical Garden, Federal Way, WA. The growth
medium used in the greenhouse experiment was a mixture of coconut chunks (70%) and
pearlite (30%). Plants were watered daily and fertilized every two to three weeks with a
balanced liquid fertilizer (Miracle-gro; water soluble azalea, camellia, Rhododendron
plant food; 30% N: 10% P: 10% K). Only leaves produced in the Biological Sciences-

128
VBI Plant Growth Facility (VT-PGF) were used in the greenhouse experiment. Air
temperature in the greenhouse ranged from 22 – 32 °C across the year and relative
humidity ranged from 65% to 100% on a daily basis.
4.22 Leaf collection — Six to eight fully mature leaves were collected from the
four major compass directions from outer canopy locations of each plant. The leaves
were sealed in zip-lock plastic bags and transported to the lab for morphological and
anatomical analyses. Each set of leaves was placed abaxial side down on a scanner next
to a ruled paper (cm) for scale. The scans at 600 dpi were stored in JPEG format for later
analysis of leaf morphology. Leaf length, width and area were determined with ImageJ
(National Institutes of Health (NIH), Bethesda, MD). Leaf length divided by leaf width
was used as an index of leaf lamina shape (high value = linear, low value = ovoid).
4.23 Leaf anatomy—The abaxial surface of three randomly selected recently
mature leaves from the outer canopy was painted (between two main lateral veins) with
clear nail polish (model 504; Clairol Inc., Stamford, CT). When the polish was dry and
hardened, a narrow piece of clear adhesive tape (Scotch brand package sealing tape) was
placed over the nail polish, pressed down firmly, carefully lifted to remove the dried
sheet of nail polish (the peel), placed (with the peel facing upward) on a microscope slide
and covered with a cover-slip. Five randomly located images (25 x objective lens) of the
epidermal peels were captured with a digital camera (Olympus DP-10; Olympus Optical
Co. Ltd., Tokyo, Japan) mounted on a bright field microscope (Olympus BX50; Olympus
Optical Co. Ltd., Tokyo Japan). All stomata were counted in the field of view of each
image to determine stomatal density. Five additional images (40 x objective lens) were
captured from the same epidermal peel for stomatal size. The length of every stomatal

129
pore and the total number of pores in the field of view were determined using ImageJ
software. The stomata pore index (SPI) was calculated for each image as: D (L2). Where
D = stomata density, and L = mean stomatal pore length (Parlange and Waggoner 1970).
Following the removal of nail polish, five sections (each 3 mm in width) from the
mid-vein to the margin were excised from each leaf (avoiding the nail polish affected
area) and preserved in FAA (50% ethanol, 35% water, 10% formalin, 5% glacial acetic
acid). Following complete preservation (approximately 1 week), sections were
sequentially hydrated to remove the FAA, dehydrated in an alcohol gradient (5 steps at
30 minutes each), saturated with xylene (two 1 hr soaks), impregnated with paraffin oil (1
step with 50% paraffin oil and xylene for 1 hr plus 2 steps of 1 hr each of pure paraffin
oil), and equilibrated in hot paraffin (3 steps of 8 hr each). The leaf pieces were trimmed
and mounted in paraffin for laminal cross sections (8 µm) made with a rotary microtome
(model HN 340E; Microm International GmbH, Walldorf, Germany). One ribbon (8-10
cross sections) was mounted from one of the leaf pieces from each leaf. The resulting
tissue sections were double stained with safranin O and fast green before permanent
mounting with Permounttm. Digital images were taken (10 x objective lens) from the best
section on each slide (Figure 4.1). The length and width was measured for each idioblast
in each image. The density of idioblasts per leaf length (mm) was calculated. Also, the
area of each idioblast was calculated by using the geometric formula for the area of an
ellipse (IA = pab), where a = length and b = width (Selby 1972). The IAs were summed
and divided by the total area of the section to attain an index of idioblast expression (IE=
((Σ IA) / total section area) x 100). In addition, average leaf thickness and % of leaf area
occupied by spongy mesophyll were recorded for each image.

130
4.24 Moisture release curves—Three recently mature leaves were excised from
each plant in the greenhouse experiment in early morning (before 7:00AM) and placed in
a saturation chamber to become fully saturated with water. Following saturation the
relationship between water deficit and equilibrium pressure (model 1000, PMS Inc,
Corvalis, OR) was determined using a dehydration technique (Sperry and Sullivan 1992,
Sperry and Saliendra 1994). A graphical technique was used to determine osmotic
potential (OP) relationships, water deficit at TLP, and leaf capacitance pre- and post-
TLP. Bulk leaf capacitance (Cbulk) was expressed in absolute terms and normalized by
leaf anatomy (Mol m-2 MPa-1) as done previously (Brodribb and Holbrook 2003,
Blackman and Brodribb 2011). Succulence of every leaf was determined as the total
grams of water per leaf area (g cm-2) in the fully saturated leaf ((weight at full saturation
– dry weight) / leaf area).
4.25 Data analysis and statistics—Plant (n = 61) was the experimental unit for
leaf anatomical and water relations traits in the greenhouse study. The effect of species (n
= 3 to 6 plants species-1) on anatomical or water relations traits were determined by one-
way analysis of variance (ANOVA). Spearman correlations were made between all trait
variables for plants. The relationships between anatomical traits and water relations traits
for plants were determined by regression analysis. The best model to describe leaf
idioblast expression in plants based on leaf anatomical traits was selected by stepwise
analysis (forward, backward or mixed). A similar procedure was used to find the best
model that described the pre- and post-turgor loss capacitance. All statistical analyses
were performed using JMP Pro 12 (SAS Institute Inc., Cary, NC).

131
4.3 Results
4.31 Leaf anatomy—There was a highly significant effect of species on all
measured anatomical and morphological traits (Table 4.1). All stomatal traits were
significantly different among species. Leaf area ranged from 56.4 cm2 ± 4.14 for R.
zoelleri to 8.4 cm2 ± 0.73 for R. bryophyllum. Leaf shape (leaf L/W ratio) was most linear
for R. bryophyllum (3.1 ± 0.18) and most round for R. orbiculatum (1.3 ± 0.21). The
thickest leaves were those of R. yongii (0.828 mm ± 0.071) and the thinnest leaves were
those of R. celebicum (0.344 mm ± 0.053). The least succulent leaves were those of R.
multicolor (0.023 g cm-2 ± 0.002) while those of R. yongii had the highest succulence
(0.057 g cm-2 ± 0.001). R. crassifolium had the highest percent of leaf thickness taken up
by spongy mesophyll (68.3 % ± 2.77) while that of R. multicolor was the lowest (44.6 %
± 3.78). Idioblast density was the highest for R. celebicum (66.0 mm-2 ± 20.87) and
lowest for R. yongii (23.4 mm-2 ± 2.53). R. bryophyllum had the largest average idioblast
size (3.33 µm2 ± 0.306) while that of R. kochii were the smallest (1.01 µm2 ±0.039).
Idioblast expression was highest for R. bryophyllum (19.3 % ± 1.20) and lowest for R.
kochii (4.7% ± 0.96). Stomatal density ranged from 470 mm-2 ± 43.7 for R. rarilepidotum
to 171 mm-2 ± 45.8 for R. celebicum. Stomatal pore length was largest for R. orbiculatum
(0.039 mm ± 0.001) and smallest for R. kochii (0.014 mm ± 0.001). Stomatal pore index
(SPI) was the highest in R. orbiculatum (0.334 ± 0.171) and the lowest in R. javanicum
and R. crassifolium (0.076 ± 0.009).
4.32 Water relations—There was a significant species effect on all water relation
traits except the osmotic potential at full turgor minus the osmotic potential at zero turgor
(Table 4.2). The effect of species on the OP at the TLP had the highest significance

132
among all the water relations traits. Bulk leaf capacitance pre TLP was always less than
bulk leaf capacitance post TLP. Bulk leaf capacitance pre TLP was highest for R.
crassifolium (2.17 Mol m-2 MPa-1 ± 0.68) and lowest for R. kochii (0.68 Mol m-2 MPa-1 ±
0.08). However, bulk leaf capacitance post TLP was highest for R. orbiculatum (5.92 Mol
m-2 MPa-1 ± 0.0129) and lowest for R. kochii (1.63 Mol m-2 MPa-1 ± 0.107). The water
deficit at the TLP ranged from 14.2 % ± 1.56 for R. bryophyllum to 6.44 % ± 1.19 for R.
goodenoughii. The OP at full turgor was lowest for R. robinsonii (-1.41 MPa ± 0.070)
and highest for R. bryophyllum (-0.83 MPa ± 0.12). Also, R. robinsonii had the lowest
OP at the TLP (-1.78 MPa ± 0.129), and the highest OP at the TLP was for R.
aurigeranum (-1.20 MPa ± 0.549). The largest difference between the OP at full turgor
and the OP at the TLP was for R. aurigeranum (0.51 MPa ± 0.066), while the smallest
value for this trait was 0.29 MPa ± 0.139 for R. crassifolium leaves.
4.33 Correlations—Spearman correlations were performed between all traits
resulting in an 18 by 18 matrix of correlation coefficients with many cases of
autocorrelation. In order to highlight the important relationships from this matrix and to
avoid showing autocorrelations, only the significant correlations for the focus traits of
this study are presented in Table 4.3. Idioblast density was significantly, positively
correlated with leaf L/W ratio which indicated that idioblast density increased as leaves
became thinner and longer. In addition, idioblast density was significantly negatively
correlated with leaf thickness, leaf succulence and % mesophyll. All three of these
anatomical traits were highly autocorrelated and represent an axis of leaf succulence.
Therefore, idioblast density decreased as leaf lamina became more succulent. Idioblast
expression was similarly correlated with anatomical traits as that of idioblast density.

133
Stomatal density on the abaxial lamina surface was significantly, negatively
correlated with both idioblast size and idioblast expression (Table 4.3). Therefore,
stomatal density decreased as idioblast expression increased. Also, stomatal density was
significantly, negatively correlated with leaf area and leaf length (leaf length was
autocorrelated with leaf area). Thus, stomatal density decreased as leaf area increased.
Unlike stomatal density, stomatal pore length and SPI were significantly, positively
correlated with leaf thickness and leaf succulence. Therefore, this result suggested that
SPI, a proxy for maximum leaf conductance, increased as leaf succulence increased and
that increase was primarily due to increasing stomatal pore length.
Bulk leaf capacitance pre-TLP was significantly, negatively correlated with leaf
area traits (area and length) and significantly, positively correlated with leaf L/W ratio
(Table 4.3). Thus, smaller leaves that are more linear in shape had higher bulk leaf
capacitance pre-TLP than larger more lanceolate leaves. Also, leaf capacitance pre-TLP
was significantly, positively correlated with all three traits of the leaf succulence axis
indicating that leaves with greater succulence had a larger bulk leaf capacitance pre-TLP.
In contrast, capacitance post-TLP was not significantly correlated with leaf area but was
significantly, negatively correlated with leaf L/W ratio. Therefore, bulk leaf capacitance
post-TLP was larger in lanceolate leaves in comparison with more linear leaf shapes. In
accordance with the results for bulk leaf capacitance pre-TLP, the bulk leaf capacitance
post-TLP was significantly, positively correlated with the three leaf succulence traits.
Thus, both bulk leaf capacitance pre- and post-TLP were larger in more succulent leaves.
Also, bulk leaf capacitance post-TLP was significantly, positively correlated with
idioblast expression and idioblast density (Table 4.3). This result indicates that leaves
134
with higher idioblast expression had a larger bulk leaf capacitance post-TLP. Moreover,
bulk leaf capacitance post-TLP was significantly, positively correlated with SPI. The
significance of this correlation was relatively weak compared with the other significant
correlations of anatomical traits with bulk leaf capacitance post-TLP.
The WD at TLP was significantly, negatively correlated with leaf area traits, but
significantly, positively correlated with leaf L/W ratio (Table 4.3). Therefore, the WD at
TLP was higher for smaller more linear leaves than for larger more lanceolate leaves. The
WD at TLP was significantly, positively correlated to idioblast expression and idioblast
density. Thus, leaves with higher idioblast expression also had a higher WD at the TLP.
In addition, the WD at TLP was significantly, positively correlated with both pre- and
post-TLP bulk leaf capacitance. Therefore, the WD at TLP increased in coordination with
an increase in bulk leaf capacitance.
The OP at 100% (full turgor) was significantly, positively correlated with leaf
area and length and was significantly, negatively correlated with leaf L/W ratio (Table
4.3). Therefore, OP at 100% became progressively more negative as leaves became larger
and more lanceolate. In addition, the OP at 100% was significantly, negatively correlated
with pre-TLP bulk leaf capacitance and significantly, positively correlated with post-TLP
bulk leaf capacitance.
The OP at TLP was significantly, positively correlated with leaf area and
significantly, negatively correlated with leaf L/W ratio. Thus, similarly to OP at full
turgor, the OP at TLP was higher in larger and more lanceolate leaves. There were no
significant correlations of either OP or leaf succulence traits. However, OP at TLP was

135
significantly, negatively correlated with capacitance post-TLP. Therefore, leaves with a
highly negative OP at TLP will tend to have low post-TLP capacitance.
4.34 Regressions—The regression of capacitance pre-TLP as dependent variable
against idioblast expression as independent variable was not significant (R2 = 0.01845, p
= 0.7836). If the data for plants with leaves thicker than 0.5 mm are culled from the data
set (n = 32 remaining), then there is a significant regression with a positive slope at the α
= 0.1 level (adjusted R2 =0.1002, p = 0.0723) between capacitance pre-TLP as dependent
variable and idioblast expression as independent variable (Figure 4.2 A). However, when
all plants are involved in the regression, there was a significant regression (adjusted R2 =
0.1531, p = 0.0024), with a negative slope, for capacitance post-TLP as dependent
variable against idioblast expression as independent variable (Figure 4.2 B). If the data
for plants with leaves thicker than 0.5 mm are culled from the data set, then there is still a
significant regression (adjusted R2 = 0.1712, p = 0.0167), with a negative slope, between
capacitance post-TLP as dependent variable and idioblast expression as independent
variable.
There was a significant positive regression (adjusted R2 = 0.1106, p = 0.0115)
between WD at TLP as independent variable against idioblast expression as dependent
variable (Figure 4.2 C).
4.35 Stepwise and regression models—The best model for leaf idioblast
expression using leaf lamina anatomical traits that was developed by stepwise analysis
(forward, lowest BIC) was defined by the leaf shape and leaf succulence traits: leaf L/W
ratio (p = < 0.0001), % mesophyll (p = < 0.0001). The resulting two variable model
defined over 54% of the variation in idioblast expression among plants (adjusted R2 =

136
0.5960, minimum BIC = 291.3). The best model for leaf idioblast expression based on
water relations traits (including stomatal traits) was a three variable model including WD
at TLP (p = 0.0010), capacitance post-TLP (p = < 0.0001) and OP 100% - OP at TLP (p
= 0.0141). The resulting model defined 48% of the variance in idioblast expression
among plants (adjusted R2 = 0.4930, minimum BIC = 274.8).
The best model (stepwise, forward) for stomatal pore index based on anatomical
traits was defined by only one variable, leaf thickness (p = 0.0035), which accounted for
55% of the variance in SPI (adjusted R2 = 0.1448, minimum BIC = -69.99). The best
model (stepwise, forward) for SPI based on water relations traits alone was also defined
by one variable, capacitance post-TLP (p = 0.0407). The resulting model defined 50% of
the variance in SPI among plants (adjusted R2 = 0.0627, minimum BIC = -59.19).
The best model (stepwise, forward) for capacitance pre-TLP using all anatomical
traits including stomatal traits was a three variable model including leaf succulence (p =
0.0002) leaf area (p = 0.0003) and leaf L/W ratio (p = 0.0450). The resulting model
defines 48% of the variance in pre-TLP capacitance (adjusted R2 = 0.4394, minimum
BIC = 63.67). The best model (stepwise, forward) for capacitance post-TLP using all
anatomical traits including stomatal traits was a one variable model using % mesophyll (p
= 0.0001), which defined 50% of the variation of post-TLP capacitance (adjusted R2 =
0.2555, minimum BIC = 203.39).
4.4 Discussion
4.41 General anatomical characteristics of the Rhododendron leaf—Leaf area of
tropical Rhododendron species in subgenus Vireya used in this study tended to be at the

137
smaller range of leaf sizes of Rhododendron species in a broad sense (Nilsen et al. 2014).
The mean leaf area and shape (leaf L/W ratio) of the species used in this study fell into
the range of that for other species in subgenus Vireya. There are a few (11 out of 323
species in total) species in subgenus Vireya (Argent 2015) with particularly narrow leaves
(L/W > 5). No species used in this study fell into the category of narrow leaves for
subgenus Vireya. Therefore, the accessions used represent species with lanceolate and
ovoid leaf form. Leaf thickness of this sampled taxa included the entire range of leaf
thickness variation (0.25 mm to 0.95 mm) for leaves in subgenus Vireya (personal
observation). The leaf lamina of Rhododendron species tends to be rigid even after turgor
loss while the petiole tends to be flexible, particularly during water limitation. Therefore,
water limitation (loss of turgor) induces a more pendant leaf angle, but no change in leaf
lamina. This relationship between petiole and lamina during water limitation is true for
leaves of both tropical and temperate species of Rhododendron (Nilsen et al 1992).
Idioblast abundance and leaf thickness is not a factor retaining leaf rigidity because
leaves of temperate Rhododendron species, which have no idioblasts and tend to be
thinner, are rigid as well. Therefore, leaf thickness is most related to leaf succulence not
leaf rigidity. Variation in the relationship between leaf thickness and leaf succulence
occurred because of both idioblast expression and mesophyll density.
There was significant five-fold variation (4 - 20%) in idioblast expression among
leaves. That variation in expression was primarily due to increase in numbers rather than
increase in size of idioblasts. The individual idioblast cell size determined was an
underestimate because in any one thin section not all idioblast would be sectioned
through their mid-axis. Thus, many of the idioblasts in an image were tangentially

138
sectioned which results in an underestimate of idioblast cell size. However, the total
idioblast area in a section does represent the total volume of idioblasts in the leaf lamina
volume. The structure of idioblasts was similar to that of idioblasts in other taxonomic
groups such as those in plants in the Scrophulariaceae (Lersten and Curtis 1997).
A proportional reduction in idioblast expression as leaf thickness increased could
simply be due to a constant total volume of idioblasts cells as leaf thickness changed.
However, the negative relation between idioblast expression and leaf thickness in this
study also was due to a decrease in the absolute total area of idioblasts (p < 0.0001) as
leaf lamina thickness increased. Therefore, there was a biologically significant decrease
in idioblast volume as leaves became thicker. Also, narrower longer leaves had higher
idioblast expression in this study. This relationship suggests that idioblasts may function
to ameliorate the effects of water limitation or high radiation because narrower and
smaller leaves are characteristic of Rhododendron plants that inhabit higher light or drier
environments (Nilsen and Bao 1990, Argent 2015). Also, the thickest leaves (most
succulent) tended to be larger more lanceolate leaves. Consequently, the relationship
between leaf form and idioblast expression may actually be due to the negative
relationship between leaf thickness and idioblast expression. Thus, other attributes of leaf
anatomy that are correlated with small leaves and narrow leaves are likely to be the
primary factors determining the observed relationship between leaf form and idioblast
expression.
4.42 Addressing hypothesis one—There was significant variation in idioblast
expression among species represented by accessions used in this study. The data suggest
that plants growing in different habitats have evolved differences in idioblast expression

139
that may relate to the significance of idioblasts to bulk leaf physiological traits.
Anatomical studies of idioblasts have traditionally focused on the anatomical structure
and contents of the idioblasts rather than on the relative volume of idioblasts in relation to
leaf lamina volume (Lersten and Curtis 1995, 2001, Cotta Coutinho et al. 2013, Matos et
al. 2013, de Luna et al. 2014). Leaves of the sampled accessions in this study had no
variation in idioblast anatomy (except size). All idioblasts in this study had large central
vacuoles filled with aqueous solutions that stained positively with safranin O. The soluble
contents and the concentrations of those contents could not be determined by this study,
but due to their staining pattern it is likely that there are phenolics and tannins in the
central vacuole aqueous solution (de Barros and Teixeira 2014). The presence of phenolic
containing compounds suggests that the idioblasts may have a function for herbivore
defense in tropical Rhododendron. However, leaves of temperate Rhododendron species
contain a high content of phenolics as well (Qiang et al. 2011, Fu et al. 2012, Li et al.
2012) yet they do not have any idioblasts. Therefore, the idioblasts in tropical
Rhododendron species likely have other functions besides herbivore defense that are
related to the tropical environment.
4.43 Addressing hypothesis two—The second hypothesis posed in this study
predicted that idioblast expression would increases in accordance with an increase in leaf
succulence among plants. The results of this analysis do not support this hypothesis when
the entire data set from the water relations experiment is used. In fact, succulence (g
water cm-2 leaf area) determined during pressure volume curves was most correlated with
leaf thickness determined during anatomical analyses. This highly significant relationship
between leaf thickness and leaf succulence is robust because the data were attained by

140
separate analytical procedures that minimize autocorrelation. Leaf thickness (and leaf
succulence) was primarily determined by the proportion of leaf volume occupied by
mesophyll (% mesophyll) not leaf idioblast expression. However, if only leaves less than
0.5 mm thick (50% of sampled plants) were used for the analysis, then there was a
positive marginally significant association between idioblast expression and leaf
succulence. Therefore, idioblast expression tends to be a determinant of leaf succulence
for thinner leaves. We are unaware of any other studies that quantify the relationship
between idioblast abundance and leaf thickness or succulence.
4.44 Addressing hypothesis three—Hypothesis three stated that stomatal pore
index, a proxy for maximum stomatal conductance, would increase in accordance with an
increase in idioblast expression among plants. This positive correlation would be
expected if idioblasts serve as a water resource that buffers changes in water potential as
the leaf loses water by transpiration. However, our data do not support this hypothesis.
Instead, stomatal pore index was mostly associated with the succulence, which means
that as leaves become more succulent they are able to have higher leaf transpiration rates.
The inverse relationship between idioblast expression and leaf succulence traits resulted
in a non-significant relationship between idioblast expression and stomatal pore index
(SPI). SPI tends to be higher in high light environments and locations with low CO2
concentration (high elevation). Plants in high light environments and high elevation sites
tend to have relatively smaller leaf area and relatively thicker leaves than leaves on plants
in low light or low elevation environments. The results for this research are contradictory
to this general theory because accessions with larger leaves were generally thicker and
had higher stomatal pore indices than accessions with smaller leaves. Many species of
141
Rhododendron in subgenus Vireya are epiphytic, which can interfere with the general
theory for terrestrial plants because of the complexity of irradiance and water availability
in the epiphytic environment. More needs to be known about the natural habitat of these
species before the functional significance of leaf thickness and area can be interpreted.
4.45 Addressing hypothesis four—Hypothesis four posed that leaf capacitance, pre
turgor-loss, would increase in relation to an increase in leaf idioblast expression among
plants. However, idioblast expression was significantly correlated with WD at TLP and
the difference between OP at 100% and OP at TLP, but not with capacitance pre- or post-
TLP. Osmotic relationships were similar across species resulting in a similar slope for the
line defining osmotic relationships in moisture release curves (data not presented). Thus,
the slope of 1 / water potential vs. WD in the pre-TLP range tended to be steeper for
thicker leaves with fewer idioblasts. This result indicates that the bulk modulus of
elasticity for more succulent leaves was higher (stiffer cell walls) than thinner leaves with
higher idioblast expression. In sum, thinner leaves with their higher idioblast expression
were able to maintain turgor potential to more negative leaf water potentials because of
the lower leaf lamina bulk modulus of elasticity. Therefore, high idioblast expression is
significant for maintaining turgor to higher leaf water deficits without any effect on
osmotic potential or leaf capacitance.
4.46 Summary and conclusion—Leaf succulence (leaf thickness) dominates the
water relations traits of tropical Rhododendron leaves in subgenus Vireya. The effects of
succulence are primarily related to bulk modulus of elasticity causing thick succulent
leaves to lose turgor at a relatively positive leaf water potential and a relatively small
water deficit. However, the relative abundance of idioblasts does have an important

142
relationship with leaf capacitance and WD at the TLP for thinner leaves. Both the WD at
the TLP and capacitance increased as idioblast expression increased for relatively thin
leaves. Thus, species of Rhododendron in subgenus Vireya with relatively small and thin
leaves have idioblasts that likely function as a water buffering system.

143
4.5 Literature cited
Andreasson E., Jorgensen L.B., Hoglund A.S., Rask L. & Meijer J. (2001) Different
myrosinase and idioblast distribution in Arabidopsis and Brassica napus. Plant
Physiology, 127, 1750-1763.
Argent G. (2015) Rhododendrons of subgenus Vireya. Royal Horticultural Society
Publications, London.
Blackman C.J. & Brodribb T.J. (2011) Two measures of leaf capacitance: insights into
the water transport pathway and hydraulic conductance in leaves. Functional Plant
Biology, 38, 118-126.
Brodribb T.J. & Holbrook N.M. (2003) Stomatal closure during leaf dehydration,
correlation with other leaf physiological traits. Plant Physiology, 132, 2166-2173.
Cotta Coutinho I.A., Teodoro Francino D.M. & Strozi Alves Meira R.M. (2013) Leaf
anatomical studies of Chamaecrista subsect. Baseophyllum (Leguminosae,
Caesalpinioideae): new evidence for the up-ranking of the varieties to the species
level. Plant Systematics and Evolution, 299, 1709-1720.
de Barros T.C. & Teixeira S.P. (2014) Morphology and ontogeny of tannin-producing
structures in two tropical legume trees. Botany-Botanique, 92, 513-521.
de Luna B.N., Antunes e Defaveri A.C., Sato A., Bizzo H.R., Freitas M.d.F. & Barros
C.F. (2014) Leaf secretory tissues in Myrsine coriacea and Myrsine venosa
(Primulaceae): ontogeny, morphology, and chemical composition of essential oils.
Botany, 92, 757-766.
Esau K. (1960) Anatomy of Seed Plants. John Wiley and Sons, New York.

144
Feio dos Santos A.C., Andrade de Aguiar-Dias A.C., do Amarante C.B. & Coelho-
Ferreira M. (2013) Secretory structures from the leaf blade of bitter amapa
(Parahancornia fasciculata, Apocynaceae): histochemistry and assay of
flavonoids. Acta Amazonica, 43, 407-413.
Franceschi V.R. & Nakata P.A. (2005) Calcium oxalate in plants: Formation and
function. Annual Review of Plant Biology, 56, 41-71.
Fu Y., Zhang L. & Chen G. (2012) Far infrared-assisted extraction followed by MEKC
for the simultaneous determination of flavones and phenolic acids in the leaves of
Rhododendron mucronulatum Turcz. Journal of Separation Science, 35, 468-475.
Karabourniotis G. (1998) Light-guiding function of foliar sclereids in the evergreen
sclerophyll Phillyrea latifolia: a quantitative approach. Journal of Experimental
Botany, 49, 739-746.
Körner C., Allison A. & Hilscher H. (1983) Altitudinal variation in leaf diffusive
conductance and leaf anatomy in heliophytes of montane New Guinea and their
interaction with microclimate. Flora, 174, 91-135.
Leite G.L.D., Picanco M., Guedes R.N.C. & Skowronski L. (1999) Effect of fertilization
levels, age and canopy height of Lycopersicon hirsutum on the resistance to
Myzus persicae. Entomologia Experimentalis Et Applicata, 91, 267-273.
Lersten N.R. & Curtis J.D. (1992) Unusual epidermal structures in Polygonum
(Polygonaceae) leaves American Journal of Botany, 79, 151-151.
Lersten N.R. & Curtis J.D. (1995) 2 foliar idioblasts of taxonomic significance in
Cercidium and Parkinsonia (Leguminosae, Caesalpinioideae). American Journal
of Botany, 82, 565-570.

145
Lersten N.R. & Curtis J.D. (1997a) Anatomy and distribution of foliar idioblasts in
Scriphularia and Verbascum (Scrophulariaceae). American Journal of Botany, 84,
1638-1645.
Lersten N.R. & Curtis J.D. (1997b) Leaf anatomy of Dombeya and Nesogordonia
(Sterculiaceae), emphasizing epidermal and internal idioblasts. Plant Systematics
and Evolution, 207, 59-86.
Lersten N.R. & Curtis J.D. (1998) Foliar idioblasts in Physostegia virginiana
(Lamiaceae). Journal of the Torrey Botanical Society, 125, 133-137.
Lersten N.R. & Curtis J.D. (2001) Idioblasts and other unusual internal foliar secretory
structures in Scrophulariaceae. Plant Systematics and Evolution, 227, 63-73.
Li H.-Z., Song H.-J., Li H.-M., Pan Y.-Y. & Li R.-T. (2012) Characterization of phenolic
compounds from Rhododendron alutaceum. Archives of Pharmacal Research, 35,
1887-1893.
Lyshede O.B. (2002) Comparative and functional leaf anatomy of selected
Alstroemeriaceae of mainly Chilean origin. Botanical Journal of the Linnean
Society, 140, 261-272.
Matos D.d.S., Leme F.M., Dias E.S. & de Oliveira Arruda R.d.C. (2013) Leaf anatomy of
three species of Stylosanthes SW. and its association with the composition and
formation potencial of phytobezoar in bovines. Ciencia Rural, 43, 2049-2055.
Nilsen E.T. (2003) Unique anatomical traits in leaves of Rhododendron section Vireya: a
discussion of functional significance. Paper presented at the Rhododendrons in
Horticulture and Science, Edinburgh, Scotland.

146
Nilsen E.T. & Scheckler S. (2003) A unique “giant” cell type in leaves of Vireyas.
Journal of the American Rhododendron Society, 57, 6-11.
Nilsen E.T., Webb D.W. & Bao Z. (2014) The function of foliar scales in water
conservation: an evaluation using tropical-mountain, evergreen shrubs of the
species Rhododendron in section Schistanthe (Ericaceae). Australian Journal of
Botany, 62, 403-416.
Parlange J.Y. & Waggoner P.E. (1970) Stomatal dimensions and resistance to diffusion
Plant Physiology (Rockville), 46, 337-342.
Qiang Y., Zhou B. & Gao K. (2011) Chemical Constituents of Plants from the Genus
Rhododendron. Chemistry & Biodiversity, 8, 792-815.
Sartori A.L.B. & Tozzi A. (2002) Comparative leaflet anatomy in Myrocarpus Allemao,
Myroxylon L. f and Myrospermum Jacq. (Leguminosae-Papilionoideae-
Sophoreae) species. Botanical Journal of the Linnean Society, 140, 249-259.
Selby S. (1972) Standard Mathematical Tables. (Twentieth ed.). CRC Press, Cleveland,
Ohio.
Sperry J.S. & Saliendra N.Z. (1994) Intra- and inter-plant variation in xylem cavitation in
Betula occidentalis. Plant, Cell and Environment, 17, 1233-1241.
Sperry J.S. & Sullivan J.E.M. (1992) Xylem embolism in response to freeze-thaw cycles
and water stress in ring-porous, diffuse porous and conifer species. Plant
Physiology, 100, 605-613.
Thangstad O.P., Gilde B., Chadchawan S., Seem M., Husebye H., Bradley D. & Bones
A.M. (2004) Cell specific, cross-species expression of myrosinases in Brassica

147
napus, Arabidopsis thaliana and Nicotiana tabacum. Plant Molecular Biology,
54, 597-611.

148
4.6 Tables
Table 4.1. Results from one-way ANOVA of species effect on morphological and
anatomical traits of leaves from tropical Rhododendron species in subgenus Vireya
growing under greenhouse conditions. Idioblast expression = % of the leaf lamina area
occupied by idioblast cells, Stomatal pore index (SPI) = stomatal density (mean stomatal
pore length2). Significant p-values (< 0.05) are presented in bold type. SS = Sum of
Squares. Degrees of freedom = 16 in all cases.
Trait Units SS F Sig.
Leaf area cm2 9679.32 23.15 <0.0001
Leaf length cm 210.75 25.24 <0.0001
Leaf L/W ratio # 9.93 18.46 <0.0001
Leaf thickness mm 0.66 15.14 <0.0001
Leaf succulence g water / cm2 0.0031 18.08 <0.0001
% mesophyll % of thickness 1985.56 5.13 <0.0001
Idioblast density mm-2 6244.97 8.04 <0.0001
Idioblast area mm2 0.00002 6.33 <0.0001
Idioblast expression % of leaf area 863.89 32.11 <0.0001
Stomatal density mm-2 338924 3.89 0.0006
Stomatal pore length mm 0.002 3.46 0.0016
Stomatal pore index # 0.3863 2.15 0.0338

149
Table 4.2. Results from one-way ANOVA of species effect on leaf water relations traits
derived from moisture release curves of leaves from tropical Rhododendron species in
subgenus Vireya growing under greenhouse conditions. WD = water deficit of bulk leaf
tissue, OP = osmotic potential of bulk leaf tissue. Significant p-values (< 0.05) are
presented in bold type. SS = Sum of Squares. Degrees of freedom = 16 in all cases.
Traits Units SS F Sig.
Capacitance pre-turgor loss Mol m-2 MPa-1 8.142 3.698 0.0006
Capacitance post-turgor loss Mol m-2 MPa-1 100.597 3.696 0.0007
WD at the turgor loss point % 187.820 3.807 0.0005
OP at full turgor MPa 1.439 3.670 0.0007
OP at turgor loss point MPa 1.709 3.311 0.0016
OP full – OP turgor loss point MPa 0.2459 1.3907 0.1955

150
Table 4.3. All the significant correlations among anatomical, stomatal, and water
relations traits of leaves from tropical Rhododendron species in subgenus Vireya.
Idioblast density = number of idioblasts per leaf lamina length, Idioblast expression = %
of the leaf lamina area occupied by idioblast cells, Leaf L/W ratio = leaf length / width,
% mesophyll = the % of the leaf thickness occupied by spongy mesophyll tissue, WD =
water deficit of bulk leaf tissue, OP = osmotic potential of bulk leaf tissue, TLP = turgor
loss point of bulk leaf tissue, 100% = 100% saturated with water, SPI = stomatal pore
index
Trait Trait Correlation Coefficient Sig.
Idioblast density Leaf L/W 0.8842 <0.0001
Idioblast density Leaf thickness -0.5524 <0.0001
Idioblast density Leaf succulence -0.6793 <0.0001
Idioblast density Leaf % mesophyll -0.3925 0.0025
Idioblast expression Leaf L/W 0.6338 <0.0001
Idioblast expression Leaf thickness -0.4735 0.0001
Idioblast expression Leaf succulence -0.5055 <0.0001
Idioblast expression Leaf % mesophyll -0.6162 <0.0001
Stomatal density Idioblast area -0.3670 0.0039
Stomatal density Idioblast expression -0.3765 0.0030
Stomatal density Leaf area -0.3442 0.0087
Stomatal density Leaf length -0.3615 0.0057

151
Stomatal pore length Leaf thickness 0.1368 0.0029
Stomatal pore length Leaf succulence 0.0978 0.0077
Stomatal pore index Leaf thickness 0.4061 0.0013
Stomatal pore index Leaf succulence 0.3476 0.0081
Capacitance pre-TLP Leaf area -0.3875 0.0041
Capacitance pre-TLP Leaf length -0.2962 0.0313
Capacitance pre-TLP Leaf L/W 0.2789 0.0453
Capacitance pre-TLP Leaf thickness 0.4587 0.0006
Capacitance pre-TLP Leaf succulence 0.5066 0.0001
Capacitance pre-TLP Leaf % mesophyll 0.3248 0.0188
Capacitance post-TLP Leaf L/W -0.3129 0.0239
Capacitance post-TLP Leaf thickness 0.3364 0.0147
Capacitance post-TLP Leaf succulence 0.4071 0.0025
Capacitance post-TLP Leaf % mesophyll 0.5197 <0.0001
Capacitance post-TLP Idioblast density 0.3362 0.0148
Capacitance post-TLP Idioblast expression 0.4120 0.0024
Capacitance post-TLP Stomatal pore index 0.2848 0.0407
WD at TLP Leaf area -0.3135 0.0166
WD at TLP Leaf length -0.3046 0.0201
WD at TLP Leaf L/W 0.2613 0.0496
WD at TLP Idioblast density 0.3480 0.0080
WD at TLP Idioblast expression 0.3326 0.0115
WD at TLP Capacitance pre-turgor 0.3401 0.0127

152
WD at TLP Capacitance post-turgor 0.2822 0.0407
OP at 100% Leaf area 0.3332 0.0113
OP at 100% Leaf length 0.2700 0.0422
OP at 100% Leaf L/W -0.4479 0.0005
OP at 100% Capacitance pre-turgor -0.3270 0.0180
OP at 100% Capacitance post-turgor 0.5250 <0.0001
OP at TLP Leaf area 0.2834 0.0326
OP at TLP Leaf L/W -0.3566 0.0065
OP at TLP Capacitance pre-turgor -0.3105 0.0251
OP at 100% – OP TLP Leaf % mesophyll -0.3185 0.0157
OP at 100% – OP TLP Idioblast density 0.3009 0.0229
OP at 100% – OP TLP Capacitance post-turgor -0.5521 <0.0001

153
4.7 Figure legends
Figure 4.1. Representative cross section images of leaf lamina for several tropical
Rhododendron species. Images A – D were stained with safranin O and fast
green. Images were taken at 10 x objective lens, except image D and F were taken
at 4 x objective lens. (A) R. bryophyllum, (B) R. celebicum, (C) R. goodenoughii,
(D) R. yongii, (E) Unstained cross section of leaf lamina for R. brookeanum, (F)
Paradermal section of leaf lamina for R. zoelleri.
Figure 4.2 (A) Regression of capacitance pre-TLP against idioblast expression for plants
with leaves less than 0.5 mm thick. (B) Regression of capacitance post-TLP
against idioblast expression. (C) Regression of WD at turgor loss point by
idioblast expression as dependent variable.

154
4.8 Figures
Figure 4.1. Representative cross section images of leaf lamina

155
Idioblast expression (% of leaf area)
Pre-
TLP
capa
cita
nce
(mm
ol m
-2 M
pa-1
)
0.5
1.0
1.5
2.0
2.5
3.0
A
Post
-TLP
cap
acita
nce
(mm
ol m
-2 M
pa-1
)
0
2
4
6
8
10
B
2 4 6 8 10 12 14 16 18 20 22
Wat
er d
efic
it at
TLP
(%
of b
ulk
wat
er)
4
6
8
10
12
14
16
18
C
Figure 4.2. Regressions of water relations traits against idioblast expression

156
CHAPTER 5
Synthesis of research results: ecological implications of anatomical traits
5.1 Reflections and relationships with the Leaf Economic Spectrum
The Leaf Economic Spectrum (LES), as defined by Reiche (2014) explains that
there are physiochemical constraints on the relationship between leaf functional traits in
different habitats. Thin large leaves with relatively low density are commonly found on
plants inhabiting high resource habitats and there is a continuum to smaller, denser leaves
in habitats with low resource availability. Moreover, leaf longevity increases from leaves
on species in high resource habitats to those on species in low resource habitats. These
functional type constraints were formulated by examining leaf traits across the globe and
are presented using a log-log plot. At any point across the global relationship there may
be a lot of variation that is minimized by the log-log plot. This study examined the
variation in stem and leaf anatomical traits in one group of plants that would reside far to
the right of the LES. Evergreen Rhododendron shrubs are characterized by thick dense
leaves that have extensive longevity, relatively low nitrogen concentration and relatively
low photosynthetic rates (Nilsen 1986).
All evergreen Rhododendron taxa have entire leaves that are usually lanceolate
(leaf length / leaf width (L/W) ratio of 2.5). The leaf area may vary significantly among
species (Nilsen and Tulyanon 2015), but the shape and placement on the branch
(whorled) is consistent. Although leaf longevity may vary based on light intensity (Nilsen
1986), leaves of evergreen Rhododendron species have relatively long life span. These
characteristics of evergreen Rhododendron leaves support the placement of evergreen

157
Rhododendron species on the far right of the LES. Even though this group is placed at
one extreme of the LES, there was a lot of variation in anatomical traits. If that variation
reflects plant adaptation to habitat variation, then the LES misses many important
adaptations related to leaf anatomy. Therefore, this research makes it clear that to fully
understand how plant functional traits are associated with habitat variation research needs
to go much further than just relying on the LES.
5.2 Limitations to productivity
There has been much consideration of the logical trade-off between hydraulic
safety and hydraulic efficiency. In general, hydraulic safety refers to avoidance or repair
of hydraulic dysfunction caused by embolisms due to drought or freeze-thaw cycles
(Meinzer 2010). In contrast, hydraulic efficiency refers to the capacity to move water
from roots to leaves. There is an inherent trade-off between these two processes because
they both depend upon the anatomy of vessels. Small vessels favor safety while large
vessels favor efficiency. This inherent trade-off is modified by vessel arrangement (ring
porous vs. diffuse porous), vessel density, vessel contact (vessel network), as well as
other factors. Therefore, the trade-off between safety and efficiency is not necessarily
true in all cases (McCulloh 2010). There is some evidence that even closely related
species in extreme environments can have evidence of this fundamental trade off
(Medeiros and Pockman 2014). The data collected in this study were in agreement with
Medeiros and Pockman (2014) because there was some evidence for the trade-off
between safety and efficiency between species from temperate and tropical environments.

158
However, the difference in safety was relatively small and both the temperate and tropical
species wood should be classified as highly safe.
The strong safety characteristic of the Rhododendron wood was a result of
relatively small diameter vessels. Consequently, the theoretical specific conductivity also
was found to be relatively small compared to many other species in the tropics and
temperate zones. The highly safe vascular system of Rhododendron species portends
water flow limitation during periods of higher evaporative demand. The result of the
constraint in water flow would be low leaf water potential. However, studies of both the
tropical species in this study and temperate species in other studies (Nilsen 1987, Lipp
and Nilsen 1997) show that complete turgor loss (stomatal closure) occurs at a relatively
high water potential and small water deficit. Therefore, the vascular structure of
Rhododendron species (in both temperate and tropical habitats) restricts water flow,
reduces transpiration and results in low photosynthesis culminating in relatively slow
growth rate. All anatomical traits and water relations measurements collected in this
study point to the vascular system limitation of potential productivity in evergreen
Rhododendron species.
5.3 Consequences to habitat tolerances
Rhododendron originated in the circumboreal forest of Laurasia during a time of
relative high humidity, warm temperature and higher carbon dioxide concentration
(Milne. and Abbott 2002). Since its origin Rhododendron has diversified into colder
climates on temperate mountains and into warmer climates in the tropics. Or, continental
movements have created novel climates to which local Rhododendron species had to

159
acclimate, some of which became relict species of a broader distribution (Milne 2004). In
both cases, innovation was needed for adaptation to the new extreme climatic conditions.
Adaptation to temperate regions, where temperature changes dramatically over the
season, required new tolerance of freeze-thaw cycles. It is possible that the original
Rhododendron species had narrow vessels and were pre-adapted to tolerating the freeze-
thaw cycles of the temperate mountain regions. This research indicated that leaf
innovation may have been multi layered epidermis (hypodermis) to avoid high ultraviolet
radiation in the open forest of mountain regions. Another important innovation in leaves
was thermonastic leaf movement (Nilsen 1992), which protected leaves from radiation
damage during cold periods of the year.
Diversification into the tropics is a different problem because innovation against
freeze-thaw is unnecessary and potentially maladaptive. This study showed that the
vascular system of tropical evergreen Rhododendron shrubs had higher efficiency than
that of temperate Rhododendron shrubs. This result suggests that increasing vascular
efficiency was associated with the diversification into the tropics. However, the
enhancement of efficiency was relatively small. Therefore, the vascular system of
tropical Rhododendron species is still classified as a “safe” wood. The constraints placed
on water flow for the tropical Rhododendron species may lead to significant water stress
because of the potential high evaporative demand in some tropical environments. In
particular, epiphytic habitats and those in open disturbed areas. Many tropical
Rhododendron species inhabit these regions of relatively high radiation and low water
storage (Argent 2015). Therefore, leaf innovations for managing water balance were
needed during the diversification of Rhododendron species into the tropics because

160
vascular efficiency did not change much. Succulence was found to be much more
abundant in leaves of tropical Rhododendron species. Succulence is a well-known
method of maintaining water balance during periods of water limitation. A strong
innovation in leaves of tropical species was idioblasts. This study found that idioblasts do
influence leaf water balance (increasing capacitance) for leaves that are not already
succulent (thin leaves). The appearance of idioblasts in all the leaves of tropical
Rhododendron could have been because the lineage that diversified into the tropics
happened to have idioblasts, or that idioblasts were an important leaf innovation that
allowed Rhododendron to diversify into the tropics. It is more likely that idioblasts were
important for diversification into the tropics because they have never been lost during the
diversification throughout the tropics.
5.4 Limitations and potential improvement
This type of survey of anatomical traits broadly across a genus has limitations.
Primary among those limitations is the species selection. Rhododendron has
approximately 1,000 species, 350 of which are tropical. It would not be possible to
survey all the known species in this group; therefore, a subsample needs to be made. A
survey uses one subsample (in this study 80 species), which could be a biased subsample.
The bias may result in finding differences that do not exist or missing differences that do
exist. A fully comprehensive survey would include all species or multiple random
subsamples. Neither of these options are feasible based on a graduate program.
Another limitation is the ability to obtain samples from a single source. The
samples used in this survey were from the Royal Botanic Garden Edinburgh, UK, the

161
Rhododendron Species Foundation and Botanical Garden in Federal Way, WA, a
common garden in Volcano Village, HI and Biological Sciences-VBI Plant Growth
Facility (VT-PGF) in Blacksburg, VA. Using accessions from one reputable source may
limit the variation and improve the resolution of the habitat effects. However, no one
source can supply enough species in each of the habitat types.
The sample selected for this study was a random selection of accessions in each
habitat type (tropical and temperate). At the beginning of this project, an attempt was
made to collect accessions that represent all the clades resolved in the recent phylogenetic
studies. It was impossible to locate enough of the species used in that publication to study
the phylogenetic basis of anatomical variation. This study would have been improved if it
was possible to obtain enough species to strengthen the phylogenetic signal and utilize
the independent contrasts method to analyze if certain anatomical traits were determined
by phylogeny or environment.
All surveys are necessarily correlative studies. Correlation, regression and
ANOVA were used in this study to understand the relationships between habitat or
elevation and anatomical traits. This study cannot assign cause and effect relationships
between habitat and anatomical trait. Improvements on the cause and effect relationships
might be accomplished by studies of hybrids between temperate and tropical species or
by locating mutants of a species that lacks a particular anatomical innovation.
Perhaps this study could be improved by collecting all samples from plants in
their native ranges. Traveling to all the native ranges would be extremely difficult
because many species occur in remote locations. It may be possible to select a smaller
sample size of species that are accessible in the field and compare the field traits to those

162
of plants growing in the common gardens or greenhouses. Comparing the anatomical
traits of the field sample to the sample from plants in the common garden may help to
understand the common garden effect on anatomical traits. A comparison between
greenhouse and filed-grown plant was done in in this study. Most of the traits were not
significantly different between greenhouse and field-grown (Table 5.1). However, %
mesophyll was significantly lower in greenhouse growing plants. Because of this, the
different between temperate and tropical might have undetected, because field-grown
tropical plants would have had higher % mesophyll. In contrast, Ames/A ratio and
stomatal pore index were found to be significant higher in greenhouse-grown plants
compared to the filed-grown plants. This result suggested the differences in Ames/A ratio
and stomatal pore index found between temperate and tropical may be a greenhouse
artifact. However, the test of greenhouse effect is based on very small sample size.
Other anatomical traits might be added to the list used in this study. The study
would be improved if physiological traits such as hydraulic conductance, nitrogen (N)
concentration or photosynthesis were included in the study. Perhaps the addition of the
physiological traits would increase the linkage of this study with the LES. Roots are the
foundation of water relation traits because all water passes through roots to the stems and
leaves. Adding anatomical or physiological traits of roots may increase the strength of
this study as well.
5.5 General conclusions from this study
The LES is a good base for understanding fundamental plant characteristics, but a
lot of variation in adaptive traits is hidden within each functional group of the LES.

163
Evergreen Rhododendron shrubs are classified at one extreme of the LES, yet they
inhabit many different habitats from arctic fell fields to lowland wet tropical forest. The
variation in anatomical traits found in this study is one factor that allows evergreen
Rhododendron species to colonize different habitat types.
Vascular tissues of evergreen Rhododendron species are inherently “safe”, which
puts a constraint on water flow. The constraint on water flow restricts evergreen
Rhododendron species to low productivity, yet provides adaptation to temperate climates.
The constraint on water flow in tropical evergreen Rhododendron species stem has led to
the development of water management innovations such as succulence and idioblasts.
Moreover, low productivity likely makes Rhododendron weakly competitive with other
faster growing tropical species and restricts the Rhododendron species to marginal
habitats such as disturbed areas and epiphytic locations. Examining the variation in
anatomical traits among evergreen Rhododendron species lead to insight about traits that
constrain plant performance and traits that determine habitat preference.

164
5.6 Literature cited
Argent, G. 2015. Rhododendrons of subgenus Vireya. Royal Horticultural Society in
association with the Royal Botanic Garden.
Lipp C.C., and E.T. Nilsen. 1997. The impact of sub-canopy light environment on the
hydraulic vulnerability of Rhododendron maximum, to freeze-thaw and drought.
Plant Cell and Environment 20:1264-1272
McCulloh K.1., Sperry J.S., Lachenbruch B., Meinzer F.C., Reich P.B. Voelker S. 2010.
Moving water well: comparing hydraulic efficiency in twigs and trunks of
coniferous, ring-porous, and diffuse porous saplings from temperate and tropical
forests. New Phytologist 186: 439-450.
Medeiros, J. S., and W. T. Pockman. 2014. Freezing regime and trade-offs with water
transport efficiency generate variation in xylem structure across diploid
populations of Larrea sp. (Zygophyllaceae). American Journal of Botany
101:598-607.
Meinzer, F. C., K. A. McCulloh, B. Lachenbruch, D. R. Woodruff, and D. M. Johnson.
2010. The blind men and the elephant: the impact of context and scale in
evaluating conflicts between plant hydraulic safety and efficiency. Oecologia
164:287-296.
Milne, R. I. 2004. Phylogeny and biogeography of Rhododendron subsection Pontica, a
group with a tertiary relict distribution. Molecular Phylogenetics and Evolution
33:389-401.
Milne, R. I., and R. J. Abbott. 2002. The origin and evolution of tertiary relict floras.
Pages 281-314 Advances in Botanical Research. Academic Press.

165
Nilsen, E. T. 1986. Quantitative phenology and leaf survivorship of Rhododendron
maximum L. in contrasting irradiance environments of the Appalachian
mountains. American Journal of Botany 73:822-831
Nilsen, E. T. 1987. The influence of temperature and water relations components on leaf
movements in Rhododendron maximum. Plant Physiology: 83:607-612
Nilsen E.T., Tulyanon, T. 2015. An update on the diversity and functional significance of
scales in section Schistanthe. Journal of the American Rhododendron Society.
69(4):187-193
Reiche PB .2014. The world-wide ‘fast–slow’ plant economics spectrum: A traits
manifesto. Journal of Ecology 102:275-301.

166
5.7 Table
Table 5.1. F-test table to compare the significant effect of growing condition between
greenhouse-grown (VT-PGF, Blacksburg, VA) and field-grown (Volcano Village,
HI) leaf traits.
Leaf Traits Sig.
Leaf Area 0.631
Leaf L/W Ratio 0.602
Leaf Thickness 0.127
% Mesophyll 0.053*
Mesophyll Density 0.010**
Idioblast Expression 0.793
Idioblast Density 0.918
Stomatal Density 0.140
Stomatal Pore Length
Stomatal Pore Index
0.893
0.055*