Embed Size (px)
Citation preview
Vegetation, topography and daily weather influencedburn severity in central Idaho and western Montana forests
DONOVAN S. BIRCH,1,5 PENELOPE MORGAN,1,� CRYSTAL A. KOLDEN,2 JOHN T. ABATZOGLOU,2
GREGORY K. DILLON,3 ANDREW T. HUDAK,4 AND ALISTAIR M. S. SMITH1
1Department of Forest, Rangeland, and Fire Sciences, University of Idaho, Moscow, Idaho 83844-1133 USA2Department of Geography, University of Idaho, Moscow, Idaho 83844-3021 USA
3USDA Forest Service, Rocky Mountain Research Station, Fire Sciences Laboratory, Missoula, Montana 59808 USA4USDA Forest Service, Rocky Mountain Research Station, Forestry Sciences Laboratory, Moscow, Idaho 83843 USA
Citation: Birch, D. S., P. Morgan, C. A. Kolden, J. T. Abatzoglou, G. K. Dillon, A. T. Hudak, and A. M. S. Smith. 2015.
Vegetation, topography and daily weather influenced burn severity in central Idaho and western Montana forests.
Ecosphere 6(1):17. http://dx.doi.org/10.1890/ES14-00213.1
Abstract. Burn severity as inferred from satellite-derived differenced Normalized Burn Ratio (dNBR) is
useful for evaluating fire impacts on ecosystems but the environmental controls on burn severity across
large forest fires are both poorly understood and likely to be different than those influencing fire extent. We
related dNBR to environmental variables including vegetation, topography, fire danger indices, and daily
weather for daily areas burned on 42 large forest fires in central Idaho and western Montana. The 353 fire
days we analyzed burned 111,200 ha as part of large fires in 2005, 2006, 2007, and 2011. We expected that
local ‘‘bottom-up’’ variables like topography and vegetation would influence burn severity, but that our use
of daily dNBR and weather data would uncover stronger relationships between the two than previous
studies have shown. We found that percent existing vegetation cover had the largest influence on burn
severity, while weather variables like fine fuel moisture, relative humidity, and wind speed were also
influential but somewhat less important. Our results could reflect contrasting scales of predictor variables,
as many topography and vegetation variables (30-m spatial resolution) accounted for more of the
variability in burn severity (also 30-m spatial resolution) than did fire danger indices and many daily
weather variables (4-km spatial resolution). However, we posit that, in contrast to the strong influence of
climate and weather on fire extent, ‘‘bottom-up’’ factors such as topography and vegetation have the most
influence on burn severity. While climate and weather certainly interact with the landscape to affect burn
severity, pre-fire vegetation conditions due to prior disturbance and management strongly affect vegetation
response even when large areas burn quickly.
Key words: area burned; burn severity; dNBR; infrared perimeter mapping; northern US Rockies; Random Forest;
wildland fire.
Received 31 July 2014; revised 22 October 2014; accepted 3 November 2014; final version received 11 December 2014;
published 29 January 2015. Corresponding Editor: F. Biondi.
Copyright: � 2015 Birch et al. This is an open-access article distributed under the terms of the Creative Commons
Attribution License, which permits unrestricted use, distribution, and reproduction in any medium, provided the
original author and source are credited. http://creativecommons.org/licenses/by/3.0/5 Present address: Bureau of Land Management, Miles City, Montana 59301 USA.
� E-mail: [email protected]
INTRODUCTION
Fires are globally important disturbances that
affect ecosystems (Bond et al. 2004, Bowman et
al. 2009). Although large fires account for most of
the area burned, garner the most media attention,
have the costliest economic impacts (Butry et al.
2001), and are socially important (Lannom et al.
v www.esajournals.org 1 January 2015 v Volume 6(1) v Article 17

2014), not all land area burned in large fires isseverely burned (Birch et al. 2014). Instead, manylarge fires cause variable ecological effects(Lentile et al. 2007), with high severity areashaving long-term effects on ecosystem structureand composition (Kashian et al. 2006, Goetz et al.2007, Romme et al. 2011). However, the environ-mental controls on burn severity across largeforest fires are poorly understood, limiting ourability to model future burn severity.
Burn severity as inferred from remotely sensedimagery has been widely used to evaluate fireeffects on ecosystems (Smith et al. 2005, 2010,French et al. 2008, Soverel et al. 2010, Morgan etal. 2014). Satellite-derived time series have beenused to evaluate ecosystem recovery from fire formany science and management applications(Morgan et al. 2001, Diaz-Delgado et al. 2003,Kotliar et al. 2003). Proportion of the total firearea burned severely has been inferred fromsatellite imagery to evaluate whether fires havebecome more severe in recent decades (Millerand Safford 2012, Mallek et al. 2013), whetherfires have been more severe under different landmanagement (Miller and Urban 2000, Wells2013), and to characterize possible changes inwildlife habitat (Hanson and Odion 2013). Wedefine burn severity as the degree of ecosystemchange due to fire (Morgan et al. 2001, Key andBenson 2006), where ecosystem change incorpo-rates changes in overstory vegetation, understoryvegetation, or soil strata (Van Wagtendonk et al.2004, Lentile et al. 2006, French et al. 2008,Morgan et al. 2014). The differenced NormalizedBurn Ratio (dNBR) spectral index of burnseverity calculated from pre-fire and one yearpost-fire satellite imagery has been correlatedwith field-based assessments of burn severity(Van Wagtendonk et al. 2004, Cocke et al. 2005,De Santis and Chuvieco 2009, Jones et al. 2009),and with percent tree mortality in forested areas(Cocke et al. 2005, Hudak et al. 2007, Lentile et al.2007, Smith et al. 2010).
Environmental conditions influence firegrowth, occurrence, and extent, but the degreeto which they influence burn severity is unclear.Most prior climate-fire analyses have shownsignificant correlations between annual burnedarea and summer drought in the northern USRockies (Littell et al. 2009, Abatzoglou andKolden 2013) with widespread fires occurring
during warm, dry summers that followed warmsprings (Heyerdahl et al. 2008, Morgan et al.2008). The environmental factors influencingburn severity may be distinctly different thanthose influencing fire occurrence and extent(Romme and Knight 1981, Christensen et al.1989, Heyerdahl et al. 2002, Dillon et al. 2011).Burn severity can be highly variable, even whenlarge areas burn in a single 24-hr period (Birch etal. 2014). Jones et al. (2009) found that aboveaverage summer high temperatures and lowprecipitation were important in growth andseverity of the largest fire on record for theNorth Slope of Alaska. Holden et al. (2009) foundthat north-facing slopes were more likely to burnseverely than other aspects in New Mexico.Dillon et al. (2011) found that the probability ofhigh burn severity was influenced by topographymore than climate even in years of widespreadfires when climate was more influential than inother years.
The US northern Rockies area is well-suited forexamining how multiple factors interact toinfluence burn severity. This area provides awide variety of forested vegetation, topographic,settings, and environmental conditions that haveexperienced wildfires in recent years. The north-ern Rocky Mountains have accounted for themajority of area burned in the western US for thelast several decades (Westerling 2008) and thearea is considered vulnerable to future climate-driven increases in the frequency of large fires(Westerling et al. 2006, Littell et al. 2009,Spracklen et al. 2009, Moritz et al. 2012). Burnseverity is highly variable here (Dillon et al. 2011)and important to people and many ecosystemprocesses influenced by fire (Morgan et al. 2014).
Our objective was to understand how burnseverity as indicated by dNBR varies withtopography, vegetation, fire danger indices, anddaily weather. We build on the study of Dillon etal. (2011) who analyzed high burn severity acrosssix ecoregions of the western US and found thattopography exerted more influence on burnseverity than fire weather or climate. Their fireweather data, however, were only resolved to a10-day summary around fire detection dates, andtheir climate data reflected monthly or seasonalvalues coincident with or antecedent to firedetection dates. Here we analyze continuousdNBR values (not just high severity) resulting
v www.esajournals.org 2 January 2015 v Volume 6(1) v Article 17
BIRCH ET AL.
from daily areas burned relative to weather andfire danger for the specific day each area burned.We expected that (1) that ‘‘bottom-up’’ variablessuch as topography and vegetation will still havea large effect on burn severity and post-firevegetation response, (2) that using burn severityand weather data matched to the same timeperiod will result in stronger relationshipsbetween the two and advance our understandingof how weather influences severity, and (3)topography and vegetation will influence burnseverity even when we focus only on the largestdaily areas burned in the largest fires even asthese fires burned under extreme weather.Understanding the environmental factors influ-encing burn severity, especially for large fires, iscritical to projecting the degree to which ecolog-ical effects of fire will change with climate.
METHODS
Study areaWe examined 42 forest fires in central Idaho
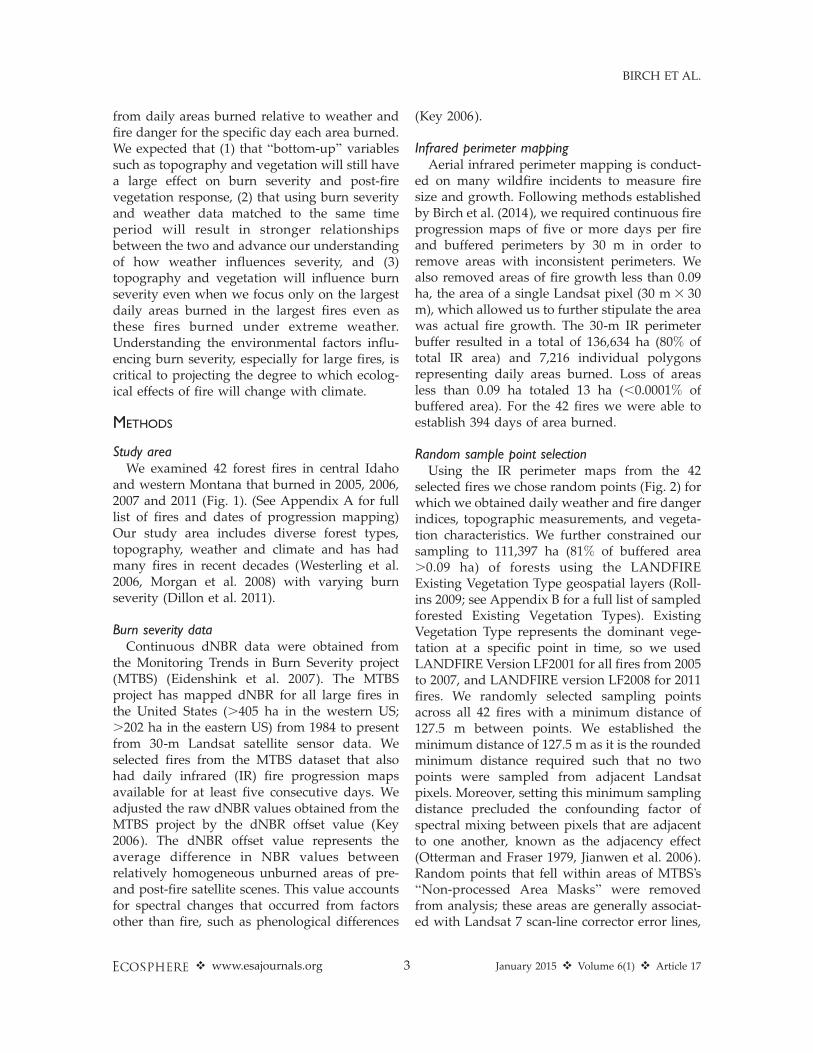
and western Montana that burned in 2005, 2006,2007 and 2011 (Fig. 1). (See Appendix A for fulllist of fires and dates of progression mapping)Our study area includes diverse forest types,topography, weather and climate and has hadmany fires in recent decades (Westerling et al.2006, Morgan et al. 2008) with varying burnseverity (Dillon et al. 2011).
Burn severity dataContinuous dNBR data were obtained from
the Monitoring Trends in Burn Severity project(MTBS) (Eidenshink et al. 2007). The MTBSproject has mapped dNBR for all large fires inthe United States (.405 ha in the western US;.202 ha in the eastern US) from 1984 to presentfrom 30-m Landsat satellite sensor data. Weselected fires from the MTBS dataset that alsohad daily infrared (IR) fire progression mapsavailable for at least five consecutive days. Weadjusted the raw dNBR values obtained from theMTBS project by the dNBR offset value (Key2006). The dNBR offset value represents theaverage difference in NBR values betweenrelatively homogeneous unburned areas of pre-and post-fire satellite scenes. This value accountsfor spectral changes that occurred from factorsother than fire, such as phenological differences
(Key 2006).
Infrared perimeter mappingAerial infrared perimeter mapping is conduct-
ed on many wildfire incidents to measure firesize and growth. Following methods establishedby Birch et al. (2014), we required continuous fireprogression maps of five or more days per fireand buffered perimeters by 30 m in order toremove areas with inconsistent perimeters. Wealso removed areas of fire growth less than 0.09ha, the area of a single Landsat pixel (30 m 3 30m), which allowed us to further stipulate the areawas actual fire growth. The 30-m IR perimeterbuffer resulted in a total of 136,634 ha (80% oftotal IR area) and 7,216 individual polygonsrepresenting daily areas burned. Loss of areasless than 0.09 ha totaled 13 ha (,0.0001% ofbuffered area). For the 42 fires we were able toestablish 394 days of area burned.
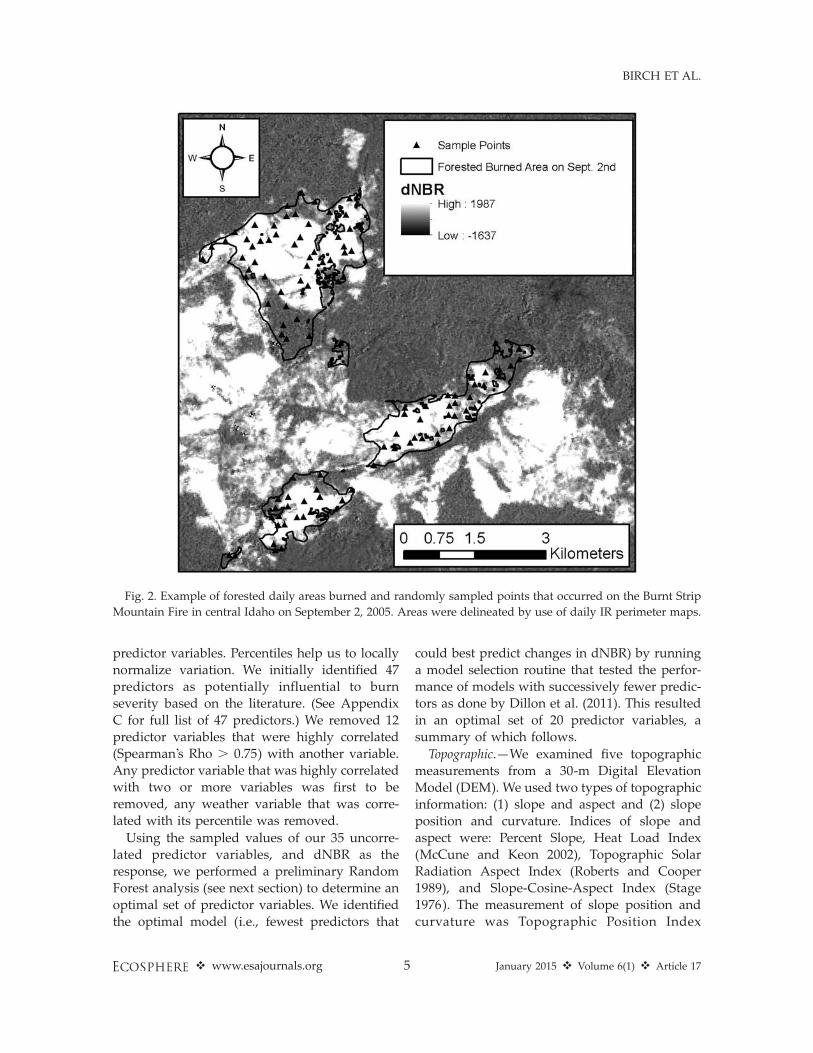
Random sample point selectionUsing the IR perimeter maps from the 42
selected fires we chose random points (Fig. 2) forwhich we obtained daily weather and fire dangerindices, topographic measurements, and vegeta-tion characteristics. We further constrained oursampling to 111,397 ha (81% of buffered area.0.09 ha) of forests using the LANDFIREExisting Vegetation Type geospatial layers (Roll-ins 2009; see Appendix B for a full list of sampledforested Existing Vegetation Types). ExistingVegetation Type represents the dominant vege-tation at a specific point in time, so we usedLANDFIRE Version LF2001 for all fires from 2005to 2007, and LANDFIRE version LF2008 for 2011fires. We randomly selected sampling pointsacross all 42 fires with a minimum distance of127.5 m between points. We established theminimum distance of 127.5 m as it is the roundedminimum distance required such that no twopoints were sampled from adjacent Landsatpixels. Moreover, setting this minimum samplingdistance precluded the confounding factor ofspectral mixing between pixels that are adjacentto one another, known as the adjacency effect(Otterman and Fraser 1979, Jianwen et al. 2006).Random points that fell within areas of MTBS’s‘‘Non-processed Area Masks’’ were removedfrom analysis; these areas are generally associat-ed with Landsat 7 scan-line corrector error lines,
v www.esajournals.org 3 January 2015 v Volume 6(1) v Article 17
BIRCH ET AL.
cloud cover, cloud shadow, and other data gaps.The minimum sample distance and Non-pro-cessed Area Masks eliminated the ability tosample from some of 394 possible IR progressiondays, missing 41 days and 127 ha (,0.001% offorested burned area). Of these 41 days, only fivedays were not sampled on another fire. Ulti-mately, we sampled 10,819 points in 353 fire days
within a total daily forested area burned of111,270 ha.
Topographic, vegetation, daily weatherand fire danger indices
For each of the randomly located points, weobtained data for a suite of topographic, vegeta-tion, daily weather and 30-yr percentile weather
Fig. 1. Study area of central Idaho and western Montana showing the 42 fires from 2005 to 2007 and 2011 used
in this study.
v www.esajournals.org 4 January 2015 v Volume 6(1) v Article 17
BIRCH ET AL.
predictor variables. Percentiles help us to locally
normalize variation. We initially identified 47
predictors as potentially influential to burn
severity based on the literature. (See Appendix
C for full list of 47 predictors.) We removed 12
predictor variables that were highly correlated
(Spearman’s Rho . 0.75) with another variable.
Any predictor variable that was highly correlated
with two or more variables was first to be
removed, any weather variable that was corre-
lated with its percentile was removed.
Using the sampled values of our 35 uncorre-
lated predictor variables, and dNBR as the
response, we performed a preliminary Random
Forest analysis (see next section) to determine an
optimal set of predictor variables. We identified
the optimal model (i.e., fewest predictors that
could best predict changes in dNBR) by running
a model selection routine that tested the perfor-
mance of models with successively fewer predic-
tors as done by Dillon et al. (2011). This resulted
in an optimal set of 20 predictor variables, a
summary of which follows.
Topographic.—We examined five topographic
measurements from a 30-m Digital Elevation
Model (DEM). We used two types of topographic
information: (1) slope and aspect and (2) slope
position and curvature. Indices of slope and
aspect were: Percent Slope, Heat Load Index
(McCune and Keon 2002), Topographic Solar
Radiation Aspect Index (Roberts and Cooper
1989), and Slope-Cosine-Aspect Index (Stage
1976). The measurement of slope position and
curvature was Topographic Position Index
Fig. 2. Example of forested daily areas burned and randomly sampled points that occurred on the Burnt Strip
Mountain Fire in central Idaho on September 2, 2005. Areas were delineated by use of daily IR perimeter maps.
v www.esajournals.org 5 January 2015 v Volume 6(1) v Article 17
BIRCH ET AL.
(Weiss 2001) calculated in an annular neighbor-hood with a 2,000-m outer radius and 300-minner radius. (See Appendix D for descriptions ofeach topographic predictor.)
Vegetation.—Three representations of pre-firevegetation characteristics were obtained from theLANDFIRE Program (Landfire 2013): Fuel Char-acteristics Classification System, EnvironmentalSite Potential, and Existing Vegetation Cover.LANDFIRE geospatial layers provide 30-m pixelrepresentations of vegetation characteristics(Landfire 2013). Fuel Characteristics Classifica-tion System layers represent fire environmentfuelbeds that contribute to fire behavior andeffects (Riccardi et al. 2007). Environmental SitePotential represents the vegetation communitiesthat would become established at late or climaxstages of successional development withoutdisturbance, based on biophysical site conditions(Landfire 2013). Existing Vegetation Cover asexpressed in LANDFIRE data layers in forestedareas is percent tree canopy cover from 10% to100%, by 10% intervals. Areas with less than 10%tree canopy are not considered forested areas byLANDFIRE. (See Appendix E for descriptions ofall vegetation layers obtained from LANDFIRE.)
Weather and fire danger indices.—Maximum andminimum temperature and relative humidity,precipitation, 10-meter wind velocity anddownward shortwave radiation at the surfacewere extracted from the surface meteorologicaldataset of Abatzoglou (2013) (http://metdata.northwestknowledge.net) at 4-km spatial reso-lution. (See Appendix F for descriptions.) Inaddition, we calculated Duff Moisture Code andFine Fuel Moisture Code from the CanadianForest Fire Danger Rating System and theEnergy Release Component and Burning Indexfrom the National Fire Danger Rating Systemusing fuel model G (dense conifer). Fire dangerindices comprise timescales that integrateweather over the previous couple months andthus represent a hybrid weather-climate metric.
Data were extracted for the 4-km voxels co-located with each random point, which formany points within a fire included identicalweather and fire danger indices. Due to theheterogeneity in these predictors across thestudy area as a function of baseline climatology,we consider these variables as observed andusing a percentile based approach as both
approaches have shown merit in previousstudies (e.g., Abatzoglou and Kolden 2013,Parks et al. 2014). While the variables in theirraw form account for geographic differences inenergy and moisture, a percentile-based ap-proach normalizes for these climatological dif-ferences and allows for comparisons to be madeacross locations relative to historical conditionsand are often used operationally in fire sup-pression decisions. We calculated percentiles foreach variable to contextualize environmentalconditions at each site using all observationsfrom July 1 to September 30 (92 days) over theperiod of record of observations (1979–2013).Percentiles were not considered separately foreach day, but rather by pooling all days. (SeeAppendix F for descriptions of weather predic-tors from which climate percentiles were calcu-lated.)
We also calculated wind-aspect alignment asthe absolute value of aspect direction minuswind direction, with values of 0 and 360 havingperfect up-slope wind, a value 180 having perfectdown-slope wind, and values in between mea-suring varying degrees of cross-slope/up-slopewinds (e.g., absolute value of (180 aspectdirection � 359 wind direction) ¼ 179, down-slope wind; absolute value of (225 aspectdirection � 270 wind direction) ¼ 45, cross-slope/partial up-slope wind). Slopes less than 10percent were calculated as having a wind-aspectalignment of 0, or perfect alignment.
AnalysisWe used Random Forest (Breiman 2001), a
machine learning classification and regressiontree analysis method, to study how our topo-graphic, vegetation, daily weather, and 30-yearpercentile weather variables influenced continu-ous dNBR values. We implemented our analysiswith the Random Forest package (Liaw andWiener 2002) for R (R Core Team 2014), usingregression tree models because of our continuousburn severity response variable. For regressiontree analyses, Random Forest produces a pseudo-R2 calculated as 1 minus the mean-square error(MSE) divided by the variance that occurs withinthe response variable, dNBR (i.e., R2¼ 1� MSE/Variance (dNBR)). MSE is the sum of the squaredresiduals divided by the sample size (n¼ 10,819).We used the pseudo-R2 to assess overall model
v www.esajournals.org 6 January 2015 v Volume 6(1) v Article 17
BIRCH ET AL.

performance, and used MSE in evaluating therelative importance of predictors and selecting anoptimal model. We used nonparametric ranksum tests (Mann and Whitney 1947) on MSEvalues. We evaluated whether the variable groupranks, topographic vs. vegetation vs. dailyweather vs. 30-year percentile weather, werenon-random. Similarly, we compared the ranksof the ‘‘bottom-up’’ topography and vegetationvariables relative to the ‘‘top-down’’daily weath-er and weather percentile variables.
Similarly to Dillon et al. (2011), we firstidentified variable importance rankings usingour full set of 35 uncorrelated predictor variables,and subsequently found the optimal model usingan iterative model selection routine. WithinRandom Forest, the importance of each predictorvariable is assessed by randomly permuting itsvalues and determining the resultant increase inMSE; the more influence a variable has on overallmodel performance, the more model error will beincreased by permuting its values. Using all 35variables, we ran five replicate models, each with1500 regression trees, and used the medianimportance measure (increase in MSE) acrossall five replicates to rank each variable. Followingthe methods of Dillon et al. (2011), we thenformed ten groups of predictor variables basedon similarity of importance values, and tested theperformance of models with successively fewerpredictor variables, starting with all ten groupsand at each successive round eliminating theleast important group. We used five replicates offive-fold cross-validation at each round of modelselection, again with 1500 regression trees in eachmodel. We selected the optimal model as thesmallest set of predictor variables that resulted inoverall MSE within one standard error of themodel producing the lowest MSE (De’ath andFabricius 2000).
To evaluate the relationship between individ-ual predictor variables and burn severity, weexamined partial dependence plots from ouroptimal Random Forest model. In a regressiontree analysis, Random Forest generates theseplots by calculating, at fixed values across therange of a given predictor, the average of modelpredictions using all combinations of observedvalues of other predictor variables (Cutler et al.2007). Therefore, the partial dependence plotsshow how the predicted value of dNBR varies
across the range of any given predictor.We repeated our Random Forest analysis,
including removal of correlated predictors, rank-ing of variable importance, selection of anoptimal model, and creation of partial depen-dence plots, for only observation points locatedwithin daily areas burned greater than 600 ha.We refer to this as the ‘‘large fire growth’’analysis, as opposed to the ‘‘all points’’ analysisthat used the full sample of 10,819 points. Thethreshold of 600 ha was selected as it correspondsto the 99.5th percentile of the size of the dailyareas burned and included 4,113 observationpoints (38%).
RESULTS
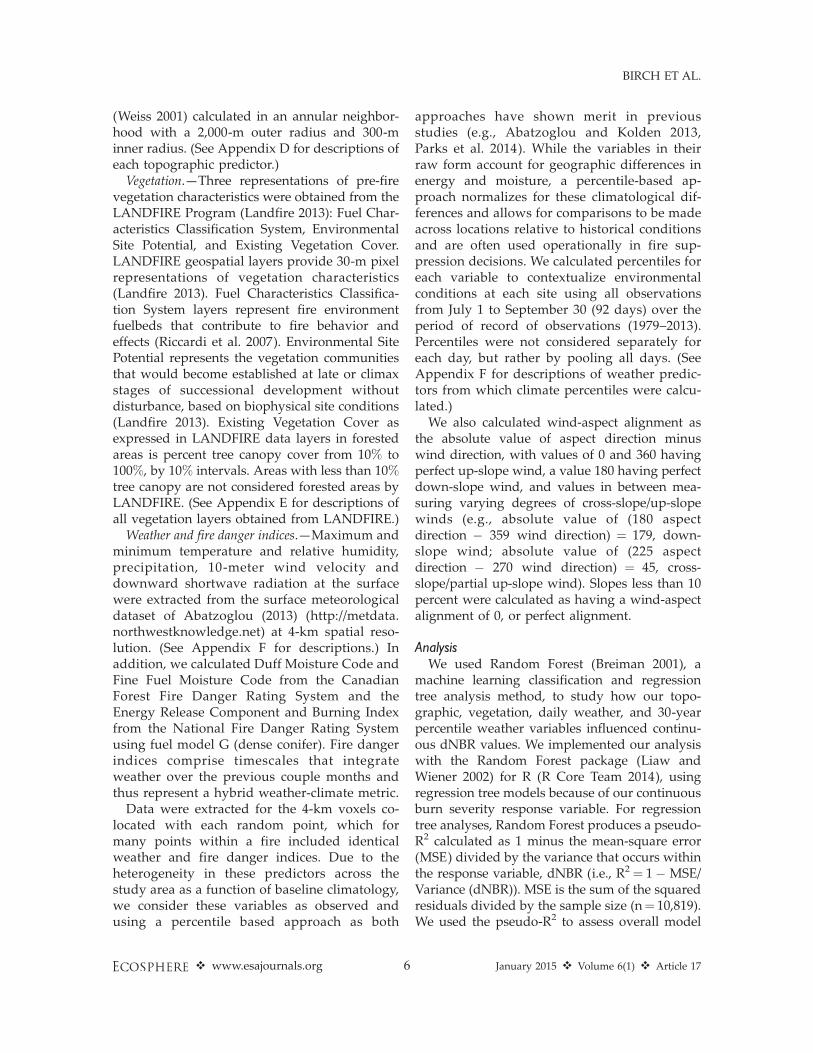
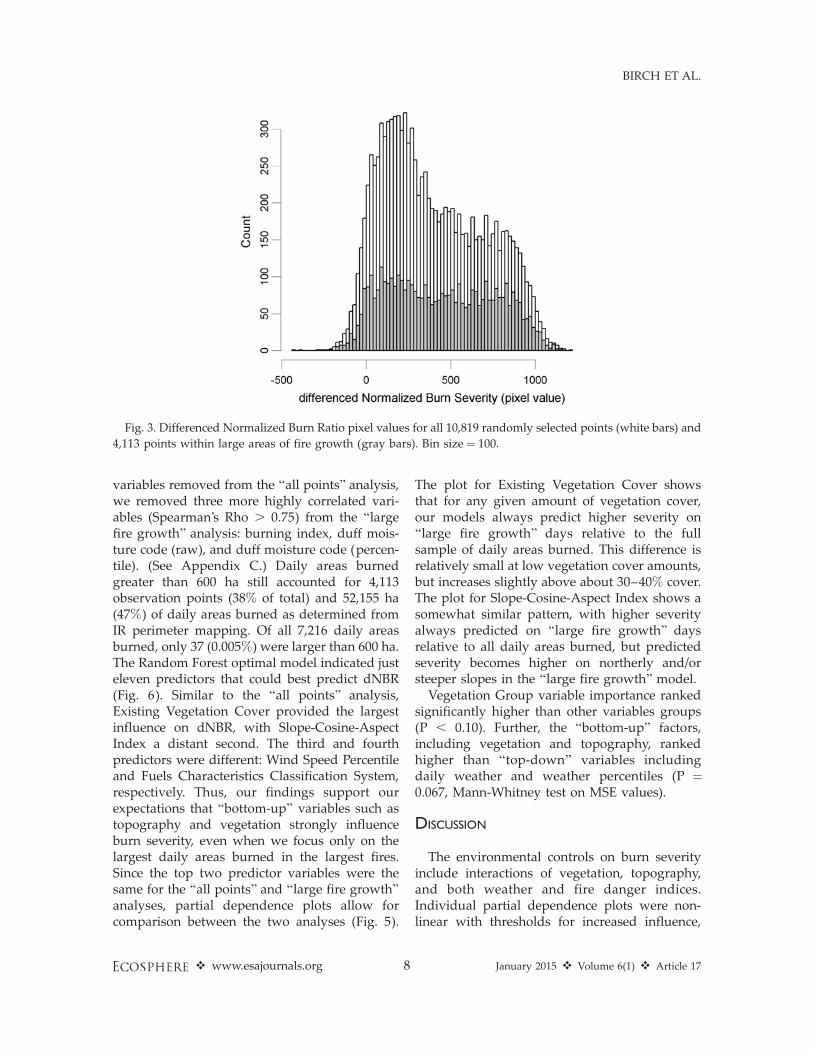
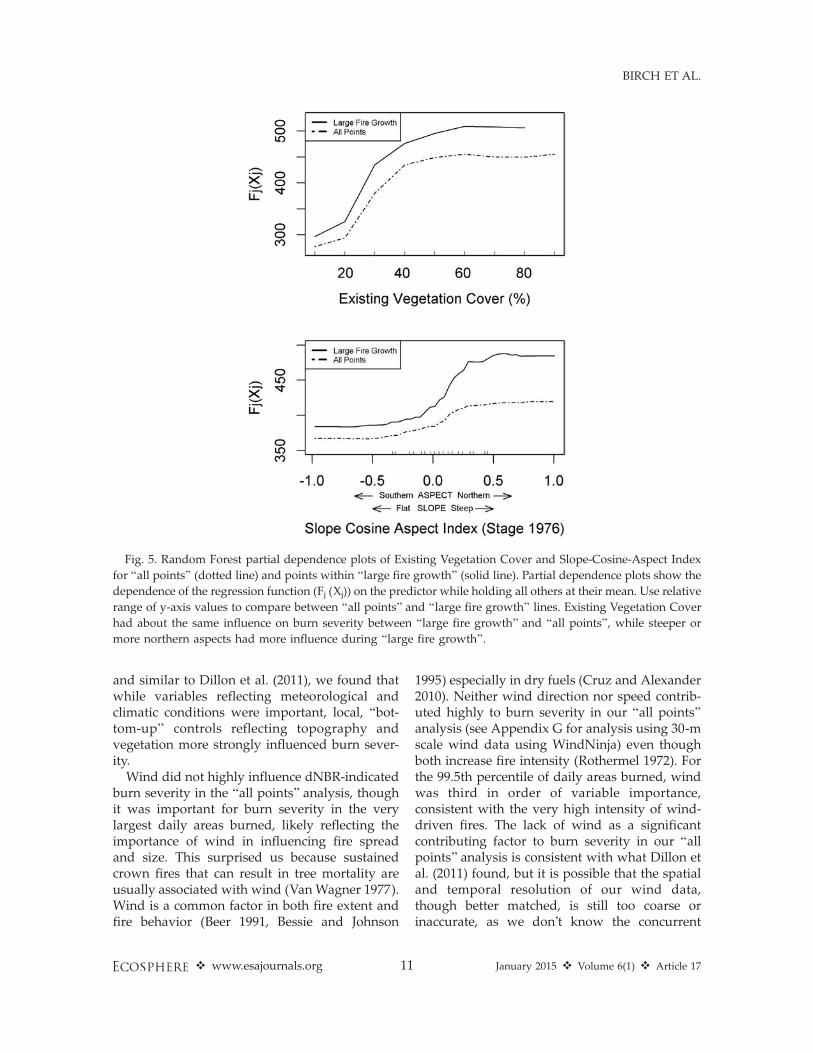
Values of the continuous dNBR index, indicat-ing burn severity, ranged from �431 to 1,218across the 10,819 sample points from 42 fires (Fig.3). The ‘‘all points’’ optimal model resulted in apseudo R2 of 0.42. The optimal model included20 predictors related to topography, vegetation,and weather and fire danger indices (Fig. 4). Themost important predictor from this analysis wasExisting Vegetation Cover by a wide margin overthe next variable, Slope-Cosine-Aspect Index.Environmental Site Potential (see Table 1 fordescriptions), Fine Fuel Moisture Code Percen-tile, and Maximum Relative Humidity followedclosely as the third, fourth, and fifth mostimportant variables. Partial dependence plotsfrom the optimal ‘‘all points’’ analysis show thathigher amounts of Existing Vegetation Cover andgreater values of Slope-Cosine-Aspect Index (i.e.,steeper slopes and/or more northern-facing as-pects) were associated with higher predicteddNBR values (Fig. 5). Likewise, higher valuesof dNBR were predicted for cold/wet forestEnvironmental Site Potential classes (Table 1),90th percentile or greater Fine Fuel MoistureCode, and Maximum Relative Humidity valuesbelow ;65% (plots not shown). Unfortunately,although the Random Forest analysis reflects allof the variables included together, the partialdependence plots are of one variable at a time, sowe cannot show the interactions clearly.
For the ‘‘large fire growth’’ analysis, reflectingareas of daily fire growth above the 99.5thpercentile in size, the optimal model had apseudo-R2 of 0.49. In addition to the 12 predictor
v www.esajournals.org 7 January 2015 v Volume 6(1) v Article 17
BIRCH ET AL.
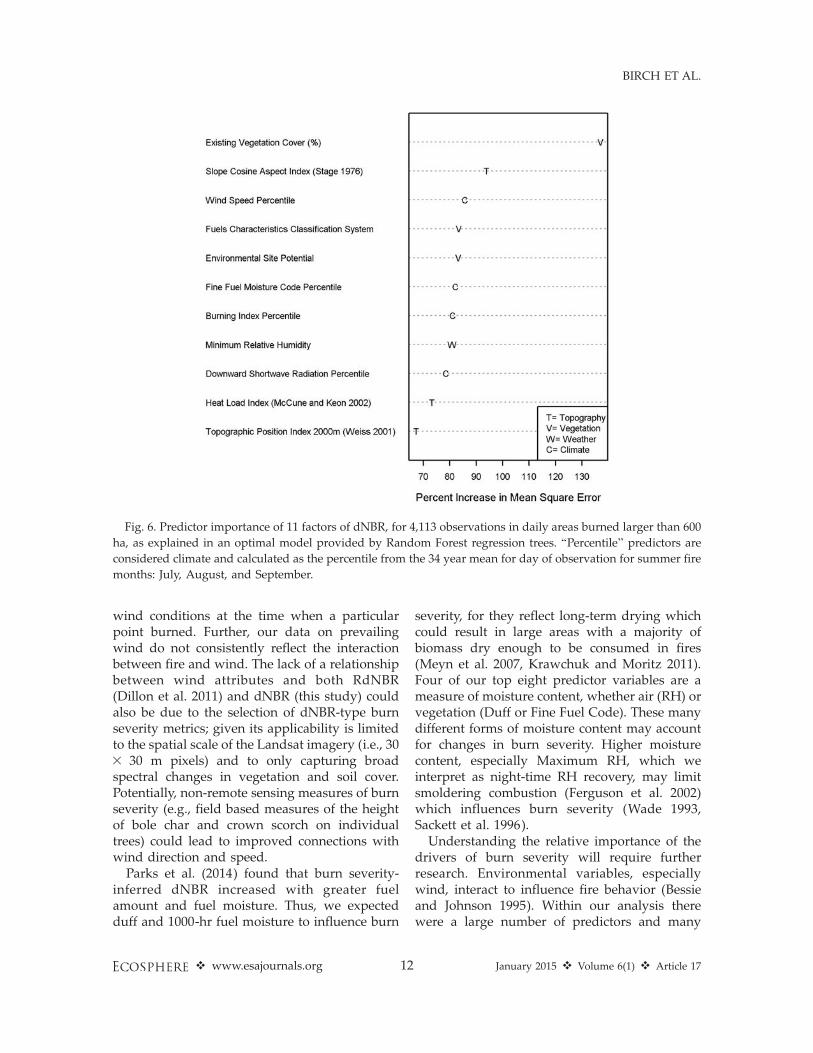
variables removed from the ‘‘all points’’ analysis,we removed three more highly correlated vari-ables (Spearman’s Rho . 0.75) from the ‘‘largefire growth’’ analysis: burning index, duff mois-ture code (raw), and duff moisture code (percen-tile). (See Appendix C.) Daily areas burnedgreater than 600 ha still accounted for 4,113observation points (38% of total) and 52,155 ha(47%) of daily areas burned as determined fromIR perimeter mapping. Of all 7,216 daily areasburned, only 37 (0.005%) were larger than 600 ha.The Random Forest optimal model indicated justeleven predictors that could best predict dNBR(Fig. 6). Similar to the ‘‘all points’’ analysis,Existing Vegetation Cover provided the largestinfluence on dNBR, with Slope-Cosine-AspectIndex a distant second. The third and fourthpredictors were different: Wind Speed Percentileand Fuels Characteristics Classification System,respectively. Thus, our findings support ourexpectations that ‘‘bottom-up’’ variables such astopography and vegetation strongly influenceburn severity, even when we focus only on thelargest daily areas burned in the largest fires.Since the top two predictor variables were thesame for the ‘‘all points’’ and ‘‘large fire growth’’analyses, partial dependence plots allow forcomparison between the two analyses (Fig. 5).
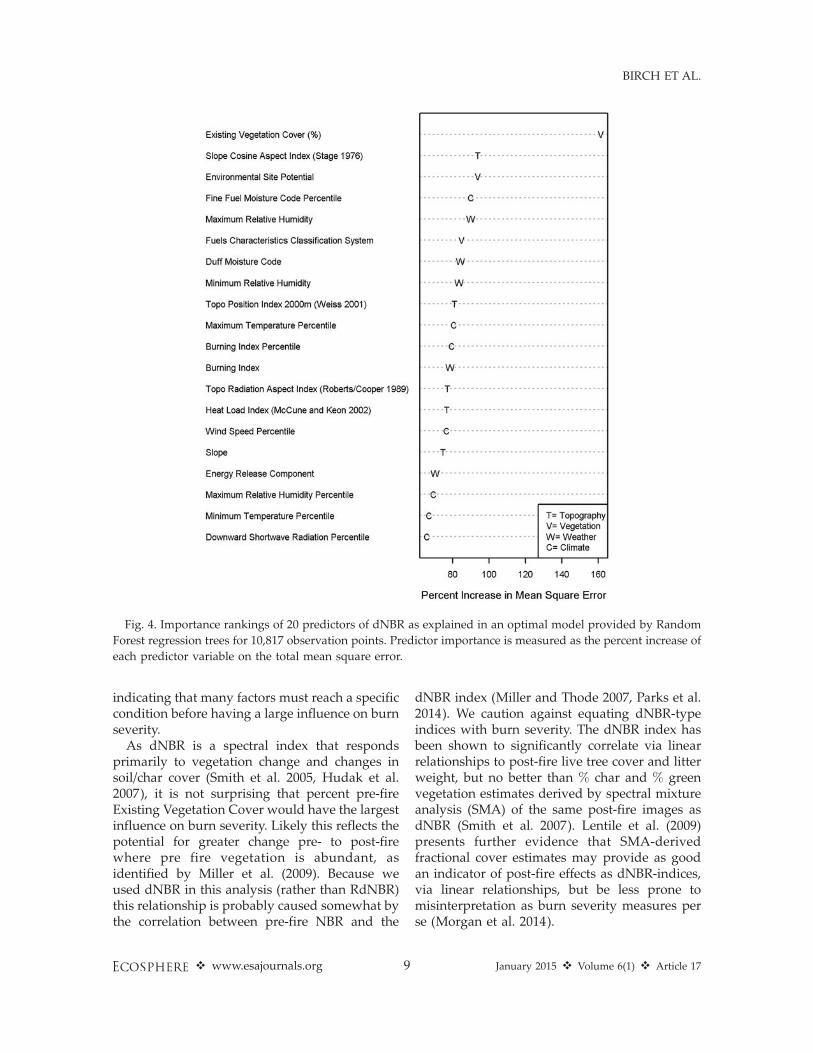
The plot for Existing Vegetation Cover showsthat for any given amount of vegetation cover,our models always predict higher severity on‘‘large fire growth’’ days relative to the fullsample of daily areas burned. This difference isrelatively small at low vegetation cover amounts,but increases slightly above about 30–40% cover.The plot for Slope-Cosine-Aspect Index shows asomewhat similar pattern, with higher severityalways predicted on ‘‘large fire growth’’ daysrelative to all daily areas burned, but predictedseverity becomes higher on northerly and/orsteeper slopes in the ‘‘large fire growth’’ model.
Vegetation Group variable importance rankedsignificantly higher than other variables groups(P , 0.10). Further, the ‘‘bottom-up’’ factors,including vegetation and topography, rankedhigher than ‘‘top-down’’ variables includingdaily weather and weather percentiles (P ¼0.067, Mann-Whitney test on MSE values).
DISCUSSION
The environmental controls on burn severityinclude interactions of vegetation, topography,and both weather and fire danger indices.Individual partial dependence plots were non-linear with thresholds for increased influence,
Fig. 3. Differenced Normalized Burn Ratio pixel values for all 10,819 randomly selected points (white bars) and
4,113 points within large areas of fire growth (gray bars). Bin size ¼ 100.
v www.esajournals.org 8 January 2015 v Volume 6(1) v Article 17
BIRCH ET AL.
indicating that many factors must reach a specificcondition before having a large influence on burnseverity.
As dNBR is a spectral index that respondsprimarily to vegetation change and changes insoil/char cover (Smith et al. 2005, Hudak et al.2007), it is not surprising that percent pre-fireExisting Vegetation Cover would have the largestinfluence on burn severity. Likely this reflects thepotential for greater change pre- to post-firewhere pre fire vegetation is abundant, asidentified by Miller et al. (2009). Because weused dNBR in this analysis (rather than RdNBR)this relationship is probably caused somewhat bythe correlation between pre-fire NBR and the
dNBR index (Miller and Thode 2007, Parks et al.2014). We caution against equating dNBR-typeindices with burn severity. The dNBR index hasbeen shown to significantly correlate via linearrelationships to post-fire live tree cover and litterweight, but no better than % char and % greenvegetation estimates derived by spectral mixtureanalysis (SMA) of the same post-fire images asdNBR (Smith et al. 2007). Lentile et al. (2009)presents further evidence that SMA-derivedfractional cover estimates may provide as goodan indicator of post-fire effects as dNBR-indices,via linear relationships, but be less prone tomisinterpretation as burn severity measures perse (Morgan et al. 2014).
Fig. 4. Importance rankings of 20 predictors of dNBR as explained in an optimal model provided by Random
Forest regression trees for 10,817 observation points. Predictor importance is measured as the percent increase of
each predictor variable on the total mean square error.
v www.esajournals.org 9 January 2015 v Volume 6(1) v Article 17
BIRCH ET AL.

Topography also influenced burn severity asindicated by dNBR. Slope-Cosine-Aspect index(Stage 1976) was the second leading predictor ofdNBR as it likely reflects effective moisture andproductivity of biomass available to burn, as wellas probability of burning. Dillon et al. (2011)found that topography, including elevation and2000-m topographic complexity, had the largestinfluence on proportion of high severity firewithin large forest fires. We did not includeelevation in our study. Perhaps the influence ofcoarse-scale topographic complexity on burnseverity as found by Dillon et al. (2011) but notin our work reflects the regional scale of theiranalysis. All of the topographic predictor vari-ables in our optimal model were also included intheir models.
All of the polygons representing large dailyareas burned within known 24-hour periodsincluded multiple topographic facets as theyburned across complex montane topography.All were part of large fires that burned formultiple days, and therefore were burning underrelatively extreme conditions, which might sug-gest that climate and weather would be moreimportant than topography within large areasburned. While the top two predictors, ExistingVegetation Cover and Slope-Cosine-Aspect In-dex, did not change in importance when weanalyzed only those points in the largest dailyareas burned, wind speed did become moreimportant (third in the ‘‘large growth’’ analysis
from 15th in the ‘‘all points’’ analysis).Partial dependence plots for Slope-Cosine-
Aspect Index indicate that steeper slopes and/ormore northerly aspects are associated withhigher values of dNBR, especially within areasof large fire growth. This may be because thevegetation on many north-facing aspects is lessavailable to burn without the extensive dryingthat favors large fire growth. Within our predic-tor variable of Environmental Site Potential, cold/wet forest types that are often found on cooleraspects and higher on mountain slopes were alsoassociated with higher dNBR values (Table 1).Similarly, Holden et al. (2009) found that fires oncool north-facing aspects of the Gila Wildernessof the southwestern US were more likely to burnwith high severity. Barrett et al. (2010) also foundthat aspect influenced burn severity as indicatedby the relative reduction of organic soil layers ofblack spruce stands in Alaskan boreal forest.
Our findings support Dillon et al.’s (2011)argument that the environmental controls onburn severity differ from those determining fireextent. In contrast to Dillon et al. (2011), we usedweather data and fire danger indices at muchfiner spatial and temporal resolutions, providinga much closer match of temporal and spatialscales with the observations of daily area burned.We also analyzed the full range of burn severities(not just high severity) as indicated by acontinuous dNBR gradient, and focused on fewerfires within a single ecoregion. As we expected,
Table 1. Environmental Site Potential (ESP) descriptions of the NatureServe terrestrial ecological systems used in
this analysis (NatureServe 2011).
ESP code Description Forest type Partial dependence value
1056 R Mt. Subalpine Mesic-Wet Spruce-Fir Forest Cold 4201055 R Mt. Subalpine Dry-Mesic Spruce-Fir Forest Cold 4121167 R Mt. Poor-Site Lodgepole Pine Forest Cold 3921046 N R Mt. Subalpine Woodland and Parkland Cold 3721161 N R Mt Conifer Swamp Cold 3601045 N R Mt Dry-Mesic Mixed Conifer Forest Dry 3621053 N R Mt Ponderosa Pine Woodland Dry 3411159 R Mt. Montane Riparian Systems Mesic 3841166 Middle R Mt. Montane Douglas-fir Forest Mesic 3821160 R Mt. Subalpine/Upper Montane Riparian Mesic 3601047 N R Mt Mesic Montane Mixed Conifer Forest Mesic 3351154 Inter-Mountain Basins Montane Riparian Systems Mesic 3331062 Inter-Mt. Basins Mahogany Woodland Mesic 3321011 R Mt. Aspen Forest and Woodland Mesic 3301106 N R Mt Montane-Foothill Deciduous Shrubland Other 3461139 N R Mt Lower Montane-Foothill-Valley Grassland Other 3441145 R Mt. Subalpine-Montane Mesic Meadow Other 34231 Barren-Rock/Sand/Clay Other 333
v www.esajournals.org 10 January 2015 v Volume 6(1) v Article 17
BIRCH ET AL.
and similar to Dillon et al. (2011), we found thatwhile variables reflecting meteorological andclimatic conditions were important, local, ‘‘bot-tom-up’’ controls reflecting topography andvegetation more strongly influenced burn sever-ity.
Wind did not highly influence dNBR-indicatedburn severity in the ‘‘all points’’ analysis, thoughit was important for burn severity in the verylargest daily areas burned, likely reflecting theimportance of wind in influencing fire spreadand size. This surprised us because sustainedcrown fires that can result in tree mortality areusually associated with wind (Van Wagner 1977).Wind is a common factor in both fire extent andfire behavior (Beer 1991, Bessie and Johnson
1995) especially in dry fuels (Cruz and Alexander2010). Neither wind direction nor speed contrib-uted highly to burn severity in our ‘‘all points’’analysis (see Appendix G for analysis using 30-mscale wind data using WindNinja) even thoughboth increase fire intensity (Rothermel 1972). Forthe 99.5th percentile of daily areas burned, windwas third in order of variable importance,consistent with the very high intensity of wind-driven fires. The lack of wind as a significantcontributing factor to burn severity in our ‘‘allpoints’’ analysis is consistent with what Dillon etal. (2011) found, but it is possible that the spatialand temporal resolution of our wind data,though better matched, is still too coarse orinaccurate, as we don’t know the concurrent
Fig. 5. Random Forest partial dependence plots of Existing Vegetation Cover and Slope-Cosine-Aspect Index
for ‘‘all points’’ (dotted line) and points within ‘‘large fire growth’’ (solid line). Partial dependence plots show the
dependence of the regression function (Fj (Xj)) on the predictor while holding all others at their mean. Use relative
range of y-axis values to compare between ‘‘all points’’ and ‘‘large fire growth’’ lines. Existing Vegetation Cover
had about the same influence on burn severity between ‘‘large fire growth’’ and ‘‘all points’’, while steeper or
more northern aspects had more influence during ‘‘large fire growth’’.
v www.esajournals.org 11 January 2015 v Volume 6(1) v Article 17
BIRCH ET AL.
wind conditions at the time when a particularpoint burned. Further, our data on prevailingwind do not consistently reflect the interactionbetween fire and wind. The lack of a relationshipbetween wind attributes and both RdNBR(Dillon et al. 2011) and dNBR (this study) couldalso be due to the selection of dNBR-type burnseverity metrics; given its applicability is limitedto the spatial scale of the Landsat imagery (i.e., 303 30 m pixels) and to only capturing broadspectral changes in vegetation and soil cover.Potentially, non-remote sensing measures of burnseverity (e.g., field based measures of the heightof bole char and crown scorch on individualtrees) could lead to improved connections withwind direction and speed.
Parks et al. (2014) found that burn severity-inferred dNBR increased with greater fuelamount and fuel moisture. Thus, we expectedduff and 1000-hr fuel moisture to influence burn
severity, for they reflect long-term drying whichcould result in large areas with a majority ofbiomass dry enough to be consumed in fires(Meyn et al. 2007, Krawchuk and Moritz 2011).Four of our top eight predictor variables are ameasure of moisture content, whether air (RH) orvegetation (Duff or Fine Fuel Code). These manydifferent forms of moisture content may accountfor changes in burn severity. Higher moisturecontent, especially Maximum RH, which weinterpret as night-time RH recovery, may limitsmoldering combustion (Ferguson et al. 2002)which influences burn severity (Wade 1993,Sackett et al. 1996).
Understanding the relative importance of thedrivers of burn severity will require furtherresearch. Environmental variables, especiallywind, interact to influence fire behavior (Bessieand Johnson 1995). Within our analysis therewere a large number of predictors and many
Fig. 6. Predictor importance of 11 factors of dNBR, for 4,113 observations in daily areas burned larger than 600
ha, as explained in an optimal model provided by Random Forest regression trees. ‘‘Percentile’’ predictors are
considered climate and calculated as the percentile from the 34 year mean for day of observation for summer fire
months: July, August, and September.
v www.esajournals.org 12 January 2015 v Volume 6(1) v Article 17
BIRCH ET AL.
potential interactions. Perhaps the lack of dom-inance by a single group of predictors (topogra-phy, vegetation, climate, or weather) ininfluencing burn severity reflects the differentpotential causes of burn severity among themany different types of vegetation that the firesburned across and the number of IR progressiondays that we were able to use for weather andclimate observations. While dNBR is more oftencorrelated with overstory tree mortality (Cocke etal. 2005, Hudak et al. 2007), it also reflects soileffects (Lewis et al. 2006). Possibly, these differentaspects of burn severity are influenced bydifferent environmental characteristics and thusmay explain why we see the intermixing ofpredictor variable types. Soil burn severity(Parson et al. 2010) may be more influenced byduff consumption and soil heating (Ice et al.2004) while overstory tree scorch and crownconsumption might be tied more to flame lengthand intensity (Rothermel 1972). In a recentreview, Morgan et al. (2014) recommend definingdifferent burn severity indices depending onpurpose; this may help to sort out the influenceof environmental factors on burn severity.
Burn severity may also be controlled by pre-fire and post-fire conditions such as winter snowfall and conditions of the next growing season,which may have greater influence on severitythen do conditions that occurred on the day thearea was burned. Drying and warming trendsdays before an area burned also likely influenceburn severity and are reflected in the fire dangerindices. Hudak et al. (2011) found that weatherup to 5 days before was significant in predictingdaily area burned. Further, our fires were alllarger than 405 ha and had escaped initial firesuppression actions or were managed withlimited suppression. Fires that were containedor areas of fires that were initially suppressedmay have different factors that contributed toburn severity. Previous fires that occurred butwere not accounted for in changes in vegetationdata layers may also have a moderating effect onburn severity (Parks et al. 2013), and priordisturbances including bark beetles and loggingwere not considered. We also did not account forthe effects of fire suppression tactics such asburnouts or large backfires. These could signif-icantly alter patterns and intensities of fireactivity (Backer et al. 2004), but detailed data
on locations of tactics applied is difficult toobtain. While these tactics are used for publicand firefighter safety and to limit future firegrowth, they may influence both burn severityand direction of fire spread.
LimitationsWe constrained our sampling to forested areas
within the northern Rockies. Areas of non-forestand those forested areas outside the northernRockies may likely have different interactionsbetween the factors contributing to burn severitythat would be specific to that area, due toweather or climate, and for that type of ecosys-tem, due to vegetation characteristics. Our datawere sampled at both 30-m and 4-km spatialscales which could have influenced our findings.The coarse scale of our weather and fire dangerpredictor variables (4 km) does not represent themicroclimate gradients that might drive burnseverity. Namely, many of the random points weselected occurred within common voxels therebylimiting the explanatory power of weather andfire danger indices to explain heterogeneity inburn severity. The LANDFIRE (Landfire 2013)data also contain errors, and we did not havefield data to verify vegetation classification andcover percentage. At the scale of individual 30-mpixels, LANDFIRE existing vegetation data mayonly be approximately 60% accurate (Swetnamand Brown 2010), and cannot capture finer-scalevegetation heterogeneity (,30 m) that may alsodrive burn severity. The vegetation data, howev-er, is at the same spatial resolution as ourtopographic predictors and dNBR.
Our topographic predictor variables match thespatial scale of dNBR (30 m) observations whichmay account for them being placed higher inimportance rankings. Random Forest analysesare more selective of predictors with morecategories and continuous data (Strobl et al.2007, 2009). Our dataset contains both types ofdata, with our analysis showing intermixing ofpredictor data types within the importancerankings.
ImplicationsIn contrast to the strong influence of fire
danger indices, weather, and climate on fireextent (Littell et al. 2009, Abatzoglou and Kolden2013), ‘‘bottom-up’’ factors such as topography
v www.esajournals.org 13 January 2015 v Volume 6(1) v Article 17
BIRCH ET AL.
and vegetation have the most influence on burnseverity, even on the largest daily areas burnedon the largest fires. While climate and weathercertainly interact with the landscape to affectburn severity, pre-fire vegetation conditions dueto prior disturbance and management stronglyaffect vegetation response even when large areasburn quickly. Over a third of the predictors thatinfluenced forest burn severity are weather andfire danger indices. This suggests that burnseverity may be somewhat sensitive to projectedchanges in climate (IPCC 2013), and to the degreethat climate does change, burn severity maychange as well (Miller et al. 2009). The effects of awarming climate on burn severity may even beindirect as suggested by van Mantgem et al.(2013), if trees become stressed by warmertemperatures and thus more susceptible to beingkilled by fire. However, while fire extent isstrongly influenced by climate and weather, ourfindings and those of Dillon et al. (2011) indicatethat the ecological effects of fire are relatively lesssensitive to climate and influenced by vegetationcover and topography. Over the last century, firesuppression actions have increased amounts ofboth dead and living vegetation throughout thewestern United States (Barrett et al. 1991, Arno etal. 1997) and changed forest composition (Arnoet al. 1995, 1997, Keane et al. 1996). Such changesin vegetation conditions can lead to uncharacter-istic burn severity (Quigley et al. 1996, Barbou-letos et al. 1998), but they can sometimes bereversed through fire and fuels management thatreduces fuels available to future fires. Informa-tion about thresholds of burn severity like we seefor vegetation cover and topographic setting (Fig.5) can inform fuels management across land-scapes. Based on our results, we would expectthat strategically managing fuels for lowervegetation cover would lead to less severe fireeffects when fire does occur, especially on thelower and warmer landscape facets and in dryforests that experienced frequent fire historically.On other landscape facets, such as north-facingslopes, perhaps we can accept severe fires asthere may be operational and ecological (Hutto2008) reasons why we cannot or should not limitseverity on these sites. Even when large firesburn large areas in a single day, burn severityvaries (Birch et al. 2014), creating a mosaic thatcan provide ecosystem services valued by society.
CONCLUSION
Vegetation and topography were more impor-tant influences on burn severity than weatherand fire danger indices for 353 daily areas burnedacross 42 large forest fires. Thus our findingssupport those of Dillon et al. (2011), though ourswere at daily temporal resolution. While thiscould still reflect a mismatch in temporal andspatial scales between burn severity and topog-raphy data versus weather data and fire dangerindices, our findings clearly suggest that localvegetation conditions and topography influencethe ecological effects of fires, even for large forestfires and for days on which large areas burn in ashort time. If so, as the climatic, vegetation, andfuels conditions in Northern Rockies forestschange, the implications for burn severity maybe quite different than the implications for fireextent, with concomitant implications on the fireand fuels management strategies that could mosteffectively foster the ecosystem processes andecosystem services valued by society.
ACKNOWLEDGMENTS
This research was supported by the NationalAeronautics and Space Administration (NASA) awardNNX11AO24G, and by the University of Idaho. Wethank the Monitoring Trends in Burn Severity projectand National Infrared Operations (NIROPS, www.nir-ops. fs.fed.us) personnel for data and technicalassistance. Birch completed analysis and writing, withcontributions from all other authors.
LITERATURE CITED
Abatzoglou, J. T. 2013. Development of griddedsurface meteorological data for ecological applica-tions and modeling. International Journal ofClimatology doi: 10.1002/joc.3413
Abatzoglou, J. T., and C. A. Kolden. 2013. Relation-ships between climate and macroscale area burnedin the western United States. International Journalof Wildland Fire 22:1003–1020.
Arno, S. F., J. H. Scott, and M. G. Hartwell. 1995. Age-class structure of old growth ponderosa pine/Douglas-fir stands and its relation-ship to firehistory. Research Paper INT-481. USDA ForestService, Intermountain Forest and Range Experi-ment Station, Ogden, Utah, USA.
Arno, S. F., H. Y. Smith, and M. A. Krebs. 1997. Oldgrowth ponderosa pine and western larch standstructures: Influences of pre-1900 fires and fire
v www.esajournals.org 14 January 2015 v Volume 6(1) v Article 17
BIRCH ET AL.
exclusion. Research Paper INT-495. USDA ForestService, Intermountain Forest and Range Experi-ment Station, Ogden, Utah, USA.
Backer, D. M., S. E. Jensen, and G. R. McPherson. 2004.Impacts of fire-suppression activities on naturalcommunities. Conservation Biology 18(4):37–946.
Barbouletos, C. S., L. Z. Morelan, and F. C. Carroll.1998. We will not wait: why prescribed fire must beimplemented on the Boise National Forest. Pages27–30 in: T. L. Pruden and L. A. Brennan, editors.Fire in ecosystem management: shifting the para-digm from suppression to prescription. Tall Tim-bers Fire Ecology Conference Proceedings Number20. Tall Timbers Research Station, Tallahassee,Florida, USA.
Barrett, K., E. S. Kasischke, A. D. McGuire, M. R.Turetsky, and E. S. Kane. 2010. Modeling fireseverity in black spruce stands in the Alaskanboreal forest using spectral and non-spectral geo-spatial data. Remote Sensing of Environment114(7):1494–1503.
Barrett, S. W., S. F. Arno, and C. H. Key. 1991. Fireregimes of western larch-lodgepole pine forests inGlacier National Park, Montana. Canadian JournalForest Research 21:1711–1720.
Beer, T. 1991. The interaction of wind and fire.Boundary-Layer Meteorology 54(3):287–308.
Bessie, W. C., and E. A. Johnson. 1995. The relativeimportance of fuels and weather on fire behavior insubalpine forests. Ecology 76:747–762.
Birch, D. S., P. Morgan, C. A. Kolden, A. T. Hudak, andA. M. S. Smith. 2014. Is proportion burned severelyrelated to daily area burned? EnvironmentalResearch Letters 9:064011.
Bond, W. J., F. I. Woodward, and G. F. Midgley. 2004.The global distribution of ecosystems in a worldwithout fire. New Phytologist 165(2):525–5238.
Bowman, D. et al. 2009. Fire in the Earth System.Science 324:481–484.
Breiman, L. 2001. Random forests. Machine Learning45:5–32.
Butry, D. T., E. D. Mercer, J. P. Prestemon, J. M. Pye,and T. P. Holmes. 2001. What is the price ofcatastrophic wildfire? Journal of Forestry 99:9–17.
Christensen, N. L., et al. 1989. Interpreting theYellowstone fires of 1988. BioScience 39(10):678–685.
Cocke, A. E., P. Z. Fule, and J. E. Cruse. 2005.Comparison of burn severity assessments usingDifferenced Normalized Burn Ratio and grounddata. International Journal of Wildland Fire 14:189–198.
Cruz, M. G., and M. E. Alexander. 2010. Assessingcrown fire potential in coniferous forests of westernNorth America: a critique of current approachesand recent simulation studies. International Journalof Wildland Fire 19(4):377–398.
Cutler, D. R., T. C. Edwards, K. H. Beard, A. Cutler,K. T. Hess, J. Gibson, and J. J. Lawler. 2007.Random forests for classification in ecology. Ecol-ogy 88:2783–2792.
De’ath, G., and K. E. Fabricius. 2000. Classification andregression trees: a powerful yet simple techniquefor ecological data analysis. Ecology 81:3178–3192.
Deeming, J. E., R. E. Burgan, and J. D. Cohen. 1977. TheNational Fire-Danger Rating System—1978. USDAForest Service General Technical Report INT-39.USDA Forest Service, Intermountain Forest andRange Experiment Station, Ogden, Utah, USA.
De Santis, A., and E. Chuvieco. 2009. GeoCBI: Amodified version of the Composite Burn Index forthe initial assessment of the short-term burnseverity from remotely sensed data. Remote Sens-ing of Environment 113(3):554–562.
Diaz-Delgado, R., F. Lloret, and X. Pon. 2003. Influenceof fire severity on plant regeneration by means ofremote sensing imagery. International Journal ofRemote Sensing 24(8):1751–1763.
Dillon, G. K., Z. A. Holden, P. Morgan, M. A. Crimins,E. K. Heyerdahl, and C. Luce. 2011. Both topogra-phy and climate affected forest and woodland burnseverity in two regions of the western US, 1984-2006. Ecosphere 2(12):130.
Eidenshink, J., B. Schwind, K. Brewer, Z.-L. Zhu, B.Quayle, and S. Howard. 2007. A project formonitoring trends in burn severity. Fire Ecology3:3–21.
Ferguson, S. A., J. E. Ruthford, S. J. McKay, D. Wright,C. Wright, and R. Ottmar. 2002. Measuringmoisture dynamics to predict fire severity inlongleaf pine forests. International Journal ofWildland Fire 11(4):267–279.
Forthofer, J. M., B. W. Butler, K. S. Shannon, M. A.Finney, L. S. Bradshaw, and R. Stratton. 2003.Predicting surface winds in complex terrain for usein fire spread models. in Proceedings of the FifthSymposium on Fire and Forest Meteorology andSecond Wildland Fire Ecology and Fire Manage-ment Congress, 16-20 November 2002, Orlando,Florida. American Meteorological Society, Wash-ington, D.C., USA.
French, N. H. F., E. S. Kasischke, R. J. Hall, L. A.Murphy, D. L. Verbyla, E. E. Hoy, and J. L. Allen.2008. Using Landsat data to assess fire and burnseverity in the North American boreal forestregion: an overview and summary of results.International Journal of Wildland Fire 17:443–462.
Goetz, S. J., M. C. Mack, K. R. Gurney, J. T. Randerson,and R. A. Houghton. 2007. Ecosystem responses torecent climate change and fire disturbance atnorthern high latitudes: observations and modelresults contrasting northern Eurasia and NorthAmerica. Environmental Research Letters2(4):045031.
v www.esajournals.org 15 January 2015 v Volume 6(1) v Article 17
BIRCH ET AL.
Hanson, C. T., and D. C. Odion. 2013. Is fire severityincreasing in the Sierra Nevada, California, USA?International Journal of Wildland Fire 23:1–8.
Heyerdahl, E. K., L. B. Brubaker, and J. K. Agee. 2002.Annual and decadal climate forcing of historicalfire regimes in the interior Pacific Northwest, USA.Holocene 12(5):597–604.
Heyerdahl, E. K., P. Morgan, and J. P. Riser. 2008.Multi-season climate synchronized historical firesin dry forests (1650-1900), northern Rockies, USA.Ecology 89(3):705–716.
Holden, Z. A., P. Morgan, and J. S. Evans. 2009. Apredictive model of burn severity based on 20-yearsatellite-inferred burn severity data in a largesouthwestern US wilderness area. Forest Ecologyand Management 258(11):2399–2406.
Hudak, A. T., P. Morgan, M. J. Bobbitt, A. M. S. Smith,S. A. Lewis, L. B. Lentile, P. R. Robichaud, J. T.Clark, and R. A. McKinley. 2007. The relationshipof multispectral satellite imagery to immediate fireeffects. Fire Ecology 3(1):64–90.
Hudak, A. T., I. Rickert, P. Morgan, E. Strand, S. A.Lewis, P. R. Robichaud, C. Hoffman, and Z. A.Holden. 2011. Review of fuel treatment effective-ness in forests and rangelands and a case studyfrom the 2007 megafires in central, Idaho, USA.General Technical Report RMRS-GTR-252. USDAForest Service, Rocky Mountain Research Station,Fort Collins, Colorado, USA.
Hutto, R. L. 2008. The ecological importance of severewildfires: some like it hot. Ecological Applications18(8):1827–1834.
Ice, G. G., D. G. Neary, and P. W. Adams. 2004. Effectsof wildfire on soils and watershed processes.Journal of Forestry 102(6):16–20.
IPCC. 2013. Working Group I Contribution to the IPCCFifth Assessment Report (AR5), Climate Change2013: The Physical Science Basis. Intergovernmen-tal Panel on Climate Change, Geneva, Switzerland.
Jianwen, M., L. Xiaowen, C. Xue, and F. Chun. 2006.Target adjacency effect estimation using groundspectrum measurement and Landsat-5 satellitedata. IEEE Transactions on Geoscience and RemoteSensing 44(3):729–735.
Jones, B. M., C. A. Kolden, R. Jandt, J. T. Abatzoglou, F.Urban, and C. D. Arp. 2009. Fire behavior, weather,and burn severity of the 2007 Anaktuvuk Rivertundra fire, North Slope, Alaska. Arctic, Antarctic,and Alpine Research 41(3):309–316.
Kashian, D. M., W. H. Romme, D. B. Tinker, M. G.Turner, and M. G. Ryan. 2006. Carbon storage onlandscapes with stand-replacing fires. BioScience56(7):598–606.
Keane, R. E., K. C. Ryan, and S. W. Running. 1996.Simulating effects of fire on northern RockyMountain landscapes with the ecological processmodel FIRE-BGC. Tree Physiology 16:319–331.
Key, C. H. 2006. Ecological and sampling constraintson defining landscape fire severity. Fire Ecology2:178–203.
Key, C. H., and N. C. Benson. 2006. Landscapeassessment. Pages 1–55 in FIREMON: Fire effectsmonitoring and inventory system. General Techni-cal Report RMRS-GTR-164-CD. USDA Forest Ser-vice, Rocky Mountain Research Station, FortCollins, Colorado, USA.
Kotliar, N. B., S. Simonson, G. Chong, and D.Theobald. 2003. Ecological effects of the HaymanFire – Part 8: Effects on species of concern. Pages250–262 in R. T. Graham, editor. Hayman Fire CaseStudy. General Technical Report RMRS-GTR-114.USDA Forest Service, Rocky Mountain ResearchStation, Fort Collins, Colorado, USA.
Krawchuk, M. A., and M. A. Moritz. 2011. Constraintson global fire activity vary across a resourcegradient. Ecology 92:121–132.
Landfire. 2013. Homepage of the LANDFIRE Program.USDA Forest Service and USDI October 19, 2013.http://www.landfire.gov/index.php
Lannom, K. O., W. T. Tinkham, A. M. S. Smith, J.Abatzoglou, B. A. Newingham, T. E. Hall, P.Morgan, E. K. Strand, T. B. Paveglio, J. W.Anderson, and A. M. Sparks. 2014. Definingextreme wildland fires using geospatial and ancil-lary metrics. International Journal of Wildland Fire23:322–337.
Lentile, L. B., Z. A. Holden, A. M. S. Smith, M. J.Falkowski, A. T. Hudak, P. Morgan, S. A. Lewis,P. E. Gessler, and N. C. Benson. 2006. Remotesensing techniques to assess active fire characteris-tics and post-fire effects. International Journal ofWildland Fire 15:319–345.
Lentile, L. B., P. Morgan, A. T. Hudak, M. J. Bobbitt,S. A. Lewis, A. M. S. Smith, and P. R. Robichaud.2007. Post-fire burn severity and vegetation re-sponse following eight large wildfires across thewestern United States. Fire Ecology 3(1):91–108.
Lentile, L. B., A. M. S. Smith, A. T. Hudak, P. Morgan,M. J. Bobbitt, S. A. Lewis, and P. R. Robichaud.2009. Remote sensing for prediction of 1-year post-fire ecosystem condition. International Journal ofWildland Fire 18(5):594–608.
Lewis, S. A., J. Q. Wu, and P. R. Robichaud. 2006.Assessing burn severity and comparing soil waterrepellency, Hayman Fire, Colorado. HydrologicalProcesses 20:1–16.
Liaw, A., and M. Wiener. 2002. Classification andregression by random forest. R News: the News-letter of the R Project 2(3):18–22.
Littell, J. S., D. McKenzie, D. L. Peterson, and A. L.Westerling. 2009. Climate and wildfire area burnedin western U.S. ecoprovinces, 1916-2003. EcologicalApplications 19:1003–1021.
Mallek, C., H. Safford, J. Viers, and J. Miller. 2013.
v www.esajournals.org 16 January 2015 v Volume 6(1) v Article 17
BIRCH ET AL.
Modern departures in fire severity and area varyby forest type, Sierra Nevada and southernCascades, California, USA. Ecosphere 4(12):153.
Mann, H. B., and D. R. Whitney. 1947. On a test ofwhether one of two random variables is stochasti-cally larger than the other. Annals of MathematicalStatistics 50–60.
McCune, B., and D. Keon. 2002. Equations for potentialannual direct incident radiation and heat load.Journal of Vegetation Science 13:603–606.
Meyn, A., P. S. White, C. Buhk, and A. Jentsch. 2007.Environmental drivers of large infrequent wild-fires: the emerging conceptual model. Progress inPhysical Geography 31:287–312.
Miller, C., and D. L. Urban. 2000. Modeling the effectsof fire management alternatives on Sierra Nevadamixed-conifer forests. Ecological Applications10(1):85–94.
Miller, J. D., and H. Safford. 2012. Trends in wildfireseverity: 1984 to 2010 in the Sierra Nevada, ModocPlateau, and southern Cascades, California, USA.Fire Ecology 8(3):41–57.
Miller, J. D., H. D. Safford, M. Crimmins, and A. E.Thode. 2009. Quantitative evidence for increasingforest fire severity in the Sierra Nevada andsouthern Cascade Mountains, California and Ne-vada, USA. Ecosystems 12(1):16–32.
Miller, J. D., and A. E. Thode. 2007. Quantifying burnseverity in a heterogeneous landscape with arelative version of the delta Normalized Burn Ratio(dNBR). Remote Sensing of Environment109(1):66–80.
Moore, I. D., P. Gessler, G. A. Nielsen, and G. A.Peterson. 1993. Terrain attributes: estimation meth-ods and scale effects. Pages 189–214 in A. J.Jakeman, M. B. Beck, and M. McAleer, editors.Modeling change in environmental systems. Wiley,London, UK.
Morgan, P., C. C. Hardy, T. W. Swetnam, M. G. Rollins,and D. G. Long. 2001. Mapping fire regimes acrosstime and space: understanding coarse and fine-scale fire patterns. International Journal of Wild-land Fire 10:329–342.
Morgan, P., E. K. Heyerdahl, and C. E. Gibson. 2008.Multi-season climate synchronized forest firesthroughout the 20th century, northern Rockies,USA. Ecology 89(3):717–728.
Morgan, P., R. E. Keane, G. K. Dillon, T. B. Jain, A. T.Hudak, E. C. Karau, P. G. Sikkink, Z. A. Holden,and E. K. Strand. 2014. Challenges of assessing fireand burn severity using field measures, remotesensing and modeling. International Journal ofWildland Fire 23(8):1045–1060.
Moritz, M. A., M.-A. Parisien, E. Batllori, M. A.Krawchuk, J. Van Dorn, D. J. Ganz, and K. Hayhoe.2012. Climate change and disruptions to global fireactivity. Ecosphere 3:49.
NatureServe. 2011. International ecological classifica-tion standard: Terrestrial ecological classifications.NatureServe Central Databases, Arlington, Virgin-ia, USA.
Otterman, J., and R. S. Fraser. 1979. Adjacency effectson imaging by surface reflection and atmosphericscattering: Cross radiance to zenith. Applied Optics18:2852–2860.
Ottmar, R. D., D. V. Sandberg, C. L. Riccardi, and S. J.Prichard. 2007. An overview of the Fuel Charac-teristic Classification System: Quantifying, classify-ing, and creating fuelbeds for resource planning.Special Forum on the Fuel Characteristic Classifi-cation System. Canadian Journal of Forest Research37(12):2383–2393.
Parks, S. A., C. Miller, C. R. Nelson, and Z. A. Holden.2013. Previous fires moderate burn severity ofsubsequent wildland fires in two large western USwilderness areas. Ecosystems 17(1):29–42.
Parks, S. A., M.-A. Parisien, C. Miller, and S. Z.Dobrowski. 2014. Fire activity and severity in thewestern US vary along proxy gradients represent-ing fuel amount and fuel moisture. PLoS ONE9(6):e99699.
Parson, A., P. R. Robichaud, S. A. Lewis, C. Napper,and J. T. Clark. 2010. Field guide for mapping post-fire soil burn severity. General Technical ReportRMRS-GTR-243. USDA Forest Service, RockyMountain Research Station, Fort Collins, Colorado,USA.
Pike, R. J., and S. E. Wilson. 1971. Elevation relief ratio,hypsometric integral and geomorphic area altitudeanalysis. Bulletin of the Geological Society ofAmerica 82:1079–1084.
Quigley, T., W. Haynes, and R. T. Graham. 1996.Technical editors. Integrated scientific assessmentfor ecosystem management in the Interior Colum-bia Basin. General Technical Report PNW-382.USDA Forest Service, Pacific Northwest ResearchStation, Portland, Oregon, USA.
R Core Team. 2014. R: A language and environmentfor statistical computing. R Foundation for Statis-tical Computing, Vienna, Austria.
Riccardi, C. L., R. D. Ottmar, D. V. Sandberg, A.Andreu, E. Elman, K. Kopper, and J. Long. 2007.The fuelbed: a key element of the Fuel Character-istic Classification System. Canadian Journal ofForest Research 37(12):2394–2412.
Roberts, D. W., and S. V. Cooper. 1989. Concepts andtechniques of vegetation mapping. Pages 90–96 inD. Ferguson, P. Morgan, and F. D. Johnson, editors.Land classifications based on vegetation: applica-tions for resource management. General TechnicalReport INT-GTR-257. USDA Forest Service, Inter-mountain Research Station, Ogden, Utah, USA.
Rollins, M. G. 2009. LANDFIRE: a nationally consis-tent vegetation, wildland fire, and fuel assessment.
v www.esajournals.org 17 January 2015 v Volume 6(1) v Article 17
BIRCH ET AL.
International Journal of Wildland Fire 18(3):235–249.
Romme, W. H., M. S. Boyce, R. Gresswell, E. H. Merrill,G. W. Minshall, C. Whitlock, and M. G. Turner.2011. Twenty years after the 1988 Yellowstone fires:lessons about disturbance and ecosystems. Ecosys-tems 14(7):1196–1215.
Romme, W. H., and D. H. Knight. 1981. Fire frequencyand subalpine forest succession along a topograph-ic gradient in Wyoming. Ecology 62(2):319–326.
Rothermel, R. C. 1972. A mathematical model forpredicting fire spread in wildland fuels. ResearchPaper INT-115. USDA Forest Service, Intermoun-tain Forest and Range Experiment Station, Ogden,Utah, USA.
Sackett, S. S., S. M. Haase, and M. G. Harrington. 1996.Lessons learned from fire use for restoring south-western ponderosa pine ecosystems. Pages 54–61in W. W. Covington and P. K. Wagner, editors.Conference on adaptive ecosystem restoration andmanagement: restoration of Cordilleran coniferlandscapes of North America, Flagstaff, Arizona,June 6–8, 1996. General Technical Report RM-278.USDA Forest Service, Rocky Mountain Forest andRange Experiment Station, Fort Collins, Colorado,USA.
Smith, A. M. S., J. U. Eitel, and A. T. Hudak. 2010.Spectral analysis of charcoal on soils: implicationsfor wildland fire severity mapping methods.International Journal of Wildland Fire 19(7):976–983.
Smith, A. M. S., L. B. Lentile, A. T. Hudak, and P.Morgan. 2007. Evaluation of linear spectral unmix-ing and DNBR for predicting post-fire recovery in aNorth American ponderosa pine forest. Interna-tional Journal of Remote Sensing 28(22):5159–5166.
Smith, A. M. S., M. J. Wooster, N. A. Drake, F. M.Dipotso, K. J. Falkowski, and A. T. Hudak. 2005.Testing the potential of multispectral remotesensing for retrospectively estimating fire severityin African savanna environments. Remote Sensingof Environment 97(1):92–115.
Soverel, N. O., D. D. B. Perrakis, and N. C. Coops.2010. Estimating burn severity from Landsat dNBRand RdNBR indices across western Canada. Re-mote Sensing of Environment 114:1896–1909.
Spracklen, D. V., L. J. Mickley, J. A. Logan, R. C.Hudman, R. Yevich, M. D. Flannigan, and A. L.Westerling. 2009. Impacts of climate change from2000 to 2050 on wildfire activity and carbonaceousaerosol concentrations in the western United States.Journal of Geophysical Research: Atmospheres
(1984–2012) 114:D20.Stage, A. R. 1976. Notes: An expression for the effect of
aspect, slope, and habitat type on tree growth.Forest Science 22:457–460.
Strobl, C., A. L. Boulesteix, A. Zeileis, and T. Hothorn.2007. Bias in random forest variable importancemeasures: Illustrations, sources and a solution.BMC Bioinformatics 8(1):25.
Strobl, C., T. Hothorn, and A. Zeileis. 2009. Party on! Anew, conditional variable-importance measure forrandom forests available in the party package. TheR Journal 1:14–17.
Swetnam, T. W., and P. Brown. 2010. Comparingselected fire regime condition class (FRCC) andLANDFIRE vegetation model results with tree-ringdata. International Journal of Wildland Fire19(1):1–13.
van Mantgem, P. J., J. C. B. Nesmith, M. Keifer, E. E.Knapp, A. Flint, and L. Flint. 2013. Climatic stressincreases forest fire severity across the westernUnited States. Ecology Letters 16:1151–1156.
Van Wagner, C. E. 1977. Conditions for the start andspread of crown fire. Canadian Journal of ForestResearch 7(1):23–34.
Van Wagner, C. E. 1987. Development and structure ofthe Canadian forest fire weather index system.Forestry Technical Report Volume 35. CanadianForestry Service, Ottawa, Ontario, Canada.
Van Wagtendonk, J. W., R. R. Root, and C. H. Key.2004. Comparison of AVIRIS and Landsat ETMþdetection capabilities for burn severity. RemoteSensing of Environment 92(3):397–408.
Wade, D. D. 1993. Thinning young loblolly pine standswith fire. International Journal of Wildland Fire3:169–178.
Weiss, A. 2001. Topographic position and landformanalysis. ESRI User Conference, San Diego, Cal-ifornia, USA.
Wells, A. A. 2013. Multidecadal trends in burn severityand patch size in the Selway-Bitterroot WildernessArea 1900-2007. Thesis. University of Idaho,Moscow, Idaho.
Westerling, A. L. 2008. Climatology for wildfiremanagement. Pages 107–122 in T. P. Holmes, editor.The economics of forest disturbances: wildfires,storms, and invasive species. Springer, Amsterdam,The Netherlands.
Westerling, A. L., G. H. Hidalgo, D. R. Cayan, andT. W. Swetnam. 2006. Warming and earlier springincrease western US forest wildfire activity. Science313:940–943.
v www.esajournals.org 18 January 2015 v Volume 6(1) v Article 17
BIRCH ET AL.
SUPPLEMENTAL MATERIAL
APPENDIX A
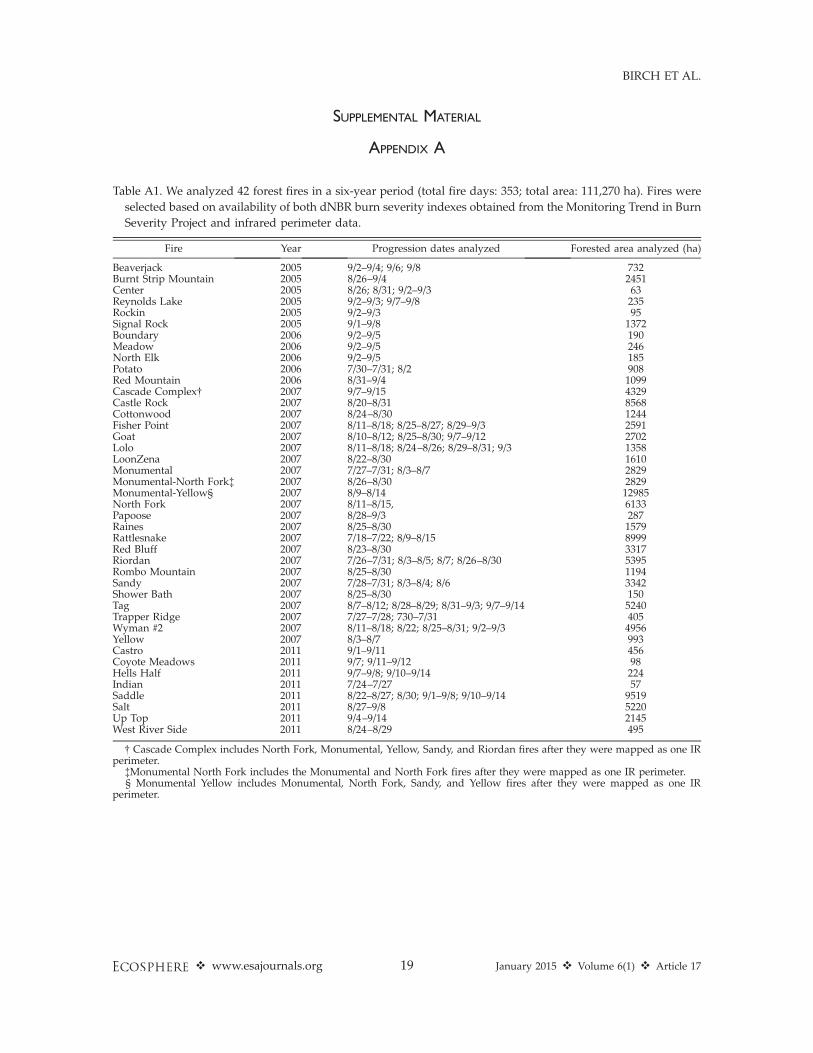
Table A1. We analyzed 42 forest fires in a six-year period (total fire days: 353; total area: 111,270 ha). Fires were
selected based on availability of both dNBR burn severity indexes obtained from the Monitoring Trend in Burn
Severity Project and infrared perimeter data.
Fire Year Progression dates analyzed Forested area analyzed (ha)
Beaverjack 2005 9/2–9/4; 9/6; 9/8 732Burnt Strip Mountain 2005 8/26–9/4 2451Center 2005 8/26; 8/31; 9/2–9/3 63Reynolds Lake 2005 9/2–9/3; 9/7–9/8 235Rockin 2005 9/2–9/3 95Signal Rock 2005 9/1–9/8 1372Boundary 2006 9/2–9/5 190Meadow 2006 9/2–9/5 246North Elk 2006 9/2–9/5 185Potato 2006 7/30–7/31; 8/2 908Red Mountain 2006 8/31–9/4 1099Cascade Complex� 2007 9/7–9/15 4329Castle Rock 2007 8/20–8/31 8568Cottonwood 2007 8/24–8/30 1244Fisher Point 2007 8/11–8/18; 8/25–8/27; 8/29–9/3 2591Goat 2007 8/10–8/12; 8/25–8/30; 9/7–9/12 2702Lolo 2007 8/11–8/18; 8/24–8/26; 8/29–8/31; 9/3 1358LoonZena 2007 8/22–8/30 1610Monumental 2007 7/27–7/31; 8/3–8/7 2829Monumental-North Fork� 2007 8/26–8/30 2829Monumental-Yellow§ 2007 8/9–8/14 12985North Fork 2007 8/11–8/15, 6133Papoose 2007 8/28–9/3 287Raines 2007 8/25–8/30 1579Rattlesnake 2007 7/18–7/22; 8/9–8/15 8999Red Bluff 2007 8/23–8/30 3317Riordan 2007 7/26–7/31; 8/3–8/5; 8/7; 8/26–8/30 5395Rombo Mountain 2007 8/25–8/30 1194Sandy 2007 7/28–7/31; 8/3–8/4; 8/6 3342Shower Bath 2007 8/25–8/30 150Tag 2007 8/7–8/12; 8/28–8/29; 8/31–9/3; 9/7–9/14 5240Trapper Ridge 2007 7/27–7/28; 730–7/31 405Wyman #2 2007 8/11–8/18; 8/22; 8/25–8/31; 9/2–9/3 4956Yellow 2007 8/3–8/7 993Castro 2011 9/1–9/11 456Coyote Meadows 2011 9/7; 9/11–9/12 98Hells Half 2011 9/7–9/8; 9/10–9/14 224Indian 2011 7/24–7/27 57Saddle 2011 8/22–8/27; 8/30; 9/1–9/8; 9/10–9/14 9519Salt 2011 8/27–9/8 5220Up Top 2011 9/4–9/14 2145West River Side 2011 8/24–8/29 495
� Cascade Complex includes North Fork, Monumental, Yellow, Sandy, and Riordan fires after they were mapped as one IRperimeter.
�Monumental North Fork includes the Monumental and North Fork fires after they were mapped as one IR perimeter.§ Monumental Yellow includes Monumental, North Fork, Sandy, and Yellow fires after they were mapped as one IR
perimeter.
v www.esajournals.org 19 January 2015 v Volume 6(1) v Article 17
BIRCH ET AL.
APPENDIX B
APPENDIX C
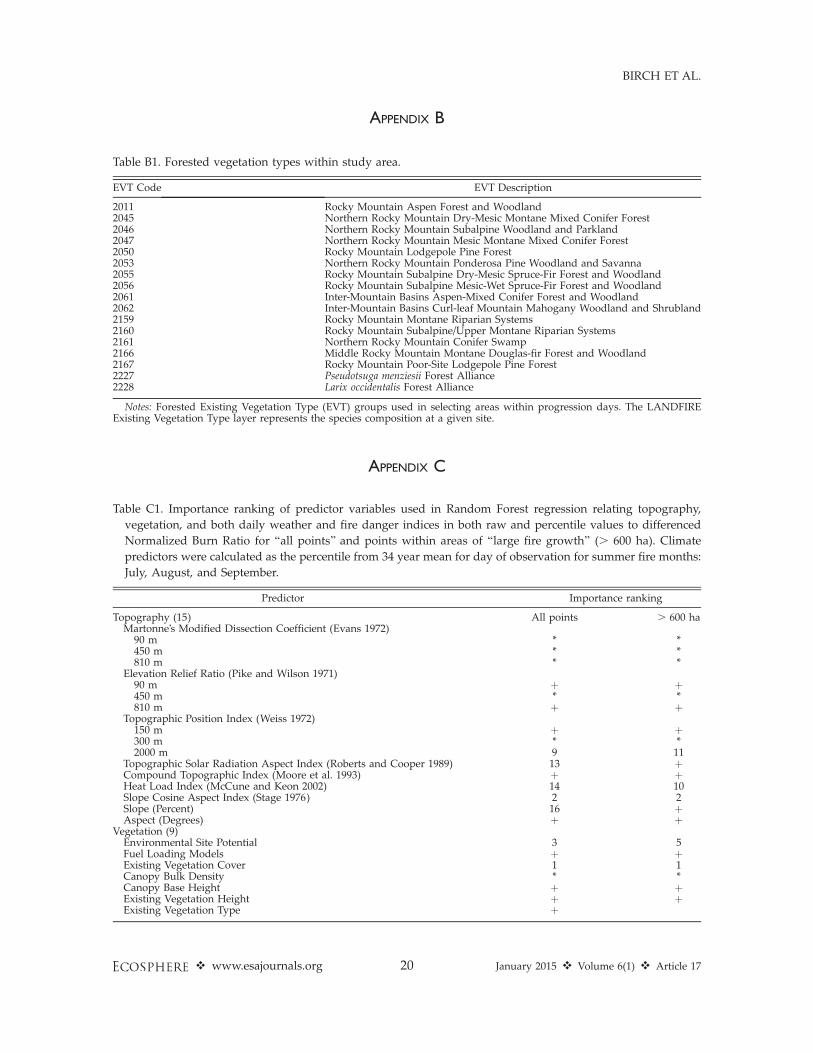
Table B1. Forested vegetation types within study area.
EVT Code EVT Description
2011 Rocky Mountain Aspen Forest and Woodland2045 Northern Rocky Mountain Dry-Mesic Montane Mixed Conifer Forest2046 Northern Rocky Mountain Subalpine Woodland and Parkland2047 Northern Rocky Mountain Mesic Montane Mixed Conifer Forest2050 Rocky Mountain Lodgepole Pine Forest2053 Northern Rocky Mountain Ponderosa Pine Woodland and Savanna2055 Rocky Mountain Subalpine Dry-Mesic Spruce-Fir Forest and Woodland2056 Rocky Mountain Subalpine Mesic-Wet Spruce-Fir Forest and Woodland2061 Inter-Mountain Basins Aspen-Mixed Conifer Forest and Woodland2062 Inter-Mountain Basins Curl-leaf Mountain Mahogany Woodland and Shrubland2159 Rocky Mountain Montane Riparian Systems2160 Rocky Mountain Subalpine/Upper Montane Riparian Systems2161 Northern Rocky Mountain Conifer Swamp2166 Middle Rocky Mountain Montane Douglas-fir Forest and Woodland2167 Rocky Mountain Poor-Site Lodgepole Pine Forest2227 Pseudotsuga menziesii Forest Alliance2228 Larix occidentalis Forest Alliance
Notes: Forested Existing Vegetation Type (EVT) groups used in selecting areas within progression days. The LANDFIREExisting Vegetation Type layer represents the species composition at a given site.
Table C1. Importance ranking of predictor variables used in Random Forest regression relating topography,
vegetation, and both daily weather and fire danger indices in both raw and percentile values to differenced
Normalized Burn Ratio for ‘‘all points’’ and points within areas of ‘‘large fire growth’’ (. 600 ha). Climate
predictors were calculated as the percentile from 34 year mean for day of observation for summer fire months:
July, August, and September.
Predictor Importance ranking
Topography (15) All points . 600 haMartonne’s Modified Dissection Coefficient (Evans 1972)90 m * *450 m * *810 m * *
Elevation Relief Ratio (Pike and Wilson 1971)90 m þ þ450 m * *810 m þ þ
Topographic Position Index (Weiss 1972)150 m þ þ300 m * *2000 m 9 11
Topographic Solar Radiation Aspect Index (Roberts and Cooper 1989) 13 þCompound Topographic Index (Moore et al. 1993) þ þHeat Load Index (McCune and Keon 2002) 14 10Slope Cosine Aspect Index (Stage 1976) 2 2Slope (Percent) 16 þAspect (Degrees) þ þ
Vegetation (9)Environmental Site Potential 3 5Fuel Loading Models þ þExisting Vegetation Cover 1 1Canopy Bulk Density * *Canopy Base Height þ þExisting Vegetation Height þ þExisting Vegetation Type þ
v www.esajournals.org 20 January 2015 v Volume 6(1) v Article 17
BIRCH ET AL.
APPENDIX D
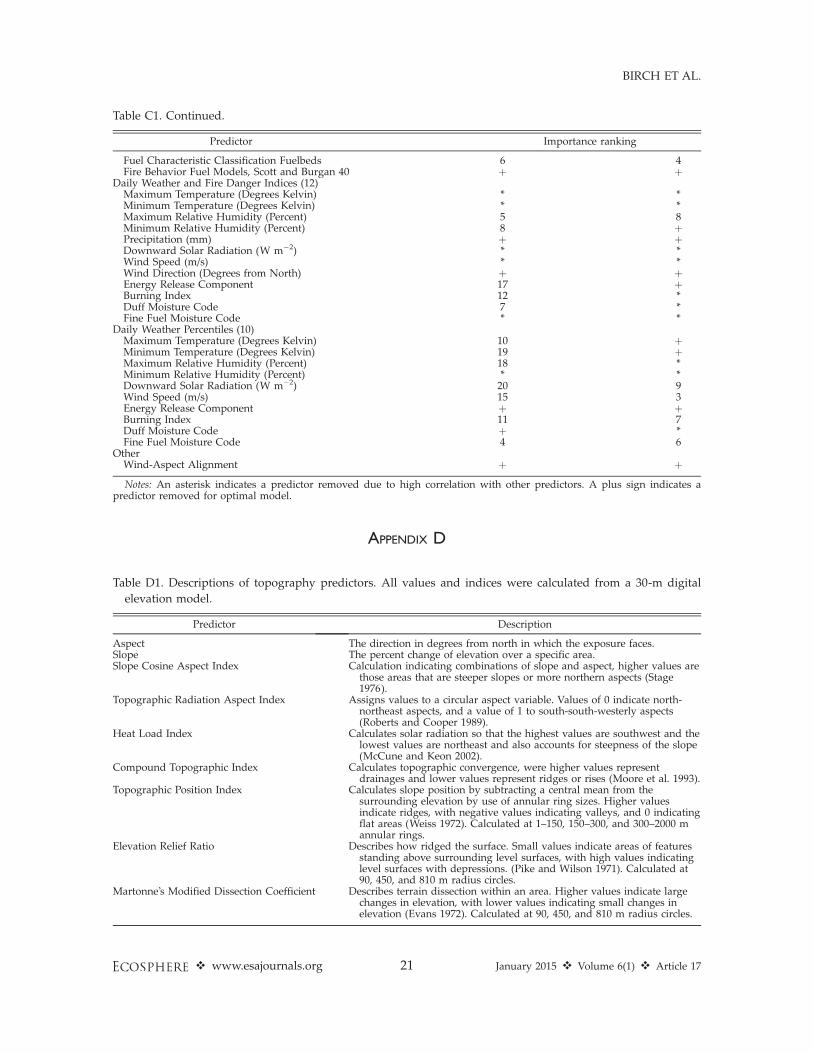
Table C1. Continued.
Predictor Importance ranking
Fuel Characteristic Classification Fuelbeds 6 4Fire Behavior Fuel Models, Scott and Burgan 40 þ þ
Daily Weather and Fire Danger Indices (12)Maximum Temperature (Degrees Kelvin) * *Minimum Temperature (Degrees Kelvin) * *Maximum Relative Humidity (Percent) 5 8Minimum Relative Humidity (Percent) 8 þPrecipitation (mm) þ þDownward Solar Radiation (W m�2) * *Wind Speed (m/s) * *Wind Direction (Degrees from North) þ þEnergy Release Component 17 þBurning Index 12 *Duff Moisture Code 7 *Fine Fuel Moisture Code * *
Daily Weather Percentiles (10)Maximum Temperature (Degrees Kelvin) 10 þMinimum Temperature (Degrees Kelvin) 19 þMaximum Relative Humidity (Percent) 18 *Minimum Relative Humidity (Percent) * *Downward Solar Radiation (W m�2) 20 9Wind Speed (m/s) 15 3Energy Release Component þ þBurning Index 11 7Duff Moisture Code þ *Fine Fuel Moisture Code 4 6
OtherWind-Aspect Alignment þ þ
Notes: An asterisk indicates a predictor removed due to high correlation with other predictors. A plus sign indicates apredictor removed for optimal model.
Table D1. Descriptions of topography predictors. All values and indices were calculated from a 30-m digital
elevation model.
Predictor Description
Aspect The direction in degrees from north in which the exposure faces.Slope The percent change of elevation over a specific area.Slope Cosine Aspect Index Calculation indicating combinations of slope and aspect, higher values are
those areas that are steeper slopes or more northern aspects (Stage1976).
Topographic Radiation Aspect Index Assigns values to a circular aspect variable. Values of 0 indicate north-northeast aspects, and a value of 1 to south-south-westerly aspects(Roberts and Cooper 1989).
Heat Load Index Calculates solar radiation so that the highest values are southwest and thelowest values are northeast and also accounts for steepness of the slope(McCune and Keon 2002).
Compound Topographic Index Calculates topographic convergence, were higher values representdrainages and lower values represent ridges or rises (Moore et al. 1993).
Topographic Position Index Calculates slope position by subtracting a central mean from thesurrounding elevation by use of annular ring sizes. Higher valuesindicate ridges, with negative values indicating valleys, and 0 indicatingflat areas (Weiss 1972). Calculated at 1–150, 150–300, and 300–2000 mannular rings.
Elevation Relief Ratio Describes how ridged the surface. Small values indicate areas of featuresstanding above surrounding level surfaces, with high values indicatinglevel surfaces with depressions. (Pike and Wilson 1971). Calculated at90, 450, and 810 m radius circles.
Martonne’s Modified Dissection Coefficient Describes terrain dissection within an area. Higher values indicate largechanges in elevation, with lower values indicating small changes inelevation (Evans 1972). Calculated at 90, 450, and 810 m radius circles.
v www.esajournals.org 21 January 2015 v Volume 6(1) v Article 17
BIRCH ET AL.
APPENDIX E
APPENDIX F
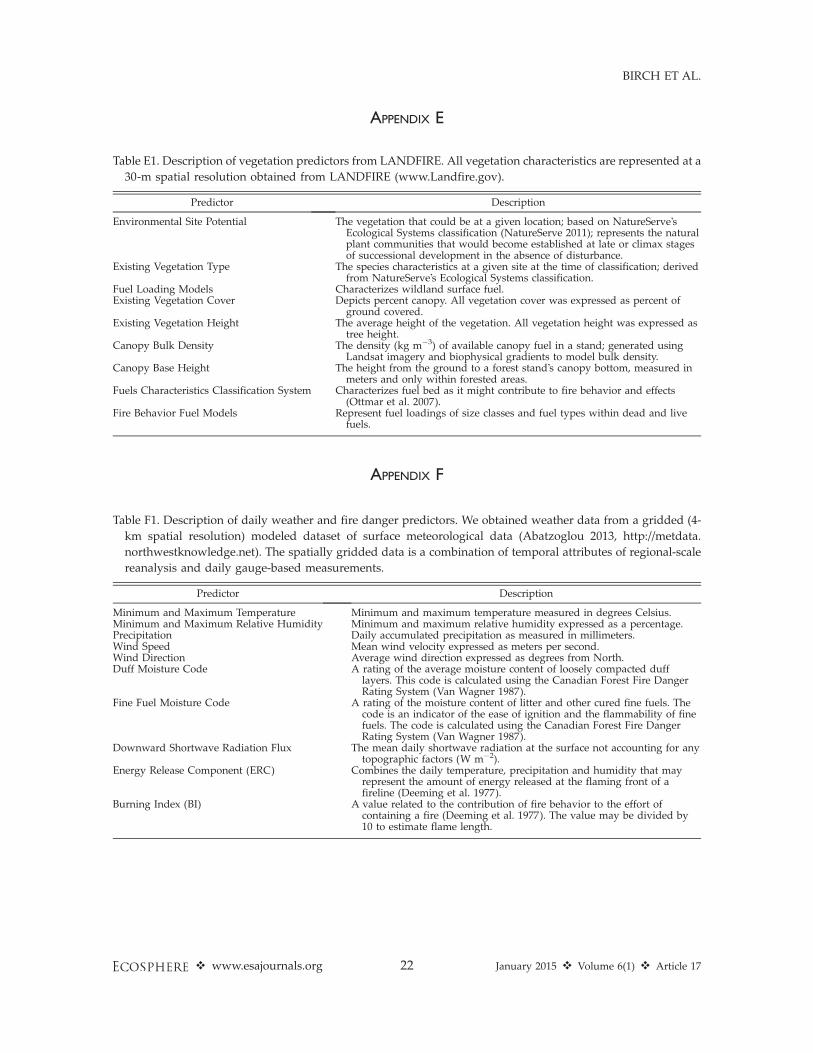
Table E1. Description of vegetation predictors from LANDFIRE. All vegetation characteristics are represented at a
30-m spatial resolution obtained from LANDFIRE (www.Landfire.gov).
Predictor Description
Environmental Site Potential The vegetation that could be at a given location; based on NatureServe’sEcological Systems classification (NatureServe 2011); represents the naturalplant communities that would become established at late or climax stagesof successional development in the absence of disturbance.
Existing Vegetation Type The species characteristics at a given site at the time of classification; derivedfrom NatureServe’s Ecological Systems classification.
Fuel Loading Models Characterizes wildland surface fuel.Existing Vegetation Cover Depicts percent canopy. All vegetation cover was expressed as percent of
ground covered.Existing Vegetation Height The average height of the vegetation. All vegetation height was expressed as
tree height.Canopy Bulk Density The density (kg m�3) of available canopy fuel in a stand; generated using
Landsat imagery and biophysical gradients to model bulk density.Canopy Base Height The height from the ground to a forest stand’s canopy bottom, measured in
meters and only within forested areas.Fuels Characteristics Classification System Characterizes fuel bed as it might contribute to fire behavior and effects
(Ottmar et al. 2007).Fire Behavior Fuel Models Represent fuel loadings of size classes and fuel types within dead and live
fuels.
Table F1. Description of daily weather and fire danger predictors. We obtained weather data from a gridded (4-
km spatial resolution) modeled dataset of surface meteorological data (Abatzoglou 2013, http://metdata.
northwestknowledge.net). The spatially gridded data is a combination of temporal attributes of regional-scale
reanalysis and daily gauge-based measurements.
Predictor Description
Minimum and Maximum Temperature Minimum and maximum temperature measured in degrees Celsius.Minimum and Maximum Relative Humidity Minimum and maximum relative humidity expressed as a percentage.Precipitation Daily accumulated precipitation as measured in millimeters.Wind Speed Mean wind velocity expressed as meters per second.Wind Direction Average wind direction expressed as degrees from North.Duff Moisture Code A rating of the average moisture content of loosely compacted duff
layers. This code is calculated using the Canadian Forest Fire DangerRating System (Van Wagner 1987).
Fine Fuel Moisture Code A rating of the moisture content of litter and other cured fine fuels. Thecode is an indicator of the ease of ignition and the flammability of finefuels. The code is calculated using the Canadian Forest Fire DangerRating System (Van Wagner 1987).
Downward Shortwave Radiation Flux The mean daily shortwave radiation at the surface not accounting for anytopographic factors (W m�2).
Energy Release Component (ERC) Combines the daily temperature, precipitation and humidity that mayrepresent the amount of energy released at the flaming front of afireline (Deeming et al. 1977).
Burning Index (BI) A value related to the contribution of fire behavior to the effort ofcontaining a fire (Deeming et al. 1977). The value may be divided by10 to estimate flame length.
v www.esajournals.org 22 January 2015 v Volume 6(1) v Article 17
BIRCH ET AL.
APPENDIX G
FINE-SCALE WIND ANALYSIS
WindNinja calculations were obtained fromZack Holden of the US Forest Service in Missoulafor the 2007 Rattlesnake Fire to test if fine-scale(30 m) wind direction and speed observationsprovided a greater contributing influence tovariations in dNBR. WindNinja is used tocalculate fine-scale, terrain-influenced winds(Forthofer et al. 2003) for input to wildland firebehavior models such as FARSITE and FlamMap.IR perimeter maps for the Rattlesnake Fire fromcentral Idaho covered 12 days of fire weather.Using the 127.5 m minimum spacing betweenobservation points we obtained 1053 wind speedand direction values. This fire was used as asmall test case to test if adding fine-scale winddata provided additional explanation for varia-tion in burn severity. As with the analysis of all
42 fires, the 30 m analysis and identical 4 kmanalysis included removal of highly correlatedpredictor variable. Wind-Aspect Alignment mea-surements were calculated based on wind direc-tion from both datasets. With no large change inMean Square Error values for wind specificpredicator variables (i.e., wind variables didn’tincrease in importance) between 30 m and 4 kmanalyses we didn’t conduct optimal RandomForest runs. Using WindNinja data for wind onthe 2007 Rattlesnake fire did not increase theexplained variation in dNBR. A pseudo R-squared of 0.43 was achieved using WindNinja30 m data compared to 0.41 for the 4 km dataform this single fire. With the large timeinvestment requirement to calculate WindNinjadata for the remaining 9,766 randomly locatedpoints, we decided not to include WindNinjadata for our final analysis across all 42 fires.
v www.esajournals.org 23 January 2015 v Volume 6(1) v Article 17
BIRCH ET AL.