Embed Size (px)
Citation preview
Palaeogeography, Palaeoclimatology, Palaeoecology 391 (2013) 40–59
Contents lists available at ScienceDirect
Palaeogeography, Palaeoclimatology, Palaeoecology
j ourna l homepage: www.e lsev ie r .com/ locate /pa laeo
Vegetation responses to rapid warming and to minor climatic fluctuationsduring the Late-Glacial Interstadial (GI-1) at Gerzensee (Switzerland)
Brigitta Ammann a,⁎, Jacqueline F.N. van Leeuwen a, Willem O. van der Knaap a, Heike Lischke b,Oliver Heiri a, Willy Tinner a
a Institute of Plant Sciences and Oeschger Centre for Climate Change Research, University of Bern, Altenbergrain 21, CH‐3013 Bern, Switzerlandb Swiss Federal Research Institute WSL, Zürcherstr. 111, CH-8903 Birmensdorf, Switzerland
⁎ Corresponding author. Tel.: +41 31 631 4921.E-mail address: [email protected] (B. A
0031-0182/$ – see front matter © 2012 Elsevier B.V. Allhttp://doi.10.1016/j.palaeo.2012.07.010
a b s t r a c t
a r t i c l e i n f oArticle history:Received 18 March 2012Received in revised form 11 July 2012Accepted 15 July 2012Available online 25 July 2012
Keywords:Biotic responses to climatic changeVegetationPollenLate-GlacialOldest DryasBøllingAllerødAfforestationPlant–population dynamicsPrimary succession
High-resolution pollen analyses made on the same samples on which the ratios of oxygen isotopes were mea-sured that provided the time scale and a temperature proxy after correlation to NorthGRIP.
(1) A primary succession: The vegetation responded to the rapid rise of temperatures around 14,685 yrBP, with a primary succession on a decadal to centennial time scale. The succession between ca15,600 and 13,000 yr BP included:
(1.1.) The replacement of shrub-tundra by woodland of Juniperus and tree birch (around 14,665 yr BP)(1.2.) The response of Juniperus pollen to the shift in oxygen isotopes in less than 20 yr,(1.3.) A sequence of population increases ofHippophaë rhamnoides (ca 14,600 yr BP), Salix spp. (ca 14,600 yr
BP), Betula trees (ca.14,480 yr BP), Populus cf. tremula (ca. 14,300 yr BP), and Pinus cf. sylvestris(ca. 13,830 yr BP).
(2) Biological processes: Plants responded to the rapid increase of summer temperatures on allorganisational levels:
(2.1) Individuals may have produced more pollen (e.g. Juniperus);(2.2) Populations increased or decreased (e.g. Juniperus, Betula, later Pinus), and(2.3) Populations changed their biogeographical range and may show migrational lags.(2.4) Plant communities changed in their composition because the species pools changed through immigra-
tion and (local) extinction. Some plant communities may have been without modern analogue.These mechanisms require increasing amounts of time.
(2.5) Processes on the level of ecosystems, with species interactions, may involve various time scales.Besides competition and facilitation, nitrogen fixation is discussed.
(3) The minor fluctuations of temperature during the Late-Glacial Interstadial, which are recorded in δ18O,resulted in only very minor changes in pollen during the Aegelsee Oscillation (Older Dryas biozone,GI-1d) and the Gerzensee Oscillation (GI-1b).
(4) Biodiversity: The afforestation at the onset of Bølling coincided with a gradual increase of taxonomicdiversity up to the time of the major Pinus expansion.
© 2012 Elsevier B.V. All rights reserved.
mmann).
rights reserved.
1. Introduction
The aim of this study is to understand better the potentialresponses of flora and vegetation to rapidly rising temperatures. Westudied the transition from Oldest Dryas to Bølling in the sedimentsof Gerzensee (Switzerland) at a high sampling resolution (for both
41B. Ammann et al. / Palaeogeography, Palaeoclimatology, Palaeoecology 391 (2013) 40–59
stable isotopes and pollen) and with a tightly constrained timescale(from NGRIP, see Rasmussen et al. (2006), applied to Gerzensee byvan Raden et al., 2013–this issue).
We ask the following questions:
(1) What were the dynamics of vegetation development under thestrong and rapid climatic warming just after 14,685 yr BP?
(2) How did climatic warming influence the vegetation responseson the levels of productivity (e.g. of pollen), plant populations,migrations, and interactions within ecosystems?
(3) Did any vegetation changes correspond to the minor climaticoscillations recorded by oxygen isotopes within the Late-Glacial Interstadial?
(4) How did palynological richness change under the processes ofprimary succession?
Although the Late-Glacial vegetation history on the Swiss Plateauis well known we can address these questions with the new data,which are exceptional because of the high temporal resolution andthe chronological constraint, which allow us to compare thedecadal- to centennial-scale variability of the pollen record with inde-pendent climatological evidence (i.e. the δ18O-record).
Even if the classical terms Oldest Dryas, Bølling, and Allerød aresometimes considered “historical baggage”, we use them here asbiozones defined by Welten (1982). Provided that they are welldefined, they help in communication because they are also usedwidely among geochemists and physicists working on ice cores ormarine cores (e.g. Clark et al., 2001; Seierstad et al., 2005; Stanford etal., 2011). In addition, we use in places the Greenland terminology forlate-glacial climatic events as proposed by Björck et al. (1998) andLowe et al. (2008).
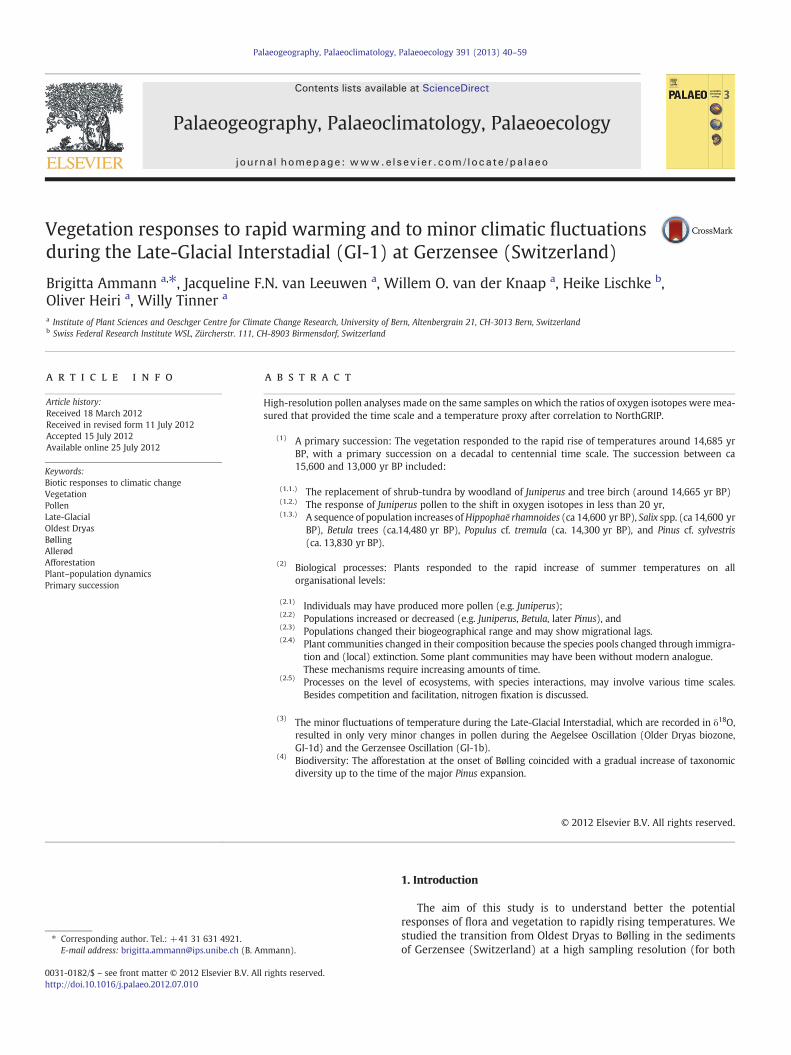
MT
Ra
L
G
F
So
8°E7°E6°E
47°N
46°N
50km
Urban
Wetlands
Water
Beech
Beech-fir and spr
Oak-hornbeam an
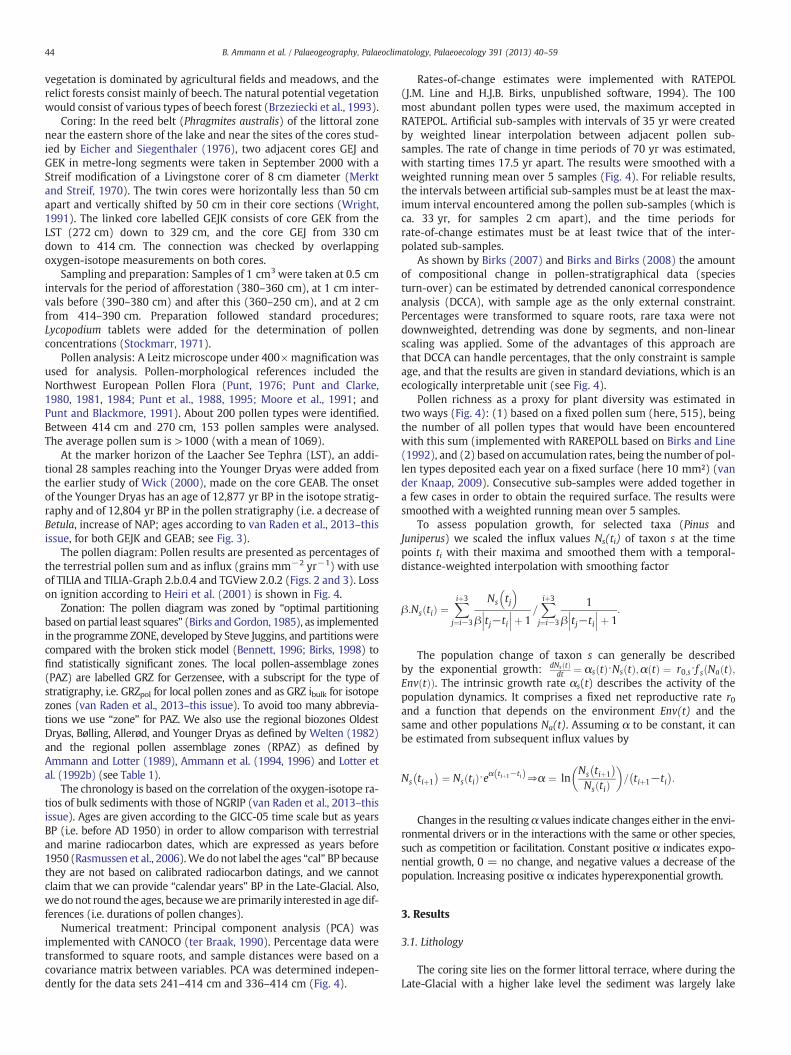
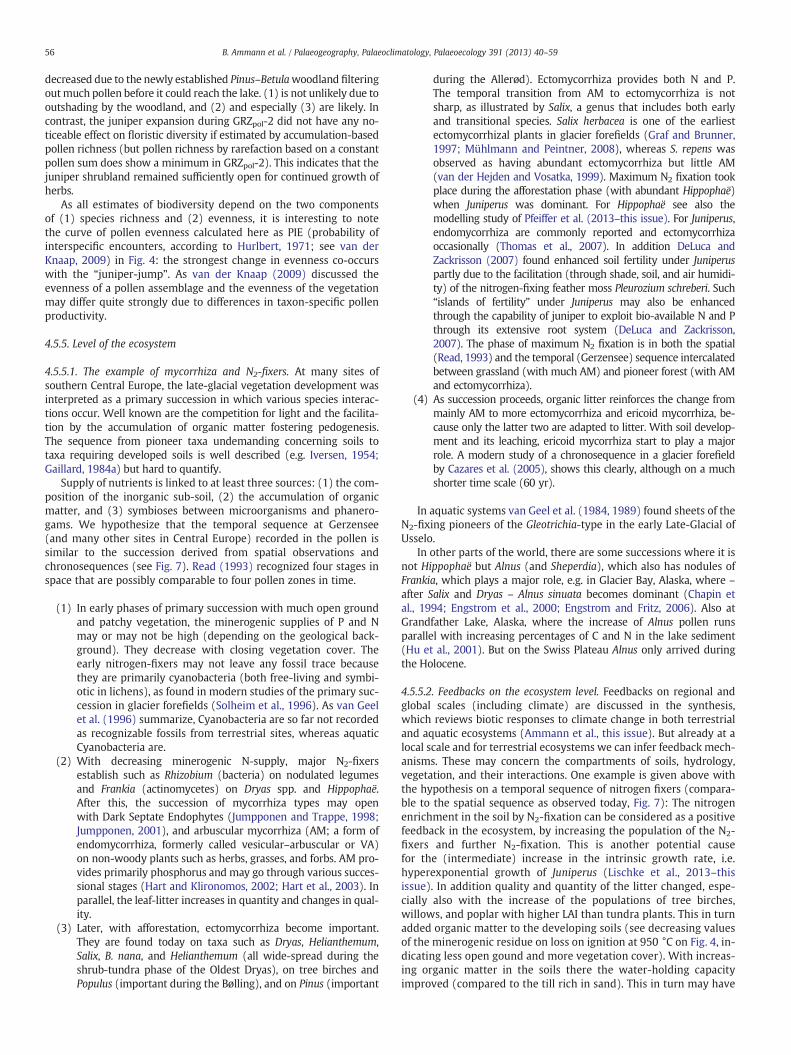
Fig. 1. Generalized map of the natural potential vegetation of Switzerland showing the posilate-glacial sequences are also situated in the colline (to sub-montane) belt of beech forestsLobsigensee, Ro for Rotsee, S for Soppensee, and Sc for Schleinsee (Gaillard, 1984; Ammann,Map based on Brzeziecki et al., 1993: Bright green: various types of beech forests. Blue: beBlack: above timberline. Gray: various forests. Light blue: water. Yellow: urban areas. Turq
Unfortunately, plant macroremains in the sediment could not bestudied because they were too scarce in the littoral lake marl exam-ined, and for the present study we had only one core of 8 cm diame-ter (labelled GEJK). Early late-glacial plant macroremains elsewhereon the Swiss Plateau have been analysed either in profundal corese.g. (Weber, 1977, 1980a,b), in delta sediments (e.g. at Vidy byWeber, 1979, 1980c) or, if on lake-marl terraces, then with verylarge samples either taken from open pits e.g. at Lobsigensee(Ammann and Tobolski, 1983), in 4–5 cm thick samples (e.g. atRotsee, Lotter, 1988), or in correlated parallel cores, at Gerzenseearound the Younger Dryas (Tobolski and Ammann, 2000). Suchlarge samples were then even usable for the analysis of Coleoptera(Lemdahl, 2000). Fortunately, important features such as the shiftfrom Betula nana to tree birches at the transition from Oldest Dryasto Bølling are very consistent in the macrofossil records of the SwissPlateau (see Fig. 1: at all sites mentioned plant macroremains werestudied for intervals before the Younger Dryas, except Gerzensee).
2. Materials and methods
The site: Gerzensee is a kettle-hole lake on the Swiss Plateau at603 m asl (46° 49′ 56.95″ N, 7° 33′ 00.63″ E, Fig. 1). It is located onan interfluve between the rivers Aare and Gürbe, on till of the Aareglacier deposited during the Last Glaciation. The lake surface todayhas an area of 25.16 ha, but it was probably double that size duringthe Late-Glacial (Eicher, 1979). Its maximum water depth at presentis 10.7 m. It has no major inflow or outflow. The present climate istemperate–humid, with mean July temperature of 17.5 °C, meanJanuary temperature of −1.0 °C, mean annual temperature of 8.2 °C,and an annual precipitation of about 1028 mm (data from the meteo-rological station of Bern–Liebefeld, 15 km from the lake). Today's
Ro
Sc
10°E9°E
Above timberline
uce
d beech
Spruce-fir
Larch-stone pine
Scots pine
tion of Gerzensee G in the belt of the beech forest. Five other sites with high-resolution: Ra for Marais de Rances, M for Grand Marais, T for Le Tronchet, F for Faulensee, L for1989; Lotter, 1988; Lotter et al., 1996; Lotter, 1999; Blockley et al., 2008; Müller, 1962).ech-fir and spruce forests. Dark green: pine forests. Orange: Larch-stone-pine forests.uoise: wetlands.
42 B. Ammann et al. / Palaeogeography, Palaeoclimatology, Palaeoecology 391 (2013) 40–59
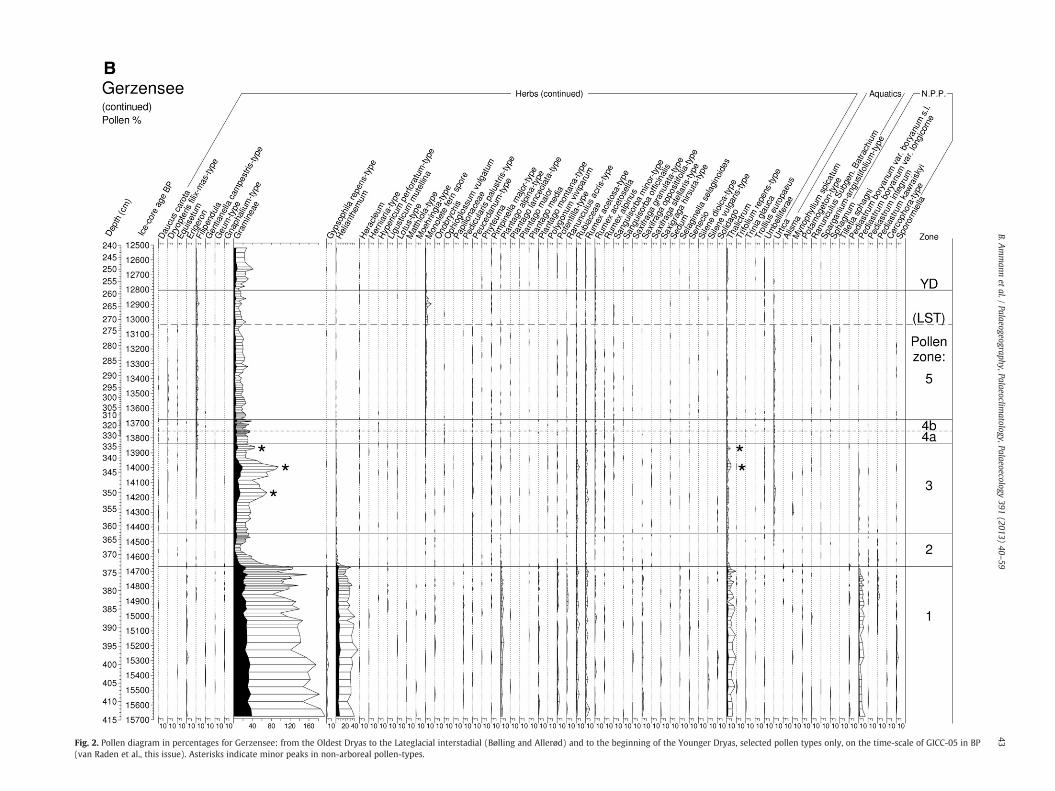
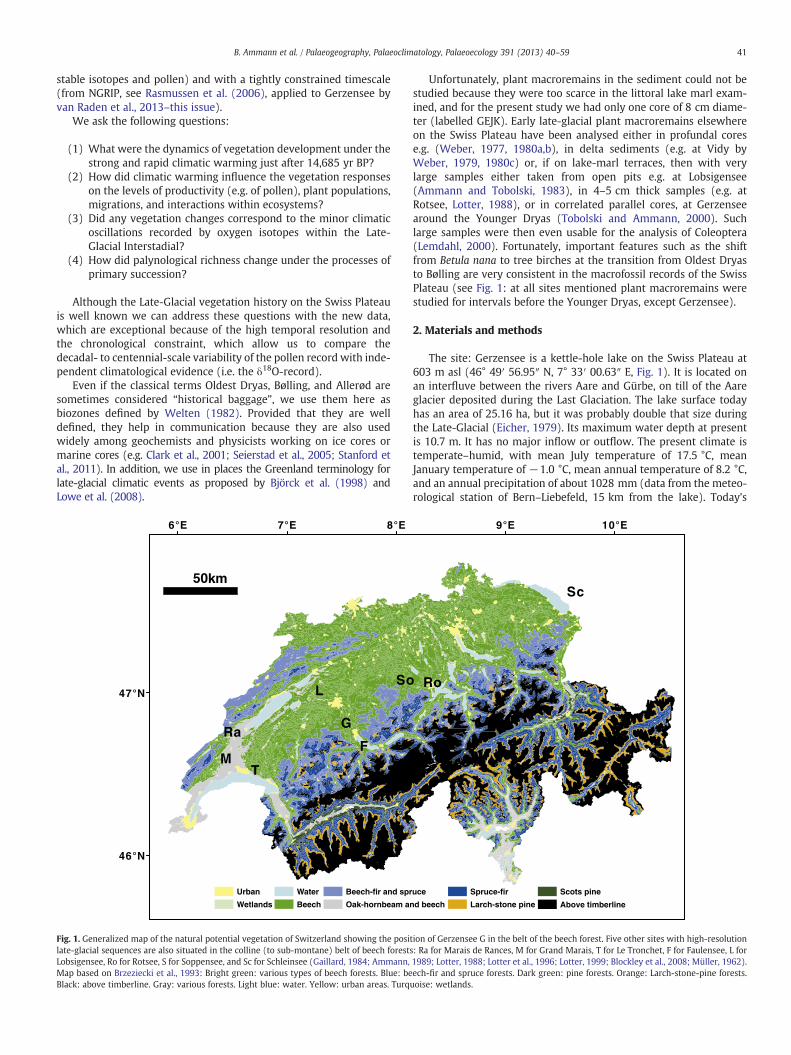
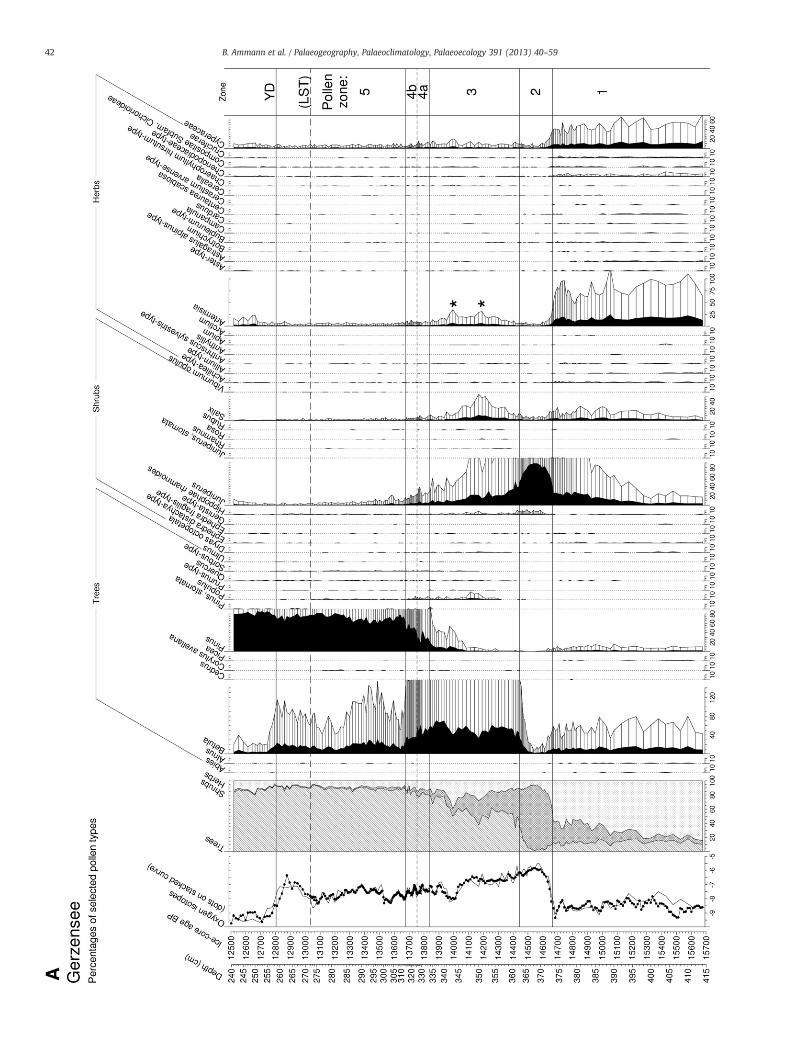
Fig. 2. Pollen diagram in percentages for Gerzensee: from the Oldest Dryas to the Lateglacial interstadial (Bølling and Allerød) and to the beginning of the Younger Dryas, selected pollen types only, on the time-scale of GICC-05 in BP(van Raden et al., this issue). Asterisks indicate minor peaks in non-arboreal pollen-types.
43B.A
mmann
etal./
Palaeogeography,Palaeoclimatology,Palaeoecology
391(2013)
40–59
44 B. Ammann et al. / Palaeogeography, Palaeoclimatology, Palaeoecology 391 (2013) 40–59
vegetation is dominated by agricultural fields and meadows, and therelict forests consist mainly of beech. The natural potential vegetationwould consist of various types of beech forest (Brzeziecki et al., 1993).
Coring: In the reed belt (Phragmites australis) of the littoral zonenear the eastern shore of the lake and near the sites of the cores stud-ied by Eicher and Siegenthaler (1976), two adjacent cores GEJ andGEK in metre-long segments were taken in September 2000 with aStreif modification of a Livingstone corer of 8 cm diameter (Merktand Streif, 1970). The twin cores were horizontally less than 50 cmapart and vertically shifted by 50 cm in their core sections (Wright,1991). The linked core labelled GEJK consists of core GEK from theLST (272 cm) down to 329 cm, and the core GEJ from 330 cmdown to 414 cm. The connection was checked by overlappingoxygen-isotope measurements on both cores.
Sampling and preparation: Samples of 1 cm3 were taken at 0.5 cmintervals for the period of afforestation (380–360 cm), at 1 cm inter-vals before (390–380 cm) and after this (360–250 cm), and at 2 cmfrom 414–390 cm. Preparation followed standard procedures;Lycopodium tablets were added for the determination of pollenconcentrations (Stockmarr, 1971).
Pollen analysis: A Leitz microscope under 400× magnification wasused for analysis. Pollen-morphological references included theNorthwest European Pollen Flora (Punt, 1976; Punt and Clarke,1980, 1981, 1984; Punt et al., 1988, 1995; Moore et al., 1991; andPunt and Blackmore, 1991). About 200 pollen types were identified.Between 414 cm and 270 cm, 153 pollen samples were analysed.The average pollen sum is >1000 (with a mean of 1069).
At the marker horizon of the Laacher See Tephra (LST), an addi-tional 28 samples reaching into the Younger Dryas were added fromthe earlier study of Wick (2000), made on the core GEAB. The onsetof the Younger Dryas has an age of 12,877 yr BP in the isotope stratig-raphy and of 12,804 yr BP in the pollen stratigraphy (i.e. a decrease ofBetula, increase of NAP; ages according to van Raden et al., 2013–thisissue, for both GEJK and GEAB; see Fig. 3).
The pollen diagram: Pollen results are presented as percentages ofthe terrestrial pollen sum and as influx (grains mm−2 yr−1) with useof TILIA and TILIA-Graph 2.b.0.4 and TGView 2.0.2 (Figs. 2 and 3). Losson ignition according to Heiri et al. (2001) is shown in Fig. 4.
Zonation: The pollen diagram was zoned by “optimal partitioningbased on partial least squares” (Birks and Gordon, 1985), as implementedin the programme ZONE, developed by Steve Juggins, and partitionswerecompared with the broken stick model (Bennett, 1996; Birks, 1998) tofind statistically significant zones. The local pollen-assemblage zones(PAZ) are labelled GRZ for Gerzensee, with a subscript for the type ofstratigraphy, i.e. GRZpol for local pollen zones and as GRZ ibulk for isotopezones (van Raden et al., 2013–this issue). To avoid too many abbrevia-tions we use “zone” for PAZ. We also use the regional biozones OldestDryas, Bølling, Allerød, and Younger Dryas as defined by Welten (1982)and the regional pollen assemblage zones (RPAZ) as defined byAmmann and Lotter (1989), Ammann et al. (1994, 1996) and Lotter etal. (1992b) (see Table 1).
The chronology is based on the correlation of the oxygen-isotope ra-tios of bulk sediments with those of NGRIP (van Raden et al., 2013–thisissue). Ages are given according to the GICC-05 time scale but as yearsBP (i.e. before AD 1950) in order to allow comparison with terrestrialand marine radiocarbon dates, which are expressed as years before1950 (Rasmussen et al., 2006).We donot label the ages “cal” BP becausethey are not based on calibrated radiocarbon datings, and we cannotclaim that we can provide “calendar years” BP in the Late-Glacial. Also,we do not round the ages, becausewe are primarily interested in age dif-ferences (i.e. durations of pollen changes).
Numerical treatment: Principal component analysis (PCA) wasimplemented with CANOCO (ter Braak, 1990). Percentage data weretransformed to square roots, and sample distances were based on acovariance matrix between variables. PCA was determined indepen-dently for the data sets 241–414 cm and 336–414 cm (Fig. 4).
Rates-of-change estimates were implemented with RATEPOL(J.M. Line and H.J.B. Birks, unpublished software, 1994). The 100most abundant pollen types were used, the maximum accepted inRATEPOL. Artificial sub-samples with intervals of 35 yr were createdby weighted linear interpolation between adjacent pollen sub-samples. The rate of change in time periods of 70 yr was estimated,with starting times 17.5 yr apart. The results were smoothed with aweighted running mean over 5 samples (Fig. 4). For reliable results,the intervals between artificial sub-samples must be at least the max-imum interval encountered among the pollen sub-samples (which isca. 33 yr, for samples 2 cm apart), and the time periods forrate-of-change estimates must be at least twice that of the inter-polated sub-samples.
As shown by Birks (2007) and Birks and Birks (2008) the amountof compositional change in pollen-stratigraphical data (speciesturn-over) can be estimated by detrended canonical correspondenceanalysis (DCCA), with sample age as the only external constraint.Percentages were transformed to square roots, rare taxa were notdownweighted, detrending was done by segments, and non-linearscaling was applied. Some of the advantages of this approach arethat DCCA can handle percentages, that the only constraint is sampleage, and that the results are given in standard deviations, which is anecologically interpretable unit (see Fig. 4).
Pollen richness as a proxy for plant diversity was estimated intwo ways (Fig. 4): (1) based on a fixed pollen sum (here, 515), beingthe number of all pollen types that would have been encounteredwith this sum (implemented with RAREPOLL based on Birks and Line(1992), and (2) based on accumulation rates, being the number of pol-len types deposited each year on a fixed surface (here 10 mm²) (vander Knaap, 2009). Consecutive sub-samples were added together ina few cases in order to obtain the required surface. The results weresmoothed with a weighted running mean over 5 samples.
To assess population growth, for selected taxa (Pinus andJuniperus) we scaled the influx values Ns(ti) of taxon s at the timepoints ti with their maxima and smoothed them with a temporal-distance-weighted interpolation with smoothing factor
β:Ns tið Þ ¼Xiþ3
j¼i−3
Ns tj� �
β tj−ti��� ���þ 1
=Xiþ3
j¼i−3
1
β tj−ti��� ���þ 1
:
The population change of taxon s can generally be describedby the exponential growth: dNs tð Þ
dt ¼ αs tð Þ⋅Ns tð Þ;α tð Þ ¼ r0;s⋅f s Na tð Þ;ðEnv tð ÞÞ. The intrinsic growth rate αs(t) describes the activity of thepopulation dynamics. It comprises a fixed net reproductive rate r0and a function that depends on the environment Env(t) and thesame and other populations Na(t). Assuming α to be constant, it canbe estimated from subsequent influx values by
Ns tiþ1� � ¼ Ns tið Þ⋅eα tiþ1−tið Þ⇒α ¼ ln
Ns tiþ1� �
Ns tið Þ� �
= tiþ1−ti� �
:
Changes in the resulting α values indicate changes either in the envi-ronmental drivers or in the interactions with the same or other species,such as competition or facilitation. Constant positive α indicates expo-nential growth, 0 = no change, and negative values a decrease of thepopulation. Increasing positive α indicates hyperexponential growth.
3. Results
3.1. Lithology
The coring site lies on the former littoral terrace, where during theLate-Glacial with a higher lake level the sediment was largely lake
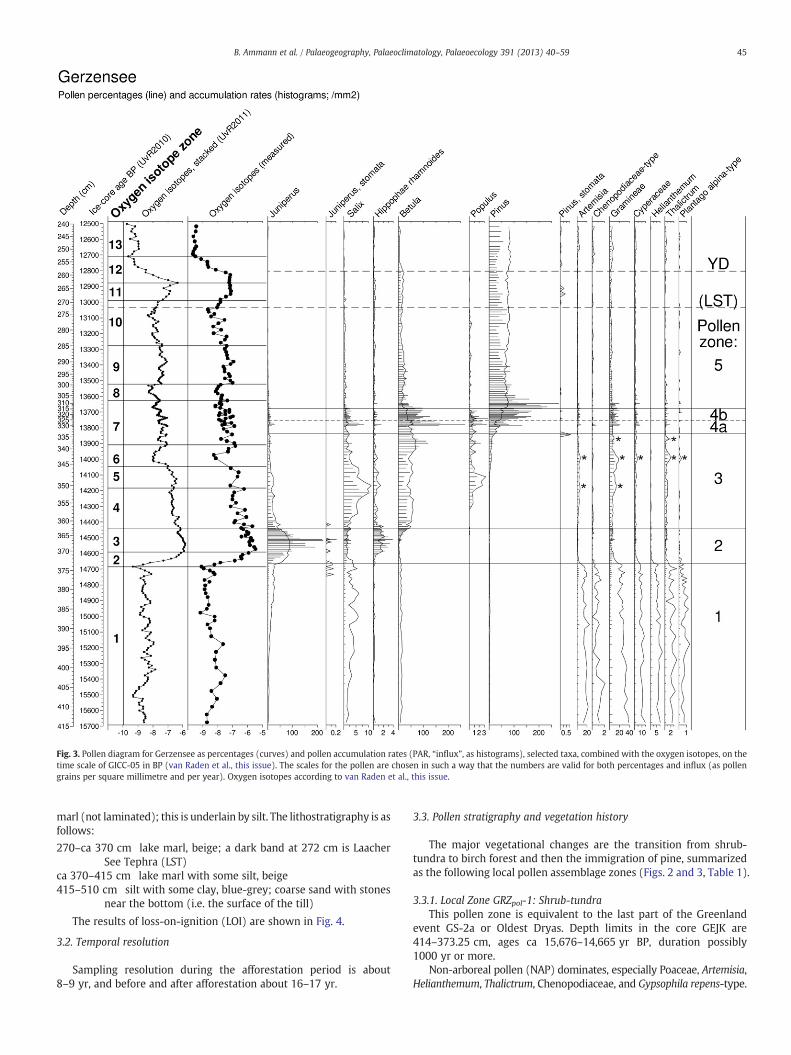
Fig. 3. Pollen diagram for Gerzensee as percentages (curves) and pollen accumulation rates (PAR, “influx”, as histograms), selected taxa, combined with the oxygen isotopes, on thetime scale of GICC-05 in BP (van Raden et al., this issue). The scales for the pollen are chosen in such a way that the numbers are valid for both percentages and influx (as pollengrains per square millimetre and per year). Oxygen isotopes according to van Raden et al., this issue.
45B. Ammann et al. / Palaeogeography, Palaeoclimatology, Palaeoecology 391 (2013) 40–59
marl (not laminated); this is underlain by silt. The lithostratigraphy is asfollows:
270–ca 370 cm lake marl, beige; a dark band at 272 cm is LaacherSee Tephra (LST)
ca 370–415 cm lake marl with some silt, beige415–510 cm silt with some clay, blue-grey; coarse sand with stones
near the bottom (i.e. the surface of the till)
The results of loss-on-ignition (LOI) are shown in Fig. 4.
3.2. Temporal resolution
Sampling resolution during the afforestation period is about8–9 yr, and before and after afforestation about 16–17 yr.
3.3. Pollen stratigraphy and vegetation history
The major vegetational changes are the transition from shrub-tundra to birch forest and then the immigration of pine, summarizedas the following local pollen assemblage zones (Figs. 2 and 3, Table 1).
3.3.1. Local Zone GRZpol-1: Shrub-tundraThis pollen zone is equivalent to the last part of the Greenland
event GS-2a or Oldest Dryas. Depth limits in the core GEJK are414–373.25 cm, ages ca 15,676–14,665 yr BP, duration possibly1000 yr or more.
Non-arboreal pollen (NAP) dominates, especially Poaceae, Artemisia,Helianthemum, Thalictrum, Chenopodiaceae, and Gypsophila repens-type.
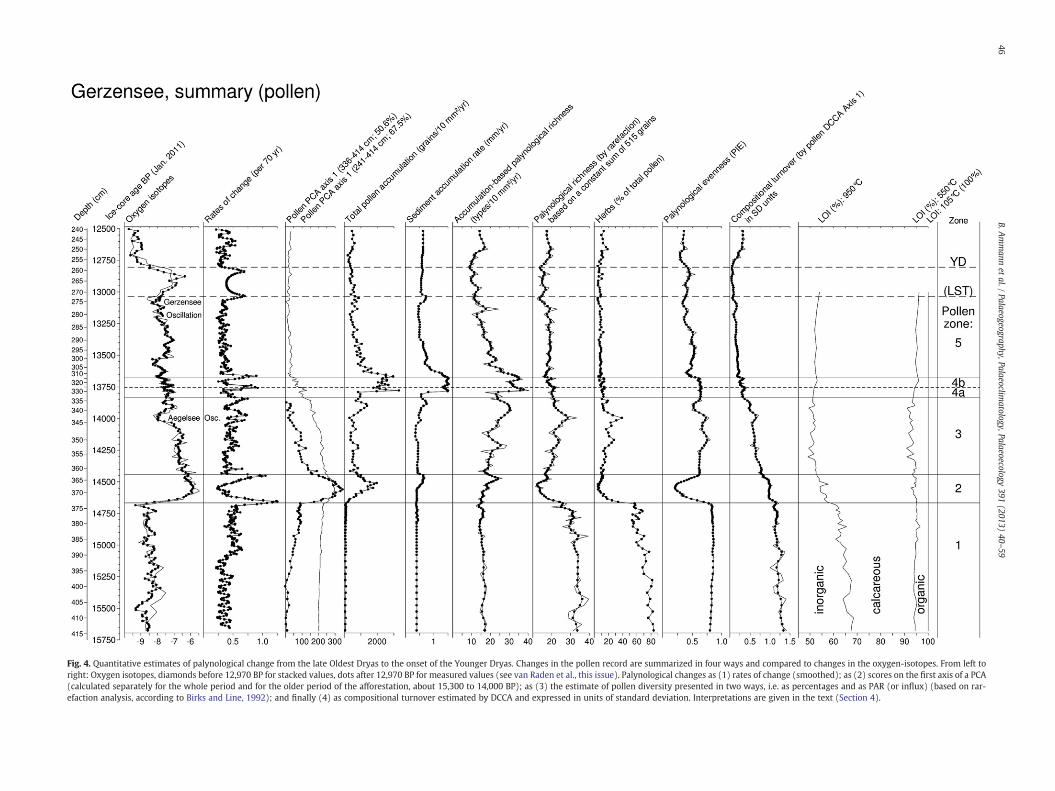
Fig. 4. Quantitative estimates of palynological change from the late Oldest Dryas to the onset of the Younger Dryas. Changes in the pollen record are summarized in four s and compared to changes in the oxygen-isotopes. From left toright: Oxygen isotopes, diamonds before 12,970 BP for stacked values, dots after 12,970 BP for measured values (see van Raden et al., this issue). Palynological changes as (1 tes of change (smoothed); as (2) scores on the first axis of a PCA(calculated separately for the whole period and for the older period of the afforestation, about 15,300 to 14,000 BP); as (3) the estimate of pollen diversity presented in ways, i.e. as percentages and as PAR (or influx) (based on rar-efaction analysis, according to Birks and Line, 1992); and finally (4) as compositional turnover estimated by DCCA and expressed in units of standard deviation. Interpre ns are given in the text (Section 4).
46B.A
mmann
etal./
Palaeogeography,Palaeoclimatology,Palaeoecology
391(2013)
40–59
way) ratwotatio
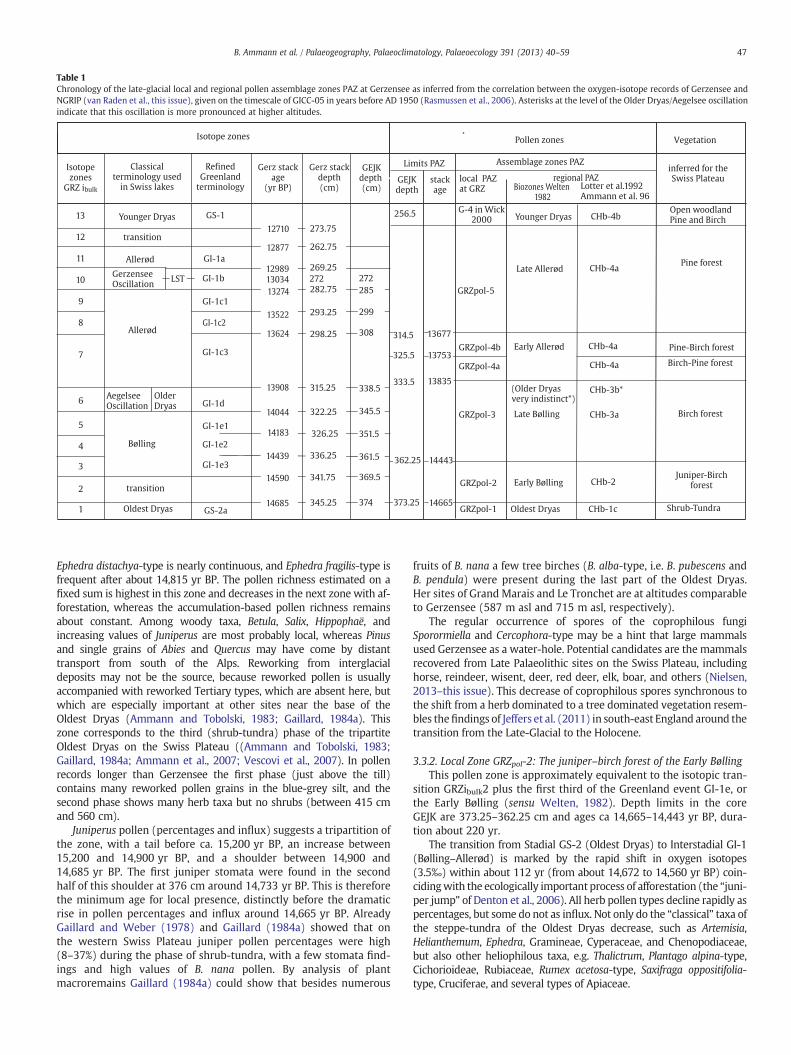
Table 1Chronology of the late-glacial local and regional pollen assemblage zones PAZ at Gerzensee as inferred from the correlation between the oxygen-isotope records of Gerzensee andNGRIP (van Raden et al., this issue), given on the timescale of GICC-05 in years before AD 1950 (Rasmussen et al., 2006). Asterisks at the level of the Older Dryas/Aegelsee oscillationindicate that this oscillation is more pronounced at higher altitudes.
1
2
3
4
5
7
6
8
9
10
11
12
13
Isotopezones
GRZ ibulk
Classicalterminology used
in Swiss lakes
RefinedGreenland
terminology
Gerz stackage
(yr BP)
Younger Dryas
transition
transition
GerzenseeOscillation
AegelseeOscillation
OlderDryas
Allerød
Bølling
Oldest Dryas
GI-1a
GI-1b
GI-1c1
GI-1c2
GI-1c3
GI-1d
GI-1e1
GI-1e2
GI-1e3
LST
Gerz stackdepth(cm)
Vegetation
273.75
262.75
269.25
272282.75
293.25
298.25
315.25
322.25
326.25
336.25
341.75
345.25
GEJKdepth (cm)
272
285
299
308
338.5
345.5
351.5
361.5
369.5
374
Pollen zones
Limits PAZ
Isotope zones
GEJKdepth
stackage
Assemblage zones PAZ
373.25
362.25
333.5
325.5
256.5
314.5
12710
12877
12989
13274
13034
13522
13624
13908
14044
14183
14439
14590
14685
13677
13753
14443
14665GRZpol-1
GRZpol-2
GRZpol-3
GRZpol-4a
GRZpol-4b
GRZpol-5
Open woodlandPine and Birch
regional PAZ local PAZ at GRZ Biozones Welten
1982
Lotter et al.1992Ammann et al. 96
Oldest Dryas CHb-1c
Early Bølling
Late Bølling
Younger Dryas
Late Allerød
(Older Dryasvery indistinct*)
Early Allerød
CHb-2
CHb-4a
CHb-4a
CHb-3b*
CHb-3a
CHb-4b
Pine forest
Pine-Birch forest
Birch-Pine forest
Birch forest
Juniper-Birch forest
Shrub-Tundra
inferred for the Swiss Plateau
G-4 in Wick 2000
13835
CHb-4a
Allerød
GS-1
GS-2a
47B. Ammann et al. / Palaeogeography, Palaeoclimatology, Palaeoecology 391 (2013) 40–59
Ephedra distachya-type is nearly continuous, and Ephedra fragilis-type isfrequent after about 14,815 yr BP. The pollen richness estimated on afixed sum is highest in this zone and decreases in the next zone with af-forestation, whereas the accumulation-based pollen richness remainsabout constant. Among woody taxa, Betula, Salix, Hippophaë, andincreasing values of Juniperus are most probably local, whereas Pinusand single grains of Abies and Quercus may have come by distanttransport from south of the Alps. Reworking from interglacialdeposits may not be the source, because reworked pollen is usuallyaccompanied with reworked Tertiary types, which are absent here, butwhich are especially important at other sites near the base of theOldest Dryas (Ammann and Tobolski, 1983; Gaillard, 1984a). Thiszone corresponds to the third (shrub-tundra) phase of the tripartiteOldest Dryas on the Swiss Plateau ((Ammann and Tobolski, 1983;Gaillard, 1984a; Ammann et al., 2007; Vescovi et al., 2007). In pollenrecords longer than Gerzensee the first phase (just above the till)contains many reworked pollen grains in the blue-grey silt, and thesecond phase shows many herb taxa but no shrubs (between 415 cmand 560 cm).
Juniperus pollen (percentages and influx) suggests a tripartition ofthe zone, with a tail before ca. 15,200 yr BP, an increase between15,200 and 14,900 yr BP, and a shoulder between 14,900 and14,685 yr BP. The first juniper stomata were found in the secondhalf of this shoulder at 376 cm around 14,733 yr BP. This is thereforethe minimum age for local presence, distinctly before the dramaticrise in pollen percentages and influx around 14,665 yr BP. AlreadyGaillard and Weber (1978) and Gaillard (1984a) showed that onthe western Swiss Plateau juniper pollen percentages were high(8–37%) during the phase of shrub-tundra, with a few stomata find-ings and high values of B. nana pollen. By analysis of plantmacroremains Gaillard (1984a) could show that besides numerous
fruits of B. nana a few tree birches (B. alba-type, i.e. B. pubescens andB. pendula) were present during the last part of the Oldest Dryas.Her sites of Grand Marais and Le Tronchet are at altitudes comparableto Gerzensee (587 m asl and 715 m asl, respectively).
The regular occurrence of spores of the coprophilous fungiSporormiella and Cercophora-type may be a hint that large mammalsused Gerzensee as a water-hole. Potential candidates are the mammalsrecovered from Late Palaeolithic sites on the Swiss Plateau, includinghorse, reindeer, wisent, deer, red deer, elk, boar, and others (Nielsen,2013–this issue). This decrease of coprophilous spores synchronous tothe shift from a herb dominated to a tree dominated vegetation resem-bles thefindings of Jeffers et al. (2011) in south-east England around thetransition from the Late-Glacial to the Holocene.
3.3.2. Local Zone GRZpol-2: The juniper–birch forest of the Early BøllingThis pollen zone is approximately equivalent to the isotopic tran-
sition GRZibulk2 plus the first third of the Greenland event GI-1e, orthe Early Bølling (sensu Welten, 1982). Depth limits in the coreGEJK are 373.25–362.25 cm and ages ca 14,665–14,443 yr BP, dura-tion about 220 yr.
The transition from Stadial GS-2 (Oldest Dryas) to Interstadial GI-1(Bølling–Allerød) is marked by the rapid shift in oxygen isotopes(3.5‰) within about 112 yr (from about 14,672 to 14,560 yr BP) coin-cidingwith the ecologically important process of afforestation (the “juni-per jump” of Denton et al., 2006). All herb pollen types decline rapidly aspercentages, but some do not as influx. Not only do the “classical” taxa ofthe steppe-tundra of the Oldest Dryas decrease, such as Artemisia,Helianthemum, Ephedra, Gramineae, Cyperaceae, and Chenopodiaceae,but also other heliophilous taxa, e.g. Thalictrum, Plantago alpina-type,Cichorioideae, Rubiaceae, Rumex acetosa-type, Saxifraga oppositifolia-type, Cruciferae, and several types of Apiaceae.
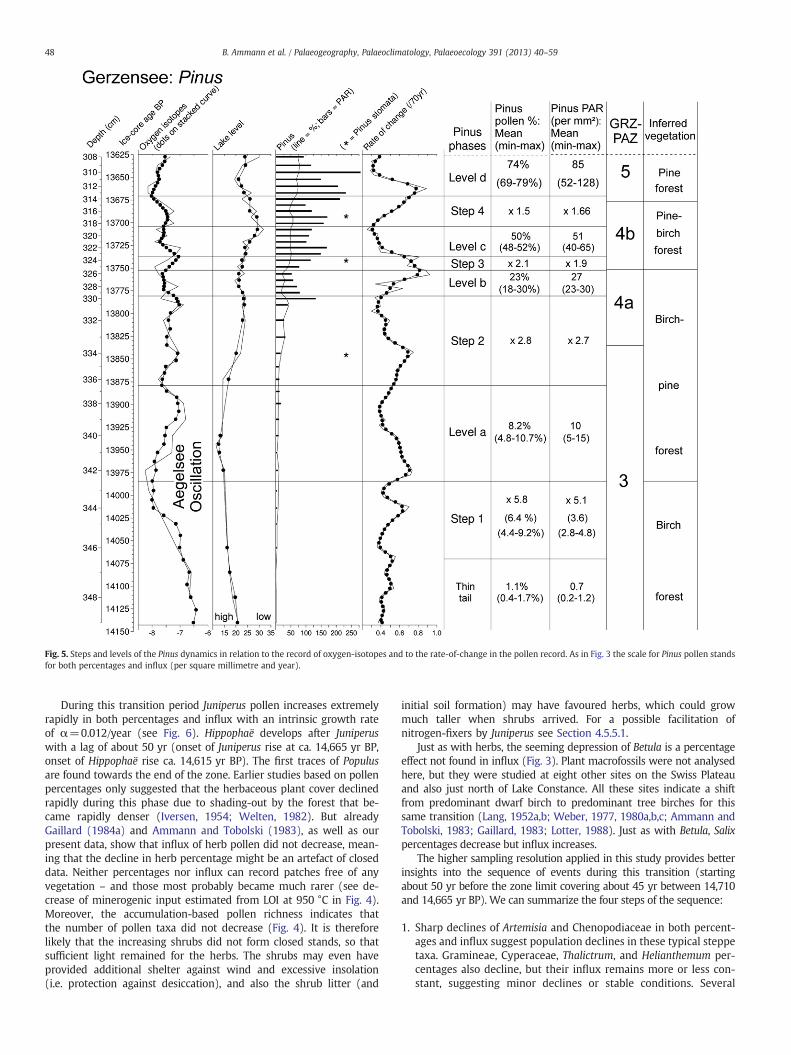
Fig. 5. Steps and levels of the Pinus dynamics in relation to the record of oxygen-isotopes and to the rate-of-change in the pollen record. As in Fig. 3 the scale for Pinus pollen standsfor both percentages and influx (per square millimetre and year).
48 B. Ammann et al. / Palaeogeography, Palaeoclimatology, Palaeoecology 391 (2013) 40–59
During this transition period Juniperus pollen increases extremelyrapidly in both percentages and influx with an intrinsic growth rateof α=0.012/year (see Fig. 6). Hippophaë develops after Juniperuswith a lag of about 50 yr (onset of Juniperus rise at ca. 14,665 yr BP,onset of Hippophaë rise ca. 14,615 yr BP). The first traces of Populusare found towards the end of the zone. Earlier studies based on pollenpercentages only suggested that the herbaceous plant cover declinedrapidly during this phase due to shading-out by the forest that be-came rapidly denser (Iversen, 1954; Welten, 1982). But alreadyGaillard (1984a) and Ammann and Tobolski (1983), as well as ourpresent data, show that influx of herb pollen did not decrease, mean-ing that the decline in herb percentage might be an artefact of closeddata. Neither percentages nor influx can record patches free of anyvegetation – and those most probably became much rarer (see de-crease of minerogenic input estimated from LOI at 950 °C in Fig. 4).Moreover, the accumulation-based pollen richness indicates thatthe number of pollen taxa did not decrease (Fig. 4). It is thereforelikely that the increasing shrubs did not form closed stands, so thatsufficient light remained for the herbs. The shrubs may even haveprovided additional shelter against wind and excessive insolation(i.e. protection against desiccation), and also the shrub litter (and
initial soil formation) may have favoured herbs, which could growmuch taller when shrubs arrived. For a possible facilitation ofnitrogen-fixers by Juniperus see Section 4.5.5.1.
Just as with herbs, the seeming depression of Betula is a percentageeffect not found in influx (Fig. 3). Plant macrofossils were not analysedhere, but they were studied at eight other sites on the Swiss Plateauand also just north of Lake Constance. All these sites indicate a shiftfrom predominant dwarf birch to predominant tree birches for thissame transition (Lang, 1952a,b; Weber, 1977, 1980a,b,c; Ammann andTobolski, 1983; Gaillard, 1983; Lotter, 1988). Just as with Betula, Salixpercentages decrease but influx increases.
The higher sampling resolution applied in this study provides betterinsights into the sequence of events during this transition (startingabout 50 yr before the zone limit covering about 45 yr between 14,710and 14,665 yr BP). We can summarize the four steps of the sequence:
1. Sharp declines of Artemisia and Chenopodiaceae in both percent-ages and influx suggest population declines in these typical steppetaxa. Gramineae, Cyperaceae, Thalictrum, and Helianthemum per-centages also decline, but their influx remains more or less con-stant, suggesting minor declines or stable conditions. Several
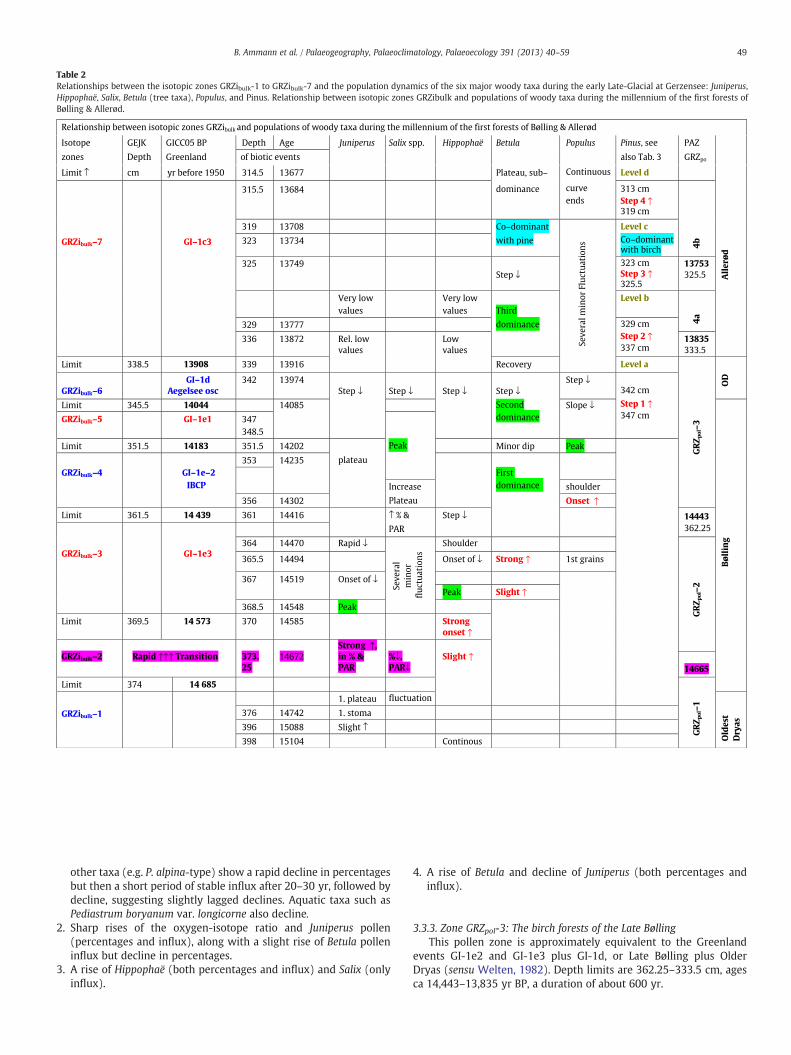
Table 2Relationships between the isotopic zones GRZibulk-1 to GRZibulk-7 and the population dynamics of the six major woody taxa during the early Late-Glacial at Gerzensee: Juniperus,Hippophaë, Salix, Betula (tree taxa), Populus, and Pinus. Relationship between isotopic zones GRZibulk and populations of woody taxa during the millennium of the first forests ofBølling & Allerød.
Relationship between isotopic zones GRZibulk and populations of woody taxa during the millennium of the first forests of Bølling & Allerød
Isotope
zones
GEJK
Depth
GICC05 BP
Greenland
Depth Age Juniperus Salix spp. Hippophaë Betula Populus Pinus, see
also Tab. 3
PAZ
GRZpoof biotic events
Limit ↑ cm yr before 1950 314.5 13677 Plateau, sub–
dominance
Continuous
curve
ends
Level d
All
erø
d
GRZibulk–7 GI–1c3
315.5 13684 313 cm
Step 4 ↑319 cm
4b
319 13708 Co–dominant
with pine
Se
ve
ral
min
or
Flu
ctu
ati
on
s
Level c
Co–dominant with birch
323 13734
325 13749
Step ↓323 cm
Step 3 ↑325.5
13753
325.5
Very low
values
Very low
values Third
dominance
Level b
4a
329 13777 329 cm
Step 2 ↑337 cm
336 13872 Rel. low
values
Low
values
13835
333.5
Limit 338.5 13908 339 13916 Recovery Level a
GR
Zp
ol–
3
OD
GRZibulk–6
GI–1d
Aegelsee osc
342 13974
Step ↓ Step ↓ Step ↓ Step ↓Second
dominance
Step ↓342 cm
Step 1 ↑347 cm
Limit 345.5 14044 14085 Slope ↓
Bø
llin
g
GRZibulk–5 GI–1e1 347
348.5
PeakLimit 351.5 14183 351.5 14202
plateau
Minor dip Peak
GRZibulk–4 GI–1e–2
IBCP
353 14235
First
dominanceIncrease
Plateau
shoulder
356 14302 Onset ↑Limit 361.5 14 439 361 14416 ↑ % &
PAR
Step ↓ 14443
362.25
GRZibulk–3 GI–1e3364 14470 Rapid ↓
Se
ve
ral
min
or
flu
ctu
ati
on
s
Shoulder
GR
Zp
ol–
2
365.5 14494 Onset of ↓ Strong ↑ 1st grains
367 14519 Onset of ↓Peak Slight ↑
368.5 14548 Peak
Limit 369.5 14 573 370 14585 Strong
onset ↑
GRZibulk–2 Rapid ↑↑↑ Transition 373.
25
14672
Strong ↑,
in % &
PAR
%↓,
PAR↓Slight ↑
14665
Limit 374 14 685G
RZ
po
l–1
GRZibulk–1
1. plateau fluctuation
Old
est
Dry
as
376 14742 1. stoma
396 15088 Slight ↑
398 15104 Continous
49B. Ammann et al. / Palaeogeography, Palaeoclimatology, Palaeoecology 391 (2013) 40–59
other taxa (e.g. P. alpina-type) show a rapid decline in percentagesbut then a short period of stable influx after 20–30 yr, followed bydecline, suggesting slightly lagged declines. Aquatic taxa such asPediastrum boryanum var. longicorne also decline.
2. Sharp rises of the oxygen-isotope ratio and Juniperus pollen(percentages and influx), along with a slight rise of Betula polleninflux but decline in percentages.
3. A rise of Hippophaë (both percentages and influx) and Salix (onlyinflux).
4. A rise of Betula and decline of Juniperus (both percentages andinflux).
3.3.3. Zone GRZpol-3: The birch forests of the Late BøllingThis pollen zone is approximately equivalent to the Greenland
events GI-1e2 and GI-1e3 plus GI-1d, or Late Bølling plus OlderDryas (sensu Welten, 1982). Depth limits are 362.25–333.5 cm, agesca 14,443–13,835 yr BP, a duration of about 600 yr.
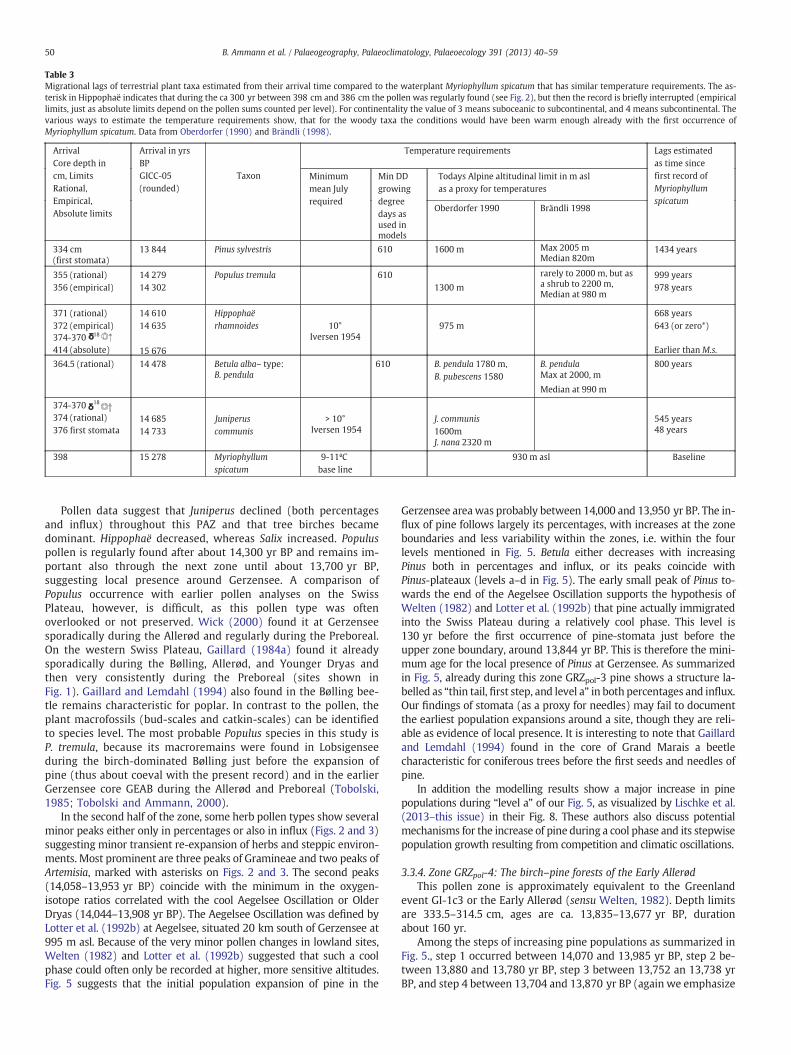
Table 3Migrational lags of terrestrial plant taxa estimated from their arrival time compared to the waterplant Myriophyllum spicatum that has similar temperature requirements. The as-terisk in Hippophaë indicates that during the ca 300 yr between 398 cm and 386 cm the pollen was regularly found (see Fig. 2), but then the record is briefly interrupted (empiricallimits, just as absolute limits depend on the pollen sums counted per level). For continentality the value of 3 means suboceanic to subcontinental, and 4 means subcontinental. Thevarious ways to estimate the temperature requirements show, that for the woody taxa the conditions would have been warm enough already with the first occurrence ofMyriophyllum spicatum. Data from Oberdorfer (1990) and Brändli (1998).
Temperature requirements
Todays Alpine altitudinal limit in m asl
as a proxy for temperatures
Arrival
Core depth in
cm, Limits
Rational,
Empirical,
Absolute limits
Arrival in yrs
BP
GICC-05
(rounded)
Taxon Minimum
mean July
required
Min DD
growing
degree
days as
used in models
Oberdorfer 1990 Brändli 1998
Lags estimated
as time since
first record of
Myriophyllum spicatum
334 cm
(first stomata)
13 844 Pinus sylvestris 610 1600 m Max 2005 m Median 820m
1434 years
355 (rational)
356 (empirical)
14 279
14 302
Populus tremula 610
1300 m
rarely to 2000 m, but as a shrub to 2200 m, Median at 980 m
999 years
978 years
371 (rational)
372 (empirical)
374-370 18
414 (absolute)
14 610
14 635
15 676
Hippophaë rhamnoides 10°
Iversen 1954
975 m
668 years
643 (or zero*)
Earlier than M.s.
364.5 (rational) 14 478 Betula alba– type: B. pendula
610 B. pendula 1780 m,
B. pubescens 1580
B. pendula Max at 2000, m
Median at 990 m
800 years
374-370 18
374 (rational)
376 first stomata
14 685
14 733
Juniperus communis
> 10°
Iversen 1954
J. communis1600m
J. nana 2320 m
545 years
48 years
398 15 278 Myriophyllum spicatum
9-11ºC
base line
Baseline930 m asl
50 B. Ammann et al. / Palaeogeography, Palaeoclimatology, Palaeoecology 391 (2013) 40–59
Pollen data suggest that Juniperus declined (both percentagesand influx) throughout this PAZ and that tree birches becamedominant. Hippophaë decreased, whereas Salix increased. Populuspollen is regularly found after about 14,300 yr BP and remains im-portant also through the next zone until about 13,700 yr BP,suggesting local presence around Gerzensee. A comparison ofPopulus occurrence with earlier pollen analyses on the SwissPlateau, however, is difficult, as this pollen type was oftenoverlooked or not preserved. Wick (2000) found it at Gerzenseesporadically during the Allerød and regularly during the Preboreal.On the western Swiss Plateau, Gaillard (1984a) found it alreadysporadically during the Bølling, Allerød, and Younger Dryas andthen very consistently during the Preboreal (sites shown inFig. 1). Gaillard and Lemdahl (1994) also found in the Bølling bee-tle remains characteristic for poplar. In contrast to the pollen, theplant macrofossils (bud-scales and catkin-scales) can be identifiedto species level. The most probable Populus species in this study isP. tremula, because its macroremains were found in Lobsigenseeduring the birch-dominated Bølling just before the expansion ofpine (thus about coeval with the present record) and in the earlierGerzensee core GEAB during the Allerød and Preboreal (Tobolski,1985; Tobolski and Ammann, 2000).
In the second half of the zone, some herb pollen types show severalminor peaks either only in percentages or also in influx (Figs. 2 and 3)suggesting minor transient re-expansion of herbs and steppic environ-ments. Most prominent are three peaks of Gramineae and two peaks ofArtemisia, marked with asterisks on Figs. 2 and 3. The second peaks(14,058–13,953 yr BP) coincide with the minimum in the oxygen-isotope ratios correlated with the cool Aegelsee Oscillation or OlderDryas (14,044–13,908 yr BP). The Aegelsee Oscillation was defined byLotter et al. (1992b) at Aegelsee, situated 20 km south of Gerzensee at995 m asl. Because of the very minor pollen changes in lowland sites,Welten (1982) and Lotter et al. (1992b) suggested that such a coolphase could often only be recorded at higher, more sensitive altitudes.Fig. 5 suggests that the initial population expansion of pine in the
Gerzensee areawas probably between 14,000 and 13,950 yr BP. The in-flux of pine follows largely its percentages, with increases at the zoneboundaries and less variability within the zones, i.e. within the fourlevels mentioned in Fig. 5. Betula either decreases with increasingPinus both in percentages and influx, or its peaks coincide withPinus-plateaux (levels a–d in Fig. 5). The early small peak of Pinus to-wards the end of the Aegelsee Oscillation supports the hypothesis ofWelten (1982) and Lotter et al. (1992b) that pine actually immigratedinto the Swiss Plateau during a relatively cool phase. This level is130 yr before the first occurrence of pine-stomata just before theupper zone boundary, around 13,844 yr BP. This is therefore the mini-mum age for the local presence of Pinus at Gerzensee. As summarizedin Fig. 5, already during this zone GRZpol-3 pine shows a structure la-belled as “thin tail, first step, and level a” in both percentages and influx.Our findings of stomata (as a proxy for needles) may fail to documentthe earliest population expansions around a site, though they are reli-able as evidence of local presence. It is interesting to note that Gaillardand Lemdahl (1994) found in the core of Grand Marais a beetlecharacteristic for coniferous trees before the first seeds and needles ofpine.
In addition the modelling results show a major increase in pinepopulations during “level a” of our Fig. 5, as visualized by Lischke et al.(2013–this issue) in their Fig. 8. These authors also discuss potentialmechanisms for the increase of pine during a cool phase and its stepwisepopulation growth resulting from competition and climatic oscillations.
3.3.4. Zone GRZpol-4: The birch–pine forests of the Early AllerødThis pollen zone is approximately equivalent to the Greenland
event GI-1c3 or the Early Allerød (sensu Welten, 1982). Depth limitsare 333.5–314.5 cm, ages are ca. 13,835–13,677 yr BP, durationabout 160 yr.
Among the steps of increasing pine populations as summarized inFig. 5., step 1 occurred between 14,070 and 13,985 yr BP, step 2 be-tween 13,880 and 13,780 yr BP, step 3 between 13,752 an 13,738 yrBP, and step 4 between 13,704 and 13,870 yr BP (again we emphasize
0
0.2
0.4
0.6
0.8
1
14500 14550 14600 14650 14700 14750 14800
Years BP
rel.
influ
x (1
/yea
r)
-0.05
-0.03
-0.01
0.01
0.03
0.05
(1/y
ear)
rel. influxJuniperusrel. influxsmoothed rel. oxygenisotopesαα smoothed
0
0.2
0.4
0.6
0.8
1
13500 13700 13900 14100 14300 14500
Years BP
rel.
influ
x (1
/yea
r)
-0.05
-0.03
-0.01
0.01
0.03
0.05
(1/
year
)
rel. influxPinus rel. influxsmoothedrel. oxygenisotopes
B
αα
α
A
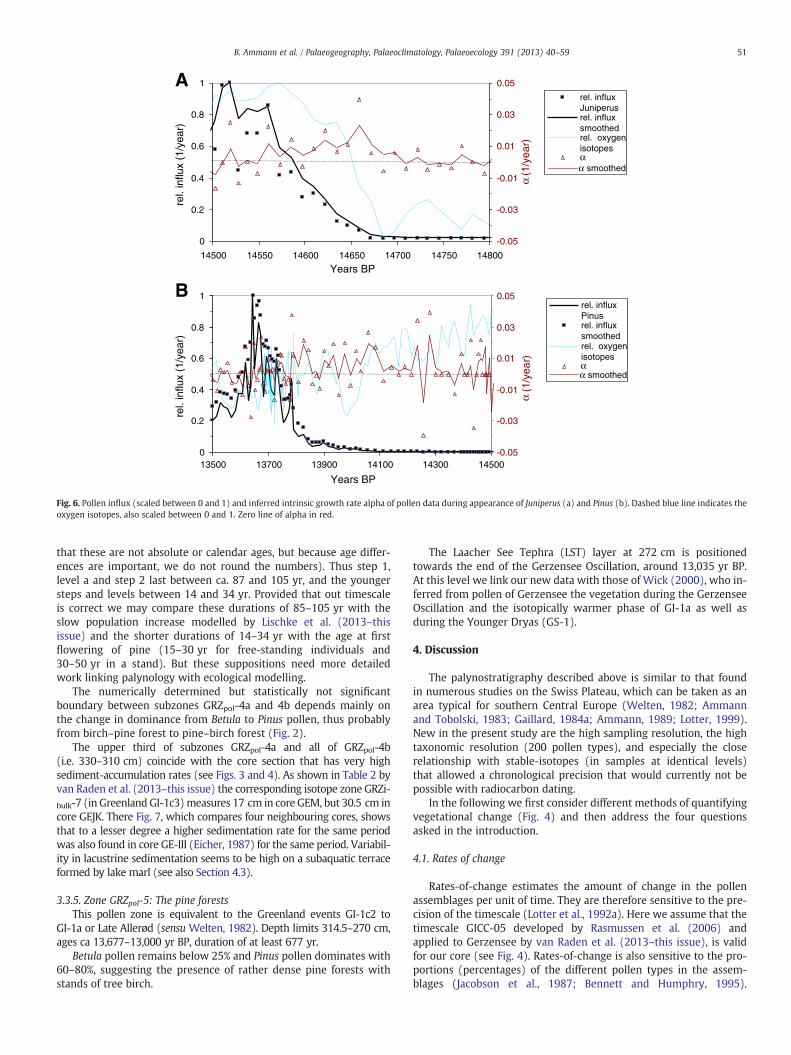
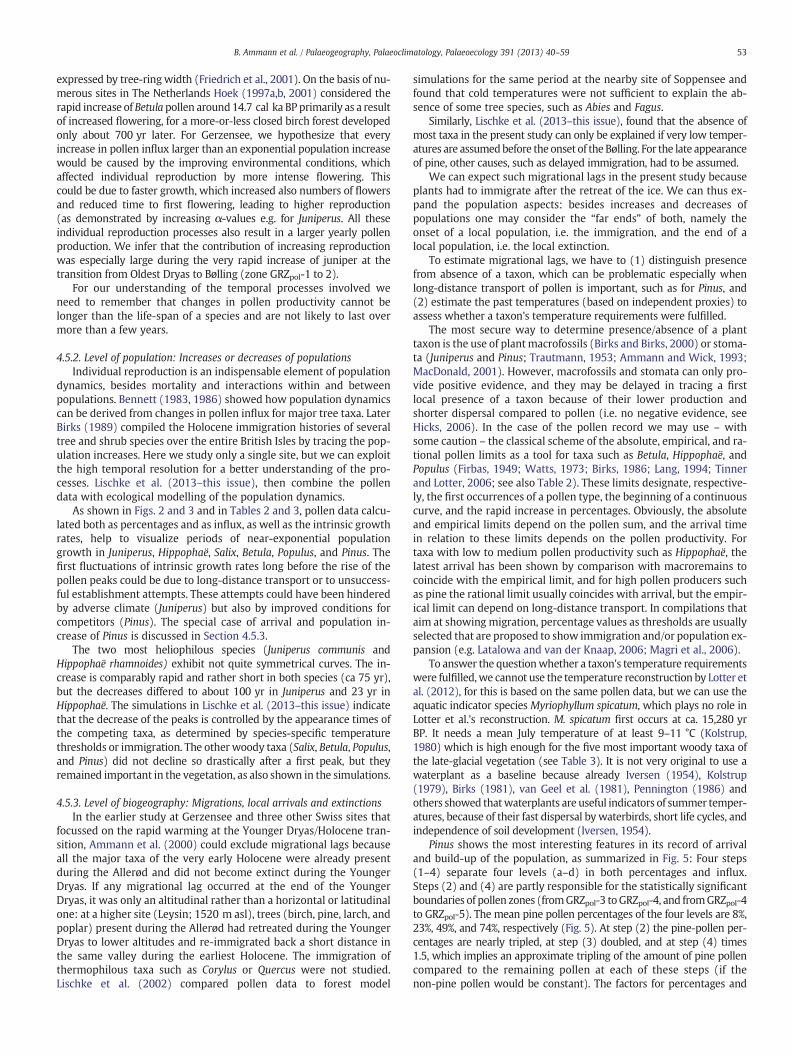
Fig. 6. Pollen influx (scaled between 0 and 1) and inferred intrinsic growth rate alpha of pollen data during appearance of Juniperus (a) and Pinus (b). Dashed blue line indicates theoxygen isotopes, also scaled between 0 and 1. Zero line of alpha in red.
51B. Ammann et al. / Palaeogeography, Palaeoclimatology, Palaeoecology 391 (2013) 40–59
that these are not absolute or calendar ages, but because age differ-ences are important, we do not round the numbers). Thus step 1,level a and step 2 last between ca. 87 and 105 yr, and the youngersteps and levels between 14 and 34 yr. Provided that out timescaleis correct we may compare these durations of 85–105 yr with theslow population increase modelled by Lischke et al. (2013–thisissue) and the shorter durations of 14–34 yr with the age at firstflowering of pine (15–30 yr for free-standing individuals and30–50 yr in a stand). But these suppositions need more detailedwork linking palynology with ecological modelling.
The numerically determined but statistically not significantboundary between subzones GRZpol-4a and 4b depends mainly onthe change in dominance from Betula to Pinus pollen, thus probablyfrom birch–pine forest to pine–birch forest (Fig. 2).
The upper third of subzones GRZpol-4a and all of GRZpol-4b(i.e. 330–310 cm) coincide with the core section that has very highsediment-accumulation rates (see Figs. 3 and 4). As shown in Table 2 byvan Raden et al. (2013–this issue) the corresponding isotope zone GRZi-bulk-7 (in Greenland GI-1c3)measures 17 cm in core GEM, but 30.5 cm incore GEJK. There Fig. 7, which compares four neighbouring cores, showsthat to a lesser degree a higher sedimentation rate for the same periodwas also found in core GE-III (Eicher, 1987) for the same period. Variabil-ity in lacustrine sedimentation seems to be high on a subaquatic terraceformed by lake marl (see also Section 4.3).
3.3.5. Zone GRZpol-5: The pine forestsThis pollen zone is equivalent to the Greenland events GI-1c2 to
GI-1a or Late Allerød (sensu Welten, 1982). Depth limits 314.5–270 cm,ages ca 13,677–13,000 yr BP, duration of at least 677 yr.
Betula pollen remains below 25% and Pinus pollen dominates with60–80%, suggesting the presence of rather dense pine forests withstands of tree birch.
The Laacher See Tephra (LST) layer at 272 cm is positionedtowards the end of the Gerzensee Oscillation, around 13,035 yr BP.At this level we link our new data with those of Wick (2000), who in-ferred from pollen of Gerzensee the vegetation during the GerzenseeOscillation and the isotopically warmer phase of GI-1a as well asduring the Younger Dryas (GS-1).
4. Discussion
The palynostratigraphy described above is similar to that foundin numerous studies on the Swiss Plateau, which can be taken as anarea typical for southern Central Europe (Welten, 1982; Ammannand Tobolski, 1983; Gaillard, 1984a; Ammann, 1989; Lotter, 1999).New in the present study are the high sampling resolution, the hightaxonomic resolution (200 pollen types), and especially the closerelationship with stable-isotopes (in samples at identical levels)that allowed a chronological precision that would currently not bepossible with radiocarbon dating.
In the following we first consider different methods of quantifyingvegetational change (Fig. 4) and then address the four questionsasked in the introduction.
4.1. Rates of change
Rates-of-change estimates the amount of change in the pollenassemblages per unit of time. They are therefore sensitive to the pre-cision of the timescale (Lotter et al., 1992a). Here we assume that thetimescale GICC-05 developed by Rasmussen et al. (2006) andapplied to Gerzensee by van Raden et al. (2013–this issue), is validfor our core (see Fig. 4). Rates-of-change is also sensitive to the pro-portions (percentages) of the different pollen types in the assem-blages (Jacobson et al., 1987; Bennett and Humphry, 1995).
52 B. Ammann et al. / Palaeogeography, Palaeoclimatology, Palaeoecology 391 (2013) 40–59
Analogous to fixed-sum estimates of pollen richness, estimates ofrate-of-change are influenced by the evenness of the pollen assem-blage, depending mainly on the pollen types that are dominant inthe assemblage, and very little on the rare ones. Despite the clear gen-eral link between pollen and plants or vegetation, the dominance rela-tionships (evenness) of plant taxa in the vegetation differ to someextent from that of their pollen types in the assemblages because of dif-ferential pollen productivities, dispersal, and preservation. As a result,rates of change in the pollen sequence may differ from rates of changein the vegetation reflected by the pollen. Not surprisingly, but corrob-orating the relation, the rates of change are generally high at or nearpollen-zone boundaries derived by a different technique (optimalpartitioning by least squares according to Birks and Gordon, 1985).
4.2. PCA
The scores on the axes of PCA are sensitive to the gradient length, or“overall change”. We therefore calculated PCA axis 1 separately for twodata sets, one including the entire period (15,676–12,500 yr BP), theother including the older section only (15,676–13,826 yr BP) (Fig. 4).Both curves have a very sharp increase with the rapid warming(14,685–14,540 yr BP). The trend of PCA axis 1 of the older section re-sembles strongly the juniper pollen curve (Fig. 3). The two curves arealso similar for the period just before the rapid increase of juniper,where a locally present but still small juniper population is inferredfrom the pollen and stomata records (ca 15,200–14,685 yr BP).
4.3. DCCA as an estimate of compositional change (turnover)
Pollen DCCA Axis 1, constrained on sample age presented on Fig. 4,is a relative measure of species (floristic) turnover in the landscape(Birks, 2007; Birks and Birks, 2008). With turnover is meant the ap-pearance of new taxa and disappearance of existing taxa. Constantvalues on Axis 1 indicate that no floristic change took place, and shiftsin values indicate turnover. The axis scores given in standard devia-tions (SD) show a uni-directional and gradual trend from the baseup to the beginning of the Younger Dryas. Values are slightly chang-ing in zone GRZpol-1, somewhat more changing in zones GRZpol-2, 3,and 4, and again slightly changing in zone GRZpol-5 and up to thestart of the Younger Dryas. The gradual character of the changes indi-cates that none of the major, often abrupt shifts in dominant plantspecies had a notable impact on the species turnover in the landscape.This implies that dominants did not matter much for presence/absence of species (see also Section 4.5.4.)
4.4. Dynamics of vegetation during afforestation between 14,700 and14,400 yr BP
The transition from shrub-tundra to a juniper–birch woodland(from zone GRZpol-1 to 2; Figs. 2, 3, 4) was surprisingly fast. Most like-ly this rapid change was due to (1) the rapid rise of annual tempera-tures (as recorded in the oxygen-isotopes: a rise of 3.6‰ in only ca112 yr) and (2) the presence of Juniperus and tree birch alreadybefore the rise in temperatures, so that no migrational lag occurredfor these woody taxa within this period of rapidly rising annual tem-peratures. Pollen productivity of juniper was discussed by Iversen(1954), Birks (1973) and Gaillard (1984a). Productivity of the pros-trate J. communis ssp. nana seems to be much lower than of the tallJ. communis ssp. communis. Because neither pollen nor stomata canbe identified to the level of subspecies, we cannot separate them,unless we also had analyses of macroremains. On the westernSwiss Plateau near Lake Geneva, Weber (1980b) found needlesof J. communis ssp. nana in the sediment from the Oldest Dryas(i.e. before 14,685 yr BP) at an altitude comparable to Gerzensee.
The sequence of dominant or sub-dominant woody taxa (Juniperus– Hippophaë – Betula – Salix) is illustrated in Figs. 2 and 3 and Tables 2
and 3. This sequence forms a pattern already described by e.g. Gaillard(1984a, b), Lotter (1985, 1988, 1999), and Ammann (1989). Salixis ecologically difficult to interpret because many species maycontribute to this pollen type. For the Late-Glacial Lang (1952a)could identify about 9 different species on the basis of macrorests inSW-Germany, and Weber (1977, 1980c) described 10 species on thewestern Swiss Plateau. However, all Salix species prefer open condi-tions and do usually not occur under a dense forest canopy. AtGerzensee the high temporal resolution shows that the increase ofHippophaë (in both percentages and influx) started about 50 yr laterthan that of Juniperus (Table 2), and peaks and declines of the twoshrubs are not exactly synchronous: Juniperus started to declinewith the very first increase of Betula (about at 14,520 yr BP), whereashigh Hippophaë-values continued into the later rapid rise of Betula(about 14,495 yr BP). Gaillard and Weber (1978) and Gaillard(1984a) discussed the possibility that juniper became shaded outby tree-birches. Here we estimate that about 25 yr lapsed betweenthe end of the Juniperus peak (about 14,520 yr BP) and the markedincrease of Betula (about 14,495 yr BP; see Table 2).
At Gerzensee, Larix was not found during the Late Glacial Intersta-dial, but only later, during the Younger Dryas (as pollen and macro-fossils; see Wick, 2000; Tobolski and Ammann, 2000). The timing ofthis shift from shrub-tundra to woodland at the onset of Bølling ischaracteristic for southern Central Europe but contrasts with otherEuropean sites. It was earlier in the foothills of the southern Alpsand in Italy (Tinner et al., 1999; Vescovi et al., 2007) and later farthernorth in central Germany (e.g. Eifel region, (Litt and Stebich, 1999) orin The Netherlands (Hoek, 2001).
The intrinsic growth rates during afforestation are of special inter-est: The influx data of Juniperus, as the most prominent example forthe dynamics of several taxa during afforestation, show a smooth in-crease over 100–200 yr (Fig. 6a), apparently starting at the onset ofthe Bølling. However, the intrinsic growth rate already fluctuatedaround zero for one or two centuries. After 14,680 BP it remainedpositive and increased steadily for about 100 yr, indicating that popu-lation growth accelerated hyperexponentially during that period. Thesubsequent decrease inα of Juniperus was due to intra-specific and in-creasingly also inter-specific competition. Values of α ranged between−0.02/year and +0.04/year. Pinus' α also shows phases with steadyincreases, although frequently interrupted.
4.5. How did the rapid climatic warming at 14.67 ka BP influence the fivelevels of major biological processes?
Table 2 demonstrates that no simple relationship exists betweentemperature change (as recorded in oxygen isotopes) and vegetationdevelopment. But increasing temperatures obviously favoured all five(interlinked) levels of biological response:
(1) Individual reactions (reproduction, including pollen and seedproduction but also growth as shown in tree rings).
(2) Building up or decline of plant populations.(3) Migrations (biogeographical changes or range shifts, partly
controlled by climate or by other environmental variables,such as soils, and partly by life-history traits).
(4) Plant communities depend i.a. on species pools and thereforeon the three levels mentioned above.
(5) Processes at the ecosystem level, including species interactionssuch as competition or facilitation, pedogenesis, nutrientcycling.
4.5.1. Level of the individual: Reproduction and pollen productivityChanged reproduction, resulting in changed pollen production, is the
fastest response to climatic change, for it may occurwithin a year or two(van der Knaap et al., 2010). The speed may be comparable to that ofother responses on the level of the individual, such as changes in growth
53B. Ammann et al. / Palaeogeography, Palaeoclimatology, Palaeoecology 391 (2013) 40–59
expressed by tree-ring width (Friedrich et al., 2001). On the basis of nu-merous sites in The Netherlands Hoek (1997a,b, 2001) considered therapid increase of Betula pollen around14.7 cal ka BP primarily as a resultof increased flowering, for a more-or-less closed birch forest developedonly about 700 yr later. For Gerzensee, we hypothesize that everyincrease in pollen influx larger than an exponential population increasewould be caused by the improving environmental conditions, whichaffected individual reproduction by more intense flowering. Thiscould be due to faster growth, which increased also numbers of flowersand reduced time to first flowering, leading to higher reproduction(as demonstrated by increasing α-values e.g. for Juniperus. All theseindividual reproduction processes also result in a larger yearly pollenproduction. We infer that the contribution of increasing reproductionwas especially large during the very rapid increase of juniper at thetransition from Oldest Dryas to Bølling (zone GRZpol-1 to 2).
For our understanding of the temporal processes involved weneed to remember that changes in pollen productivity cannot belonger than the life-span of a species and are not likely to last overmore than a few years.
4.5.2. Level of population: Increases or decreases of populationsIndividual reproduction is an indispensable element of population
dynamics, besides mortality and interactions within and betweenpopulations. Bennett (1983, 1986) showed how population dynamicscan be derived from changes in pollen influx for major tree taxa. LaterBirks (1989) compiled the Holocene immigration histories of severaltree and shrub species over the entire British Isles by tracing the pop-ulation increases. Here we study only a single site, but we can exploitthe high temporal resolution for a better understanding of the pro-cesses. Lischke et al. (2013–this issue), then combine the pollendata with ecological modelling of the population dynamics.
As shown in Figs. 2 and 3 and in Tables 2 and 3, pollen data calcu-lated both as percentages and as influx, as well as the intrinsic growthrates, help to visualize periods of near-exponential populationgrowth in Juniperus, Hippophaë, Salix, Betula, Populus, and Pinus. Thefirst fluctuations of intrinsic growth rates long before the rise of thepollen peaks could be due to long-distance transport or to unsuccess-ful establishment attempts. These attempts could have been hinderedby adverse climate (Juniperus) but also by improved conditions forcompetitors (Pinus). The special case of arrival and population in-crease of Pinus is discussed in Section 4.5.3.
The two most heliophilous species (Juniperus communis andHippophaë rhamnoides) exhibit not quite symmetrical curves. The in-crease is comparably rapid and rather short in both species (ca 75 yr),but the decreases differed to about 100 yr in Juniperus and 23 yr inHippophaë. The simulations in Lischke et al. (2013–this issue) indicatethat the decrease of the peaks is controlled by the appearance times ofthe competing taxa, as determined by species-specific temperaturethresholds or immigration. The other woody taxa (Salix, Betula, Populus,and Pinus) did not decline so drastically after a first peak, but theyremained important in the vegetation, as also shown in the simulations.
4.5.3. Level of biogeography: Migrations, local arrivals and extinctionsIn the earlier study at Gerzensee and three other Swiss sites that
focussed on the rapid warming at the Younger Dryas/Holocene tran-sition, Ammann et al. (2000) could exclude migrational lags becauseall the major taxa of the very early Holocene were already presentduring the Allerød and did not become extinct during the YoungerDryas. If any migrational lag occurred at the end of the YoungerDryas, it was only an altitudinal rather than a horizontal or latitudinalone: at a higher site (Leysin; 1520 m asl), trees (birch, pine, larch, andpoplar) present during the Allerød had retreated during the YoungerDryas to lower altitudes and re-immigrated back a short distance inthe same valley during the earliest Holocene. The immigration ofthermophilous taxa such as Corylus or Quercus were not studied.Lischke et al. (2002) compared pollen data to forest model
simulations for the same period at the nearby site of Soppensee andfound that cold temperatures were not sufficient to explain the ab-sence of some tree species, such as Abies and Fagus.
Similarly, Lischke et al. (2013–this issue), found that the absence ofmost taxa in the present study can only be explained if very low temper-atures are assumedbefore the onset of the Bølling. For the late appearanceof pine, other causes, such as delayed immigration, had to be assumed.
We can expect such migrational lags in the present study becauseplants had to immigrate after the retreat of the ice. We can thus ex-pand the population aspects: besides increases and decreases ofpopulations one may consider the “far ends” of both, namely theonset of a local population, i.e. the immigration, and the end of alocal population, i.e. the local extinction.
To estimate migrational lags, we have to (1) distinguish presencefrom absence of a taxon, which can be problematic especially whenlong-distance transport of pollen is important, such as for Pinus, and(2) estimate the past temperatures (based on independent proxies) toassess whether a taxon's temperature requirements were fulfilled.
The most secure way to determine presence/absence of a planttaxon is the use of plantmacrofossils (Birks and Birks, 2000) or stoma-ta (Juniperus and Pinus; Trautmann, 1953; Ammann and Wick, 1993;MacDonald, 2001). However, macrofossils and stomata can only pro-vide positive evidence, and they may be delayed in tracing a firstlocal presence of a taxon because of their lower production andshorter dispersal compared to pollen (i.e. no negative evidence, seeHicks, 2006). In the case of the pollen record we may use – withsome caution – the classical scheme of the absolute, empirical, and ra-tional pollen limits as a tool for taxa such as Betula, Hippophaë, andPopulus (Firbas, 1949; Watts, 1973; Birks, 1986; Lang, 1994; Tinnerand Lotter, 2006; see also Table 2). These limits designate, respective-ly, the first occurrences of a pollen type, the beginning of a continuouscurve, and the rapid increase in percentages. Obviously, the absoluteand empirical limits depend on the pollen sum, and the arrival timein relation to these limits depends on the pollen productivity. Fortaxa with low to medium pollen productivity such as Hippophaë, thelatest arrival has been shown by comparison with macroremains tocoincide with the empirical limit, and for high pollen producers suchas pine the rational limit usually coincides with arrival, but the empir-ical limit can depend on long-distance transport. In compilations thataim at showing migration, percentage values as thresholds are usuallyselected that are proposed to show immigration and/or population ex-pansion (e.g. Latalowa and van der Knaap, 2006; Magri et al., 2006).
To answer the questionwhether a taxon's temperature requirementswere fulfilled,we cannot use the temperature reconstruction by Lotter etal. (2012), for this is based on the same pollen data, but we can use theaquatic indicator species Myriophyllum spicatum, which plays no role inLotter et al.'s reconstruction. M. spicatum first occurs at ca. 15,280 yrBP. It needs a mean July temperature of at least 9–11 °C (Kolstrup,1980) which is high enough for the five most important woody taxa ofthe late-glacial vegetation (see Table 3). It is not very original to use awaterplant as a baseline because already Iversen (1954), Kolstrup(1979), Birks (1981), van Geel et al. (1981), Pennington (1986) andothers showed thatwaterplants are useful indicators of summer temper-atures, because of their fast dispersal by waterbirds, short life cycles, andindependence of soil development (Iversen, 1954).
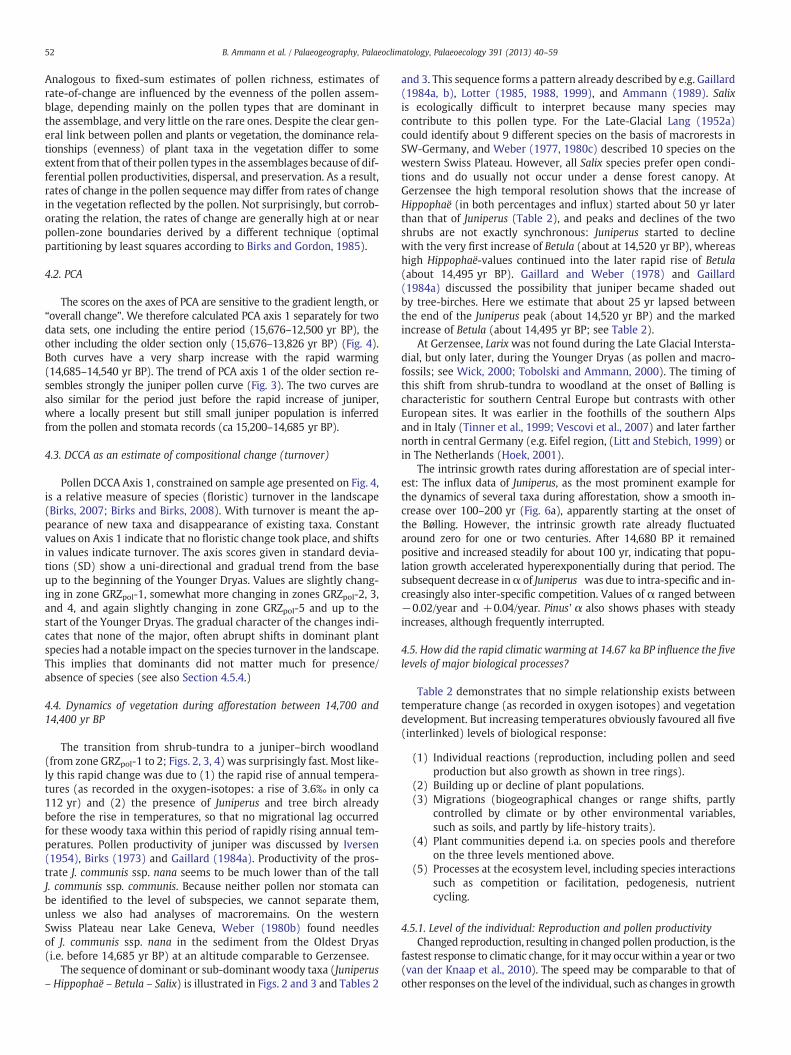
Pinus shows the most interesting features in its record of arrivaland build-up of the population, as summarized in Fig. 5: Four steps(1–4) separate four levels (a–d) in both percentages and influx.Steps (2) and (4) are partly responsible for the statistically significantboundaries of pollen zones (fromGRZpol-3 toGRZpol-4, and fromGRZpol-4to GRZpol-5). The mean pine pollen percentages of the four levels are 8%,23%, 49%, and 74%, respectively (Fig. 5). At step (2) the pine-pollen per-centages are nearly tripled, at step (3) doubled, and at step (4) times1.5, which implies an approximate tripling of the amount of pine pollencompared to the remaining pollen at each of these steps (if thenon-pine pollen would be constant). The factors for percentages and
54 B. Ammann et al. / Palaeogeography, Palaeoclimatology, Palaeoecology 391 (2013) 40–59
influx are quite close together: Means in influx at the four levels are 10,27, 51, and 85 grains mm−2 yr−1 (i.e. nearly tripled, nearly doubledand times 1.66 on steps 2, 3, and 4). It needs to be checked withhigh-resolution sampling if a similar behaviour of Pinus is found atother sites. Stomata suggest that pine arrived at Gerzensee before or atthe beginning of step (2); this step constitutes the rational limit, whichis in agreement with Firbas (1949) as Pinus is a strong pollen producer,whereas in level (a) and step (1), the empirical limit, could still resultfrom either long-distance transport or very scattered local individuals.Pinus is thus certainly locally present at the rational limit (possibly ear-lier), but not necessarily at the empirical limit as is the case with medi-um pollen producers (e.g. Fagus or Abies).
The intrinsic growth rate of Pinus fluctuated around zero for sever-al centuries before 14,100 BP (Fig. 6b). After 14,100 BP, the growthrate remained predominantly positive as the population established.This coincides with the cold period of the Aegelsee Oscillation andwith a decrease of the already established taxa Populus and Betula.However, it cannot be decided, whether Populus and Betula weresuppressed by Pinus or by the colder climate, under which Pinusprofited from the lighter conditions, as suggested by simulations ofLischke et al. (2013–this issue). The age of first flowering in Pinussylvestris is 15–40 yr, but larger amounts of seeds are only producedat an age of 60–70 yr (Zoller, 1981). This could mean that thesesteps may be the expression of new generations of pine or waves inthe build-up of the population 50 to 80 yr apart. This is alsosupported by the intrinsic growth rates, which show fluctuationswith a dominant period of about 40 yr.
Migrational lags depend i.a. on the mobility of a species, which isdetermined by (1) dispersal vectors, e.g. ornithochorous taxa suchas waterplants or Hippophaë often being faster than wind- orwater-dispersed taxa, (2) life cycles, i.e. taxa with short life cyclesbeing faster than taxa with long generation times, (3) competitionthat influences the generation times, (4) climate and soils, and(5) geographical barriers such as mountains or seas (or the lack ofthem). With a dynamic forest landscape model, such as TreeMig(Lischke et al., 2006) these processes and their climate dependencecan be simulated in an integrated way. Potential migration rates andtheir dependence on climatic and competition conditions can beassessed (Meier et al., 2012). Such migration rates are consistentwith the arrival of Pinus in the Gerzensee record from 500 km dis-tance (Lischke et al., 2013–this issue), e.g. from the NortheasternAlps which are discussed as glacial refuges (Cheddadi et al., 2006).
A comparison of terrestrial and aquatic plants is shown in Table 3.Immigration of taxa over time affects the species pool of an area, i.e.the taxa regionally available for the formation of plant communities.
4.5.4. Plant communitiesSpecies respond individually to climatic change. Therefore the region-
al species pool may change over time, and past plant communitiesmay have been non-analogous to modern ones. As shown by Jacksonand Overpeck (2000), changes of two or more environmentalvariables through time may have caused separations or new overlaps ofniche-spaces of taxa. The non-analogue climate during the earlylate-glacial, the incipient soil formation, and migrational lags are at leastthreemajor reasons to expect non-analogue plant communities. A prom-inent example is the juniper-dominated woodland with dwarf birches,willows and some tree birches during the early Bølling that may or maynot be found today in high latitudes. A future study will quantify thesenon-analogue vegetation types for several sites on the Swiss Plateau.
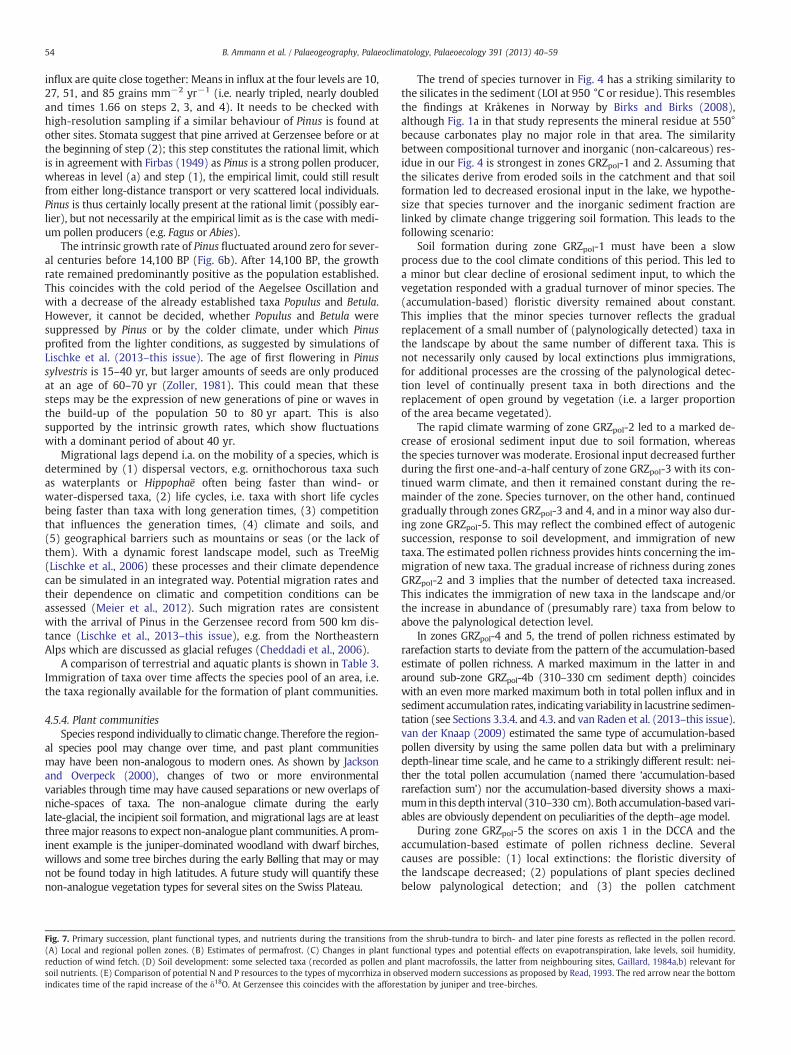
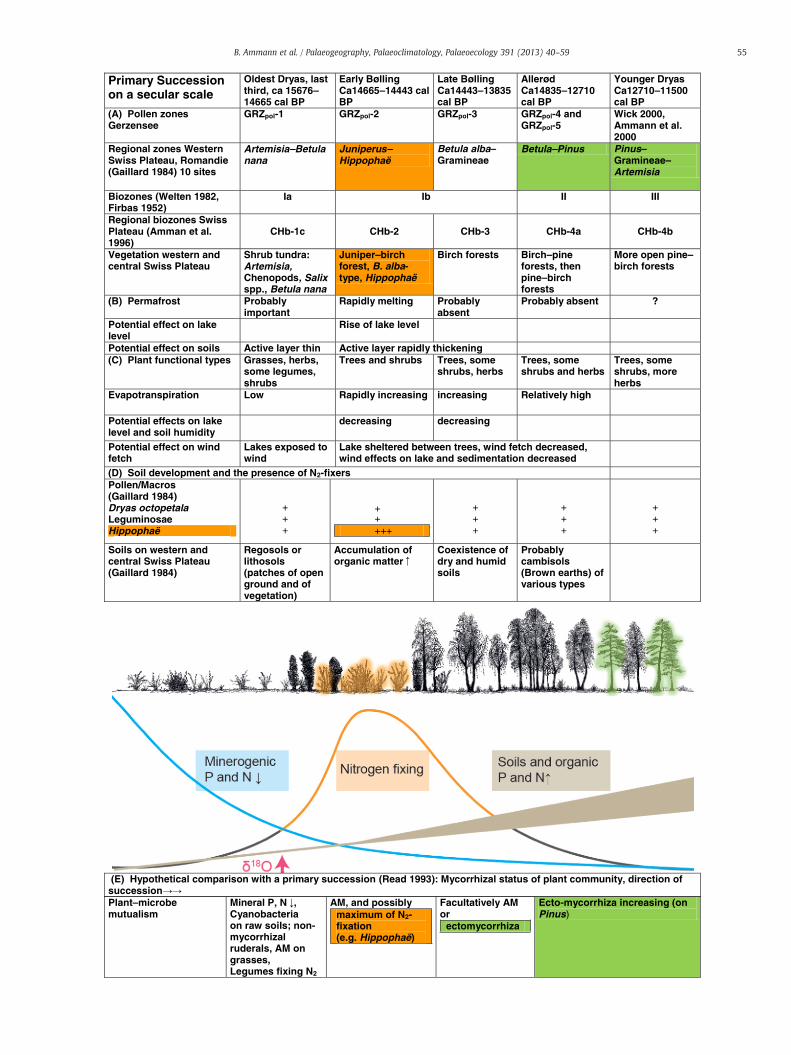
Fig. 7. Primary succession, plant functional types, and nutrients during the transitions fro(A) Local and regional pollen zones. (B) Estimates of permafrost. (C) Changes in plant fureduction of wind fetch. (D) Soil development: some selected taxa (recorded as pollen andsoil nutrients. (E) Comparison of potential N and P resources to the types of mycorrhiza in oindicates time of the rapid increase of the δ18O. At Gerzensee this coincides with the affore
The trend of species turnover in Fig. 4 has a striking similarity tothe silicates in the sediment (LOI at 950 °C or residue). This resemblesthe findings at Kråkenes in Norway by Birks and Birks (2008),although Fig. 1a in that study represents the mineral residue at 550°because carbonates play no major role in that area. The similaritybetween compositional turnover and inorganic (non-calcareous) res-idue in our Fig. 4 is strongest in zones GRZpol-1 and 2. Assuming thatthe silicates derive from eroded soils in the catchment and that soilformation led to decreased erosional input in the lake, we hypothe-size that species turnover and the inorganic sediment fraction arelinked by climate change triggering soil formation. This leads to thefollowing scenario:
Soil formation during zone GRZpol-1 must have been a slowprocess due to the cool climate conditions of this period. This led toa minor but clear decline of erosional sediment input, to which thevegetation responded with a gradual turnover of minor species. The(accumulation-based) floristic diversity remained about constant.This implies that the minor species turnover reflects the gradualreplacement of a small number of (palynologically detected) taxa inthe landscape by about the same number of different taxa. This isnot necessarily only caused by local extinctions plus immigrations,for additional processes are the crossing of the palynological detec-tion level of continually present taxa in both directions and thereplacement of open ground by vegetation (i.e. a larger proportionof the area became vegetated).
The rapid climate warming of zone GRZpol-2 led to a marked de-crease of erosional sediment input due to soil formation, whereasthe species turnover was moderate. Erosional input decreased furtherduring the first one-and-a-half century of zone GRZpol-3 with its con-tinued warm climate, and then it remained constant during the re-mainder of the zone. Species turnover, on the other hand, continuedgradually through zones GRZpol-3 and 4, and in a minor way also dur-ing zone GRZpol-5. This may reflect the combined effect of autogenicsuccession, response to soil development, and immigration of newtaxa. The estimated pollen richness provides hints concerning the im-migration of new taxa. The gradual increase of richness during zonesGRZpol-2 and 3 implies that the number of detected taxa increased.This indicates the immigration of new taxa in the landscape and/orthe increase in abundance of (presumably rare) taxa from below toabove the palynological detection level.
In zones GRZpol-4 and 5, the trend of pollen richness estimated byrarefaction starts to deviate from the pattern of the accumulation-basedestimate of pollen richness. A marked maximum in the latter in andaround sub-zone GRZpol-4b (310–330 cm sediment depth) coincideswith an even more marked maximum both in total pollen influx and insediment accumulation rates, indicating variability in lacustrine sedimen-tation (see Sections 3.3.4. and 4.3. and van Raden et al. (2013–this issue).van der Knaap (2009) estimated the same type of accumulation-basedpollen diversity by using the same pollen data but with a preliminarydepth-linear time scale, and he came to a strikingly different result: nei-ther the total pollen accumulation (named there ‘accumulation-basedrarefaction sum’) nor the accumulation-based diversity shows a maxi-mumin this depth interval (310–330 cm). Both accumulation-basedvari-ables are obviously dependent on peculiarities of the depth–age model.
During zone GRZpol-5 the scores on axis 1 in the DCCA and theaccumulation-based estimate of pollen richness decline. Severalcauses are possible: (1) local extinctions: the floristic diversity ofthe landscape decreased; (2) populations of plant species declinedbelow palynological detection; and (3) the pollen catchment
m the shrub-tundra to birch- and later pine forests as reflected in the pollen record.nctional types and potential effects on evapotranspiration, lake levels, soil humidity,plant macrofossils, the latter from neighbouring sites, Gaillard, 1984a,b) relevant for
bserved modern successions as proposed by Read, 1993. The red arrow near the bottomstation by juniper and tree-birches.
Primary Successionon a secular scale
Oldest Dryas, last third, ca 15676–14665 cal BP
Early BøllingCa14665–14443 calBP
Late BøllingCa14443–13835 cal BP
AllerødCa14835–12710 cal BP
Younger DryasCa12710–11500 cal BP
(A) Pollen zonesGerzensee
GRZpol-1 GRZpol-2 GRZpol-3 GRZpol-4 and GRZpol-5
Wick 2000, Ammann et al. 2000
Regional zones Western Swiss Plateau, Romandie (Gaillard 1984) 10 sites
Artemisia–Betula nana
Juniperus–Hippophaë
Betula alba–Gramineae
Betula–Pinus Pinus–Gramineae–Artemisia
Biozones (Welten 1982, Firbas 1952)
Ia Ib II III
Regional biozones Swiss Plateau (Amman et al.1996)
CHb-1c CHb-2 CHb-3 CHb-4a CHb-4b
Vegetation western and central Swiss Plateau
Shrub tundra: Artemisia,Chenopods, Salixspp., Betula nana
Juniper–birch forest, B. alba-type, Hippophaë
Birch forests Birch–pine forests, then pine–birch forests
More open pine–birch forests
(B) Permafrost Probably important
Rapidly melting Probably absent
Probably absent ?
Potential effect on lake level
Rise of lake level
Potential effect on soils Active layer thin Active layer rapidly thickening(C) Plant functional types Grasses, herbs,
some legumes, shrubs
Trees and shrubs Trees, some shrubs, herbs
Trees, some shrubs and herbs
Trees, some shrubs, more herbs
Evapotranspiration Low Rapidly increasing increasing Relatively high
Potential effects on lake level and soil humidity
decreasing decreasing
Potential effect on wind fetch
Lakes exposed to wind
Lake sheltered between trees, wind fetch decreased, wind effects on lake and sedimentation decreased
(D) Soil development and the presence of N2-fixersPollen/Macros (Gaillard 1984)Dryas octopetalaLeguminosaeHippophaë
+++
+++++
+++
+++
+++
Soils on western and central Swiss Plateau (Gaillard 1984)
Regosols or lithosols (patches of open ground and of vegetation)
Accumulation of organic matter
Coexistence of dry and humid soils
Probably cambisols (Brown earths) of various types
(E) Hypothetical comparison with a primary succession (Read 1993): Mycorrhizal status of plant community, direction of successionPlant–microbe mutualism
Mineral P, N ,Cyanobacteria on raw soils; non-mycorrhizal ruderals, AM on grasses, Legumes fixing N2
AM, and possibly maximum of N2-fixation(e.g. Hippophaë)
Facultatively AMor
ectomycorrhiza
Ecto-mycorrhiza increasing (on Pinus)
55B. Ammann et al. / Palaeogeography, Palaeoclimatology, Palaeoecology 391 (2013) 40–59
56 B. Ammann et al. / Palaeogeography, Palaeoclimatology, Palaeoecology 391 (2013) 40–59
decreased due to the newly established Pinus–Betulawoodland filteringoutmuch pollen before it could reach the lake. (1) is not unlikely due tooutshading by the woodland, and (2) and especially (3) are likely. Incontrast, the juniper expansion during GRZpol-2 did not have any no-ticeable effect on floristic diversity if estimated by accumulation-basedpollen richness (but pollen richness by rarefaction based on a constantpollen sum does show a minimum in GRZpol-2). This indicates that thejuniper shrubland remained sufficiently open for continued growth ofherbs.
As all estimates of biodiversity depend on the two componentsof (1) species richness and (2) evenness, it is interesting to notethe curve of pollen evenness calculated here as PIE (probability ofinterspecific encounters, according to Hurlbert, 1971; see van derKnaap, 2009) in Fig. 4: the strongest change in evenness co-occurswith the “juniper-jump”. As van der Knaap (2009) discussed theevenness of a pollen assemblage and the evenness of the vegetationmay differ quite strongly due to differences in taxon-specific pollenproductivity.
4.5.5. Level of the ecosystem
4.5.5.1. The example of mycorrhiza and N2-fixers. At many sites ofsouthern Central Europe, the late-glacial vegetation development wasinterpreted as a primary succession in which various species interac-tions occur. Well known are the competition for light and the facilita-tion by the accumulation of organic matter fostering pedogenesis.The sequence from pioneer taxa undemanding concerning soils totaxa requiring developed soils is well described (e.g. Iversen, 1954;Gaillard, 1984a) but hard to quantify.
Supply of nutrients is linked to at least three sources: (1) the com-position of the inorganic sub-soil, (2) the accumulation of organicmatter, and (3) symbioses between microorganisms and phanero-gams. We hypothesize that the temporal sequence at Gerzensee(and many other sites in Central Europe) recorded in the pollen issimilar to the succession derived from spatial observations andchronosequences (see Fig. 7). Read (1993) recognized four stages inspace that are possibly comparable to four pollen zones in time.
(1) In early phases of primary succession with much open groundand patchy vegetation, the minerogenic supplies of P and Nmay or may not be high (depending on the geological back-ground). They decrease with closing vegetation cover. Theearly nitrogen-fixers may not leave any fossil trace becausethey are primarily cyanobacteria (both free-living and symbi-otic in lichens), as found in modern studies of the primary suc-cession in glacier forefields (Solheim et al., 1996). As van Geelet al. (1996) summarize, Cyanobacteria are so far not recordedas recognizable fossils from terrestrial sites, whereas aquaticCyanobacteria are.
(2) With decreasing minerogenic N-supply, major N2-fixersestablish such as Rhizobium (bacteria) on nodulated legumesand Frankia (actinomycetes) on Dryas spp. and Hippophaë.After this, the succession of mycorrhiza types may openwith Dark Septate Endophytes (Jumpponen and Trappe, 1998;Jumpponen, 2001), and arbuscular mycorrhiza (AM; a form ofendomycorrhiza, formerly called vesicular–arbuscular or VA)on non-woody plants such as herbs, grasses, and forbs. AM pro-vides primarily phosphorus and may go through various succes-sional stages (Hart and Klironomos, 2002; Hart et al., 2003). Inparallel, the leaf-litter increases in quantity and changes in qual-ity.
(3) Later, with afforestation, ectomycorrhiza become important.They are found today on taxa such as Dryas, Helianthemum,Salix, B. nana, and Helianthemum (all wide-spread during theshrub-tundra phase of the Oldest Dryas), on tree birches andPopulus (important during the Bølling), and on Pinus (important
during the Allerød). Ectomycorrhiza provides both N and P.The temporal transition from AM to ectomycorrhiza is notsharp, as illustrated by Salix, a genus that includes both earlyand transitional species. Salix herbacea is one of the earliestectomycorrhizal plants in glacier forefields (Graf and Brunner,1997; Mühlmann and Peintner, 2008), whereas S. repens wasobserved as having abundant ectomycorrhiza but little AM(van der Hejden and Vosatka, 1999). Maximum N2 fixation tookplace during the afforestation phase (with abundant Hippophaë)when Juniperus was dominant. For Hippophaë see also themodelling study of Pfeiffer et al. (2013–this issue). For Juniperus,endomycorrhiza are commonly reported and ectomycorrhizaoccasionally (Thomas et al., 2007). In addition DeLuca andZackrisson (2007) found enhanced soil fertility under Juniperuspartly due to the facilitation (through shade, soil, and air humidi-ty) of the nitrogen-fixing feather moss Pleurozium schreberi. Such“islands of fertility” under Juniperus may also be enhancedthrough the capability of juniper to exploit bio-available N and Pthrough its extensive root system (DeLuca and Zackrisson,2007). The phase of maximum N2 fixation is in both the spatial(Read, 1993) and the temporal (Gerzensee) sequence intercalatedbetween grassland (with much AM) and pioneer forest (with AMand ectomycorrhiza).
(4) As succession proceeds, organic litter reinforces the change frommainly AM to more ectomycorrhiza and ericoid mycorrhiza, be-cause only the latter two are adapted to litter. With soil develop-ment and its leaching, ericoid mycorrhiza start to play a majorrole. A modern study of a chronosequence in a glacier forefieldby Cazares et al. (2005), shows this clearly, although on a muchshorter time scale (60 yr).
In aquatic systems van Geel et al. (1984, 1989) found sheets of theN2-fixing pioneers of the Gleotrichia-type in the early Late-Glacial ofUsselo.
In other parts of the world, there are some successions where it isnot Hippophaë but Alnus (and Sheperdia), which also has nodules ofFrankia, which plays a major role, e.g. in Glacier Bay, Alaska, where –
after Salix and Dryas – Alnus sinuata becomes dominant (Chapin etal., 1994; Engstrom et al., 2000; Engstrom and Fritz, 2006). Also atGrandfather Lake, Alaska, where the increase of Alnus pollen runsparallel with increasing percentages of C and N in the lake sediment(Hu et al., 2001). But on the Swiss Plateau Alnus only arrived duringthe Holocene.
4.5.5.2. Feedbacks on the ecosystem level. Feedbacks on regional andglobal scales (including climate) are discussed in the synthesis,which reviews biotic responses to climate change in both terrestrialand aquatic ecosystems (Ammann et al., this issue). But already at alocal scale and for terrestrial ecosystems we can infer feedback mech-anisms. These may concern the compartments of soils, hydrology,vegetation, and their interactions. One example is given above withthe hypothesis on a temporal sequence of nitrogen fixers (compara-ble to the spatial sequence as observed today, Fig. 7): The nitrogenenrichment in the soil by N2-fixation can be considered as a positivefeedback in the ecosystem, by increasing the population of the N2-fixers and further N2-fixation. This is another potential causefor the (intermediate) increase in the intrinsic growth rate, i.e.hyperexponential growth of Juniperus (Lischke et al., 2013–thisissue). In addition quality and quantity of the litter changed, espe-cially also with the increase of the populations of tree birches,willows, and poplar with higher LAI than tundra plants. This in turnadded organic matter to the developing soils (see decreasing valuesof the minerogenic residue on loss on ignition at 950 °C on Fig. 4, in-dicating less open gound and more vegetation cover). With increas-ing organic matter in the soils there the water-holding capacityimproved (compared to the till rich in sand). This in turn may have
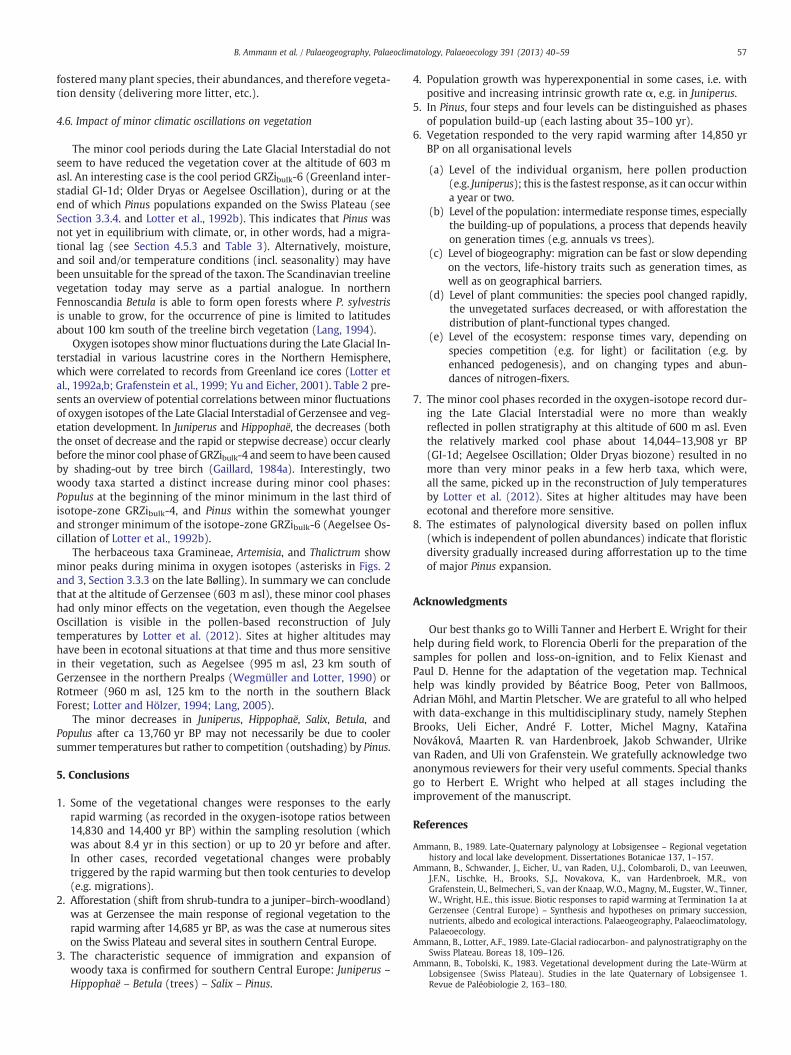
57B. Ammann et al. / Palaeogeography, Palaeoclimatology, Palaeoecology 391 (2013) 40–59
fosteredmany plant species, their abundances, and therefore vegeta-tion density (delivering more litter, etc.).
4.6. Impact of minor climatic oscillations on vegetation
The minor cool periods during the Late Glacial Interstadial do notseem to have reduced the vegetation cover at the altitude of 603 masl. An interesting case is the cool period GRZibulk-6 (Greenland inter-stadial GI-1d; Older Dryas or Aegelsee Oscillation), during or at theend of which Pinus populations expanded on the Swiss Plateau (seeSection 3.3.4. and Lotter et al., 1992b). This indicates that Pinus wasnot yet in equilibrium with climate, or, in other words, had a migra-tional lag (see Section 4.5.3 and Table 3). Alternatively, moisture,and soil and/or temperature conditions (incl. seasonality) may havebeen unsuitable for the spread of the taxon. The Scandinavian treelinevegetation today may serve as a partial analogue. In northernFennoscandia Betula is able to form open forests where P. sylvestrisis unable to grow, for the occurrence of pine is limited to latitudesabout 100 km south of the treeline birch vegetation (Lang, 1994).
Oxygen isotopes showminor fluctuations during the Late Glacial In-terstadial in various lacustrine cores in the Northern Hemisphere,which were correlated to records from Greenland ice cores (Lotter etal., 1992a,b; Grafenstein et al., 1999; Yu and Eicher, 2001). Table 2 pre-sents an overview of potential correlations between minor fluctuationsof oxygen isotopes of the Late Glacial Interstadial of Gerzensee and veg-etation development. In Juniperus and Hippophaë, the decreases (boththe onset of decrease and the rapid or stepwise decrease) occur clearlybefore theminor cool phase of GRZibulk-4 and seem to have been causedby shading-out by tree birch (Gaillard, 1984a). Interestingly, twowoody taxa started a distinct increase during minor cool phases:Populus at the beginning of the minor minimum in the last third ofisotope-zone GRZibulk-4, and Pinus within the somewhat youngerand stronger minimum of the isotope-zone GRZibulk-6 (Aegelsee Os-cillation of Lotter et al., 1992b).
The herbaceous taxa Gramineae, Artemisia, and Thalictrum showminor peaks during minima in oxygen isotopes (asterisks in Figs. 2and 3, Section 3.3.3 on the late Bølling). In summary we can concludethat at the altitude of Gerzensee (603 m asl), these minor cool phaseshad only minor effects on the vegetation, even though the AegelseeOscillation is visible in the pollen-based reconstruction of Julytemperatures by Lotter et al. (2012). Sites at higher altitudes mayhave been in ecotonal situations at that time and thus more sensitivein their vegetation, such as Aegelsee (995 m asl, 23 km south ofGerzensee in the northern Prealps (Wegmüller and Lotter, 1990) orRotmeer (960 m asl, 125 km to the north in the southern BlackForest; Lotter and Hölzer, 1994; Lang, 2005).
The minor decreases in Juniperus, Hippophaë, Salix, Betula, andPopulus after ca 13,760 yr BP may not necessarily be due to coolersummer temperatures but rather to competition (outshading) by Pinus.
5. Conclusions
1. Some of the vegetational changes were responses to the earlyrapid warming (as recorded in the oxygen-isotope ratios between14,830 and 14,400 yr BP) within the sampling resolution (whichwas about 8.4 yr in this section) or up to 20 yr before and after.In other cases, recorded vegetational changes were probablytriggered by the rapid warming but then took centuries to develop(e.g. migrations).
2. Afforestation (shift from shrub-tundra to a juniper–birch-woodland)was at Gerzensee the main response of regional vegetation to therapid warming after 14,685 yr BP, as was the case at numerous siteson the Swiss Plateau and several sites in southern Central Europe.
3. The characteristic sequence of immigration and expansion ofwoody taxa is confirmed for southern Central Europe: Juniperus –Hippophaë – Betula (trees) – Salix – Pinus.
4. Population growth was hyperexponential in some cases, i.e. withpositive and increasing intrinsic growth rate α, e.g. in Juniperus.
5. In Pinus, four steps and four levels can be distinguished as phasesof population build-up (each lasting about 35–100 yr).
6. Vegetation responded to the very rapid warming after 14,850 yrBP on all organisational levels
(a) Level of the individual organism, here pollen production(e.g. Juniperus); this is the fastest response, as it can occurwithina year or two.
(b) Level of the population: intermediate response times, especiallythe building-up of populations, a process that depends heavilyon generation times (e.g. annuals vs trees).
(c) Level of biogeography: migration can be fast or slow dependingon the vectors, life-history traits such as generation times, aswell as on geographical barriers.
(d) Level of plant communities: the species pool changed rapidly,the unvegetated surfaces decreased, or with afforestation thedistribution of plant-functional types changed.
(e) Level of the ecosystem: response times vary, depending onspecies competition (e.g. for light) or facilitation (e.g. byenhanced pedogenesis), and on changing types and abun-dances of nitrogen-fixers.
7. The minor cool phases recorded in the oxygen-isotope record dur-ing the Late Glacial Interstadial were no more than weaklyreflected in pollen stratigraphy at this altitude of 600 m asl. Eventhe relatively marked cool phase about 14,044–13,908 yr BP(GI-1d; Aegelsee Oscillation; Older Dryas biozone) resulted in nomore than very minor peaks in a few herb taxa, which were,all the same, picked up in the reconstruction of July temperaturesby Lotter et al. (2012). Sites at higher altitudes may have beenecotonal and therefore more sensitive.
8. The estimates of palynological diversity based on pollen influx(which is independent of pollen abundances) indicate that floristicdiversity gradually increased during afforrestation up to the timeof major Pinus expansion.
Acknowledgments
Our best thanks go to Willi Tanner and Herbert E. Wright for theirhelp during field work, to Florencia Oberli for the preparation of thesamples for pollen and loss-on-ignition, and to Felix Kienast andPaul D. Henne for the adaptation of the vegetation map. Technicalhelp was kindly provided by Béatrice Boog, Peter von Ballmoos,Adrian Möhl, and Martin Pletscher. We are grateful to all who helpedwith data-exchange in this multidisciplinary study, namely StephenBrooks, Ueli Eicher, André F. Lotter, Michel Magny, KatařinaNováková, Maarten R. van Hardenbroek, Jakob Schwander, Ulrikevan Raden, and Uli von Grafenstein. We gratefully acknowledge twoanonymous reviewers for their very useful comments. Special thanksgo to Herbert E. Wright who helped at all stages including theimprovement of the manuscript.
References
Ammann, B., 1989. Late-Quaternary palynology at Lobsigensee – Regional vegetationhistory and local lake development. Dissertationes Botanicae 137, 1–157.
Ammann, B., Schwander, J., Eicher, U., van Raden, U.J., Colombaroli, D., van Leeuwen,J.F.N., Lischke, H., Brooks, S.J., Novakova, K., van Hardenbroek, M.R., vonGrafenstein, U., Belmecheri, S., van der Knaap,W.O., Magny, M., Eugster, W., Tinner,W., Wright, H.E., this issue. Biotic responses to rapid warming at Termination 1a atGerzensee (Central Europe) – Synthesis and hypotheses on primary succession,nutrients, albedo and ecological interactions. Palaeogeography, Palaeoclimatology,Palaeoecology.
Ammann, B., Lotter, A.F., 1989. Late-Glacial radiocarbon- and palynostratigraphy on theSwiss Plateau. Boreas 18, 109–126.
Ammann, B., Tobolski, K., 1983. Vegetational development during the Late-Würm atLobsigensee (Swiss Plateau). Studies in the late Quaternary of Lobsigensee 1.Revue de Paléobiologie 2, 163–180.
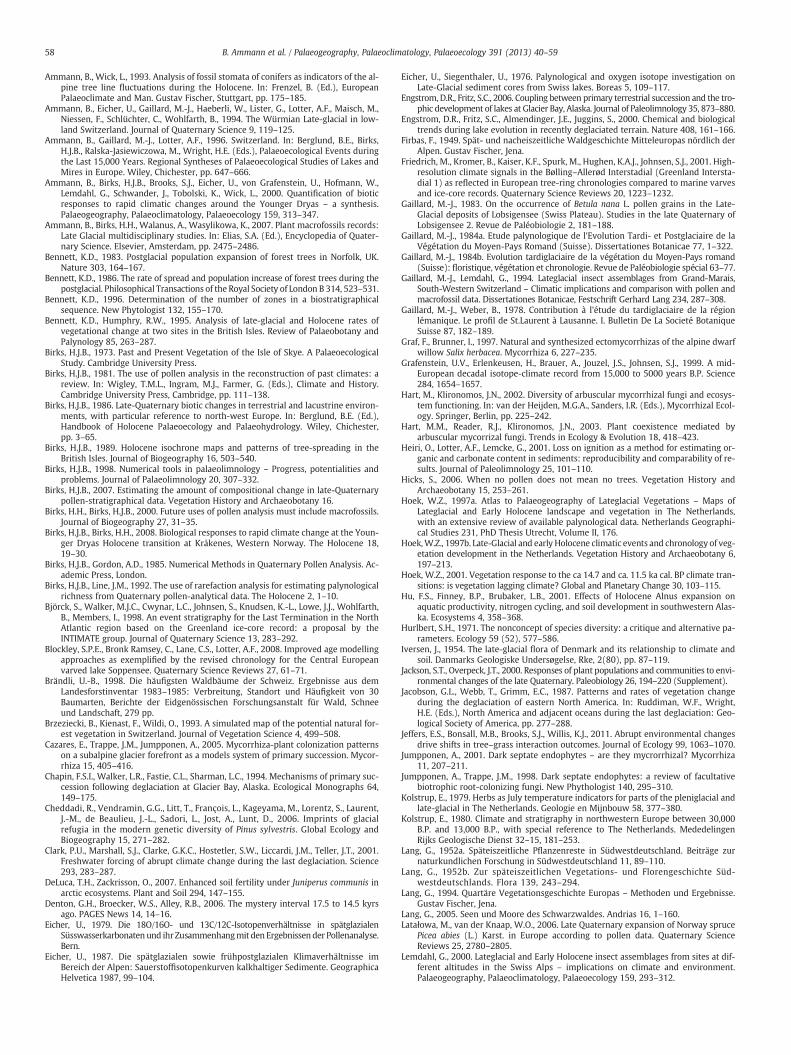
58 B. Ammann et al. / Palaeogeography, Palaeoclimatology, Palaeoecology 391 (2013) 40–59
Ammann, B., Wick, L., 1993. Analysis of fossil stomata of conifers as indicators of the al-pine tree line fluctuations during the Holocene. In: Frenzel, B. (Ed.), EuropeanPalaeoclimate and Man. Gustav Fischer, Stuttgart, pp. 175–185.
Ammann, B., Eicher, U., Gaillard, M.-J., Haeberli, W., Lister, G., Lotter, A.F., Maisch, M.,Niessen, F., Schlüchter, C., Wohlfarth, B., 1994. The Würmian Late-glacial in low-land Switzerland. Journal of Quaternary Science 9, 119–125.
Ammann, B., Gaillard, M.-J., Lotter, A.F., 1996. Switzerland. In: Berglund, B.E., Birks,H.J.B., Ralska-Jasiewiczowa, M., Wright, H.E. (Eds.), Palaeoecological Events duringthe Last 15,000 Years. Regional Syntheses of Palaeoecological Studies of Lakes andMires in Europe. Wiley, Chichester, pp. 647–666.
Ammann, B., Birks, H.J.B., Brooks, S.J., Eicher, U., von Grafenstein, U., Hofmann, W.,Lemdahl, G., Schwander, J., Tobolski, K., Wick, L., 2000. Quantification of bioticresponses to rapid climatic changes around the Younger Dryas – a synthesis.Palaeogeography, Palaeoclimatology, Palaeoecology 159, 313–347.
Ammann, B., Birks, H.H., Walanus, A., Wasylikowa, K., 2007. Plant macrofossils records:Late Glacial multidisciplinary studies. In: Elias, S.A. (Ed.), Encyclopedia of Quater-nary Science. Elsevier, Amsterdam, pp. 2475–2486.
Bennett, K.D., 1983. Postglacial population expansion of forest trees in Norfolk, UK.Nature 303, 164–167.
Bennett, K.D., 1986. The rate of spread and population increase of forest trees during thepostglacial. Philosophical Transactions of the Royal Society of London B 314, 523–531.
Bennett, K.D., 1996. Determination of the number of zones in a biostratigraphicalsequence. New Phytologist 132, 155–170.
Bennett, K.D., Humphry, R.W., 1995. Analysis of late-glacial and Holocene rates ofvegetational change at two sites in the British Isles. Review of Palaeobotany andPalynology 85, 263–287.
Birks, H.J.B., 1973. Past and Present Vegetation of the Isle of Skye. A PalaeoecologicalStudy. Cambridge University Press.
Birks, H.J.B., 1981. The use of pollen analysis in the reconstruction of past climates: areview. In: Wigley, T.M.L., Ingram, M.J., Farmer, G. (Eds.), Climate and History.Cambridge University Press, Cambridge, pp. 111–138.
Birks, H.J.B., 1986. Late-Quaternary biotic changes in terrestrial and lacustrine environ-ments, with particular reference to north-west Europe. In: Berglund, B.E. (Ed.),Handbook of Holocene Palaeoecology and Palaeohydrology. Wiley, Chichester,pp. 3–65.
Birks, H.J.B., 1989. Holocene isochrone maps and patterns of tree-spreading in theBritish Isles. Journal of Biogeography 16, 503–540.
Birks, H.J.B., 1998. Numerical tools in palaeolimnology – Progress, potentialities andproblems. Journal of Palaeolimnology 20, 307–332.
Birks, H.J.B., 2007. Estimating the amount of compositional change in late-Quaternarypollen-stratigraphical data. Vegetation History and Archaeobotany 16.
Birks, H.H., Birks, H.J.B., 2000. Future uses of pollen analysis must include macrofossils.Journal of Biogeography 27, 31–35.
Birks, H.J.B., Birks, H.H., 2008. Biological responses to rapid climate change at the Youn-ger Dryas Holocene transition at Kråkenes, Western Norway. The Holocene 18,19–30.
Birks, H.J.B., Gordon, A.D., 1985. Numerical Methods in Quaternary Pollen Analysis. Ac-ademic Press, London.
Birks, H.J.B., Line, J.M., 1992. The use of rarefaction analysis for estimating palynologicalrichness from Quaternary pollen-analytical data. The Holocene 2, 1–10.
Björck, S., Walker, M.J.C., Cwynar, L.C., Johnsen, S., Knudsen, K.-L., Lowe, J.J., Wohlfarth,B., Members, I., 1998. An event stratigraphy for the Last Termination in the NorthAtlantic region based on the Greenland ice-core record: a proposal by theINTIMATE group. Journal of Quaternary Science 13, 283–292.
Blockley, S.P.E., Bronk Ramsey, C., Lane, C.S., Lotter, A.F., 2008. Improved age modellingapproaches as exemplified by the revised chronology for the Central Europeanvarved lake Soppensee. Quaternary Science Reviews 27, 61–71.
Brändli, U.-B., 1998. Die häufigsten Waldbäume der Schweiz. Ergebnisse aus demLandesforstinventar 1983–1985: Verbreitung, Standort und Häufigkeit von 30Baumarten, Berichte der Eidgenössischen Forschungsanstalt für Wald, Schneeund Landschaft, 279 pp.
Brzeziecki, B., Kienast, F., Wildi, O., 1993. A simulated map of the potential natural for-est vegetation in Switzerland. Journal of Vegetation Science 4, 499–508.
Cazares, E., Trappe, J.M., Jumpponen, A., 2005. Mycorrhiza-plant colonization patternson a subalpine glacier forefront as a models system of primary succession. Mycor-rhiza 15, 405–416.
Chapin, F.S.I., Walker, L.R., Fastie, C.L., Sharman, L.C., 1994. Mechanisms of primary suc-cession following deglaciation at Glacier Bay, Alaska. Ecological Monographs 64,149–175.
Cheddadi, R., Vendramin, G.G., Litt, T., François, L., Kageyama, M., Lorentz, S., Laurent,J.-M., de Beaulieu, J.-L., Sadori, L., Jost, A., Lunt, D., 2006. Imprints of glacialrefugia in the modern genetic diversity of Pinus sylvestris. Global Ecology andBiogeography 15, 271–282.
Clark, P.U., Marshall, S.J., Clarke, G.K.C., Hostetler, S.W., Liccardi, J.M., Teller, J.T., 2001.Freshwater forcing of abrupt climate change during the last deglaciation. Science293, 283–287.
DeLuca, T.H., Zackrisson, O., 2007. Enhanced soil fertility under Juniperus communis inarctic ecosystems. Plant and Soil 294, 147–155.
Denton, G.H., Broecker, W.S., Alley, R.B., 2006. The mystery interval 17.5 to 14.5 kyrsago. PAGES News 14, 14–16.
Eicher, U., 1979. Die 18O/16O- und 13C/12C-Isotopenverhältnisse in spätglazialenSüsswasserkarbonaten und ihr Zusammenhangmit den Ergebnissender Pollenanalyse.Bern.
Eicher, U., 1987. Die spätglazialen sowie frühpostglazialen Klimaverhältnisse imBereich der Alpen: Sauerstoffisotopenkurven kalkhaltiger Sedimente. GeographicaHelvetica 1987, 99–104.
Eicher, U., Siegenthaler, U., 1976. Palynological and oxygen isotope investigation onLate-Glacial sediment cores from Swiss lakes. Boreas 5, 109–117.
Engstrom, D.R., Fritz, S.C., 2006. Coupling between primary terrestrial succession and the tro-phic development of lakes at Glacier Bay, Alaska. Journal of Paleolimnology 35, 873–880.
Engstrom, D.R., Fritz, S.C., Almendinger, J.E., Juggins, S., 2000. Chemical and biologicaltrends during lake evolution in recently deglaciated terrain. Nature 408, 161–166.
Firbas, F., 1949. Spät- und nacheiszeitliche Waldgeschichte Mitteleuropas nördlich derAlpen. Gustav Fischer, Jena.
Friedrich, M., Kromer, B., Kaiser, K.F., Spurk, M., Hughen, K.A.J., Johnsen, S.J., 2001. High-resolution climate signals in the Bølling–Allerød Interstadial (Greenland Intersta-dial 1) as reflected in European tree-ring chronologies compared to marine varvesand ice-core records. Quaternary Science Reviews 20, 1223–1232.
Gaillard, M.-J., 1983. On the occurrence of Betula nana L. pollen grains in the Late-Glacial deposits of Lobsigensee (Swiss Plateau). Studies in the late Quaternary ofLobsigensee 2. Revue de Paléobiologie 2, 181–188.
Gaillard, M.-J., 1984a. Etude palynologique de l'Evolution Tardi- et Postglaciaire de laVégétation du Moyen-Pays Romand (Suisse). Dissertationes Botanicae 77, 1–322.
Gaillard, M.-J., 1984b. Evolution tardiglaciaire de la végétation du Moyen-Pays romand(Suisse): floristique, végétation et chronologie. Revue de Paléobiologie spécial 63–77.
Gaillard, M.-J., Lemdahl, G., 1994. Lateglacial insect assemblages from Grand-Marais,South-Western Switzerland – Climatic implications and comparison with pollen andmacrofossil data. Dissertationes Botanicae, Festschrift Gerhard Lang 234, 287–308.
Gaillard, M.-J., Weber, B., 1978. Contribution à l'étude du tardiglaciaire de la régionlémanique. Le profil de St.Laurent à Lausanne. I. Bulletin De La Societé BotaniqueSuisse 87, 182–189.
Graf, F., Brunner, I., 1997. Natural and synthesized ectomycorrhizas of the alpine dwarfwillow Salix herbacea. Mycorrhiza 6, 227–235.
Grafenstein, U.V., Erlenkeusen, H., Brauer, A., Jouzel, J.S., Johnsen, S.J., 1999. A mid-European decadal isotope-climate record from 15,000 to 5000 years B.P. Science284, 1654–1657.
Hart, M., Klironomos, J.N., 2002. Diversity of arbuscular mycorrhizal fungi and ecosys-tem functioning. In: van der Heijden, M.G.A., Sanders, I.R. (Eds.), Mycorrhizal Ecol-ogy. Springer, Berlin, pp. 225–242.
Hart, M.M., Reader, R.J., Klironomos, J.N., 2003. Plant coexistence mediated byarbuscular mycorrizal fungi. Trends in Ecology & Evolution 18, 418–423.
Heiri, O., Lotter, A.F., Lemcke, G., 2001. Loss on ignition as a method for estimating or-ganic and carbonate content in sediments: reproducibility and comparability of re-sults. Journal of Paleolimnology 25, 101–110.
Hicks, S., 2006. When no pollen does not mean no trees. Vegetation History andArchaeobotany 15, 253–261.
Hoek, W.Z., 1997a. Atlas to Palaeogeography of Lateglacial Vegetations – Maps ofLateglacial and Early Holocene landscape and vegetation in The Netherlands,with an extensive review of available palynological data. Netherlands Geographi-cal Studies 231, PhD Thesis Utrecht, Volume II, 176.
Hoek,W.Z., 1997b. Late-Glacial and early Holocene climatic events and chronology of veg-etation development in the Netherlands. Vegetation History and Archaeobotany 6,197–213.
Hoek, W.Z., 2001. Vegetation response to the ca 14.7 and ca. 11.5 ka cal. BP climate tran-sitions: is vegetation lagging climate? Global and Planetary Change 30, 103–115.
Hu, F.S., Finney, B.P., Brubaker, L.B., 2001. Effects of Holocene Alnus expansion onaquatic productivity, nitrogen cycling, and soil development in southwestern Alas-ka. Ecosystems 4, 358–368.
Hurlbert, S.H., 1971. The nonconcept of species diversity: a critique and alternative pa-rameters. Ecology 59 (52), 577–586.
Iversen, J., 1954. The late-glacial flora of Denmark and its relationship to climate andsoil. Danmarks Geologiske Undersøgelse, Rke, 2(80), pp. 87–119.
Jackson, S.T., Overpeck, J.T., 2000. Responses of plant populations and communities to envi-ronmental changes of the late Quaternary. Paleobiology 26, 194–220 (Supplement).
Jacobson, G.L., Webb, T., Grimm, E.C., 1987. Patterns and rates of vegetation changeduring the deglaciation of eastern North America. In: Ruddiman, W.F., Wright,H.E. (Eds.), North America and adjacent oceans during the last deglaciation: Geo-logical Society of America, pp. 277–288.
Jeffers, E.S., Bonsall, M.B., Brooks, S.J., Willis, K.J., 2011. Abrupt environmental changesdrive shifts in tree–grass interaction outcomes. Journal of Ecology 99, 1063–1070.
Jumpponen, A., 2001. Dark septate endophytes – are they mycrorrhizal? Mycorrhiza11, 207–211.
Jumpponen, A., Trappe, J.M., 1998. Dark septate endophytes: a review of facultativebiotrophic root-colonizing fungi. New Phythologist 140, 295–310.
Kolstrup, E., 1979. Herbs as July temperature indicators for parts of the pleniglacial andlate-glacial in The Netherlands. Geologie en Mijnbouw 58, 377–380.
Kolstrup, E., 1980. Climate and stratigraphy in northwestern Europe between 30,000B.P. and 13,000 B.P., with special reference to The Netherlands. MededelingenRijks Geologische Dienst 32–15, 181–253.
Lang, G., 1952a. Späteiszeitliche Pflanzenreste in Südwestdeutschland. Beiträge zurnaturkundlichen Forschung in Südwestdeutschland 11, 89–110.
Lang, G., 1952b. Zur späteiszeitlichen Vegetations- und Florengeschichte Süd-westdeutschlands. Flora 139, 243–294.
Lang, G., 1994. Quartäre Vegetationsgeschichte Europas – Methoden und Ergebnisse.Gustav Fischer, Jena.
Lang, G., 2005. Seen und Moore des Schwarzwaldes. Andrias 16, 1–160.Latałowa, M., van der Knaap, W.O., 2006. Late Quaternary expansion of Norway spruce
Picea abies (L.) Karst. in Europe according to pollen data. Quaternary ScienceReviews 25, 2780–2805.
Lemdahl, G., 2000. Lateglacial and Early Holocene insect assemblages from sites at dif-ferent altitudes in the Swiss Alps – implications on climate and environment.Palaeogeography, Palaeoclimatology, Palaeoecology 159, 293–312.
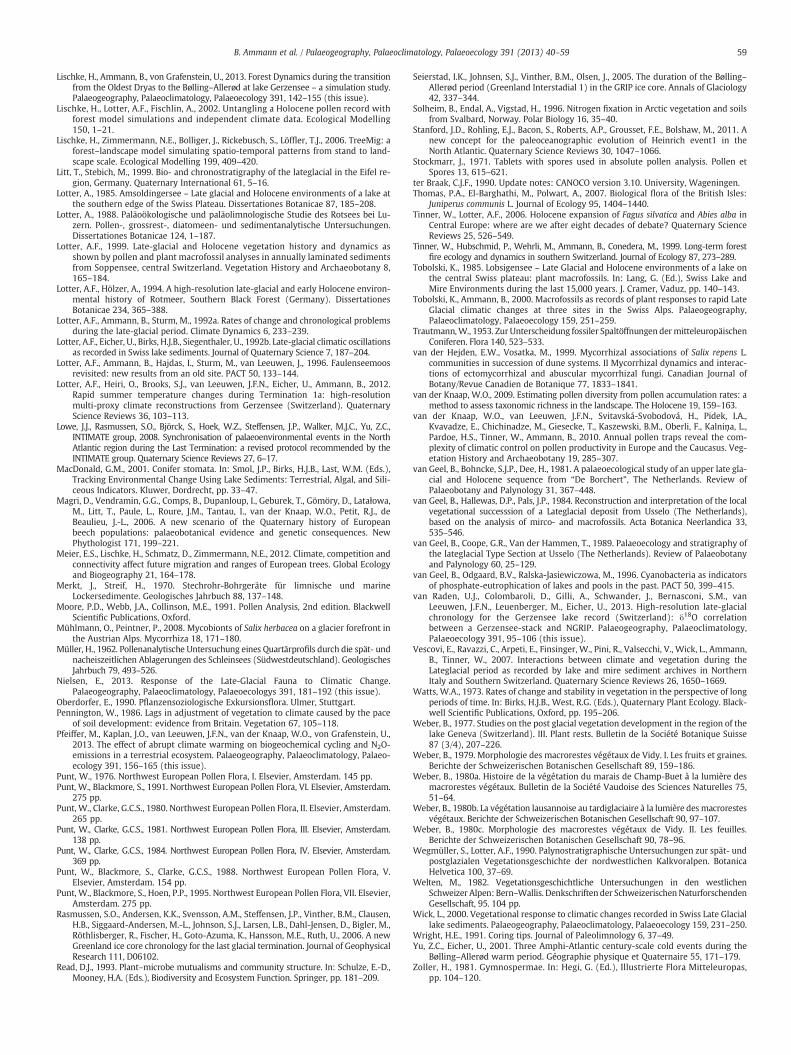
59B. Ammann et al. / Palaeogeography, Palaeoclimatology, Palaeoecology 391 (2013) 40–59
Lischke, H., Ammann, B., von Grafenstein, U., 2013. Forest Dynamics during the transitionfrom the Oldest Dryas to the Bølling–Allerød at lake Gerzensee – a simulation study.Palaeogeography, Palaeoclimatology, Palaeoecology 391, 142–155 (this issue).
Lischke, H., Lotter, A.F., Fischlin, A., 2002. Untangling a Holocene pollen record withforest model simulations and independent climate data. Ecological Modelling150, 1–21.
Lischke, H., Zimmermann, N.E., Bolliger, J., Rickebusch, S., Löffler, T.J., 2006. TreeMig: aforest–landscape model simulating spatio-temporal patterns from stand to land-scape scale. Ecological Modelling 199, 409–420.
Litt, T., Stebich, M., 1999. Bio- and chronostratigraphy of the lateglacial in the Eifel re-gion, Germany. Quaternary International 61, 5–16.
Lotter, A., 1985. Amsoldingersee – Late glacial and Holocene environments of a lake atthe southern edge of the Swiss Plateau. Dissertationes Botanicae 87, 185–208.
Lotter, A., 1988. Paläoökologische und paläolimnologische Studie des Rotsees bei Lu-zern. Pollen-, grossrest-, diatomeen- und sedimentanalytische Untersuchungen.Dissertationes Botanicae 124, 1–187.
Lotter, A.F., 1999. Late-glacial and Holocene vegetation history and dynamics asshown by pollen and plant macrofossil analyses in annually laminated sedimentsfrom Soppensee, central Switzerland. Vegetation History and Archaeobotany 8,165–184.
Lotter, A.F., Hölzer, A., 1994. A high-resolution late-glacial and early Holocene environ-mental history of Rotmeer, Southern Black Forest (Germany). DissertationesBotanicae 234, 365–388.
Lotter, A.F., Ammann, B., Sturm, M., 1992a. Rates of change and chronological problemsduring the late-glacial period. Climate Dynamics 6, 233–239.
Lotter, A.F., Eicher, U., Birks, H.J.B., Siegenthaler, U., 1992b. Late-glacial climatic oscillationsas recorded in Swiss lake sediments. Journal of Quaternary Science 7, 187–204.
Lotter, A.F., Ammann, B., Hajdas, I., Sturm, M., van Leeuwen, J., 1996. Faulenseemoosrevisited: new results from an old site. PACT 50, 133–144.
Lotter, A.F., Heiri, O., Brooks, S.J., van Leeuwen, J.F.N., Eicher, U., Ammann, B., 2012.Rapid summer temperature changes during Termination 1a: high-resolutionmulti-proxy climate reconstructions from Gerzensee (Switzerland). QuaternaryScience Reviews 36, 103–113.
Lowe, J.J., Rasmussen, S.O., Björck, S., Hoek, W.Z., Steffensen, J.P., Walker, M.J.C., Yu, Z.C.,INTIMATE group, 2008. Synchronisation of palaeoenvironmental events in the NorthAtlantic region during the Last Termination: a revised protocol recommended by theINTIMATE group. Quaternary Science Reviews 27, 6–17.
MacDonald, G.M., 2001. Conifer stomata. In: Smol, J.P., Birks, H.J.B., Last, W.M. (Eds.),Tracking Environmental Change Using Lake Sediments: Terrestrial, Algal, and Sili-ceous Indicators. Kluwer, Dordrecht, pp. 33–47.
Magri, D., Vendramin, G.G., Comps, B., Dupanloup, I., Geburek, T., Gömöry, D., Latałowa,M., Litt, T., Paule, L., Roure, J.M., Tantau, I., van der Knaap, W.O., Petit, R.J., deBeaulieu, J.-L., 2006. A new scenario of the Quaternary history of Europeanbeech populations: palaeobotanical evidence and genetic consequences. NewPhythologist 171, 199–221.
Meier, E.S., Lischke, H., Schmatz, D., Zimmermann, N.E., 2012. Climate, competition andconnectivity affect future migration and ranges of European trees. Global Ecologyand Biogeography 21, 164–178.
Merkt, J., Streif, H., 1970. Stechrohr-Bohrgeräte für limnische und marineLockersedimente. Geologisches Jahrbuch 88, 137–148.
Moore, P.D., Webb, J.A., Collinson, M.E., 1991. Pollen Analysis, 2nd edition. BlackwellScientific Publications, Oxford.
Mühlmann, O., Peintner, P., 2008. Mycobionts of Salix herbacea on a glacier forefront inthe Austrian Alps. Mycorrhiza 18, 171–180.
Müller, H., 1962. Pollenanalytische Untersuchung eines Quartärprofils durch die spät- undnacheiszeitlichen Ablagerungen des Schleinsees (Südwestdeutschland). GeologischesJahrbuch 79, 493–526.
Nielsen, E., 2013. Response of the Late-Glacial Fauna to Climatic Change.Palaeogeography, Palaeoclimatology, Palaeoecologys 391, 181–192 (this issue).
Oberdorfer, E., 1990. Pflanzensoziologische Exkursionsflora. Ulmer, Stuttgart.Pennington, W., 1986. Lags in adjustment of vegetation to climate caused by the pace
of soil development: evidence from Britain. Vegetation 67, 105–118.Pfeiffer, M., Kaplan, J.O., van Leeuwen, J.F.N., van der Knaap, W.O., von Grafenstein, U.,
2013. The effect of abrupt climate warming on biogeochemical cycling and N2O-emissions in a terrestrial ecosystem. Palaeogeography, Palaeoclimatology, Palaeo-ecology 391, 156–165 (this issue).
Punt, W., 1976. Northwest European Pollen Flora, I. Elsevier, Amsterdam. 145 pp.Punt, W., Blackmore, S., 1991. Northwest European Pollen Flora, VI. Elsevier, Amsterdam.
275 pp.Punt, W., Clarke, G.C.S., 1980. Northwest European Pollen Flora, II. Elsevier, Amsterdam.
265 pp.Punt, W., Clarke, G.C.S., 1981. Northwest European Pollen Flora, III. Elsevier, Amsterdam.
138 pp.Punt, W., Clarke, G.C.S., 1984. Northwest European Pollen Flora, IV. Elsevier, Amsterdam.
369 pp.Punt, W., Blackmore, S., Clarke, G.C.S., 1988. Northwest European Pollen Flora, V.
Elsevier, Amsterdam. 154 pp.Punt, W., Blackmore, S., Hoen, P.P., 1995. Northwest European Pollen Flora, VII. Elsevier,
Amsterdam. 275 pp.Rasmussen, S.O., Andersen, K.K., Svensson, A.M., Steffensen, J.P., Vinther, B.M., Clausen,
H.B., Siggaard-Andersen, M.-L., Johnson, S.J., Larsen, L.B., Dahl-Jensen, D., Bigler, M.,Röthlisberger, R., Fischer, H., Goto-Azuma, K., Hansson, M.E., Ruth, U., 2006. A newGreenland ice core chronology for the last glacial termination. Journal of GeophysicalResearch 111, D06102.
Read, D.J., 1993. Plant–microbe mutualisms and community structure. In: Schulze, E.-D.,Mooney, H.A. (Eds.), Biodiversity and Ecosystem Function. Springer, pp. 181–209.
Seierstad, I.K., Johnsen, S.J., Vinther, B.M., Olsen, J., 2005. The duration of the Bølling–Allerød period (Greenland Interstadial 1) in the GRIP ice core. Annals of Glaciology42, 337–344.
Solheim, B., Endal, A., Vigstad, H., 1996. Nitrogen fixation in Arctic vegetation and soilsfrom Svalbard, Norway. Polar Biology 16, 35–40.
Stanford, J.D., Rohling, E.J., Bacon, S., Roberts, A.P., Grousset, F.E., Bolshaw, M., 2011. Anew concept for the paleoceanographic evolution of Heinrich event1 in theNorth Atlantic. Quaternary Science Reviews 30, 1047–1066.
Stockmarr, J., 1971. Tablets with spores used in absolute pollen analysis. Pollen etSpores 13, 615–621.
ter Braak, C.J.F., 1990. Update notes: CANOCO version 3.10. University, Wageningen.Thomas, P.A., El-Barghathi, M., Polwart, A., 2007. Biological flora of the British Isles:
Juniperus communis L. Journal of Ecology 95, 1404–1440.Tinner, W., Lotter, A.F., 2006. Holocene expansion of Fagus silvatica and Abies alba in
Central Europe: where are we after eight decades of debate? Quaternary ScienceReviews 25, 526–549.
Tinner, W., Hubschmid, P., Wehrli, M., Ammann, B., Conedera, M., 1999. Long-term forestfire ecology and dynamics in southern Switzerland. Journal of Ecology 87, 273–289.
Tobolski, K., 1985. Lobsigensee – Late Glacial and Holocene environments of a lake onthe central Swiss plateau: plant macrofossils. In: Lang, G. (Ed.), Swiss Lake andMire Environments during the last 15,000 years. J. Cramer, Vaduz, pp. 140–143.
Tobolski, K., Ammann, B., 2000. Macrofossils as records of plant responses to rapid LateGlacial climatic changes at three sites in the Swiss Alps. Palaeogeography,Palaeoclimatology, Palaeoecology 159, 251–259.
Trautmann,W., 1953. Zur Unterscheidung fossiler Spaltöffnungen dermitteleuropäischenConiferen. Flora 140, 523–533.
van der Hejden, E.W., Vosatka, M., 1999. Mycorrhizal associations of Salix repens L.communities in succession of dune systems. II Mycorrhizal dynamics and interac-tions of ectomycorrhizal and abuscular mycorrhizal fungi. Canadian Journal ofBotany/Revue Canadien de Botanique 77, 1833–1841.
van der Knaap, W.O., 2009. Estimating pollen diversity from pollen accumulation rates: amethod to assess taxonomic richness in the landscape. The Holocene 19, 159–163.
van der Knaap, W.O., van Leeuwen, J.F.N., Svitavská-Svobodová, H., Pidek, I.A.,Kvavadze, E., Chichinadze, M., Giesecke, T., Kaszewski, B.M., Oberli, F., Kalniņa, L.,Pardoe, H.S., Tinner, W., Ammann, B., 2010. Annual pollen traps reveal the com-plexity of climatic control on pollen productivity in Europe and the Caucasus. Veg-etation History and Archaeobotany 19, 285–307.
van Geel, B., Bohncke, S.J.P., Dee, H., 1981. A palaeoecological study of an upper late gla-cial and Holocene sequence from “De Borchert”, The Netherlands. Review ofPalaeobotany and Palynology 31, 367–448.
van Geel, B., Hallewas, D.P., Pals, J.P., 1984. Reconstruction and interpretation of the localvegetational successsion of a Lateglacial deposit from Usselo (The Netherlands),based on the analysis of mirco- and macrofossils. Acta Botanica Neerlandica 33,535–546.
van Geel, B., Coope, G.R., Van der Hammen, T., 1989. Palaeoecology and stratigraphy ofthe lateglacial Type Section at Usselo (The Netherlands). Review of Palaeobotanyand Palynology 60, 25–129.
van Geel, B., Odgaard, B.V., Ralska-Jasiewiczowa, M., 1996. Cyanobacteria as indicatorsof phosphate-eutrophication of lakes and pools in the past. PACT 50, 399–415.
van Raden, U.J., Colombaroli, D., Gilli, A., Schwander, J., Bernasconi, S.M., vanLeeuwen, J.F.N., Leuenberger, M., Eicher, U., 2013. High-resolution late-glacialchronology for the Gerzensee lake record (Switzerland): δ18O correlationbetween a Gerzensee-stack and NGRIP. Palaeogeography, Palaeoclimatology,Palaeoecology 391, 95–106 (this issue).
Vescovi, E., Ravazzi, C., Arpeti, E., Finsinger, W., Pini, R., Valsecchi, V., Wick, L., Ammann,B., Tinner, W., 2007. Interactions between climate and vegetation during theLateglacial period as recorded by lake and mire sediment archives in NorthernItaly and Southern Switzerland. Quaternary Science Reviews 26, 1650–1669.
Watts, W.A., 1973. Rates of change and stability in vegetation in the perspective of longperiods of time. In: Birks, H.J.B., West, R.G. (Eds.), Quaternary Plant Ecology. Black-well Scientific Publications, Oxford, pp. 195–206.
Weber, B., 1977. Studies on the post glacial vegetation development in the region of thelake Geneva (Switzerland). III. Plant rests. Bulletin de la Société Botanique Suisse87 (3/4), 207–226.
Weber, B., 1979. Morphologie des macrorestes végétaux de Vidy. I. Les fruits et graines.Berichte der Schweizerischen Botanischen Gesellschaft 89, 159–186.
Weber, B., 1980a. Histoire de la végétation du marais de Champ-Buet à la lumière desmacrorestes végétaux. Bulletin de la Société Vaudoise des Sciences Naturelles 75,51–64.
Weber, B., 1980b. La végétation lausannoise au tardiglaciaire à la lumière des macrorestesvégétaux. Berichte der Schweizerischen Botanischen Gesellschaft 90, 97–107.
Weber, B., 1980c. Morphologie des macrorestes végétaux de Vidy. II. Les feuilles.Berichte der Schweizerischen Botanischen Gesellschaft 90, 78–96.
Wegmüller, S., Lotter, A.F., 1990. Palynostratigraphische Untersuchungen zur spät- undpostglazialen Vegetationsgeschichte der nordwestlichen Kalkvoralpen. BotanicaHelvetica 100, 37–69.
Welten, M., 1982. Vegetationsgeschichtliche Untersuchungen in den westlichenSchweizer Alpen: Bern–Wallis. Denkschriften der SchweizerischenNaturforschendenGesellschaft, 95. 104 pp.
Wick, L., 2000. Vegetational response to climatic changes recorded in Swiss Late Glaciallake sediments. Palaeogeography, Palaeoclimatology, Palaeoecology 159, 231–250.
Wright, H.E., 1991. Coring tips. Journal of Paleolimnology 6, 37–49.Yu, Z.C., Eicher, U., 2001. Three Amphi-Atlantic century-scale cold events during the
Bølling–Allerød warm period. Géographie physique et Quaternaire 55, 171–179.Zoller, H., 1981. Gymnospermae. In: Hegi, G. (Ed.), Illustrierte Flora Mitteleuropas,
pp. 104–120.