Embed Size (px)
Citation preview
Universidade de Lisboa
Faculdade de Ciências
Departamento de Geologia
Vegetation response to Holocene climate
variability in south-western Europe
Dulce da Silva Oliveira
Mestrado em Ciências do Mar
2012

Universidade de Lisboa
Faculdade de Ciências
Departamento de Geologia
Vegetation response to Holocene climate
variability in south-western Europe
Dissertação orientada pelo Professor Doutor Ricardo Machado Trigo e
co-orientada pela Doutora Ana Filipa Naughton Henriquez Andrez
Dulce da Silva Oliveira
Mestrado em Ciências do Mar
2012


To my great grandfather Joaquim
Somewhere, something incredible is waiting to be known.
Carl Sagan

i
ACKNOWLEDGMENTS
The work described in this thesis could not have been done without the contribution of
many people and entities. It is a pleasure to convey my sincere gratitude to all the
persons who contributed to this thesis:
Tudo começou com um sonho.. e depois de percorrida uma longa viagem de
pensamentos e ideias previsíveis e/ou imprevisíveis chego a esta fase final de “Missão
cumprida”. Contudo, porque como qualquer viagem só se faz bem em boa companhia,
no fim do percurso há que olhar para trás e agradecer a todos aqueles que, à sua
maneira, me acompanharam e me auxiliaram:
Agradeço, em primeiro lugar, à minha orientadora neste estudo e na bolsa de investigação,
Filipa Naughton, a quem reconheço uma grande competência científica e enormes
qualidades humanas. Obrigado por me teres dado a oportunidade de seguir um dos sonhos
da minha vida, a investigação cientifica.. por teres apostado na minha formação em
Palinologia e por me teres contagiado com a tua paixão pela Paleoclimatologia. Obrigado
pela inesgotável paciência, conselhos, tolerância, generosidade, elevado grau de exigência e
eterno sorriso, que inspirou e elucidou os momentos mais desafiantes no percurso deste
trabalho. Obrigada por acreditares que eu seria capaz! Um Abraço e Muito Obrigada!
Também desejo agradecer em particular, ao Professor Doutor Ricardo Trigo, do Centro
de Geofísica da Universidade de Lisboa que aceitou ser meu orientador interno. Obrigado
por todo o apoio, disponibilidade, orientação e ensinamentos proporcionados desde o
primeiro e-mail trocado. Agradeço também pela diligência com que leu e comentou este
trabalho nas suas várias fases, e pelas críticas construtivas com que sempre me confrontou.
Ao CIIMAR (Centro Interdisciplinar de Investigação Marinha e Ambiental) pela concessão
da bolsa de investigação e ao projeto CLIMHOL "Variabilidade climática Holocénica
registada no Atlântico Norte e continente adjacente: correlação directa oceano-continente"
(referência PTDC/AAC- CLI/100157/2008), financiado por fundos nacionais através da
FCT/MCTES (PIDDAC) e co-financiado pelo Fundo Europeu de Desenvolvimento
Regional – FEDER- através do COMPETE – Programa Operacional Factores de
Competitividade – POFC, pelo suporte institucional e financeiro que me foi dispensado.
À Faculdade de Ciências da Universidade de Lisboa, que constituiu um contexto
institucional e relacional de desenvolvimento, e de apoio e desafio a aprendizagens
diversas. Um especial obrigado aos docentes do mestrado de Ciências do Mar.
À Professora Doutora Filomena Diniz por me ter acolhido no Museu Nacional de História
Natural e por me ter transmitindo todos os ensinamentos necessários para iniciar as análises
palinológicas. À Arlete, pela atenção e simpatia com que sempre me recebeu.
ii
A Maria Fernanda Sánchez Goñi et Stephanie Desprat pour m'avoir accueillie à
Université Bordeaux 1, pour m'avoir permis de observer la collection de référence sporo-
pollinique d’Europe et pour tous les enseignements de la paléoclimatologie.
A Jean-Marie Jouanneau et Olivier Web pour m’avoir donne la possibilité de travailler
sur cette carotte e pour partager les résultats obtenus.
Thanks to Julio Rodriguez and Ana Pascual for their share of the results of the studied
sequence, specially the 14C ages.
A Marie-Helene Castera, pour les preparations des lames palynologiques.
À Dra. Teresa Rodrigues pela partilha de conhecimentos e dados fornecidos, bem como
pela enorme disponibilidade para responder aos meus pedidos e pela sua simpatia sempre
presente.
À Dra. Cristina Lopes, pela disponibilidade que mostrou não só para me responder as
minhas dúvidas sobre estatística mas também pelas análises estatísticas efetuadas.
À Dra. Emília Salgueiro, pelo seu incentivo em momentos diversos, especialmente no
EGU e pelas futuras análises de Mg/Ca.
A special thanks to Dr. Antje Voelker, who always had the door open to teach, help and
advice in any occasion.
Ao João Noiva pela elaboração dos mapas e por toda a ajuda, gentileza, paciência e
disponibilidade.
Ao Warley, pelo seu apoio nas análises laboratoriais e boa disposição.
Um especial obrigado com carinho e apreço a todo o pessoal de paleoceanografia da
Unidade de Geologia Marinha do LNEG, pelo acolhimento e amizade que sempre
demonstraram, pelo bom ambiente e pelos artigos enviados!!
Ao pessoal da sala das lupas, nomeadamente Andreia, Catarina, Ana, Cristina, “Sandras”,
e Célia pelo constante apoio, incentivo, carinho e Amizade. Obrigada por me fazerem
“viajar” nos longos dias passados ao microscópio!!! A vossa presença contribuiu, sem
dúvida, para que esta viagem decorresse com boa disposição e no caminho certo.
À minha “equipa técnica”, Andreia, Sandra D., Cristina e Susana, que muito me ajudaram,
incentivaram e aconselharam ao longo deste meu percurso.. Muito obrigado pela revisão da
bibliografia, formatações, correções do Inglês/Português… e afins!! Sem a vossa ajuda não
teria sido possível cumprir o “meu plano de ação”. Muito muito obrigado, sobretudo pela
Amizade.
iii
Não diretamente envolvidos no meu trabalho científico, mas naturalmente
imprescindíveis no apoio e meu bem-estar, essenciais para conseguir realizar as
tarefas propostas, cumprir prazos estabelecidos e terminar o meu Mestrado,
tenho de agradecer sinceramente:
À Andreia, amiga de sempre e para sempre. Obrigada pela ininterrupta e incansável ajuda, a
qualquer hora do dia e noite, quer chova ou faça sol. Por me sacudires nos momentos de maior
estagnação, sem nunca teres deixado de acreditar nas minhas capacidades. Sem ti, este trabalho
não teria sido sequer começado! Obrigada por tudo e mais um “cadito”!!
À Celina, irmã construída desde infância e que me faz acreditar que as ligações e afinidades são
efetivamente transversais ao tempo e à distância. Obrigada por estares sempre comigo.
À Sandra D., na qualidade de amiga e “Palinóloga”, obrigado por tantos e inesquecíveis
diálogos e por todo o apoio a todos os níveis. “Abençoado” seja o teu pragmatismo, capacidade
de resolução de problemas e otimismo contagiante.
Aos meus colegas da FCUL, especialmente Sandra M. e Ricardo, obrigado por todos os bons
momentos e amizade. Sandra a tua força e generosidade serão sempre um exemplo para mim.
Obrigado Ricardo por estares sempre na primeira “fila”.
Por fim, um sincero obrigado a todos os meus amigos, especialmente à Marlene, Lúcia, Mónica
e todo o pessoal do Carreira, que nunca deixaram de me incentivar e apoiar e que suportaram ao
longo deste período numerosas ausências ou presenças de humor no mínimo duvidosas.
A todos os outros, não declarados aqui, mas que sabem que constituíram pilares importantes e
decisivos em muitos momentos.
Por fim, mas não menos importantes, aqueles que estão sempre em primeiro plano, a
minha família:
Na família tenho a feliz companhia dos meus queridos pais e irmã, pilares da minha vida, que
sempre apoiaram sem restrições e de forma incondicional o meu trabalho, sentindo também que
nele se projetava algo mais que um simples trabalho. Obrigado pelo suporte emocional e pela
segurança que me proporcionaram ao longo de toda a minha vida. Obrigado por tudo!
- tenho também a companhia da minha avó, tios e primas, que como segundos pais e irmãs são
uma presença continua e profunda na minha vida.
- obrigado ainda aos meus sogros por estarem sempre prontos a ajudar.
- Ao meu marido Marco, companheiro inigualável, tão diferente de mim e tão dedicado em ser
tudo para mim, expresso o meu maior reconhecimento, que não cabe em tão poucas palavras.
Obrigado por seres a âncora de toda a minha vida, pela força, energia e amor que me transmites
em todos os momentos da nossa vida. Obrigado pela inestimável ajuda nas pequenas grandes
tarefas do dia-a-dia, sem a qual não teria sido possível a execução desta tese. Obrigado por
acreditares em mim.
A todos vós o meu sincero e profundo OBRIGADO!

iv
v
SUMMARY
Understanding past climate variability, especially abrupt climate events, is
essential for predicting future climate, as they may provide crucial information about
the climate system’s sensitivity to perturbations. Accordingly, this research is focused
on documenting the vegetation response to the natural evolution of the current
interglacial period, the Holocene, and on evaluating the anthropogenic contribution to it.
Also, we intend to identify the nature, timing and causes of Holocene climate variability
at orbital and suborbital time scales in a key region of the North Atlantic region.
The present study reveals the vegetation and climate changes in southwestern
France and northern Spain for the last ca. 9000 cal. yr BP in a well dated shelf core,
KS05-10, retrieved in the southwestern margin of the Bay of Biscay (Basque country).
The continuous high resolution pollen record shows orbital and suborbital climate
fluctuations contemporaneous with those noticed for the North Atlantic region,
Greenland and Europe. The gradual decline of pine and oak trees and the general
increase of herbaceous plants, reflecting a gradual cooling between 9000 and 1000 yr
cal. BP, follows the cooling in Greenland as well as the decrease of mid-latitude
summer insolation. The gradual replacement of the oak forest by beech also reveal the
reduction of seasonality, probably triggered by the gradual increase of the precession,
and the increase of moisture conditions in mid- to late Holocene.
Superimposed on the orbitally induced long-term cooling, KS05 10 pollen record
detects an abrupt millennial scale climatic event between 8.3 and 8.1 ka in the
southwestern Bay of Biscay, which is related to the well-known 8.2 ka event. The
vegetation changes (reduction of temperate and humid trees, particularly Corylus,
increase of ubiquist plants, principally Cyperaceae, and the presence of Carpinus) point
to a cold and wet episode. The relatively cold conditions were probably the result of the
weakening of the Meridional Overturnig Circulation triggered by the final catastrophic
drainage of the Laurentide Lakes and consequent input of freshwater in the North
Atlantic region. However this mechanism can not explain the wet conditions detected in
the KS05 10 pollen record. These wet conditions could probably be the result of the
influence of the Atlantic Westerly Jet stream and prevalence of strong zonal flow and
frequent low pressure systems (associated with less blocking events located in the
vi
northern Iberian Peninsula and southwestern France). The blockage of sunlight by
clouds, which is associated to high precipitation, may be responsible for the particular
decline of Corylus (light-demanding tree) during this climatic downturn event.
Small-amplitude millennial-scale cooling events after the 8.2 ka event and until
the late Holocene may be reflected in the oscillations of the hazel trees. Spectral
analysis of Corylus percentages shows a climatic cyclicity of ~500yr from 9 to 3 ka,
comparable with those recognized in the North Atlantic region and Greenland ice cores,
suggesting common climate forcing mechanisms such as changes in solar activity and
perturbation of the North Atlantic circulation. The impact of human activity on
vegetation over the last 1000 years is superimposed on the climatic natural changes.
vii
RESUMO
O aquecimento global é na atualidade inequívoco, sendo evidentes o aumento das
temperaturas médias do ar e do oceano à escala global, o degelo de neve e gelo e o
aumento dos eventos meteorológicos extremos tais como: secas, cheias, ondas de calor,
vagas de frio e furacões. Dada a gravidade das consequências que as alterações
climáticas acarretam, o estudo destas temáticas constitui uma prioridade na agenda de
diversas nações a nível socio-económico e científico. É vital, portanto, compreender o
sistema climático ampliando o conhecimento sobre os mecanismos forçadores de clima
e respetivas consequências nas condições climáticas no Atlântico Norte. Neste contexto,
o estudo das variações climáticas registradas no presente período interglacial, o
Holocénico, representa especial relevância.
Estudos sobre os interglaciários e em particular sobre o Holocénico (últimos
11500 anos) são um dos principais temas de investigação atuais. Nos últimos anos
foram efetuados estudos em variadíssimos registos naturais (ex. lagos, sedimentos
marinhos) de modo a compreender a natureza, duração e causas das oscilações
climáticas que ocorreram durante o Holocénico. Todavia, muitas das reconstituições
climáticas existentes até à data, não se baseiam na correlação direta entre o oceano, o
continente e o gelo, tornando difícil obter com precisão o conhecimento das interacções
entre os sistemas atmosfera-oceano-continente e do seu real impato na variabilidade
climática global. Acresce ainda, à impossibilidade de se estabelecer uma correlação
direta, o fato de nenhum destes registos isolados ser adequado para identificar a
variabilidade temporal e espacial necessária à comparação das variações climáticas
regionais com modelos climáticos. Consequentemente, o tipo de mecanismos
responsáveis pela variabilidade climática Holocénica está longe de ser reconhecido.
Os principais objetivos deste trabalho são a) determinar e caraterizar a evolução
do clima e da vegetação no Holocénico no sudoeste da margem continental
Francesa/Norte de Espanha ; e b) detetar e compreender a frequência, duração e
amplitude da variabilidade climática no Holocénico, assim como inferir sobre os
principais mecanismos forçadores. Para tal, foi efetuado um estudo polínico de alta
resolução temporal numa sondagem colhida num ponto geograficamente estratégico
Atlântico Norte: norte da Península Ibérica/sudoeste da margem continental Francesa.
viii
Este estudo mostra que a vegetação na região de estudo ao longo do Holocénico
respondeu à variabilidade climática orbital e sub-orbital, e em particular ao evento
abrupto designado por 8.2 ka.
A diminuição gradual da floresta temperada, em particular do Pinus e do Quercus
decíduo, acompanhada de um aumento sucessivo de plantas herbáceas, sugere um
arrefecimento progressivo compatível com a diminuição da insolação de verão das
médias latitudes do Hemisfério Norte e a diminuição gradual do δ18
O nos registos de
gelo na Gronelândia. Durante o Holocénico médio e superior, a substituição do Quercus
decíduo e Pinus pelo Fagus, sugere, além do arrefecimento progressivo, um aumento
das condições de umidade e uma diminuição da sazonalidade. A redução da
sazonalidade é contemporânea com o aumento geral da precessão.
Superimposta a esta variabilidade climática orbital, verificou-se um episódio
caracterizado pela diminuição da floresta temperada, especialmente de Corylus,
juntamente com um aumento significativo das herbáceas, sobretudo Cyperaceae e a
presença de Carpinus. Estes indicadores atestam a presença do evento frio e húmido
designado por “evento 8.2 ka” no norte da Península Ibérica/sudoeste da margem
continental Francesa. Todas as evidências apontam para os episódios terminais de
expulsão dos lagos de “Agassiz” e de “Ojibway” e a consequente redução gradual da
“MOC” (meridional overturning circulation), como as principais causas para o súbito
arrefecimento durante o evento 8.2 ka. A diminuição da intensidade da circulação
termohalina terá impedido o transporte de calor para as altas latitudes provocando a
diminuição da temperatura registada no Atlântico Norte e na Europa. Este trabalho
propõe que o mecanismo atmosférico que explica as condições húmidas durante este
evento nas latitudes médias da Europa envolve alterações na atividade ciclónica e na
posição da Corrente de Jato no Atlântico, e a prevalência de situações de forte
circulação zonal com frequentes sistemas depressionários tipicos de uma ausencia de
eventos de bloqueio na zona de estudo. Além disso, o aumento na quantidade de nuvens
durante este evento abrupto pode ter induzido à particular diminuição de Corylus
(árvore dependente de bastante luz para o seu desenvolvimento) através do bloqueio da
luz solar e consequente diminuição da sua disponibilidade.
A variabilidade climática sub-orbital não é muito evidente após o evento 8.2 ka no
nosso registo polínico. No entanto, as percentagens de todos os taxa foram submetidas a
uma análise espetral (Wavelet), de forma a determinar a evolução temporal das
ix
amplitudes e periodicidades prevalentes das variações climáticas holocénicas na região
da Atlântico Norte em estudo. Foi obtida uma ciclicidade de ~500 anos para o Corylus.
Esta ciclicidade é semelhante à detectada em registos na Gronelândia e no Atlântico
Norte, o que sugere que esta espécie, em particular, terá respondido aos mesmos
mecanismos climáticos forçadores (variações na atividade solar e/ou perturbações da
circulação termohalina). Contudo, o nosso registo não possui resolução temporal
suficiente para explorar esta possibilidade, sendo necessário para isso efetuar estudos
adicionais.
No último milénio, tornou-se evidente que o impato antropogénico através da
presença contínua de espécies indicadoras de atividade antropogénica, como Castanea
sativa, Juglans e cereais. O impacto humano aparenta ter sido sobreposto à
variabilidade climática natural milenar durante este milénio.
Este estudo contribuiu para a reconstrução das condições paleoclimáticas e a
resultante resposta da vegetação ao longo do Holocénico no Norte da Península
Ibérica/Sul de França; bem como para a compreensão dos mecanismos forçadores
responsáveis por esta variabilidade climática orbital e sub-orbital. Os resultados desta
pesquisa serão integrados nos dados existentes de alta resolução de várias regiões
geográficas “chave” do Atlântico Norte incluídas no projeto CLIMHOL " Variabilidade
climática Holocénica registada no Atlântico Norte e continente adjacente: correlação
directa oceano-continente" (referência PTDC/AAC- CLI/100157/2008), financiado por
fundos nacionais através da FCT/MCTES (PIDDAC) e co-financiado pelo Fundo
Europeu de Desenvolvimento Regional – FEDER- através do COMPETE – Programa
Operacional Factores de Competitividade – POFC.
É importante realçar que a avaliação do tempo e a natureza de resposta da
vegetação a eventos abruptos como o 8.2 ka é de particular importância pois os modelos
climáticos preveem uma redução na intensidade da “MOC” devido ao aquecimento
global.
Em termos de investigação no futuro, pretende-se continuar a aprofundar o
conhecimento dos mecanismos envolvidos nas alterações climáticas. Deste modo, é
essencial detectar e compreender a frequência, duração e amplitude e os mecanismos
responsáveis pela variabilidade climática natural em períodos interglaciares com
condições análogas ao Holocénico, mas que não são influenciadas pelas atividades
humanas.

x
xi
INDEX
ACKNOWLEDGMENTS ................................................................................................. i
SUMMARY ........................................................................................................................ v
RESUMO ............................................................................................................................ vii
CHAPTER 1
GENERAL INTRODUCTION
1. MAIN OBJECTIVES AND MOTIVATION .............................................................. 1
2. CLIMATE VARIABILITY DURING THE LATE QUATERNARY ...................... 4
2.1 Long term climate variability .............................................................................. 4
2.2 Millennial-scale climate variability ...................................................................... 8
2.3 The Holocene .......................................................................................................... 10
2.3.1 Holocene long term climatic changes ........................................................... 11
2.3.2 Holocene millennial to sub-millennial scale climate variability ................. 14
2.3.2.1. Particular cases of well known Holocene short-lived climatic events . 18
3. MATERIAL AND ENVIRONMENTAL SETTING ................................................. 24
3.1 Sediment core ......................................................................................................... 24
3.2 Environmental Setting .......................................................................................... 26
3.2.1 Ocean and Atmospheric Circulation ............................................................. 26
3.2.1 Present-day vegetation .................................................................................... 32
4. POLLEN AS A PROXY FOR PALEOCLIMATIC RECONSTRUCTION ........... 34
4.1 Basic principles of pollen analysis ........................................................................ 34
4.2 Pollen grain features .............................................................................................. 35
4.3 Marine Palynology ................................................................................................. 38
5. METHODOLOGY ....................................................................................................... 40
5.1 Chronology ............................................................................................................. 40
5.2 Pollen analysis procedures ................................................................................... 41
5.2.1 Pollen concentration technique ...................................................................... 41
5.2.2 Pollen identification and counting ................................................................. 42
5.2.3 Pollen percentage and concentration ............................................................ 43
5.2.4 Pollen diagrams ............................................................................................... 43
6. REFERENCES .............................................................................................................. 46
xii
CHAPTER 2
HOLOCENE CLIMATE VARIABILITY IN THE MID-LATITUDES
OF THE EASTERN NORTH ATLANTIC REGION
ABSTRACT ....................................................................................................................... 68
1. INTRODUCTION ......................................................................................................... 69
2. ENVIRONMENTAL SETTING .................................................................................. 71
2.1 Morphology and recent sedimentation ................................................................ 71
2.2 Present-day pollen deposition ............................................................................... 74
2.3 Present-day climate and vegetation ....................................................................... 74
3. MATERIAL AND METHODS ................................................................................... 76
3.1 KS05 10 sediment sequence .................................................................................. 76
3.2 Chronology .............................................................................................................. 76
3.3 Pollen analysis ......................................................................................................... 78
3.4 Spectral analysis ...................................................................................................... 80
4. RESULTS AND DISCUSSION .................................................................................... 80
4.1 Vegetation history and climatic variations inferred from KS05 10 pollen
record ............................................................................................................................ 80
4.2 Primary causes of Holocene climate variability in the northern Iberian
Peninsula/southwestern France .................................................................................. 89
4.2.1 Holocene long term climatic changes ......................................................... 89
4.2.2 Sub-orbital climate variability .................................................................... 91
The 8.2 ka event ............................................................................................ 91
Discrete millennial scale climatic events after the 8.2 ka event ................. 97
5. CONCLUDING REMARKS AND FUTURE RESEARCH ...................................... 99
ACKNOWLEDGEMENTS .............................................................................................. 101
REFERENCES .................................................................................................................. 102
xiii
APPENDIX 1
Images of the pollen grains presented in the KS05 10 synthetic pollen diagram
LIST OF FIGURES
Chapter 1
Fig. 1. Schematic representation of the Earth’s orbital cycles (adapted from Zachos et
al., 2001). (A) Changes in the eccentricity of the Earth’s orbit, with periods of 400 and
100 ka. (B) Variations in the obliquity, or tilt of the Earth’s axis, with amplitude of 2.4o
every 41ka. (C) Precession, that corresponds to changes in the direction of the Earth’s
axis relative to the fixed stars, with periods of 23 and 19 ka.
Fig. 2. Orbitally induced 100 ka and 41 ka climatic oscillations. In the top of the figure,
Summer solstice insolation at 65 ºN (Laskar et al., 2004). The Benthic foraminiferal
δ18
O stack of the last 3.5 Ma (Lisiecki and Raymo, 2005) shows a general cooling trend
and an increase of global ice volume over the past 3 Ma (from Naafs, 2011). iNHG
refers to the intensification of the NH glaciations and MPT refers to the middle
Pleistocene transition.
Fig. 3. Each orbital parameter is shown over the last 1000 ka along with the insolation
and stages of glaciation. The Milankovitch cycles have influenced climate change in
100 ka periods and determined the frequency of Quaternary glaciations (Berger, 1978).
Fig. 4. North Greenland Ice Core Project (NGRIP) ice core δ18
O record for the last 123
ka. The abrupt cooling reflecting the Younger Dryas corresponds to the Greenland
stadial 1. The rapid warmings that characterize the D/O interstadial events are numbered
from 1 to 25. Heinrich events are labeled from H1 to H6. Some stadials coincide with
Heinrich events (from NGRIP members, 2004).
Fig. 5. Variations in orbital forcing during the Holocene (from 12 ka BP to 3 ka in the
future) in June (a) and December (b) as a function of latitude (from Beer and Geel,
2008). In June there is a strong decreasing trend in the north (a). In December, the
insolation on the southern Hemisphere first increases and then reaches its maximum
between 2 and 4 cal. ka BP before decreasing again (b).
Fig. 6. Timing and intensity of maximum temperature deviation from pre-industrial
levels, as a function of latitude and time (from IPCC, 2007). It is suggested a possible
south to north pattern, with southern latitudes showing HTM a few millennia earlier
than the NH regions (IPCC, 2007).
Fig. 7. Globally distributed glacier fluctuation records and climate forcing time series
(cosmogenic isotopes reflecting solar variability, orbital insolation changes, volcanic
xiv
aerosols, and greenhouse gases). Green bands represent timing of rapid climate change
(RCC) identified by Mayewski et al. (2004) by tuned to GISP2 (Greenland Ice Sheet
Project 2) record. For more details see Mayewski et al. (2004).
Fig. 8. Main external forcings driving Holocene climate changes (from Wanner et al.,
2011). Holocene long-term trend: (a) Solar insolation due to orbital changes for two
specific latitudes in the Northern and Southern Hemispheres during the corresponding
summer and d) Forcing due to rising CO2 concentrations. Holocene millennial scale
climate changes: (b) Volcanic forcing during the past 6 ka depicted by the sulphate
concentrations of two ice cores from Greenland (blue vertical bars) and Antarctica (red
vertical bars); (c) Solar activity fluctuations reconstructed based on 10
Be measurements
in polar ice. The six vertical blue bars indicate the timing, but not the length of the six
cold periods during the last 10 ka in the NH.
Fig. 9. Oxygen isotope ratios from GRIP (Greenland Ice Core Project) (red), GISP2
(black), NGRIP (blue), and Dye 3 (green) all plotted on the GRIP depth scale and the
GICC05 age scale (from Thomas et al., 2007).
Fig.10. Configuration of the Northeast Canada and adjacent seas (from Barber et al.,
1999). Former ice-sheet margins are shown for 8.9 ka and 8.2 ka prior to present time
(vertical hatched line and thick grey line respectively), before and after disintegration of
ice in Central Hudson Bay, respectively. Simultaneously, northward drainage is shown
through the Hudson Bay and Hudson Strait (dark grey arrows). Horizontal hatching
shows Lake Agassiz and Ojibway. Labrador Sea current patterns and the area of
Labrador Sea Intermediate Water (LSW) formation is indicated by arrows with dashed
lines show. Numbers in boxes are regional mean DR values (years). Sites discussed in
Barber et al. (1999) are numbered from 1 to 4.
Fig.11. Extra-tropical NH (90–30°N) temperature anomaly reconstruction of the last
2000 years (from Ljungqvist, 2010).
Fig. 12. Map showing the location of the studied core. The bathymetry is derived from
the Digital Bathymetry as produced in the EMODNet Hydrography
(http://www.emodnet-hydrography.eu). The elevation data is derived from SRTM
(Shuttle Radar Topography Mission) 90m Digital Elevation Database v4.1 (Farr et al.,
2007). The drainage system is derived from the Europe and North Asia (EURNASIA)
Vmap Level Zero (VMAP0 - Digital Chart of the World)
(http://webgis.wr.usgs.gov/globalgis/metadata_qr/metadata/perennial_rivers.htm).
Fig. 13. Photos of KS05 10 core.
Fig. 14. Schematic representation of the Meridional overturning circulation (from
Rahmstorf, 2007). Global circulation system in the world ocean that shows the
northward transport of warm and salty surface waters in the NA and the return flow to
the south of cold and dense NADW in the abyssal ocean.
Fig. 15. Composition of ENACW circulation in the Bay of Biscay and the nearest part
of the Atlantic at the level of ENACW (adapeted from González-Pola et al., 2005).
xv
Fig. 16. Based on the method described by Barnston and Livezey (1987) it is possible to
compute the spatial patterns associated to the teleconnection indices NAO, EA, and
SCAND for DJF and for the period 1960-2000 (from Trigo et al., 2008).
Fig. 17. The two phases of the North Atlantic Oscillation. a) Positive phase, stronger
than average westerlies and to mild and wet winters over N-Europe and dry conditions
in the Mediterranean; b) Negative phase, leading to the opposite conditions such as
weaker than average westerlies, cold, dry winters in N-Europe and rainy winters in S-
Europe (from http://www.ldeo.columbia.edu/NAO by Martin Visbeck).
Fig. 18. Spatial correlation between the patterns EA/WRUS and SCAND patterns and
winter (NDJF) Mediterranean station precipitation for the period 1950-1999.
Correlations |r|≥0.14 indicate significance at the 95% level, |r|≥0.18 at the 99% level and
|r|≥0.23 at the 99.9% level (n = 4x50 = 200 months), respectively (adapted from Trigo et
al., 2006).
Fig. 19. Iberian Peninsula Bioclimatic (a) and Biogeographic map (b) (from Worldwide
Bioclimatic Classification System, 1996-2009). The Iberian Peninsula show marked
differences between the two bioclimatic zones. The north and the northwest of the
Peninsula are characterized by a Temperate bioclimate, with colder temperatures and
higher precipitation than that of the Mediterranean bioclimatic. The small patches of
Temperate bioclimate enclosed in the Mediterranean type correspond to large Mountain
ranges in the centre and north of Iberia.
Fig.20. Details of angiosperm pollen wall structure as defined by Faegri (1956)
(adapted from Heusser, 2005).
Fig. 21. Groups of pollen according to the number, type and position of apertures (from
Moore et al., 1991). Examples are shown in equatorial view (view of a pollen grain
where the equatorial plane is directed towards the observer) and polar view (the polar
axis is directed towards the observer).
Fig. 22. Wall structure and ornamentation of angiosperm pollen (from Heusser, 2005).
Chapter 2
Fig. 1. Location of the study area and site (KS05 10; 43°22’765N, 2°16’744W).
Sources: The bathymetry is derived from the Digital Bathymetry as produced in the
EMODNet Hydrography (http://www.emodnet-hydrography.eu). The elevation data is
derived from SRTM (Shuttle Radar Topography Mission) 90m Digital Elevation
Database v4.1 (Farr et al., 2007). The drainage system is derived from the Europe and
North Asia (EURNASIA) Vmap Level Zero (VMAP0 - Digital Chart of the World)
(http://webgis.wr.usgs.gov/globalgis/metadata_qr/metadata/perennial_rivers.htm).
Fig. 2. Sources and solid fluxes to the Spanish Basque country shelf (adapted from
Jouanneau et al., 2008a).
xvi
Fig. 3. Depth-age model of KS05 10 record.
Fig. 4. Synthetic percentages pollen diagram against calibrated ages (cal. yr BP) of
KS05 10 record, with a curve at × 10 beyond the principal curve. Dots indicate
percentages of less 0.5%.
Fig. 5. KS05 10 pollen record with Corylus, Cyperaceae, ubiquist plant group,
temperate and humid trees and Carpinus pollen percentage curves from 6500 to 9000
cal. yr BP.
Fig. 6. Correlation between vegetation changes, June insolation curve at 39ºN and
precessional signal (after Berger, 1978), δ18
O-isotope composition of the NorthGRIP
ice-core (Johnsen et al., 2001; NGRIP Members, 2004; Rasmussen et al., 2006) and Sea
surface temperature (SST) of Tagus mud patch (Rodrigues et al., 2009) during the last
ca. 9000 cal. yr BP. Herbaceous plants association include: Ericaceae, Calluna, Ulex-
type, Anthemis-type, Aster-type, Centaurea cyanus-type, Centaurea nigra-type,
Taraxacum, Apiaceae, Brassicaceae, Caryophyllaceae, Liliaceae, Asphodelus,
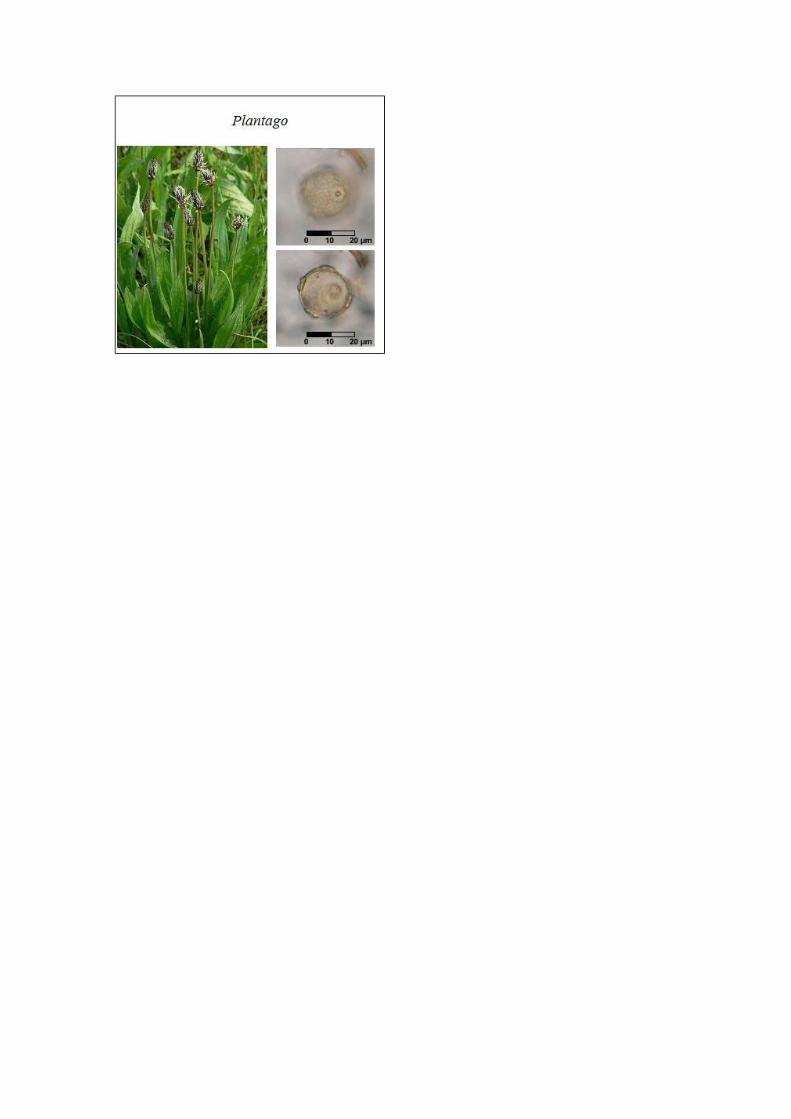
Mercurialis-type, Plantago, Plumbaginaceae, Poaceae, Ranunculaceae, Rumex,
Saxifragaceae, Scabiosa, Boraginaceae, Campanulaceae, Cerealia-type, Cyperaceae,
Euphorbia, Fabaceae, Filipendula, Galium-type, Gentianaceae, Geranium, Pedicularis,
Polygonum aviculare-type, Rosaceae, Thalictrum, Helianthemum, Urtica,
Valerianaceae, Armeria-type, Eleagnaceae, Polygonaceae and Potentilla-type.
Fig. 7. Correlation between KS05 10 vegetation changes, δ18
O-isotope composition of
the NorthGRIP ice-core (Johnsen et al., 2001; NGRIP Members, 2004; Rasmussen et
al., 2006), negative SST anomalies in the Tagus mud patch (Rodrigues et al., 2009),
mean grain size (paleocurrent flow speed proxy, higher mean indicates stronger flow of
the depositing current and vice versa; Ellison et al., 2006), the catastrophic final
drainage episodes from the proglacial Laurentide lakes into the Hudson Bay at ca. 8470
cal. yr BP (error range of 8160–8740 cal. yr BP; Barber et al., 1999) and episodes of
higher lake level in west-central Europe (Magny, 2007), during the 8.2 ka cooling event.
Fig. 8. Comparison of hydrological signals related to the 8.2 ka cold event in Europe
(from Magny et al., 2003). Shaded area represents the mid-European zone with wetter
conditions. Lake-level maxima is marked with (+) and minima with (-) during the 8.2 ka
event. The extension of sea-ice cover during the 8.2 cal. yr BP (Renssen et al., 2001).
Dashed lines correspond to possible northern and southern limits of the mid-European
wetter zone during the Holocene cooling phases weaker than the 8.2 ka event. X marks
the location of KS05 10 sequence. For reference sites included in the Fig. during the 8.2
ka event see Magny et al. (2003).
xvii
Fig. 9. The mean 500 hPa geopotential height (gpm) anomalies for all winter a)
blocking, and, b) non-blocking (strong zonal flow) episodes, with a minimum duration
of 10 days (from Trigo et al., 2004b). The shading shows the corresponding 850 hPa
temperature field (ºC); c) Differences between the mean 500 hPa geopotential height
(gpm) composites and the corresponding 850 hPa (ºC) temperature composites
(represented only if significant at the 1% level).
Fig. 10. Number of cyclones per winter, detected per 5º x 5º area normalised for 50ºN,
for a) blocking, b) non-blocking, and c) their difference (from Trigo et al., 2004b).
Fig. 11. Anomalies of the precipitation rate (mm/day) for winter composites of a)
blocking episodes, b) non-blocking episodes, and c) their difference (represented only if
significant at the 5% level). The arrows show the respective anomaly of the 2.5 m wind
field (ms–1) (adapted from Trigo et al., 2004b).
Fig. 12. Wavelet analysis of the hazel percentages for the last ca.9000 yr. Wavelet
power spectra illustrate the change in concentration of spectral power with time in
Corylus values. Black line defines power spectrum significant at 90% red noise
spectrum. Dashed lines define the cone of influence where the spectrum has no
significance at all. Analysis undertaken using interactive software available at
http://paos.colorado.edu/research/wavelets/.
LIST OF TABLES
Chapter 1
Table 1. The Holocene three main periods (adapted from Nesje and Dahl, 1993;
Marchal et al., 2002; Wanner et al., 2008; 2011).
Table 2. Main features of the cored site.
Chapter 2
Table 1. Results of AMS dating of core KS05 10. Level in italic corresponds to the age
not considered for the age model.
Table 2. Historical botanic event.
Table 3. Description of pollen zones from the well-dated KS05 10 sedimentary
sequence.


Chapter I


Main Objectives and Motivation
1
1. MAIN OBJECTIVES AND MOTIVATION
Climate is changing significantly since the last few decades, affecting people and
the environment worldwide. In particular, increasing air and ocean temperatures,
widespread melting of snow and ice, and rising sea levels result in a shift in the Earth’s
climate system equilibrium. Natural events and human activities are believed to be
contributing to this climatic trend. Differentiating natural from anthropogenic forcing of
climate change is one of the most important challenges of future climate prediction.
There is therefore an urgent need to improve our documentation and understanding of
natural variability for periods stretching back beyond the instrumental record. From this
perspective, it is of extreme importance to know more about natural climate variations
that occurred during the current interglacial, the Holocene, because its boundary
conditions are similar to those experienced now and in the near future.
Growing evidence suggests that variations in Holocene climate were larger than
previously believed. In the last few years, numerous studies have been performed on
several naturally occurring archives such as lake and marine sediments, tree rings,
speleothems and ice cores to understand the nature, timing and causes of Holocene
natural climate oscillations. Such studies have shown that superimposed on the
orbitally-induced long-term cooling sub-orbital millennial-scale climate variability has
affected this interglacial.
The most extreme short-lived cold episode noticed in the Greenland Ice cores, the
“8.2-kyr-BP event”, lasted 100-200 years and has been detected elsewhere in the North
Atlantic and in Europe. Several hypotheses have been invoked to explain this cooling
such as: a) significant alterations of solar activity or b) changes in general circulation
pattern of the North Atlantic region. The first hypothesis suggest a reduction of the solar
activity as the result of increasing sunspots while the second hypothesis suggest that this
cooling was triggered by the final catastrophic drainage of the Lakes Agassiz and
Ojibway which contributed to the introduction of large amounts of freshwater into the
North Atlantic Ocean, disturbed the thermohaline circulation and cooled both Europe
and North America. In recent years, few studies have shown that this event was longer
and more complex than previously believed. Yet, the spatial distribution, timing,
amplitude and their impact in the ecosystems remains one of the outstanding mysteries
of climate variability. Also, the 8.2 ka event is seen as the best analogue for the “worst
case” scenario for the future. Thus, the global warming is accelerating the melting of the
Greenland ice sheet which is contributing to a drastic increase of the global sea level,
Main Objectives and Motivation
2
threatening low-lying areas around the globe with beach erosion, coastal flooding, and
contamination of freshwater supplies. As this ice melts, voluminous amounts of cold,
fresh water dump into the world's oceans disrupting the general trend of the global
oceanic circulation leading to an extreme cooling over Europe and North America.
Understanding the changes in the frequencies and intensities of extreme climate events
and weather, as well as in sea level rise, is therefore a necessity for reducing adverse
impacts on natural and human systems.
In contrast, the signature of millennial-scale climate changes during the mid- and
late Holocene (after the “8.2 ka event”) is not easily detected in paleoclimatic records.
However, this variability was strong enough to affect human societies, particularly
during the last millennium, as historically documented for the Little Ice Age (LIA) and
the Medieval Warm Period (MWP). The global impact, amplitude, periodicities and
causes triggering these short-lived climatic oscillations have been widely discussed in
the last decade.
There is therefore an urgent need to understand the nature, timing and causes of
climate oscillations and to determine how widespread, systematic and abrupt they may
have been.
Most of the available Holocene climatic reconstructions are however, not based
on good correlation between terrestrial, marine and ice records making it difficult to get
an accurate understanding of the interactions of the atmosphere-ocean-land systems and
their impact on global climate variability. For this reason, the mechanisms that control
Holocene climate variations in the North Atlantic and adjacent landmasses are far from
being resolved. We propose, therefore, to establish for the first time, high-resolution
sea-land correlation on a shelf core from southwestern France (highlighted by the IPCC
models as one of the most sensitive region to the ongoing global climatic changes)
covering the Holocene.
This master thesis aims to improve the understanding of the nature, timing and
causes of Holocene natural climate oscillations and to determine how abrupt they may
have been. Furthermore, this thesis aims to document how changes in the behaviour of
coupled atmosphere-ocean-land systems have affected climate in the North Atlantic
region during the Holocene. In particular we pretend:
a) to document the response of vegetation to Holocene climate changes in terms of
long and millennial scale and in particular:
Main Objectives and Motivation
3
- to determine the impact of long term cooling in the vegetation cover of both
northern Iberian Peninsula and southwestern France;
- to determine the impact of the 8.2 ka event in both northern Iberian Peninsula and
southwestern French margin;
- to determine the trigger mechanisms involved in the climatic signal left by the 8.2
ka in southwestern French margin/northern Spain;
- to determine the impact of less extreme events in the northern Iberian Peninsula
and southwestern France and to determine, if possible, the cyclicities within the sub-
orbital climatic oscillations in terrestrial environments and to determine the trigger
mechanisms involved in those changes;
b) to compare the obtained marine pollen data with other marine paleoclimatic and
ice records to further understand the nature, amplitude and timing of millennial-scale
climate variability in northern Iberian Peninsula and southwestern France;
c) to understand if the sub-orbital millennial-scale climate oscillations had
contributed to an amplification or reduction of the long-term climatic signal;
To achieve theses aims, I have organised the work with the following sequence of steps:
1. Obtain high-resolution data and high-quality chronology
High time-resolution analyses enabled by both high sedimentation rate marine cores and
well chronologically constrained records (using several AMS 14
C dating) are a
prerequisite to investigate the rapid climatic variability of the Holocene.
2. Document the Holocene southern European vegetation changes
Pollen, representing an integrated image of the regional vegetation of the borderlands,
will be analysed.
3. Integrate terrestrial and marine data results
An accurate correlation of marine and terrestrial settings is of prime importance for time
equivalent documentation of environmental changes and to evaluate the synchronicity
of occurring climatic shifts and events in both environments.
4. Implement cyclicity analysis of the marine and terrestrial records
This task will allow us to determine the main trigger mechanisms involved in the
Holocene millennial scale climatic variability.
5. Evaluate the natural and anthropogenic contributions to the Holocene climatic
changes.
Climate variability during the Late Quaternary
4
2. CLIMATE VARIABILITY DURING THE LATE QUATERNARY
During the late Quaternary (roughly the last million years) global climate has
changed dramatically due to a number of linked physical, chemical and biological
processes occurring in the atmosphere, land and ocean.
Changes in Earth’s orbit (Milankovitch cycles) as well as oscillations in solar
activity determine the temporal and spatial distribution of insolation, being considered
the ultimate forcing of the long-term climate oscillations of the Quaternary.
Additionally, Earth’s internal mechanisms that result from the interaction between
atmosphere-ocean-lithosphere-cryosphere-land systems have a huge contribute to the
climatic changes. The variability of these global phenomena may trigger, amplify,
sustain or globalize rapid climatic fluctuations (Peixoto and Oort, 1992).
2.1 Long term climate variability (Glacial-Interglacial cycles)
Over the last million years, the earth’s climate system has experienced several
long term climatic shifts between glacial and interglacial conditions which were mainly
controlled by solar irradiance variations linked to changes in the Earth’s orbit around
the sun (Milankovitch, 1920; Berger, 1978; Imbrie et al., 1992; Berger and Loutre,
2004; Ruddiman, 2006). Changes in the amount of incoming solar radiation, as well as
their temporal and spatial distribution are determined by three types of orbital
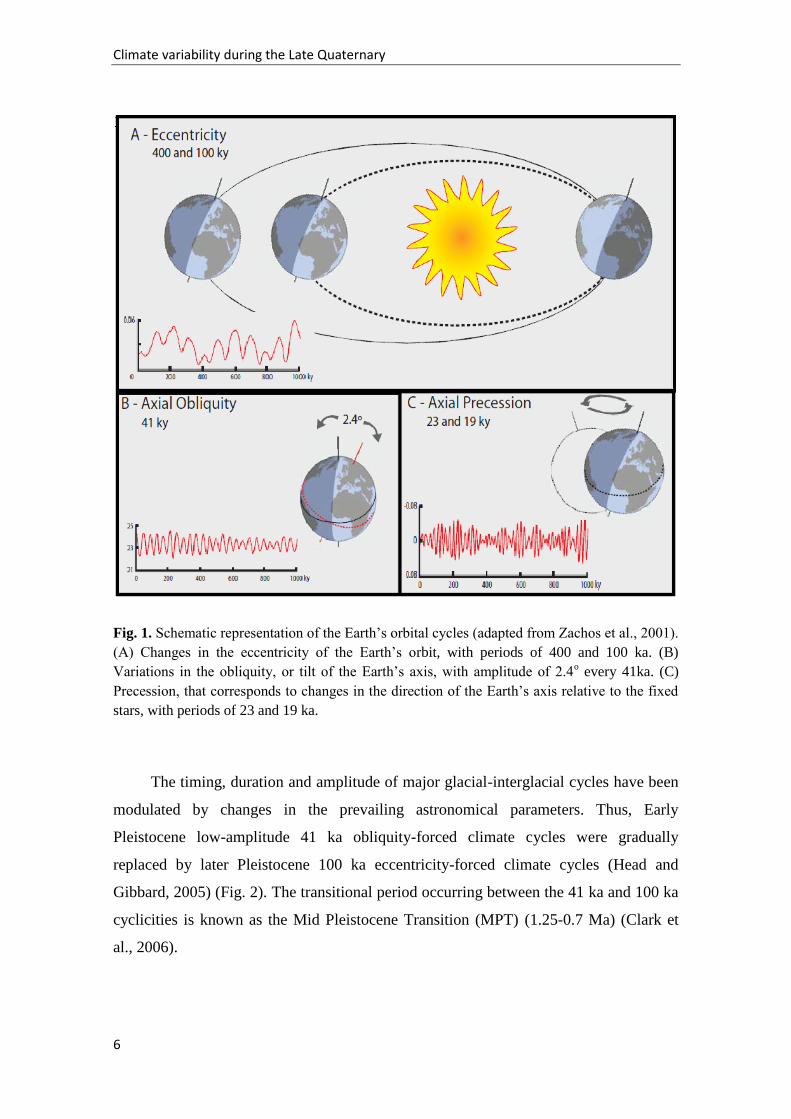
parameters (Milankovitch, 1920) (Fig. 1):
(1) Eccentricity, reflects the shape of Earth's orbit around the Sun, ranging from a
quasi-circular (low eccentricity of 0.0006) to a slightly elliptical shape (high eccentricity
of 0.0535) and with two periodicities of about 100 and 400 thousands of years (kilo
years, hereafter referred to as ka) (Berger and Loutre, 1992; Berger and Loutre, 2004).
Differences in solar radiation received on earth of about 30% may occur between
perihelion (in early January, when the Earth is closest to the sun) and aphelion (in early
July, when the Earth is further from the sun) during eccentricity maxima (Goodess et
al., 1992). In contrast, during episodes of low eccentricity (0.016) as the present-day,
the difference in insolation between perihelion and aphelion is around 6.4 % over the
year (Berger, 2001).
Climate variability during the Late Quaternary
5
(2) Obliquity of Earth’s axis in relation to the orbital plan, tilting from 22° and
25° over a period of about 41 ka (Berger and Loutre, 2004), determine the differences in
seasonal contrast on earth (Buchdahl, 1999). Increased obliquity implicates a higher
seasonal contrast in both hemispheres at high latitudes, since summers receive more
solar radiation and winters less (i.e. warmer summers/colder winters). Inversely,
decreased obliquity origin temperate summers and milder winters, which is the most
likely mechanism promoting the onset of glacial conditions favoring the ice cap growth
in the high latitudes. Fluctuations in obliquity have less influence at low latitudes, as the
strength of the effect decline towards the equator (Buchdahl, 1999).
(3) precession (change in the orientation of the Earth's rotational axis) is
modulated by eccentricity, which splits the precession into two periods of about 23 ka
and 19 ka, leading to an average period of 21 ka (Berger, 2001; Berger and Loutre,
2004). This cycle has two components: an axial precession, caused by the gravitational
forces exerted on Earth of all other planetary body's in our solar system, and an
elliptical precession, in which the elliptical orbit of the Earth itself rotates about one
focus (Buchdahl, 1999). Changes in axial precession modify the times of perihelion and
aphelion, and consequently increase the seasonal contrast in one hemisphere and
decrease in the other hemisphere. The hemisphere at perihelion experiences an increase
in summer solar radiation and a cooler winter, while the opposite hemisphere will have
a warmer winter and a cooler summer. Presently, the Earth is at perihelion in the
northern hemisphere (hereafter referred to as NH) winter, which makes the winters and
summers less severe in this region (Ruddiman, 2001).
Orbital forcing is the only forcing that is fully understood, and can be calculated
not only for the past but also for the future several million years (Berger and Loutre,
2004). Isolated or combined together, the orbital parameters shape the distribution of
solar radiation in Earth’s surface. Whereas eccentricity is the only Milankovitch cycle
that modify the annual-mean global solar insolation at aphelion and perihelion; the
seasonal and latitudinal variation of the incoming radiation is balanced by precession
and obliquity respectively.
Climate variability during the Late Quaternary
6
Fig. 1. Schematic representation of the Earth’s orbital cycles (adapted from Zachos et al., 2001).
(A) Changes in the eccentricity of the Earth’s orbit, with periods of 400 and 100 ka. (B)
Variations in the obliquity, or tilt of the Earth’s axis, with amplitude of 2.4o every 41ka. (C)
Precession, that corresponds to changes in the direction of the Earth’s axis relative to the fixed
stars, with periods of 23 and 19 ka.
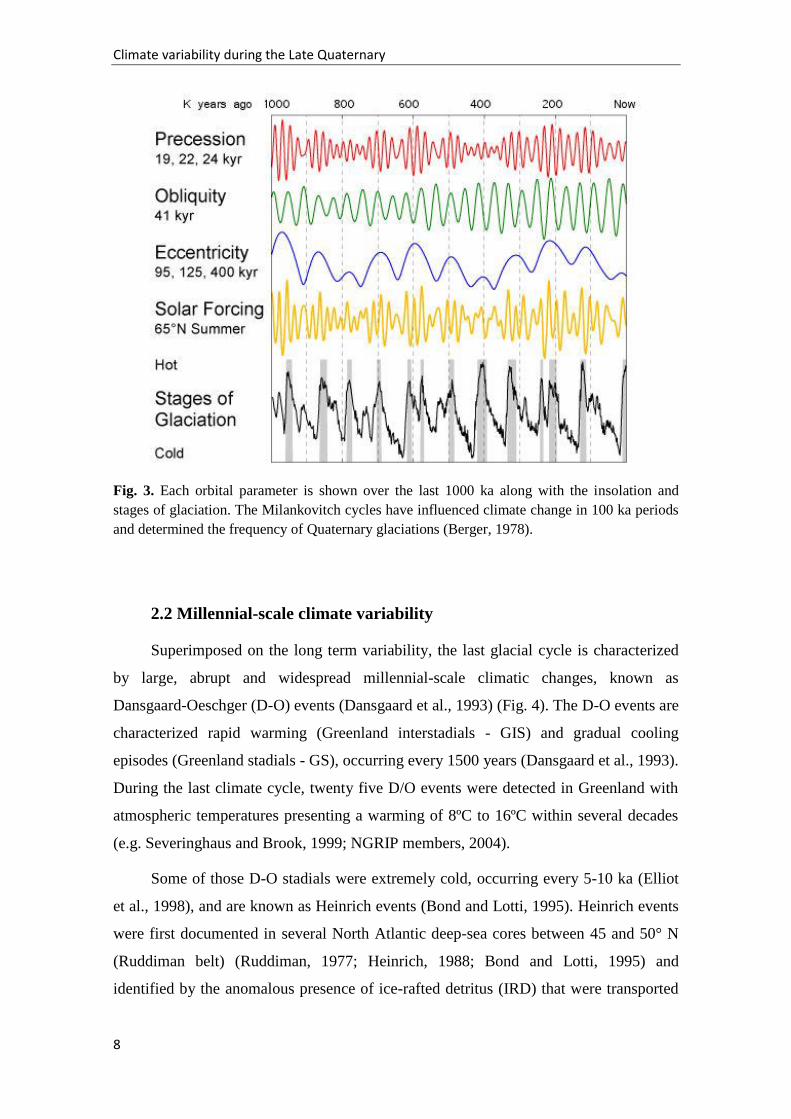
The timing, duration and amplitude of major glacial-interglacial cycles have been
modulated by changes in the prevailing astronomical parameters. Thus, Early
Pleistocene low-amplitude 41 ka obliquity-forced climate cycles were gradually
replaced by later Pleistocene 100 ka eccentricity-forced climate cycles (Head and
Gibbard, 2005) (Fig. 2). The transitional period occurring between the 41 ka and 100 ka
cyclicities is known as the Mid Pleistocene Transition (MPT) (1.25-0.7 Ma) (Clark et
al., 2006).
Climate variability during the Late Quaternary
7
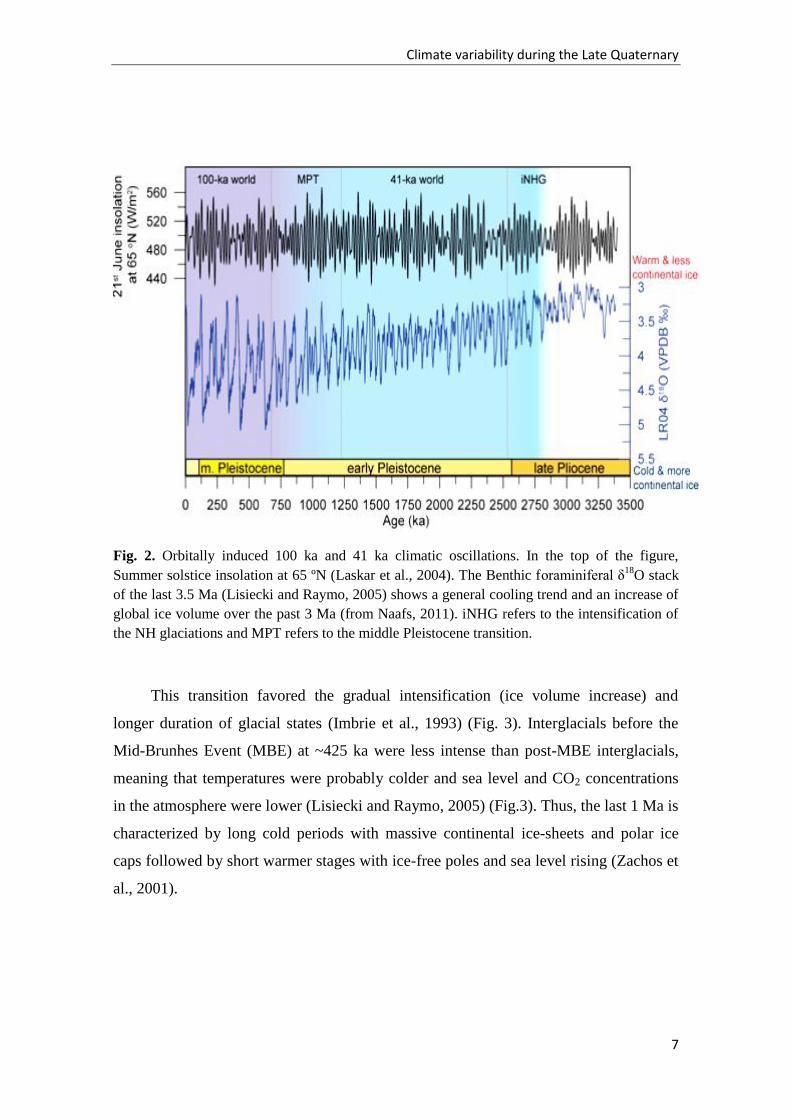
Fig. 2. Orbitally induced 100 ka and 41 ka climatic oscillations. In the top of the figure,
Summer solstice insolation at 65 ºN (Laskar et al., 2004). The Benthic foraminiferal δ18
O stack
of the last 3.5 Ma (Lisiecki and Raymo, 2005) shows a general cooling trend and an increase of
global ice volume over the past 3 Ma (from Naafs, 2011). iNHG refers to the intensification of
the NH glaciations and MPT refers to the middle Pleistocene transition.
This transition favored the gradual intensification (ice volume increase) and
longer duration of glacial states (Imbrie et al., 1993) (Fig. 3). Interglacials before the
Mid-Brunhes Event (MBE) at ~425 ka were less intense than post-MBE interglacials,
meaning that temperatures were probably colder and sea level and CO2 concentrations
in the atmosphere were lower (Lisiecki and Raymo, 2005) (Fig.3). Thus, the last 1 Ma is
characterized by long cold periods with massive continental ice-sheets and polar ice
caps followed by short warmer stages with ice-free poles and sea level rising (Zachos et
al., 2001).
Climate variability during the Late Quaternary
8
Fig. 3. Each orbital parameter is shown over the last 1000 ka along with the insolation and
stages of glaciation. The Milankovitch cycles have influenced climate change in 100 ka periods
and determined the frequency of Quaternary glaciations (Berger, 1978).
2.2 Millennial-scale climate variability
Superimposed on the long term variability, the last glacial cycle is characterized
by large, abrupt and widespread millennial-scale climatic changes, known as
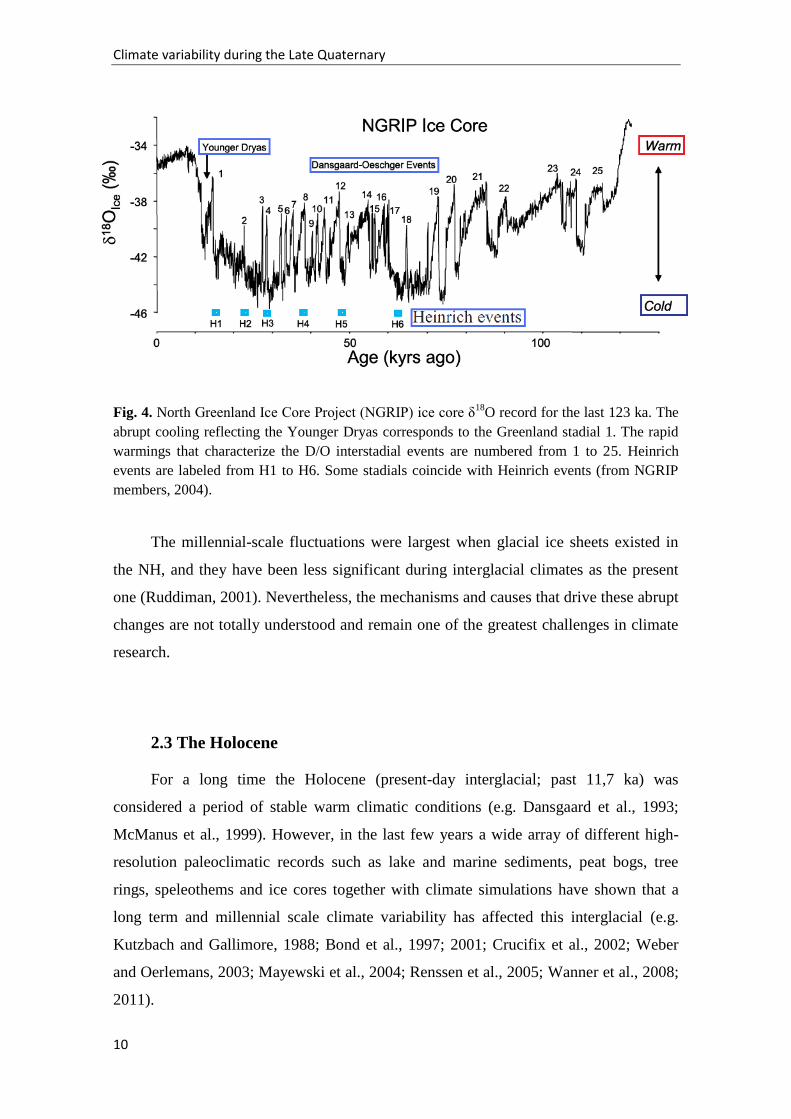
Dansgaard-Oeschger (D-O) events (Dansgaard et al., 1993) (Fig. 4). The D-O events are
characterized rapid warming (Greenland interstadials - GIS) and gradual cooling
episodes (Greenland stadials - GS), occurring every 1500 years (Dansgaard et al., 1993).
During the last climate cycle, twenty five D/O events were detected in Greenland with
atmospheric temperatures presenting a warming of 8ºC to 16ºC within several decades
(e.g. Severinghaus and Brook, 1999; NGRIP members, 2004).
Some of those D-O stadials were extremely cold, occurring every 5-10 ka (Elliot
et al., 1998), and are known as Heinrich events (Bond and Lotti, 1995). Heinrich events
were first documented in several North Atlantic deep-sea cores between 45 and 50° N
(Ruddiman belt) (Ruddiman, 1977; Heinrich, 1988; Bond and Lotti, 1995) and
identified by the anomalous presence of ice-rafted detritus (IRD) that were transported
Climate variability during the Late Quaternary
9
to the ocean by drifting icebergs from the Laurentide and northern European ice sheets
as well as by synchronous peaks of polar foraminifera, N. pachyderma (s) (e.g. Bond
and Lotti, 1995; Hemming, 2004), sea surface temperature decreases (Bond and Lotti,
1995; Cortijo et al., 1997) and magnetic susceptibility peaks (Grousset et al., 1993).
These coarse fraction intervals, representing the well known IRD layers, were also
detected beyond the Ruddiman belt i.e. north of 50°N (e.g. Elliot et al., 1998; Fronval et
al., 1995; Rasmussen et al., 1996; Van Kreveld et al., 2000; Voelker et al., 1998) as well
as below 40°N (e.g. Baas et al., 1997; Bard et al., 2000; Chapman et al., 2000; de Abreu
et al., 2003; Lebreiro et al., 1996; Zahn et al., 1997; Naughton et al., 2009). The
thickness of the IRD layers and the magnetic signal is, however, smaller in the mid-
latitude sites than in the northern ones (Thouveny et al., 2000). Also, the duration of the
impact of these extreme events on the sea surface temperatures (SST) in this region is
longer than that of the IRD layers (e.g. Bard et al., 2000; Chapman et al., 2000; Sánchez
Goñi et al., 2000; Naughton et al., 2009). Moreover, the vegetation patterns within these
extreme cold events are also complex in southwestern Europe (Naughton et al., 2009).
Internal mechanisms have been invoked to explain Heinrich climatic anomalies.
Thus, the introduction of anomalous freshwater pulses into the North Atlantic have
affected the general pattern of the global thermohaline circulation (THC), by forcing the
THC to slowdown (almost shutdown) (e.g. Ganopolski and Rahmstorf, 2001; Knutti et
al., 2004), triggering a substantial SST drop in the North Atlantic region and extreme
cooling in Europe (e.g. Paillard and Labeyrie, 1994; Seidov and Maslin, 1999). The
slowdown/shutdown of the THC also precludes the moisture transfer to Europe.
Following this, rapid oceanic and atmospheric reorganizations favoured the transfer of
cold conditions everywhere on earth suggesting that although Heinrich events were
mainly North Atlantic (hereafter referred to as NA) phenomena they had a global
impact (Leuschner and Siroko, 2000; Voelker et al., 2002). Several other hypotheses
have been invoked to explain the response of the ocean-land-ice to Heinrich events (e.g.
Flückiger et al., 2006; Sánchez Goñi et al., 2002; Naughton et al., 2009). However,
despite the recent paleodata acquisition and modelling efforts, understanding of the
mechanisms that give rise to theses instabilities is far from being completely understood
(Hemming, 2004).
Climate variability during the Late Quaternary
10
Fig. 4. North Greenland Ice Core Project (NGRIP) ice core δ18
O record for the last 123 ka. The
abrupt cooling reflecting the Younger Dryas corresponds to the Greenland stadial 1. The rapid
warmings that characterize the D/O interstadial events are numbered from 1 to 25. Heinrich
events are labeled from H1 to H6. Some stadials coincide with Heinrich events (from NGRIP
members, 2004).
The millennial-scale fluctuations were largest when glacial ice sheets existed in
the NH, and they have been less significant during interglacial climates as the present
one (Ruddiman, 2001). Nevertheless, the mechanisms and causes that drive these abrupt
changes are not totally understood and remain one of the greatest challenges in climate
research.
2.3 The Holocene
For a long time the Holocene (present-day interglacial; past 11,7 ka) was
considered a period of stable warm climatic conditions (e.g. Dansgaard et al., 1993;
McManus et al., 1999). However, in the last few years a wide array of different high-
resolution paleoclimatic records such as lake and marine sediments, peat bogs, tree
rings, speleothems and ice cores together with climate simulations have shown that a
long term and millennial scale climate variability has affected this interglacial (e.g.
Kutzbach and Gallimore, 1988; Bond et al., 1997; 2001; Crucifix et al., 2002; Weber
and Oerlemans, 2003; Mayewski et al., 2004; Renssen et al., 2005; Wanner et al., 2008;
2011).
Climate variability during the Late Quaternary
11
2.3.1 Holocene long term climatic changes
The decrease in the northern high-latitudes summer insolation along the Holocene
induced a long-term cooling trend in the NH confirming that orbitally induced changes
in NH insolation is the major driver of long-term climate variations during the Holocene
(Kutzbach and Gallimore 1988; Braconnot et al,. 2000; Duplessy et al., 2001; Johnsen
et al., 2001; Crucifix et al,. 2002; Marchal et al., 2002; Andersen et al., 2004; Kim et al.,
2004; Moros et al., 2004; Solignac et al., 2004; Weber et al., 2004; Renssen et al., 2005;
Keigwin et al., 2005).
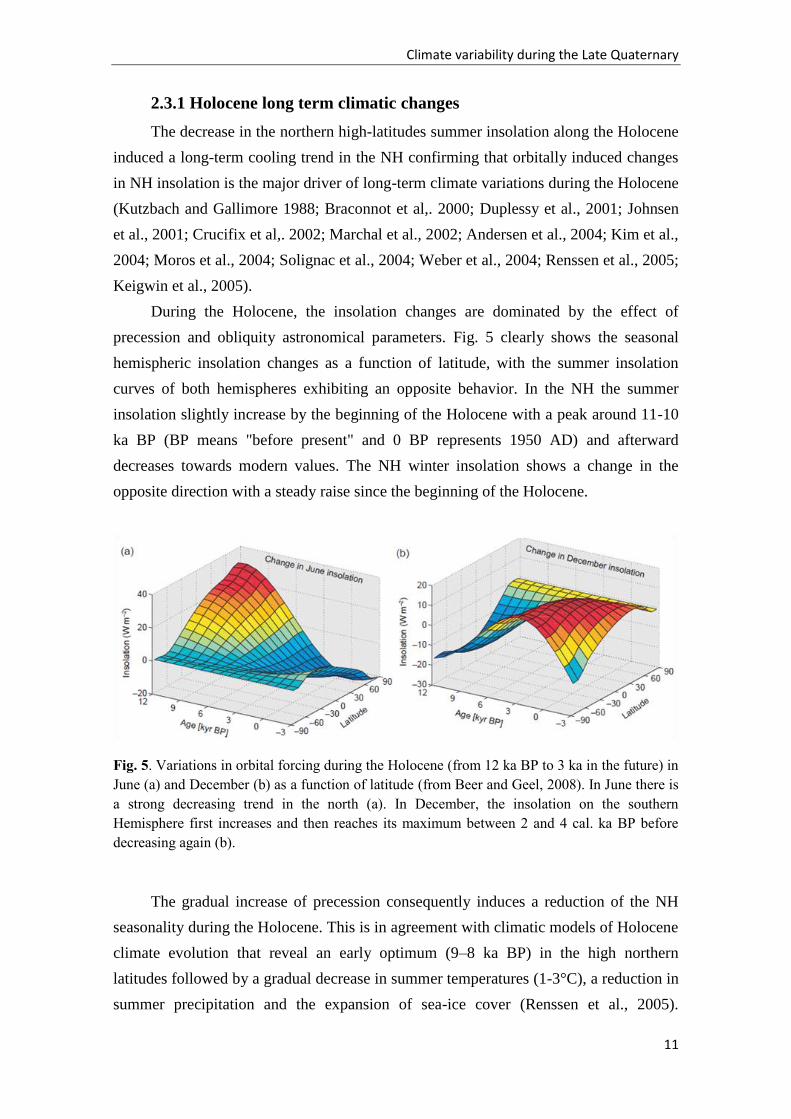
During the Holocene, the insolation changes are dominated by the effect of
precession and obliquity astronomical parameters. Fig. 5 clearly shows the seasonal
hemispheric insolation changes as a function of latitude, with the summer insolation
curves of both hemispheres exhibiting an opposite behavior. In the NH the summer
insolation slightly increase by the beginning of the Holocene with a peak around 11-10
ka BP (BP means "before present" and 0 BP represents 1950 AD) and afterward
decreases towards modern values. The NH winter insolation shows a change in the
opposite direction with a steady raise since the beginning of the Holocene.
Fig. 5. Variations in orbital forcing during the Holocene (from 12 ka BP to 3 ka in the future) in
June (a) and December (b) as a function of latitude (from Beer and Geel, 2008). In June there is
a strong decreasing trend in the north (a). In December, the insolation on the southern
Hemisphere first increases and then reaches its maximum between 2 and 4 cal. ka BP before
decreasing again (b).
The gradual increase of precession consequently induces a reduction of the NH
seasonality during the Holocene. This is in agreement with climatic models of Holocene
climate evolution that reveal an early optimum (9–8 ka BP) in the high northern
latitudes followed by a gradual decrease in summer temperatures (1-3°C), a reduction in
summer precipitation and the expansion of sea-ice cover (Renssen et al., 2005).
Climate variability during the Late Quaternary
12
Nevertheless, the greenhouse gas forcing partly counteracts (+ 0.5° C) the decrease in
summer insolation in the areas north of 60ºN over 9 ka (Crucifix et al., 2002; Renssen et
al., 2005).
The orbital induced NA long term cooling of the Holocene is also accompanied
by a southern shift of the Intertropical Convergence Zone (ITCZ) and a weakening of
the NH summer monsoon systems (Mayewski et al., 2004; Braconnot et al., 2007;
Wanner et al., 2008; 2011).
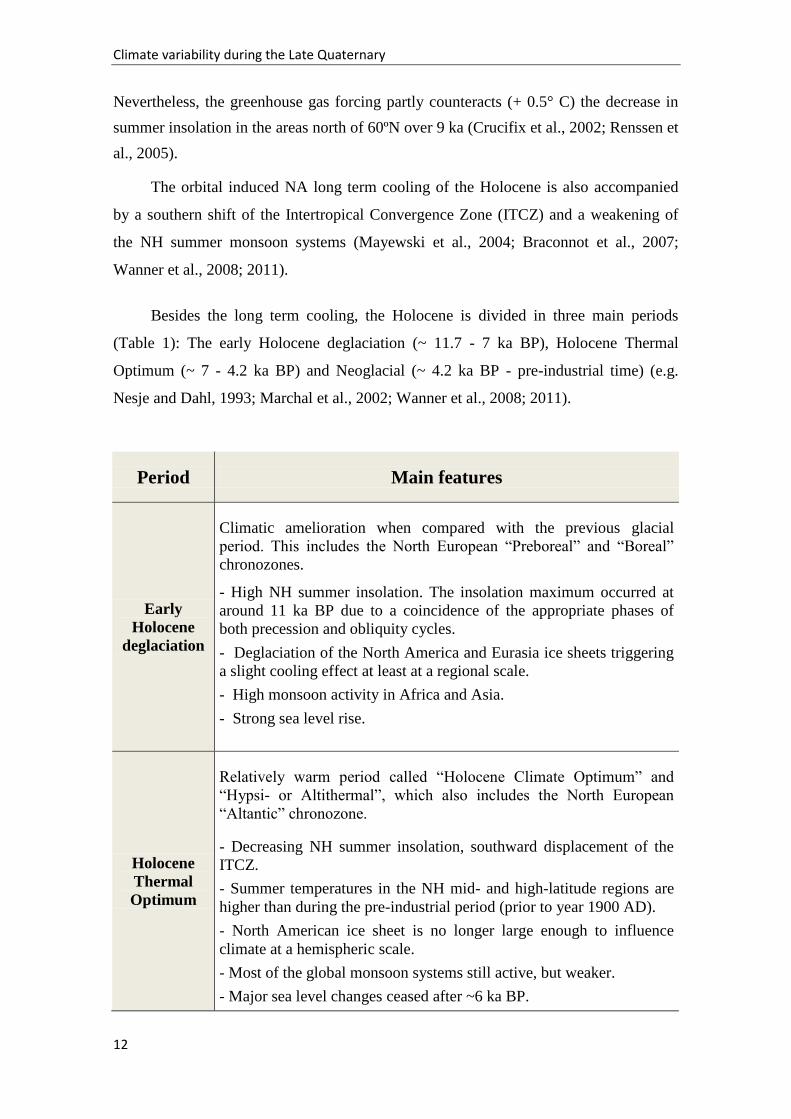
Besides the long term cooling, the Holocene is divided in three main periods
(Table 1): The early Holocene deglaciation (~ 11.7 - 7 ka BP), Holocene Thermal
Optimum (~ 7 - 4.2 ka BP) and Neoglacial (~ 4.2 ka BP - pre-industrial time) (e.g.
Nesje and Dahl, 1993; Marchal et al., 2002; Wanner et al., 2008; 2011).
Period Main features
Early
Holocene
deglaciation
Climatic amelioration when compared with the previous glacial
period. This includes the North European “Preboreal” and “Boreal”
chronozones.
- High NH summer insolation. The insolation maximum occurred at
around 11 ka BP due to a coincidence of the appropriate phases of
both precession and obliquity cycles.
- Deglaciation of the North America and Eurasia ice sheets triggering
a slight cooling effect at least at a regional scale.
- High monsoon activity in Africa and Asia.
- Strong sea level rise.
Holocene
Thermal
Optimum
Relatively warm period called “Holocene Climate Optimum” and
“Hypsi- or Altithermal”, which also includes the North European
“Altantic” chronozone.
- Decreasing NH summer insolation, southward displacement of the
ITCZ.
- Summer temperatures in the NH mid- and high-latitude regions are
higher than during the pre-industrial period (prior to year 1900 AD).
- North American ice sheet is no longer large enough to influence
climate at a hemispheric scale.
- Most of the global monsoon systems still active, but weaker.
- Major sea level changes ceased after ~6 ka BP.
Climate variability during the Late Quaternary
13
Neoglacial
Rather cold phase that coincides with the North European “Subboreal”
and “Subatlantic” chronozones.
- Low values of NH summer insolation leading to a decrease in
summer temperatures.
- Occurrence of several cold relapses with remarkable glacier advances
in different areas of the globe.
- Sea ice increases in the high latitudes.
- The Neoglacial period was interrupted by the global warming driven
by anthropogenic forcing (increased anthropogenic greenhouse effect),
therefore it lasted until the beginning of industrialization.
Table 1. The Holocene three main periods (adapted from Nesje and Dahl, 1993; Marchal et al.,
2002; Wanner et al., 2008; 2011).
Note: The Holocene has been subdivided into five time intervals, or chronozones, based
on Northern European climatic stratigraphies (Preboreal, Boreal, Atlantic, Subboreal
and Subatlantic). The Hypsi- or Altithermal refers to warm conditions in northern mid-
to high latitudes. Nevertheless these terms are related to regional climatic fluctuations
and have not been consistently applied (Wanner et al., 2008).
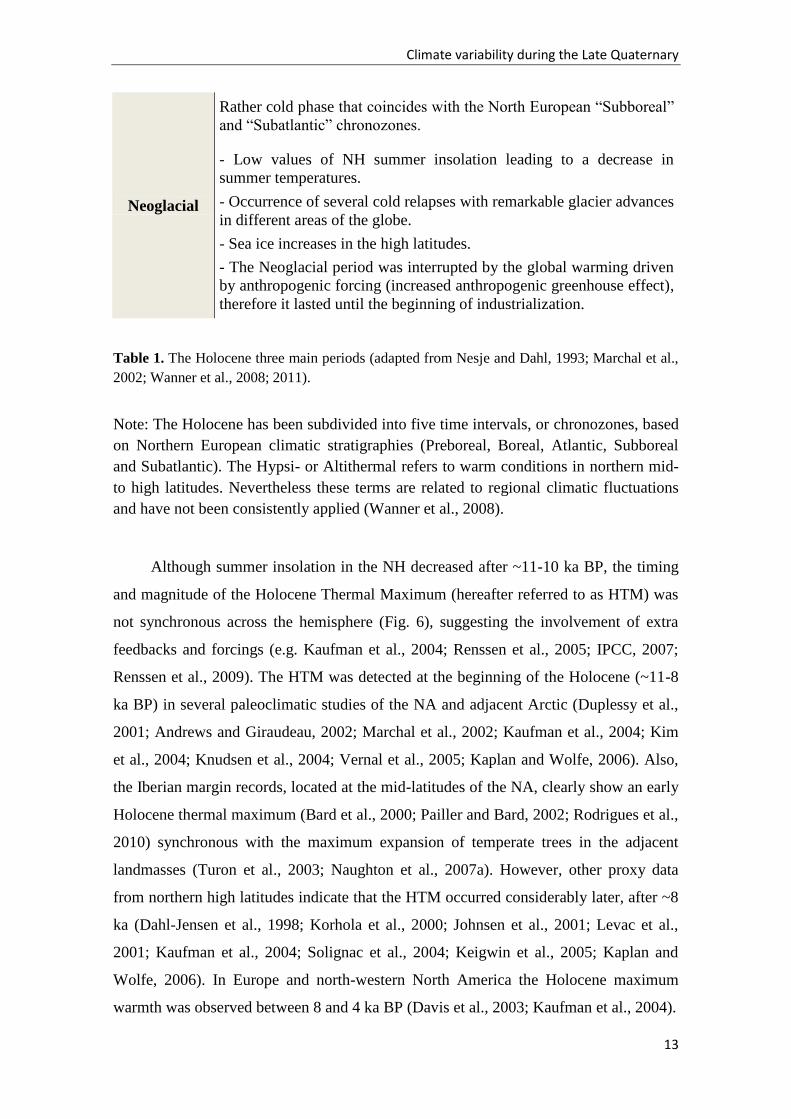
Although summer insolation in the NH decreased after ~11-10 ka BP, the timing
and magnitude of the Holocene Thermal Maximum (hereafter referred to as HTM) was
not synchronous across the hemisphere (Fig. 6), suggesting the involvement of extra
feedbacks and forcings (e.g. Kaufman et al., 2004; Renssen et al., 2005; IPCC, 2007;
Renssen et al., 2009). The HTM was detected at the beginning of the Holocene (~11-8
ka BP) in several paleoclimatic studies of the NA and adjacent Arctic (Duplessy et al.,
2001; Andrews and Giraudeau, 2002; Marchal et al., 2002; Kaufman et al., 2004; Kim
et al., 2004; Knudsen et al., 2004; Vernal et al., 2005; Kaplan and Wolfe, 2006). Also,
the Iberian margin records, located at the mid-latitudes of the NA, clearly show an early
Holocene thermal maximum (Bard et al., 2000; Pailler and Bard, 2002; Rodrigues et al.,
2010) synchronous with the maximum expansion of temperate trees in the adjacent
landmasses (Turon et al., 2003; Naughton et al., 2007a). However, other proxy data
from northern high latitudes indicate that the HTM occurred considerably later, after ~8
ka (Dahl-Jensen et al., 1998; Korhola et al., 2000; Johnsen et al., 2001; Levac et al.,
2001; Kaufman et al., 2004; Solignac et al., 2004; Keigwin et al., 2005; Kaplan and
Wolfe, 2006). In Europe and north-western North America the Holocene maximum
warmth was observed between 8 and 4 ka BP (Davis et al., 2003; Kaufman et al., 2004).
Climate variability during the Late Quaternary
14
Fig. 6. Timing and intensity of maximum temperature deviation from pre-industrial levels, as a
function of latitude and time (from IPCC, 2007). It is suggested a possible south to north
pattern, with southern latitudes showing HTM a few millennia earlier than the NH regions
(IPCC, 2007).
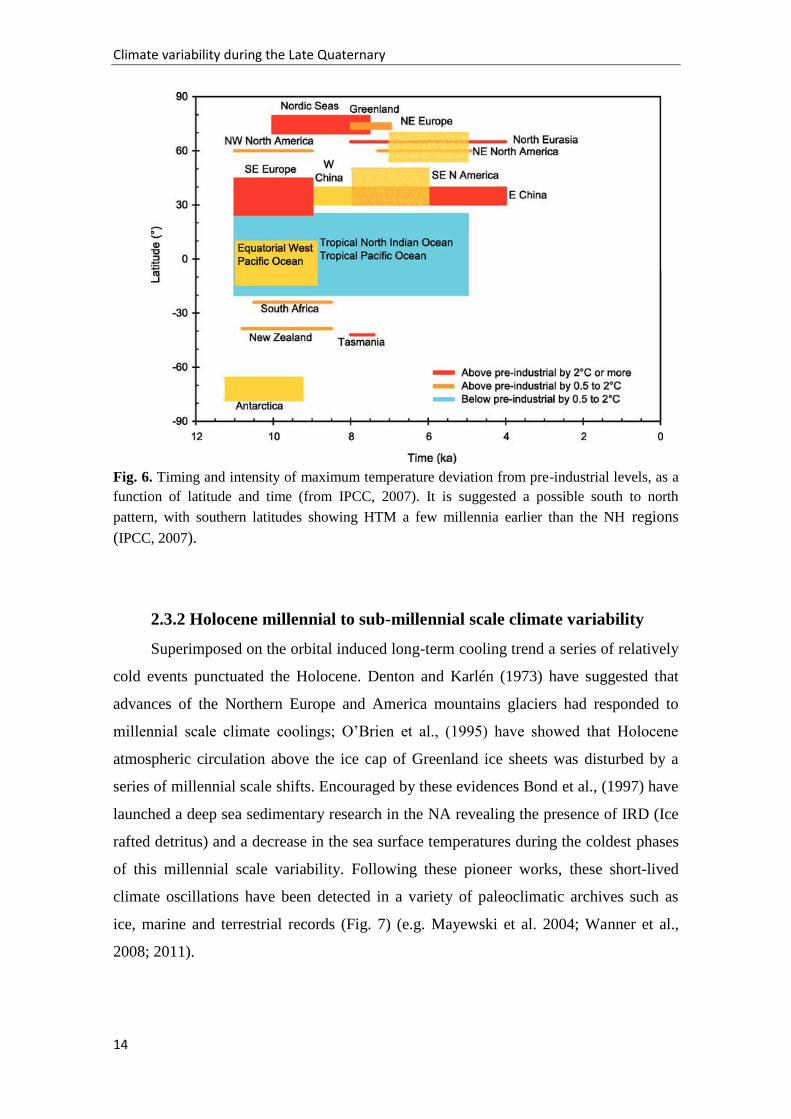
2.3.2 Holocene millennial to sub-millennial scale climate variability
Superimposed on the orbital induced long-term cooling trend a series of relatively
cold events punctuated the Holocene. Denton and Karlén (1973) have suggested that
advances of the Northern Europe and America mountains glaciers had responded to
millennial scale climate coolings; O’Brien et al., (1995) have showed that Holocene
atmospheric circulation above the ice cap of Greenland ice sheets was disturbed by a
series of millennial scale shifts. Encouraged by these evidences Bond et al., (1997) have
launched a deep sea sedimentary research in the NA revealing the presence of IRD (Ice
rafted detritus) and a decrease in the sea surface temperatures during the coldest phases
of this millennial scale variability. Following these pioneer works, these short-lived
climate oscillations have been detected in a variety of paleoclimatic archives such as
ice, marine and terrestrial records (Fig. 7) (e.g. Mayewski et al. 2004; Wanner et al.,
2008; 2011).
Climate variability during the Late Quaternary
15
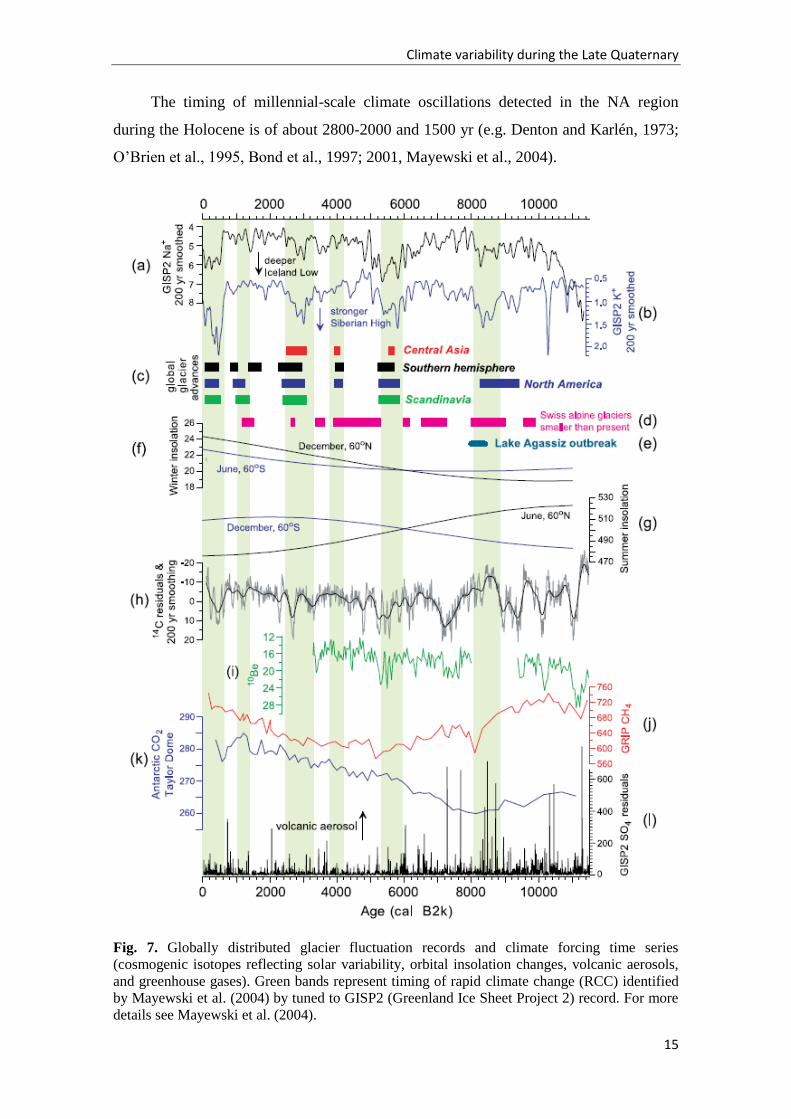
The timing of millennial-scale climate oscillations detected in the NA region
during the Holocene is of about 2800-2000 and 1500 yr (e.g. Denton and Karlén, 1973;
O’Brien et al., 1995, Bond et al., 1997; 2001, Mayewski et al., 2004).
Fig. 7. Globally distributed glacier fluctuation records and climate forcing time series
(cosmogenic isotopes reflecting solar variability, orbital insolation changes, volcanic aerosols,
and greenhouse gases). Green bands represent timing of rapid climate change (RCC) identified
by Mayewski et al. (2004) by tuned to GISP2 (Greenland Ice Sheet Project 2) record. For more
details see Mayewski et al. (2004).
Climate variability during the Late Quaternary
16
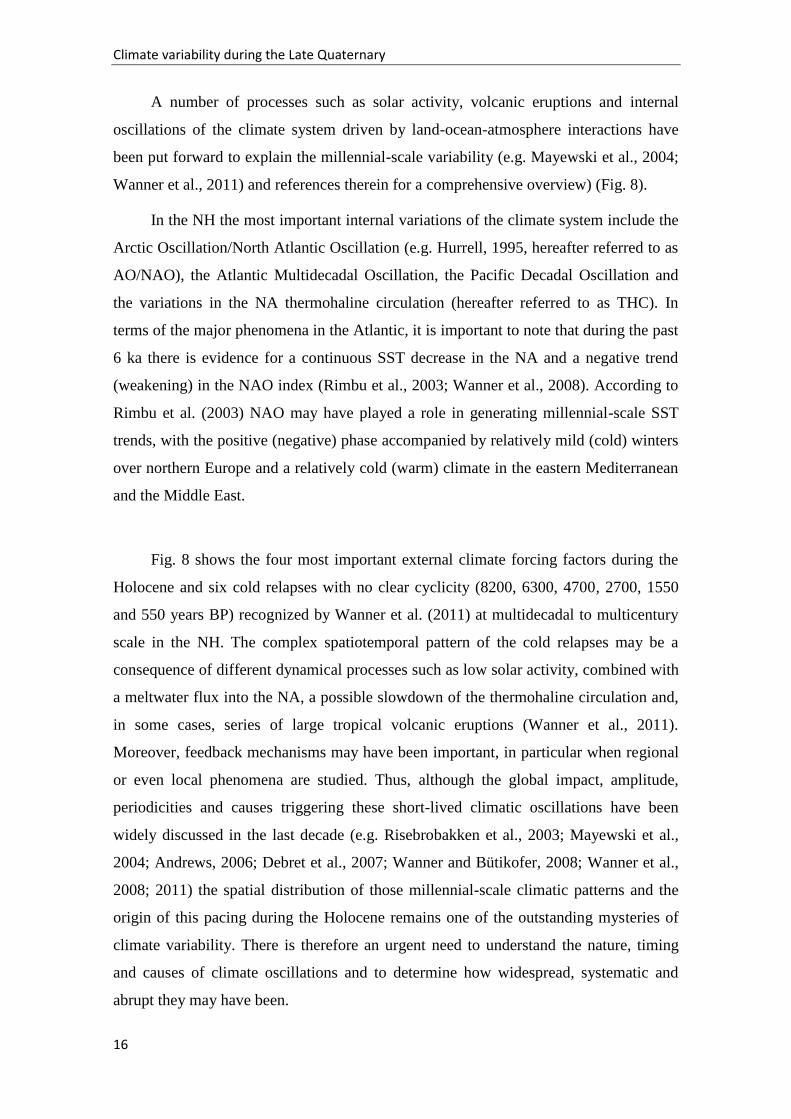
A number of processes such as solar activity, volcanic eruptions and internal
oscillations of the climate system driven by land-ocean-atmosphere interactions have
been put forward to explain the millennial-scale variability (e.g. Mayewski et al., 2004;
Wanner et al., 2011) and references therein for a comprehensive overview) (Fig. 8).
In the NH the most important internal variations of the climate system include the
Arctic Oscillation/North Atlantic Oscillation (e.g. Hurrell, 1995, hereafter referred to as
AO/NAO), the Atlantic Multidecadal Oscillation, the Pacific Decadal Oscillation and
the variations in the NA thermohaline circulation (hereafter referred to as THC). In
terms of the major phenomena in the Atlantic, it is important to note that during the past
6 ka there is evidence for a continuous SST decrease in the NA and a negative trend
(weakening) in the NAO index (Rimbu et al., 2003; Wanner et al., 2008). According to
Rimbu et al. (2003) NAO may have played a role in generating millennial-scale SST
trends, with the positive (negative) phase accompanied by relatively mild (cold) winters
over northern Europe and a relatively cold (warm) climate in the eastern Mediterranean
and the Middle East.
Fig. 8 shows the four most important external climate forcing factors during the
Holocene and six cold relapses with no clear cyclicity (8200, 6300, 4700, 2700, 1550
and 550 years BP) recognized by Wanner et al. (2011) at multidecadal to multicentury
scale in the NH. The complex spatiotemporal pattern of the cold relapses may be a
consequence of different dynamical processes such as low solar activity, combined with
a meltwater flux into the NA, a possible slowdown of the thermohaline circulation and,
in some cases, series of large tropical volcanic eruptions (Wanner et al., 2011).
Moreover, feedback mechanisms may have been important, in particular when regional
or even local phenomena are studied. Thus, although the global impact, amplitude,
periodicities and causes triggering these short-lived climatic oscillations have been
widely discussed in the last decade (e.g. Risebrobakken et al., 2003; Mayewski et al.,
2004; Andrews, 2006; Debret et al., 2007; Wanner and Bütikofer, 2008; Wanner et al.,
2008; 2011) the spatial distribution of those millennial-scale climatic patterns and the
origin of this pacing during the Holocene remains one of the outstanding mysteries of
climate variability. There is therefore an urgent need to understand the nature, timing
and causes of climate oscillations and to determine how widespread, systematic and
abrupt they may have been.
Climate variability during the Late Quaternary
17
Fig. 8. Main external forcings driving Holocene climate changes (from Wanner et al., 2011).
Holocene long-term trend: (a) Solar insolation due to orbital changes for two specific latitudes
in the Northern and Southern Hemispheres during the corresponding summer and d) Forcing
due to rising CO2 concentrations. Holocene millennial scale climate changes: (b) Volcanic
forcing during the past 6 ka depicted by the sulphate concentrations of two ice cores from
Greenland (blue vertical bars) and Antarctica (red vertical bars); (c) Solar activity fluctuations
reconstructed based on 10
Be measurements in polar ice. The six vertical blue bars indicate the
timing, but not the length of the six cold periods during the last 10 ka in the NH.
Climate variability during the Late Quaternary
18
2.3.2.1 Particular cases of well known Holocene short-lived climatic events
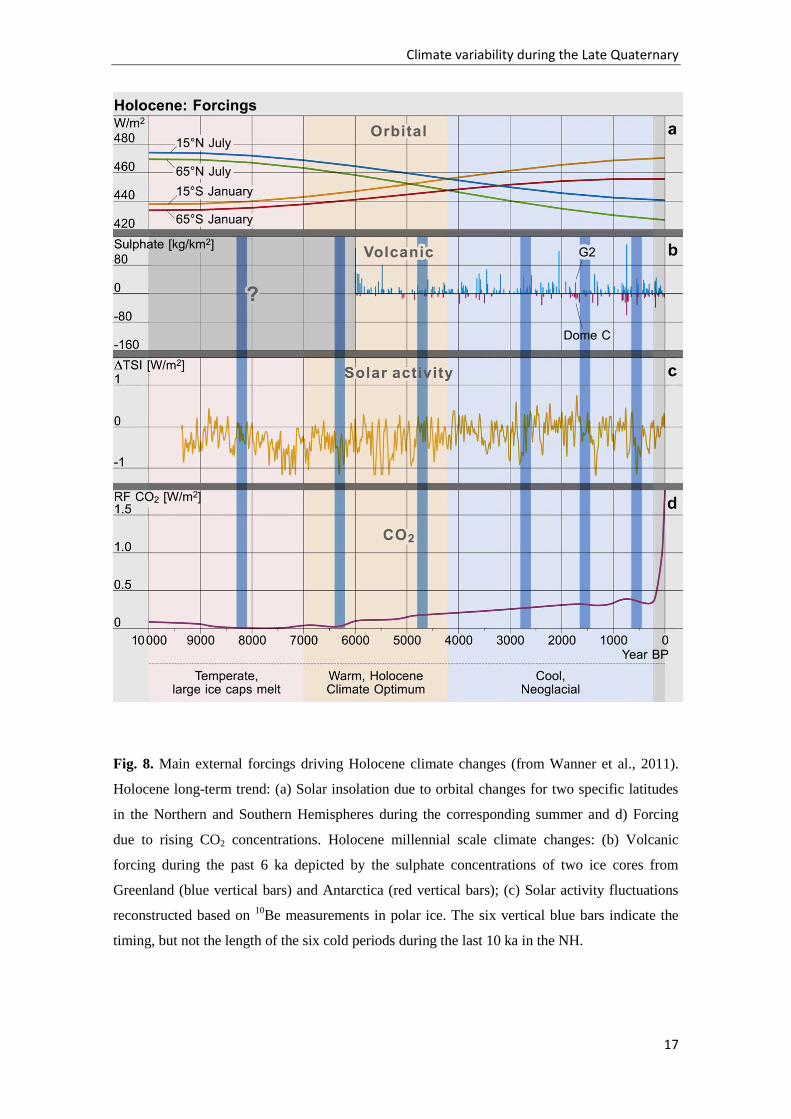
The most extreme Holocene short-lived cold episode occurred at around 8200 yr
BP and is known as the 8.2 ka cooling event. The 8.2 ka event is characterized by a
evident cooling of about 3.3 +/-1.1ºC during ~160 yr in Greenland ice core records (Fig.
9), coinciding with a reduction in ice accumulation rate, increasing wind speeds and a
decline in atmospheric methane concentrations. (O'Brien et al., 1995; Alley et al., 1997;
Muscheler et al., 2004; Kobashi et al., 2007; Thomas et al., 2007). This event was also
detected in many other terrestrial (e.g. Klitgaard-Kristensen et al., 1998; Von
Grafenstein et al., 1998; Magny et al., 2003) and marine records (e.g. Bond et al., 1997;
2001; Keigwin and Boyle, 2000; Alley and Ágústsdóttir, 2005 and references therein;
Naughton et al., 2007b) of the NA region, as well as in areas influenced by monsoons
suggesting the widespread signature of the abrupt 8.2 ka event (Alley and Ágústsdóttir,
2005; Rohling and Pälike, 2005; Fleitmann et al., 2007).
Fig. 9. Oxygen isotope ratios from GRIP (Greenland Ice Core Project) (red), GISP2 (black),
NGRIP (blue), and Dye 3 (green) all plotted on the GRIP depth scale and the GICC05 age scale
(from Thomas et al., 2007).
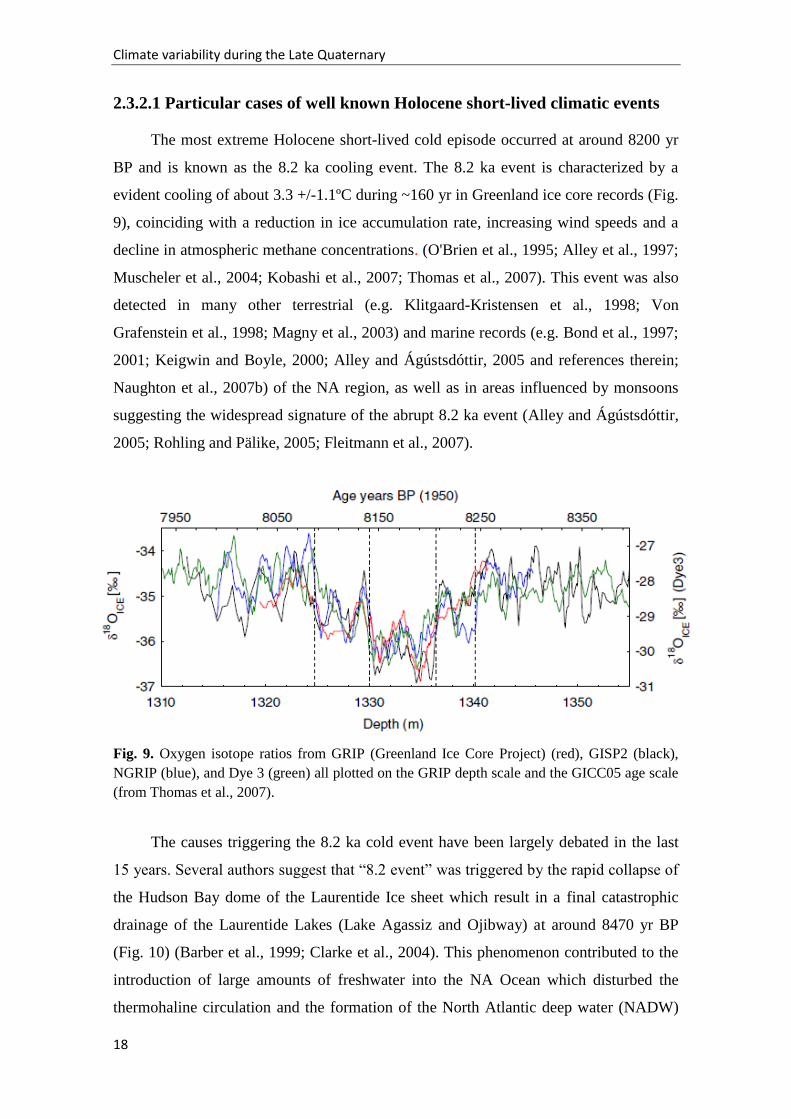
The causes triggering the 8.2 ka cold event have been largely debated in the last
15 years. Several authors suggest that “8.2 event” was triggered by the rapid collapse of
the Hudson Bay dome of the Laurentide Ice sheet which result in a final catastrophic
drainage of the Laurentide Lakes (Lake Agassiz and Ojibway) at around 8470 yr BP
(Fig. 10) (Barber et al., 1999; Clarke et al., 2004). This phenomenon contributed to the
introduction of large amounts of freshwater into the NA Ocean which disturbed the
thermohaline circulation and the formation of the North Atlantic deep water (NADW)
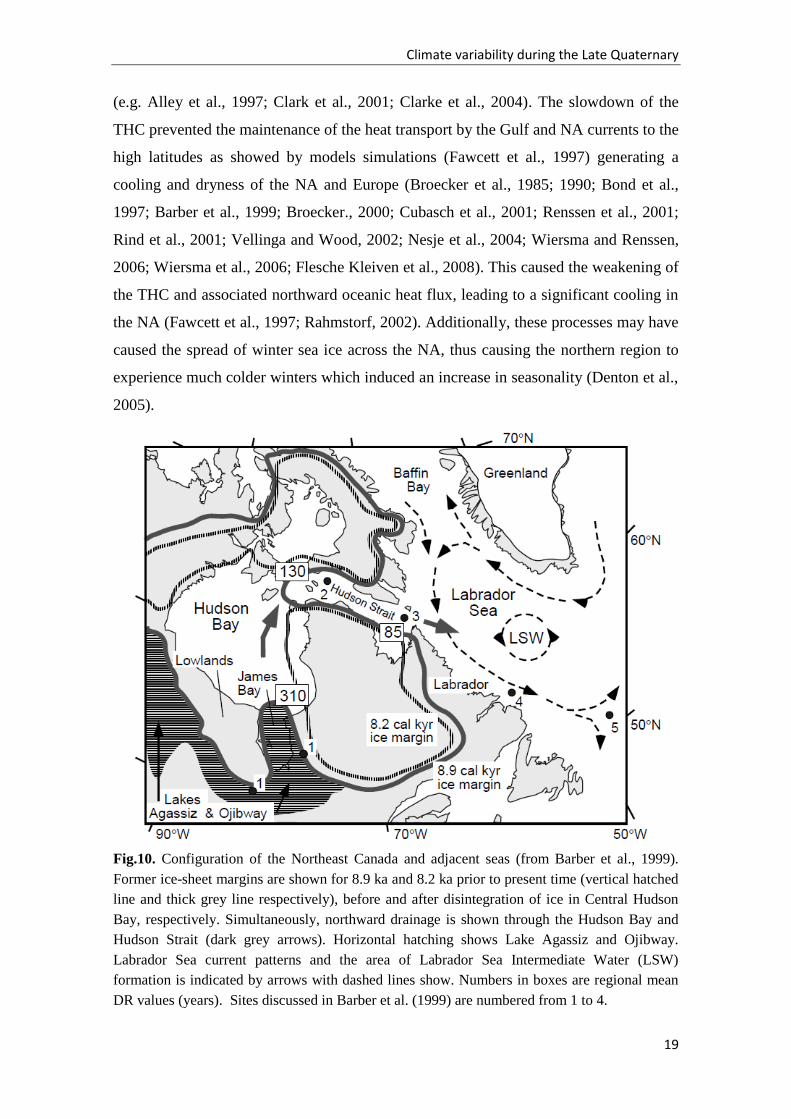
Climate variability during the Late Quaternary
19
(e.g. Alley et al., 1997; Clark et al., 2001; Clarke et al., 2004). The slowdown of the
THC prevented the maintenance of the heat transport by the Gulf and NA currents to the
high latitudes as showed by models simulations (Fawcett et al., 1997) generating a
cooling and dryness of the NA and Europe (Broecker et al., 1985; 1990; Bond et al.,
1997; Barber et al., 1999; Broecker., 2000; Cubasch et al., 2001; Renssen et al., 2001;
Rind et al., 2001; Vellinga and Wood, 2002; Nesje et al., 2004; Wiersma and Renssen,
2006; Wiersma et al., 2006; Flesche Kleiven et al., 2008). This caused the weakening of
the THC and associated northward oceanic heat flux, leading to a significant cooling in
the NA (Fawcett et al., 1997; Rahmstorf, 2002). Additionally, these processes may have
caused the spread of winter sea ice across the NA, thus causing the northern region to
experience much colder winters which induced an increase in seasonality (Denton et al.,
2005).
Fig.10. Configuration of the Northeast Canada and adjacent seas (from Barber et al., 1999).
Former ice-sheet margins are shown for 8.9 ka and 8.2 ka prior to present time (vertical hatched
line and thick grey line respectively), before and after disintegration of ice in Central Hudson
Bay, respectively. Simultaneously, northward drainage is shown through the Hudson Bay and
Hudson Strait (dark grey arrows). Horizontal hatching shows Lake Agassiz and Ojibway.
Labrador Sea current patterns and the area of Labrador Sea Intermediate Water (LSW)
formation is indicated by arrows with dashed lines show. Numbers in boxes are regional mean
DR values (years). Sites discussed in Barber et al. (1999) are numbered from 1 to 4.
Climate variability during the Late Quaternary
20
Other authors, however, suggested that this event was caused mainly by variations
related to a reduction in solar irradiance (Denton and Karlen, 1973; Bond et al., 2001;
Van Geel et al., 2003). These studies argue that changes in solar activity might have
triggered the observed climate changes, most likely involving changes in ocean
circulation. However, the fact that this event is more prominent in the NA region; that it
follows outbursts flooding episodes; and that the existing similarities between
reconstructed anomaly patterns and patterns expected following a NA freshening seems
to favour the freshwater pulse mechanism as the major trigger for the 8.2 event (Alley
and Ágústsdóttir, 2005).
Nevertheless, it is possible that the two hypothesis are compatible with recent
publications (Rohling and Pälike, 2005; Ellison et al., 2006; Naughton et al., 2007b)
that suggest the occurrence of the 8.2 ka event within a long climate cooling anomaly of
multicentennial scale, between 8600 and 8000 years ago.
The millennial scale climate oscillations after the 8.2 ka event have not left a
global “fingerprint” and there is no agreement on the amplitude and frequency of these
oscillations. Nevertheless, although the amplitude of natural climate variations was
weaker after the 8.2 event, they were strong enough to affect ecosystems and human
societies (Mayewski et al., 2004), as documented for the last two millennia.
The last two millennia are marked by 5 climatic events in the NH: the Roman
Warm Period (RWP) (~1–300 AD), the Dark Age Cold Period (DACP) (~300-800 AD),
the Medieval Climate Anomaly (MCA) (AD 800–1300), the Little Ice Age (LIA)
(1300-1900 AD) and the recent warming (RW) (Fig. 11) (Ljungqvist, 2010). The
temperature anomaly reconstruction of Ljungqvist (2010) is relatively consistent, in
terms of amplitude and timing of warm and cold periods, with those of: Lamb (1977),
Moberg et al. (2005) and Mann et al. (2008), except for the DACP.
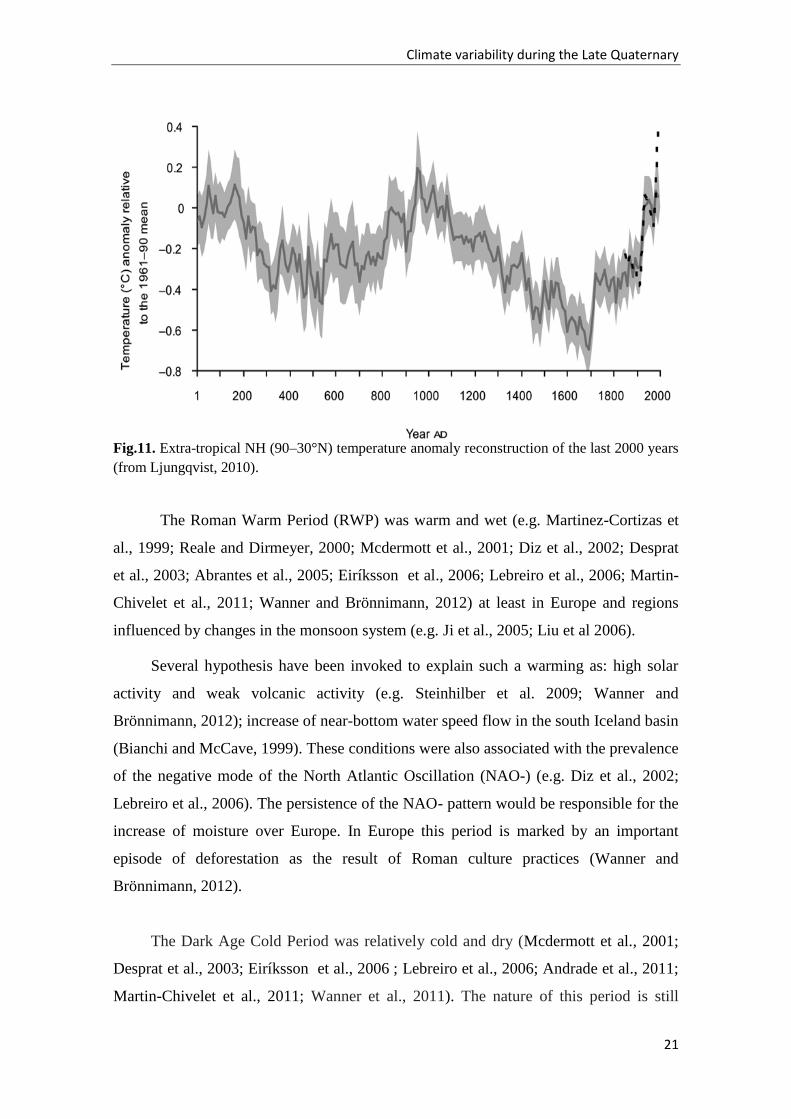
Climate variability during the Late Quaternary
21
Fig.11. Extra-tropical NH (90–30°N) temperature anomaly reconstruction of the last 2000 years
(from Ljungqvist, 2010).
The Roman Warm Period (RWP) was warm and wet (e.g. Martinez-Cortizas et
al., 1999; Reale and Dirmeyer, 2000; Mcdermott et al., 2001; Diz et al., 2002; Desprat
et al., 2003; Abrantes et al., 2005; Eiríksson et al., 2006; Lebreiro et al., 2006; Martin-
Chivelet et al., 2011; Wanner and Brönnimann, 2012) at least in Europe and regions
influenced by changes in the monsoon system (e.g. Ji et al., 2005; Liu et al 2006).
Several hypothesis have been invoked to explain such a warming as: high solar
activity and weak volcanic activity (e.g. Steinhilber et al. 2009; Wanner and
Brönnimann, 2012); increase of near-bottom water speed flow in the south Iceland basin
(Bianchi and McCave, 1999). These conditions were also associated with the prevalence
of the negative mode of the North Atlantic Oscillation (NAO-) (e.g. Diz et al., 2002;
Lebreiro et al., 2006). The persistence of the NAO- pattern would be responsible for the
increase of moisture over Europe. In Europe this period is marked by an important
episode of deforestation as the result of Roman culture practices (Wanner and
Brönnimann, 2012).
The Dark Age Cold Period was relatively cold and dry (Mcdermott et al., 2001;
Desprat et al., 2003; Eiríksson et al., 2006 ; Lebreiro et al., 2006; Andrade et al., 2011;
Martin-Chivelet et al., 2011; Wanner et al., 2011). The nature of this period is still
Climate variability during the Late Quaternary
22
unclear, nevertheless the solar forcing curve shows a negative peak shortly after this
event, and a larger volcanic activity started as well after AD 600 (Zielinski, 2000).
Historically this period is marked by strong human migration in Europe (Wanner et al.,
2011).
The Medieval Climatic Anomaly MCA), also called Medieval Warm Period
(MWP), marks the return to relatively warm but relatively dry conditions over southern
Europe (Diz et al., 2002; Desprat et al., 2003; Álvarez et al., 2005; Lebreiro et al., 2006;
Abrantes et al., 2011, Andrade et al., 2011; Martin-Chivelet et al., 2011). The northern
Europe was also warmer but wet (e.g. Trouet et al., 2009). In contrast the tropical
pacific was cold (Trouet et al., 2009). This globally complex climatic pattern can be
explained, particularly over the Atlantic/European region, by the prevalence of the
positive mode of NAO during the MCA (Trouet et al., 2009).
The transition from MCA to the subsequent Little Ice age (LIA) is one of the most
debated questions in Late Holocene climate variability; however there is evidence that it
was due to a shift from prevailing positive to a most negative mode of the NAO
(Hughes and Diaz, 1994; Bradley et al., 2003; Trouet et al., 2009; Mann et al., 2009).
In the NH, LIA was probably the coldest multidecadal to multicentury long
Holocene period since the 8.2 ka event (e.g. Kaufman et al., 2009). These cold
conditions were probably triggered by a series of Grand Solar Minima and high number
of strong tropical volcanic eruptions (see Fig. 8) (Renssen et al., 2007; Wanner et al.,
2011). The LIA has however a complex climatic signature in the Iberian margin and
adjacent landmasses. Thus, most records from NW Iberia Peninsula and margin show a
sea surface and terrestrial cooling, a general continental dryness and enhanced
upwelling regime during this period associated with a prevailing NAO+ mode (Diz et
al., 2002; Desprat et al., 2003; Álvarez et al., 2005; Lebreiro et al., 2006; Abrantes et al.,
2011, Andrade et al., 2011; Martin-Chivelet et al., 2011) while the Tagus Prodelta is
characterized by storminess and excess in precipitation and river discharges associated
with prevailing NAO- mode (Abrantes et al., 2005b; Eiríksson et al., 2006; Lebreiro et
al., 2006). Interestingly, this apparent contradictory links with the prevailing NAO
mode during the LIA are not restricted to the Iberian Peninsula and reflect a much wider
potential inconsistency described in detail by Trouet et al. (2012).
Climate variability during the Late Quaternary
23
The unfavorable climate conditions during the LIA had an extensive impact in
human societies in Europe, e.g. decline of health and economic wealth of medieval
societies triggered by the Black Death, the abandonment of the Norse settlements in
Greenland or the abandonment of permanent settlements in the Alps (Pfister, 1995;
Fagan, 2000; Grove, 2004; Patterson et al., 2010: Bűntgen et al., 2011).
Despite the considerable progresses that have been made in recent years in late-
Holocene palaeoclimatology (for a review, see Wanner et al. (2008), IPCC (2007)
report and Jones et al. (2009)), the world-wide nature, timing and amplitude of these
events are not completely understood yet.
Material and Environmental setting
24
3. MATERIAL AND ENVIRONMENTAL SETTING
3.1 Sediment core
To attain the objectives of this master a sediment core was retrieved in a selected
key site from the continental shelf of the Basque Country (southwestern Europe) (Fig.
12; Table 2). This geographical region is particularly sensitive to climate changes, since
it is directly affected by hydrological changes of the North Atlantic Drift and by a
temperate Atlantic climate regime in the adjacent landmasses.
Core KS05 10 was retrieved from the shelf mud patch of southwestern margin of
the Bay of Biscay (Basque country) in 2005, during the cruise EUSKA 3 on board N/O
Côtes de la Manche.
This sequence is characterized by relatively homogeneous silty-clay sediments
(Fig. 13) and the chronological framework indicates that covers the last ca. 9000 yr. The
sedimentation rate varies between 0.01 and 0.05 cm/yr allowing a centennial time-scale
resolution.
Table 2. Main features of the cored site.
Core Ref. KS05 10 core
Longitude (W) 2°16’744W
Latitude (N) 43°22’765N
Water depth (m) 114
Core lenth (m) 2,5
Ship N/O Côtes de la Manche
Cruise EUSKA 3
Sampler Gravity corer
Material and Environmental setting
25
Fig. 12. Map showing the location of the studied core. Sources: The bathymetry is derived from
the Digital Bathymetry as produced in the EMODNet Hydrography (http://www.emodnet-
hydrography.eu). The elevation data is derived from SRTM (Shuttle Radar Topography
Mission) 90m Digital Elevation Database v4.1 (Farr et al., 2007). The drainage system is
derived from the Europe and North Asia (EURNASIA) Vmap Level Zero (VMAP0 - Digital
Chart of the World)
(http://webgis.wr.usgs.gov/globalgis/metadata_qr/metadata/perennial_rivers.htm).
Top
Base
Fig. 13. Photos of KS05 10 core.
Material and Environmental setting
26
3.2 Environmental Setting
The selected key-site is strongly influenced by the complex interactions between
the ocean, atmosphere, and cryosphere of the NA realm. Accordingly, the following
section presents a brief review of the main features of the ocean and atmospheric
circulation of the NA, as well as the present day climate and vegetation of the studied
region.
3.2.1 Ocean and Atmospheric Circulation
The NA is one of the few regions in the world where deep water formation occurs
and is characterized by a continuous poleward flow of warm and salty surface waters
that constitutes the upper part of the Meridional Overturning Circulation (MOC) (Fig.
14). The THC currents carry water, that has been warmed in the tropics, to the NA
Ocean by means of the Gulf Stream and North Atlantic Current (NAC), causing a large
influence in the climate by the release of both latent and sensible heat to the atmosphere.
When surface waters reach high latitudes, they have cooled and augmented in salinity,
leading to an increase in their density. The cold and salty surface waters sinks to the
deep ocean to form the oxygen-rich and nutrient-poor NADW that is transported
southwards in the deep ocean. Together with the wind driven surface currents, this
circulation is collectively referred to as the MOC (Rahmstorf, 2007).
Fig. 14. Schematic representation of the Meridional overturning circulation (from Rahmstorf,
2007). Global circulation system in the world ocean that shows the northward transport of warm
and salty surface waters in the NA and the return flow to the south of cold and dense NADW in
the abyssal ocean. ACC corresponds to the Antarctic Circumpolar Current.
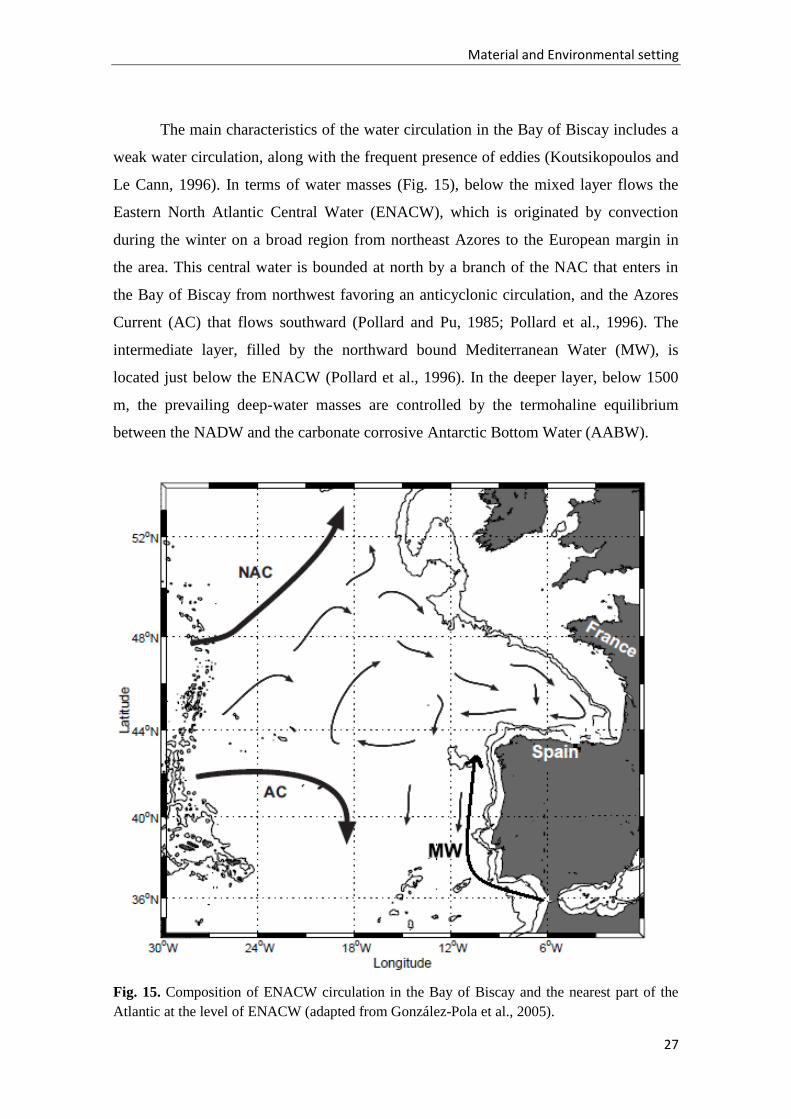
Material and Environmental setting
27
The main characteristics of the water circulation in the Bay of Biscay includes a
weak water circulation, along with the frequent presence of eddies (Koutsikopoulos and
Le Cann, 1996). In terms of water masses (Fig. 15), below the mixed layer flows the
Eastern North Atlantic Central Water (ENACW), which is originated by convection
during the winter on a broad region from northeast Azores to the European margin in
the area. This central water is bounded at north by a branch of the NAC that enters in
the Bay of Biscay from northwest favoring an anticyclonic circulation, and the Azores
Current (AC) that flows southward (Pollard and Pu, 1985; Pollard et al., 1996). The
intermediate layer, filled by the northward bound Mediterranean Water (MW), is
located just below the ENACW (Pollard et al., 1996). In the deeper layer, below 1500
m, the prevailing deep-water masses are controlled by the termohaline equilibrium
between the NADW and the carbonate corrosive Antarctic Bottom Water (AABW).
Fig. 15. Composition of ENACW circulation in the Bay of Biscay and the nearest part of the
Atlantic at the level of ENACW (adapted from González-Pola et al., 2005).
Material and Environmental setting
28
The vegetation changes reflected in the KS05 10 record are associated to
environmental and climatic conditions registered in the closest landmasses, i.e. the area
corresponding to modern day northern Spain and southern France. This region is
particularly sensitive to interannual shifts in the trajectories of mid-latitude cyclones
that can lead to remarkable anomalies of precipitation and, to a lesser extent, of
temperature (Trigo et al., 2008). This area is influenced by a relatively small number of
large-scale modes of atmospheric circulation in the Northern Hemisphere that have been
described previously in literature (Wallace and Gutzler, 1981; Barnston and Livezey,
1987), namely: a) the North Atlantic Oscillation (NAO), b) the Eastern Atlantic (EA)
pattern and c) the Scandinavian pattern (SCAND) also known as Blocking pattern. In
recent years most climate variability publications use the teleconnection indices derived
and maintained by the Climate Prediction Center (CPC) from NOAA
(http://www.cpc.ncep.noaa.gov/data/teledoc/telecontents.shtml). Their methodology is
based on Rotated Principal Component Analysis applied to monthly mean standardized
500-mb geopotential height anomalies (Barnston and Livezey, 1987).
The spatial signature of the three main large-scale patterns affecting the Euro-
Atlantic region for the period that spans between 1960 and 2000 can be observed in Fig.
16, representing respectively the NAO (top), EA (middle) and SCAND (bottom)
patterns. In fact, Fig. 16 represents the temporal correlation between the monthly
standardized height anomalies at each point and the monthly teleconnection pattern time
series from 1960 to 2000. It should be always kept in mind that these modes are
seasonally dependent, i.e. their signature can vary throughout the year. The seasonal
dependence of these modes and the impact on surface climate (temperature and
precipitation) can be appreciated in the CPC site as well.
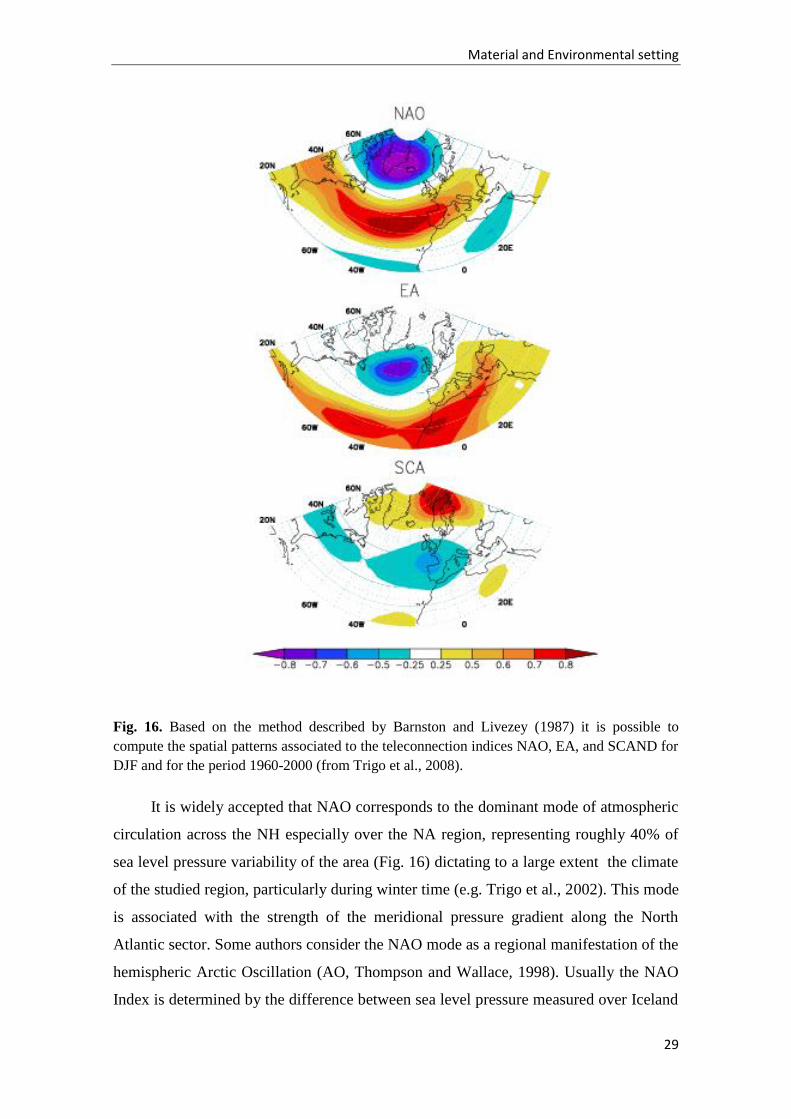
Material and Environmental setting
29
Fig. 16. Based on the method described by Barnston and Livezey (1987) it is possible to
compute the spatial patterns associated to the teleconnection indices NAO, EA, and SCAND for
DJF and for the period 1960-2000 (from Trigo et al., 2008).
It is widely accepted that NAO corresponds to the dominant mode of atmospheric
circulation across the NH especially over the NA region, representing roughly 40% of
sea level pressure variability of the area (Fig. 16) dictating to a large extent the climate
of the studied region, particularly during winter time (e.g. Trigo et al., 2002). This mode
is associated with the strength of the meridional pressure gradient along the North
Atlantic sector. Some authors consider the NAO mode as a regional manifestation of the
hemispheric Arctic Oscillation (AO, Thompson and Wallace, 1998). Usually the NAO
Index is determined by the difference between sea level pressure measured over Iceland
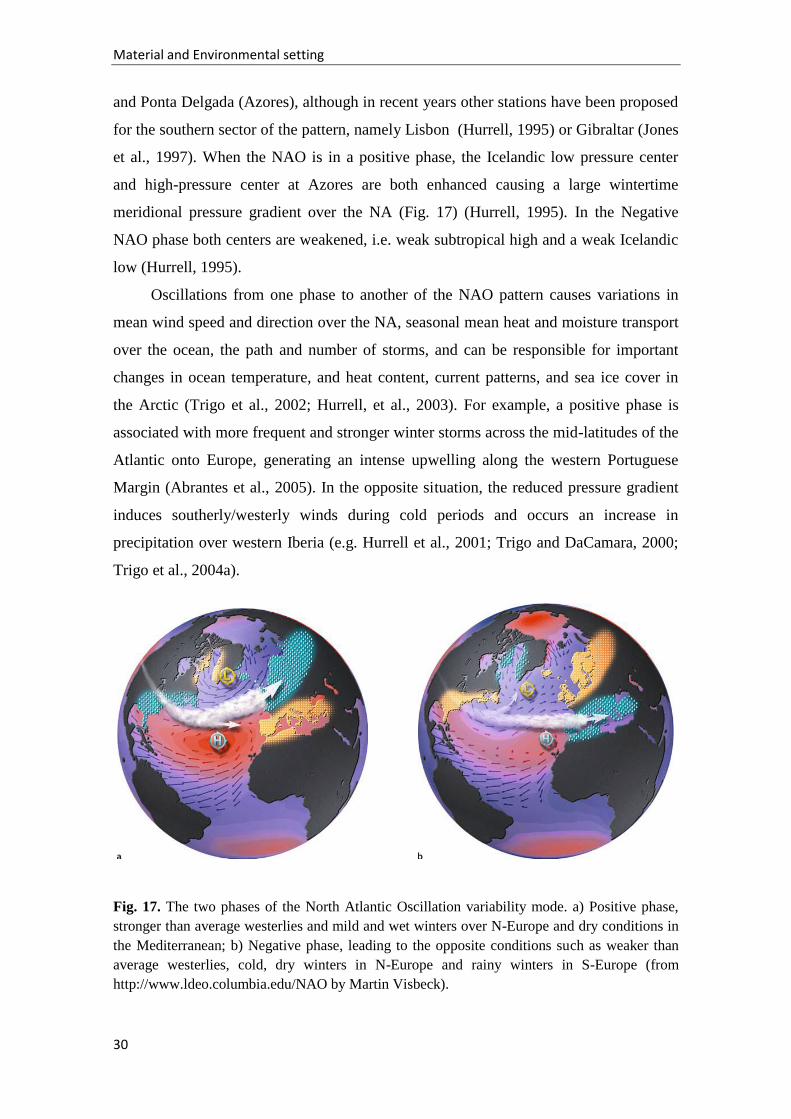
Material and Environmental setting
30
and Ponta Delgada (Azores), although in recent years other stations have been proposed
for the southern sector of the pattern, namely Lisbon (Hurrell, 1995) or Gibraltar (Jones
et al., 1997). When the NAO is in a positive phase, the Icelandic low pressure center
and high-pressure center at Azores are both enhanced causing a large wintertime
meridional pressure gradient over the NA (Fig. 17) (Hurrell, 1995). In the Negative
NAO phase both centers are weakened, i.e. weak subtropical high and a weak Icelandic
low (Hurrell, 1995).
Oscillations from one phase to another of the NAO pattern causes variations in
mean wind speed and direction over the NA, seasonal mean heat and moisture transport
over the ocean, the path and number of storms, and can be responsible for important
changes in ocean temperature, and heat content, current patterns, and sea ice cover in
the Arctic (Trigo et al., 2002; Hurrell, et al., 2003). For example, a positive phase is
associated with more frequent and stronger winter storms across the mid-latitudes of the
Atlantic onto Europe, generating an intense upwelling along the western Portuguese
Margin (Abrantes et al., 2005). In the opposite situation, the reduced pressure gradient
induces southerly/westerly winds during cold periods and occurs an increase in
precipitation over western Iberia (e.g. Hurrell et al., 2001; Trigo and DaCamara, 2000;
Trigo et al., 2004a).
Fig. 17. The two phases of the North Atlantic Oscillation variability mode. a) Positive phase,
stronger than average westerlies and mild and wet winters over N-Europe and dry conditions in
the Mediterranean; b) Negative phase, leading to the opposite conditions such as weaker than
average westerlies, cold, dry winters in N-Europe and rainy winters in S-Europe (from
http://www.ldeo.columbia.edu/NAO by Martin Visbeck).
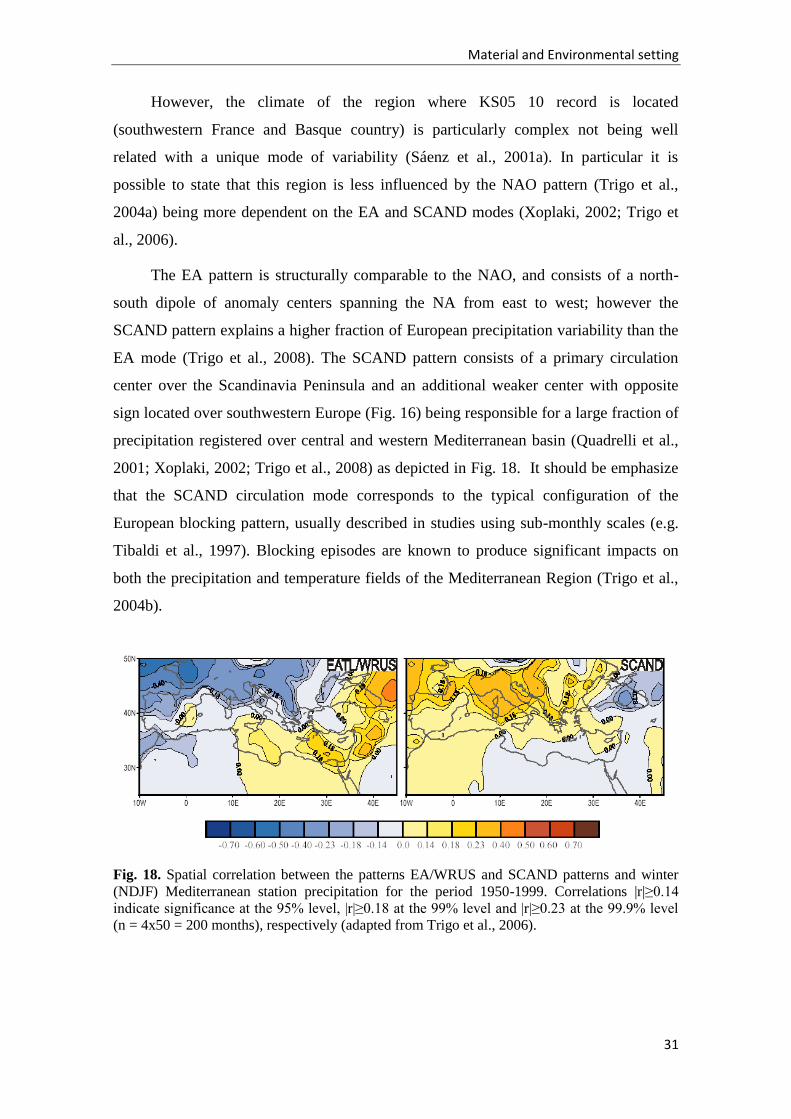
Material and Environmental setting
31
However, the climate of the region where KS05 10 record is located
(southwestern France and Basque country) is particularly complex not being well
related with a unique mode of variability (Sáenz et al., 2001a). In particular it is
possible to state that this region is less influenced by the NAO pattern (Trigo et al.,
2004a) being more dependent on the EA and SCAND modes (Xoplaki, 2002; Trigo et
al., 2006).
The EA pattern is structurally comparable to the NAO, and consists of a north-
south dipole of anomaly centers spanning the NA from east to west; however the
SCAND pattern explains a higher fraction of European precipitation variability than the
EA mode (Trigo et al., 2008). The SCAND pattern consists of a primary circulation
center over the Scandinavia Peninsula and an additional weaker center with opposite
sign located over southwestern Europe (Fig. 16) being responsible for a large fraction of
precipitation registered over central and western Mediterranean basin (Quadrelli et al.,
2001; Xoplaki, 2002; Trigo et al., 2008) as depicted in Fig. 18. It should be emphasize
that the SCAND circulation mode corresponds to the typical configuration of the
European blocking pattern, usually described in studies using sub-monthly scales (e.g.
Tibaldi et al., 1997). Blocking episodes are known to produce significant impacts on
both the precipitation and temperature fields of the Mediterranean Region (Trigo et al.,
2004b).
Fig. 18. Spatial correlation between the patterns EA/WRUS and SCAND patterns and winter
(NDJF) Mediterranean station precipitation for the period 1950-1999. Correlations |r|≥0.14
indicate significance at the 95% level, |r|≥0.18 at the 99% level and |r|≥0.23 at the 99.9% level
(n = 4x50 = 200 months), respectively (adapted from Trigo et al., 2006).
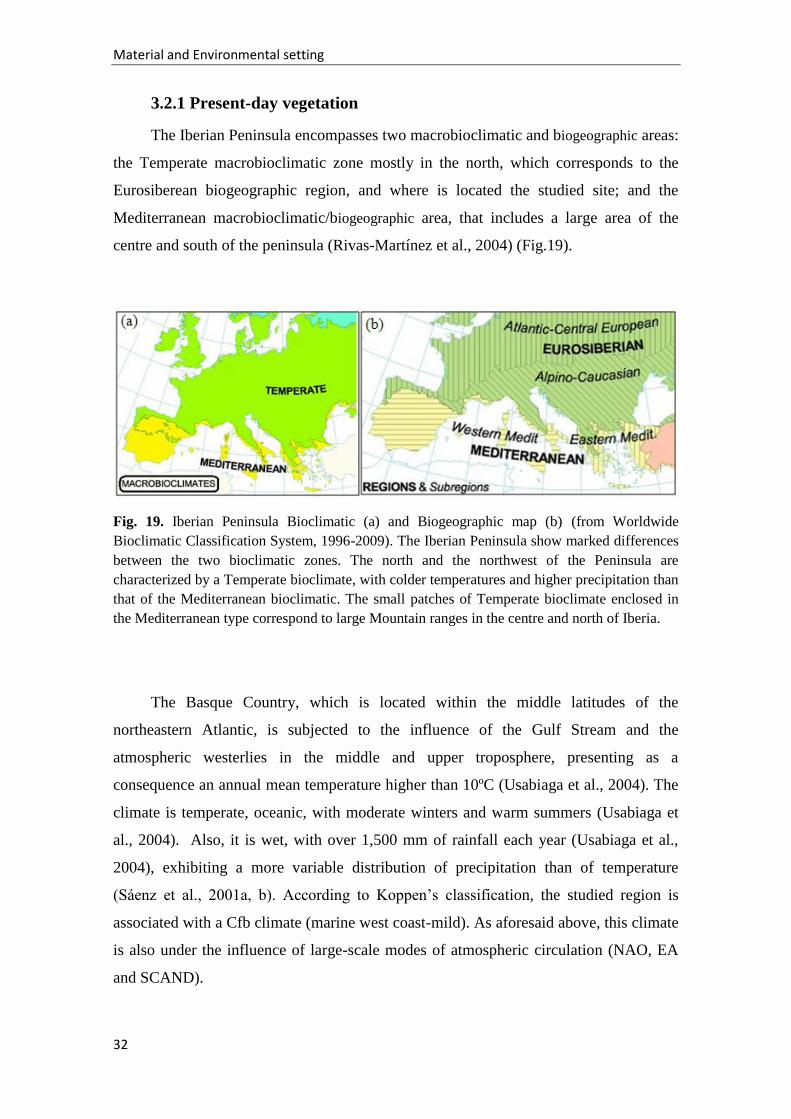
Material and Environmental setting
32
3.2.1 Present-day vegetation
The Iberian Peninsula encompasses two macrobioclimatic and biogeographic areas:
the Temperate macrobioclimatic zone mostly in the north, which corresponds to the
Eurosiberean biogeographic region, and where is located the studied site; and the
Mediterranean macrobioclimatic/biogeographic area, that includes a large area of the
centre and south of the peninsula (Rivas-Martínez et al., 2004) (Fig.19).
Fig. 19. Iberian Peninsula Bioclimatic (a) and Biogeographic map (b) (from Worldwide
Bioclimatic Classification System, 1996-2009). The Iberian Peninsula show marked differences
between the two bioclimatic zones. The north and the northwest of the Peninsula are
characterized by a Temperate bioclimate, with colder temperatures and higher precipitation than
that of the Mediterranean bioclimatic. The small patches of Temperate bioclimate enclosed in
the Mediterranean type correspond to large Mountain ranges in the centre and north of Iberia.
The Basque Country, which is located within the middle latitudes of the
northeastern Atlantic, is subjected to the influence of the Gulf Stream and the
atmospheric westerlies in the middle and upper troposphere, presenting as a
consequence an annual mean temperature higher than 10ºC (Usabiaga et al., 2004). The
climate is temperate, oceanic, with moderate winters and warm summers (Usabiaga et
al., 2004). Also, it is wet, with over 1,500 mm of rainfall each year (Usabiaga et al.,
2004), exhibiting a more variable distribution of precipitation than of temperature
(Sáenz et al., 2001a, b). According to Koppen’s classification, the studied region is
associated with a Cfb climate (marine west coast-mild). As aforesaid above, this climate
is also under the influence of large-scale modes of atmospheric circulation (NAO, EA
and SCAND).
Material and Environmental setting
33
The climate in the studied region allows the development of Eurosiberian
vegetation type. The Eurosiberian region is noted for the abundance of deciduous oak
forests (Quercus robur, Q. petraea, Q. ilex), heath communities (Ericaceae and
Calluna) and Ulex. There are also locally birch (Betula pubescens subsp. celtiberica)
and hazel (Corylus avellana) groves, and brooms (Genista) (Alcara Ariza et al., 1987).
The presence of some species, such as Juglans, Castanea, Cerealia, Eucalyptus, Vitis
and pine (P. sylvestris and P. pinaster), reflect human activities (e.g. agriculture,
ruderalization or arboriculture) (Carrion et al., 2010 and references therein).
Pollen as a proxy for paleoclimatic reconstruction
34
4. POLLEN AS A PROXY FOR PALEOCLIMATIC RECONSTRUCTION
Paleoclimatology main target is to describe and understand earth’s climatic
history through as many time scales as possible. Part of this aim can be achieved with
climate proxy indicators enclosed in the deep-sea sediments sequences.
A proxy climate indicator is defined as a local record that is interpreted, using
physical and biophysical principles, to represent some combination of climate-related
variations back in time (IPCC, 2001). A single deep-sea sediment core can encompass
several proxies (e.g. stable isotopes; trace elements; microfossil assemblages, magnetic
and physical properties), that provide a reliable and extensive climatic reconstructions
(Cronin, 1999).
Pollen grains included in sediments are considered the most important tool to
understand vegetation responses to the Holocene climate variability, being therefore
used in the present study in the northern Iberian Peninsula and southwestern France.
4.1 Basic principles of pollen analysis
Palynology is one of the most useful tools in Quaternary paleoenvironmental and
paleoclimatology studies. This branch of science is concerned with the study of pollen
grains (produced by seed plants, angiosperms and gymnosperms) and spores (produced
by pteridophytes, bryophytes, algae and fungi) (Moore et al., 1991). Although
Palynology refers to the study of both groups, these will be referred together as ‘pollen’
for the sake of brevity.
Faegri and Iverson (1989) describe pollen analysis as “a technique for
reconstructing former vegetation by means of the pollen grains it produced”. Since
Palynology embraces the uniformitarian principle, the present is the key to the past, it is
reliable to use the relationship between modern pollen distribution and climate as a
“guide” to understand pollen patterns recorded in the past and make paleoclimatic
reconstructions.
The vegetation reconstruction from fossil pollen spectra are based in the following
general principles of pollen analysis (Birks and Birks, 1980):
Pollen grains are abundantly produced during the natural reproductive cycle of
plants;
Pollen as a proxy for paleoclimatic reconstruction
35
In the atmosphere pollen grains are mixed by atmospheric mechanisms, causing a
uniform pollen rain over a certain area;
Pollen grains are preserved in anaerobic environments (e.g. bogs, marshes, lakes,
fens, ocean floor) and reflect the natural vegetation at the time of pollen deposition.
Consequently, the composition of the pollen rain is a function of the vegetation
composition;
Fossil grains can be extracted from sediments and identification is possible at the
level of genus or family, and may be achievable to species level;
Pollen spectra obtained through a sediment sequence provide a picture of
vegetation variability over time, which can yield information about past climatic
conditions.
4.2 Pollen grain features
Pollen grains and spores differ in their function, however both result from cell
division involving a reduction by half of the chromosomes content (meiosis) and need
to be dispersed in order to carry out their functions (Moore et al., 1991).
Spores are reproductive structures that contain the necessary genetic material for
dispersal and growth of plants. On the other hand, pollen grains are unicellular and
microscopic (15–100 µm) organs that contain the male genetic material of the
angiosperms and gymnosperms; sexual reproductive success is assured only if this
material reaches a female receptacle of the same plant species.
The dispersal of pollen grains to the female reproductive structure – pollination –
can occur in different ways depending on the plant taxa. Although most pollen is either
wind-dispersed (anemophilous) or insect-dispersed (entomophilous) (Faegri and van der
Pijl, 1979), there are others agents of pollination such as water (hidrophily) and
vertebrates (zoophily).
Both types of grains comprehend an outer layer, the exine, made of a mixture of
cellulose and a complex polymer called sporopollenin. Sporopollenin is resistant to
most forms of chemical (including enzymatic) and physical degradation, except
oxidation (Faegri and Iversen, 1989). As a result, pollen may be preserved in anaerobic
environments and strong chemicals can be used to remove other components in
laboratory.
Pollen as a proxy for paleoclimatic reconstruction
36
Sculptural elements are developed in the exine, which is divided into two
sublayers, the inner is the endexine and the outer is the ektexine (Fig. 20) (Faegri, 1956;
Punt et al., 2007). While the ektexine consists of a basal foot layer with projecting
columellae, that may be free distally (intectate) or partially connected by a tectum
(semitectate); the endexine is an unstructured layer (Hesse et al., 2009). The interior
wall that surrounds the cytoplasm, identified as intine, is largely composed of cellulose
and other substances that are easily destroyed and thus hardly fossilized.
Fig. 20. Details of angiosperm pollen wall structure as defined by Faegri (1956) (adapted from
Heusser, 2005).
Pollen grains have different morphology depending on the taxa; therefore they can
be distinguished by their size, shape, apertures, surface sculpture and wall structure. The
surface sculpture, wall structure and apertures are considered the most important
features for pollen identification.
An aperture is a region of the pollen that is thinner than the remainder of the
sporoderm and generally differs in ornamentation and/or in structure (Erdtman, 1947).
There are two types of apertures, the pores (isodiametric apertures) and colpi (elongate
or furrow aperture).
Fig. 21 shows the several groups of pollen according to the number, type and
position of apertures.
Pollen as a proxy for paleoclimatic reconstruction
37
Fig. 21. Groups of pollen according to the number, type and position of apertures (from Moore
et al., 1991). Examples are shown in equatorial view (view of a pollen grain where the
equatorial plane is directed towards the observer) and polar view (the polar axis is directed
towards the observer).
The structure (internal construction of the pollen wall) and ornamentation of the
exine are also extremely important in pollen identification. LO analysis is used to detect
patterns of exine organization with a light microscopy; “L” means lux/light and “O”
means obscuritas/darkness (Erdtman, 1952; Punt et al., 2007). A variation of the focus
allows the understanding of all the sculptural and structural elements of a pollen grain;
at high focus raised exine elements appear bright and at low focus they become dark.
Fig. 22 represents the main sculpture and ornamentations forms that can be found in
Palynology: psilate, verrucate, echinate, striate, reticulate, fossulate, baculate and
clavate.
Pollen as a proxy for paleoclimatic reconstruction
38
Fig. 22. Wall structure and ornamentation of angiosperm pollen (from Heusser, 2005).
4.3 Marine Palynology
The terrestrial pollen records are normally discontinuous, often restricted to
relatively short periods of time and their pollen content generally represent local rather
than an integrated image of the regional vegetation (Groot and Groot, 1966; Manten,
1966; Cooke, 1979). Furthermore, different chronostratigraphic tools are used to date
marine and continental sequences preventing a good and direct correlation between both
environments (Balsam and Heusser, 1976). In contrast, pollen included in marine
sediments provides an integrated image of the regional vegetation of the close continent
over a large span of time (e.g. Manten, 1966; Stanley, 1969; Heusser and Shackleton,
1979; Heusser and van de Geer, 1994) and can be directly correlated with the marine
proxies in the same stratigraphic level of a marine sequence (e.g. Heusser and Balsam,
1977; Turon, 1984; Aksu and Mudie, 1985; Hooghiemstra et al., 1992; 2006; Naughton
et al., 2007a; Combourieu-Nebout et al., 2009).
Therefore, pollen grains preserved in marine sediments is the most important tool
to reconstruct past vegetation and climate in both terrestrial and marine environements
(e.g. Heusser and Balsam, 1977; Turon, 1984; Aksu and Mudie, 1985; Hooghiemstra et
al., 1992; 2006; Naughton et al., 2007a; Combourieu-Nebout et al., 2009).
Pollen as a proxy for paleoclimatic reconstruction
39
There are different kinds of pollen suppliers to the sea depending essentially on
the environmental conditions of each place (e.g. Groot and Groot, 1966; Dupont et al.,
2000; Hooghiemstra et al., 2006). Arid zones with small hydrological systems, like NW
of Africa, evidences for a mainly windy role in the pollen transfer to the marine
environments (e.g. Hooghiemstra et al., 2006). Other zones like Gulf of Guinea (Lézine
and Vergnaud-Grazzini, 1993) and Alboran Sea (Moreno et al., 2002) have shown a
mixture of stream and windy pollen transport. In coastal zones with complex fluvial
systems, pollen grains are principally transported by rivers and streams to the sea (e.g.
Muller 1959; Bottema and Van Straaten, 1966; Heusser and Balsam, 1977; Naughton et
al., 2007a). The southwestern French/Northern Spain margin is affected by north
westerly prevailing winds which impede direct airborne transport of pollen seaward.
This region is also drained by several rivers suggesting that pollen grains are probably
transported to the studied region essentially by rivers (see Chapter 2; section 2.
Environmental Setting, Present-day pollen deposition for more detail).
Once the pollen grains have entered the water column, they are transported and
incorporated in the surface sediments of the ocean floor, behaving similarly to fine
sedimentary particles (Muller, 1959; Chmura and Eisma, 1995). Nevertheless, their
quantity and preservation in marine sequences can be influenced by several factors
related to the marine environment (e.g. marine currents, oxygen content and temperature
of water, sedimentary rate) and to pollen features (primary pollen productions, type of
pollen transporters) (Bottema and Van Straaten, 1966). However, pollen assemblages in
marine cores are usually similar in their general trends to the pollen records of terrestrial
deposits allowing a good correlation between both pollens signatures (Heusser and
Florer, 1973; Naughton et al., 2007a).
Methodology
40
5. METHODOLOGY
5.1 Chronology
Establishing accurate dating is essential for paleoclimatic studies. Without reliable
chronology it is impossible to investigate the climatic response driven by external and
internal forcings; neither is it conceivable to compare our sequences with other marine
and continental records.
Radiocarbon dating is considered the most useful dating method in paleoclimatic
research of the late Quaternary. Radiocarbon (14
C) is produced in the Earth’s
atmosphere by neutron bombardment of atmospheric nitrogen atoms (14
N) and is used
by vegetable and animal life forms; as Libby (1955) mentioned “all living things will be
rendered radioactive by the cosmic radiation". The death of the organisms closes off the
carbon exchange with the atmosphere and starts the 14
C decay “clock".
Considering that the atmospheric 14
C levels have remained constant during the
period useful for 14
C dating (Libby, 1952), the amount of radioactive carbon left in the
sample gives a reproducible indication of how old it is. However, several studies show
that variations in the production of 14
C in the atmosphere occurred over time (e.g. de
Vries, 1958; Linick et al., 1986; Stuiver et al., 1991). These variations can be caused by
several factors, such as: changes in the solar magnetic field (de Vries, 1958, 1959;
Stuiver, 1961; Stuiver and Quay, 1980); variations in solar activity (Goslar et al., 2000)
and carbon cycle changes tied to deep ocean circulation (Edwards et al., 1993; Hughen
et al., 2000). As a result, accurate calibration of conventional radiocarbon ages (yr BP)
to calendar years (cal. yr BP) is indispensable.
Several standard calibration curves are available, based on independently dated
samples such as tree rings, ice-core annual layers, varved sediments, speleothems,
corals and historical records. In the present study it was used the international
calibration curve IntCal09 (NH atmospheric; Reimer et al., 2009) and Marine09 (for
marine dates; Reimer et al., 2009), which can be found in the CALIB Radiocarbon
Calibration software Version 6.0 (http://calib.qub.ac.uk).
Radiocarbon dating using an accelerator coupled to a mass spectrometer (AMS
dating) is the most widely used dating technique, allowing the dating of very small
organic samples (e.g. Muller, 1977; Fairbanks et al., 2005). Recent advances AMS and
sample preparation techniques have reduced the sample-size requirements by a factor of
Methodology
41
1000 and decreased the measurement time from weeks to minutes (Fairbanks et al.,
2005).
In the present study, the age-depth model is based on eight accelerator mass
spectrometry (AMS) radiocarbon dates obtained on Turritela communis and other
mollusk shells and in one historically well-dated botanical event (see Chapter 2; section
3. Material and Methods, Chronology).
AMS 14
C ages are calibrated using Calib 6.0 software and the Marine09 dataset
(Marine09.14
C) (Stuiver and Reimer, 1993; Hughen et al., 2004; Stuiver et al., 2005;
Reimer et al., 2009). This dataset represents the "global" ocean, incorporating a time-
dependent global ocean reservoir correction of about 400 years (Stuiver et al., 2005;
Reimer et al., 2009). To accommodate local effects, the difference ΔR in reservoir age
of the studied region is incorporated (Stuiver et al., 2005). The statistical significance of
results is based on the use of 95.4% (2 sigma) confidence intervals and their relative
areas under the probability curve as well as the median probability of the probability
distribution (Telford et al., 2004), as suggested by Stuiver et al. (2005).
5.2 Pollen analysis procedures
5.2.1 Pollen concentration technique
The sample preparation technique followed the procedure described by de Vernal
et al. (1996) and improved at the UMR CNRS 5805 EPOC (Unité mixte de Recherche
5805, Centre National de la Recherche Scientifique/Environnement et
Paléoenvironnements Océaniques), (Desprat, 2005; (http://www.epoc.u-
bordeaux.fr/index.php?lang=fr&page=eq_paleo_pollens):
1. 4 to 5 cm3 sediment samples were washed through sieves to recover the fraction
inferior to 150 μm. The sediment of the recovered fraction was separated from the
supernatant by decantation during 48 hours.
2. The residue was transferred into a polypropylene centrifuge tube and balanced with
distilled water. After centrifugation (7 min at 2500 r.p.m), exotic pollen tablets
(Lycopodium) were added to each sample. The purpose of this step is to add a known
number of exotic marker pollen grains to a known volume of sample, allowing the
determination of pollen concentrations. The target is to add about as much exotic
Methodology
42
pollen as there is fossil pollen, to minimize counting effort and maximize precision
of results (Maher, 1981).
3. To remove carbonates, treatment with cold hydrochloric acid (HCl) was carried out
successively; first with 10% HCl, then with 25% HCl until complete cessation of
effervescence and at last with 50% HCl.
4. To avoid pollen being obscure when mounted, it was essential to remove silica and
silicates (Moore et al., 1991). Hence, two attacks of cold hydrofluoric acid (HF) were
performed, first with 25% HF for 2.5 hours and the second with 70% HF for 36
hours.
5. Two further successive attacks with 25% cold HCl were used to eliminate colloidal
silica and silicofluorides formed during the treatment with HF.
6. The residue was washed with distilled water and then filtered through a sieve of 10
nylon mesh screens to recover the fraction between 10 and 150 μm (Heusser and
Stock, 1984).
7. The final residue was mounted unstained in glycerol. This method has the advantage
of being optically suitable, allowing the three-dimensional pollen grains to be rotated
below the coverslip by applying a gentle pressure (Moore et al., 1991).
5.2.2 Pollen identification and counting
Pollen were observed and counted on a light Nikon microscope at x 500 (oil
immersion) magnification, accompanied by the use of x1000 magnification (oil
immersion) for confirmation/identification of critical grains. The slides were scanned
along parallel equidistant lines and identifications were achieved based in
morphological characters and comparison with specialist atlases (for example Reille,
(1992) and (Moore et al.) (1991)).
Pollen grains and spores were identified to the most precise taxonomic category
possible given preservation and morphology. Pollen taxa includes family, genus and
species, whereas pollen type (referred by suffix ‘-type’) is a pollen morphological
category, subsidiary to a pollen class and including pollen grains which can be
recognized by distinctive characters (Punt, 1971). Into consideration that pollen grains
are easily damage during the fossilization and laboratorial treatments, pollen grains that
were hidden, crumpled, corroded and broken were include in the indeterminate group.
Methodology
43
A minimum of 200 pollen grains (excluding Pinus, aquatic plants, spores,
indeterminate and unknown pollen grains), 100 Lycopodium grains and 20 pollen types
were counted in the 83 samples analyzed. This method was performed to provide a
representation of the total population in the original sample and ensure statistically
reliable pollen spectra (McAndrew and King, 1976; Maher, 1981; Rull, 1987).
5.2.3 Pollen percentage and concentration
The relative frequencies (pollens percentage) of different pollen types were
calculated as follows:
% pollen type “Y” = nº of pollen type “Y” counted ×100
main sum
Results were expressed as percentages of main sum, which excludes aquatic
plants, spores, indeterminate and unknown pollens. For the aquatic plants and spores
percentages it was used the total sum including aquatic plants, spores and the grains that
were not identifiable.
In the KS05 10 core, Pinus was excluded from the main sum since it was over-
represented in the pollen assemblage (Heusser and Balsam, 1977; Turon, 1984). Pinus
is a large pollen producer, and because of their particular morphology they can be easily
transported (wind, rivers and ocean currents), which favours their over-representation in
the marine records (Heusser and Balsam, 1977; Turon, 1984). The percentages of pine
were calculated by using the total sum.
The pollen concentration values were determined as follows:
Concentration= nº of tablets added × nº of exotics per tablet × nº of exotics counted
(Grains/cm3) nº of exotics counted × volume of sediment in cm
3
5.2.4 Pollen diagrams
Pollen data is typically displayed graphically through a vertical sequence of
samples in a form of a pollen diagram. This diagram is composed of pollen spectra,
expressed as relative frequencies or concentrations of the different taxa, from each level
sampled.
Methodology
44
The pollen diagram is divided into pollen zones with the aim of obtain a
homogeneous assemblage of pollen types (Moore et al., 1991). According to Pons and
Reille (1986) the pollen zones can be established using qualitative fluctuations with a
minimum of two curves of ecologically important taxa. However, the definition of what
constitutes a zone is a subjective concept that depends of the researcher and the purpose
of the study (Tzedakis, 1994).
The pollen data can be interpreted with detailed and/or in terms of synthetic
pollen diagrams based in the relative frequencies or concentrations. A detailed pollen
diagram includes all taxa and a synthetic pollen diagram is constructed after the
ecological arrangement of the taxa presented in detailed pollen diagrams (Suc, 1984). In
the present study the pollen data are presented in synthetic diagrams which contain the
most representative pollen taxa.
Conventionally, the pollen diagram is also arranged into groups of taxa, with
arboreal types followed by non-arboreal pollen types, although the precise arrangement
within any group differs subtly among the scientists (Moore et al., 1991). The pollen
taxa identified in the KS05 10 pollen record of this thesis were grouped as follows:
Temperate and humid trees and shrubs: Pinus, Acer, Ilex, Hedera, Alnus, Betula,
Carpinus betulus, Corylus, Buxus, Cupressaceae, Hippophae, Castanea, Vitis, Fagus,
deciduous Quercus-type, Juglans, Fraxinus excelsior-type, Salix, Tilia, Ulmus,
Daphne.
Pioneer trees: Betula,Cupressaceae and Hippophae.
Mediterranean plants: Pistacia, Cistus, evergreen Quercus-type, Olea, Fraxinus
ornus-type.
Semi-desert plants: Ephedra fragilis-type, Artemisia, and Chenopodiaceae.
Ubiquist plants: Apiaceae, Taraxacum-type, Aster-type, Anthemis-type, Centaurea
cyanus-type, Centaurea nigra-type, Centaurea scabiosa-type, Boraginaceae,
Brassicaceae, Campanulaceae, Caryophyllaceae, Crassulaceae, Cyperaceae,
Scabiosa-type, Ericaceae, Calluna, Euphorbia-type, Mercurialis-type, Fabaceae,
Ulex-type, Gentianaceae, Geranium, Erodium, Mentha-type, Liliaceae-type,
Asphodelus, Cerealia-type, Plantago, Plumbaginaceae, Poaceae, Polygonum
aviculare-type, Rumex-type, Ranunculaceae, Thalictrum, Rosaceae, Filipendula,
Sanguisorba minor, Sanguisorba officinalis, Galium-type, Urticaceae and
Valerianaceae.
Anthropogenic: Cerealia-type, Castanea, Juglans and Vitis.
Aquatic plants: Myriophylllum verticillatum-type.
Methodology
45
Spores: Isoetes, Polypodium vulgare-type, Monolete psilate, Monolete ornamented,
Botrychium-type, Cryptogramma, Osmunda, Pilularia globulifera, Trilete
ornamented and Trilete psilate.
Pollen data can now be easily displayed using one of various computer programs,
including Tilia (Grimm, 1993), Psimpoll (Bennett, 2000), and Polpal (Walanus and
Nalepka, 1997). The pollen diagrams developed in this thesis were constructed using
the Psimpoll program (Bennett, 2000).
Images of the pollen grains presented in KS05 10 synthetic pollen diagram are
available in Appendix 1.
References
46
6. REFERENCES
Abrantes, F., Lebreiro, S., Rodrigues, T., Gil, I., Bartels-Jonsdottir, H., Oliveira, P.,
Kissel, C. and J. G. O., 2005. Shallow-Marine sediment cores record climate
variability and earthquake activity off Lisbon (Portugal) for the last 2000 years,
Quaternary Science Reviews, 24, 2477-2494.
Abrantes, F., Rodrigues, T., Montanari, B., Santos, C., Witt, L., Lopes, C. and
Voelker, A.H.L., 2011. Climate of the last millennium at the southern pole of the
North Atlantic Oscillation: an inner-shelf sediment record of flooding and
upwelling. Climate Research 48: 261-280.
Aksu, A.E. and Mudie, P.J., 1985. Late Quaternary stratigraphy and paleoecology of
northwest Labrador Sea. Marine Micropaleontology, 9, 537– 557.
Alcara Ariza, F., Asensi Marfil, A., de Bolos y Capdevilla, O., Costa Tales, M., Arco
Aguilar, M., Diaz Gonzales, T.E., Diez Garretas, B., Fernandez Prieto, J.A.,
Fernandez Gonzales, F., Izco Sevillando, J., Loidi Arregui, J., Martinez Parras, J.M.,
Navarro Andres, F., Ninot I Sugranes, J.M., Peinado Lorca, M., Rivas Martinez, S.,
Sanchez Mata, D., Valle Guitierrez, C., Vigo I Bonada, J. and Wildpret de la Torre,
W., 1987. La vegetacion de Espana. Collection Aula Abierta. Universidad de Alcala
de Henares, 544 pp.
Alley, R.B. and Agustsdottir, A.M., 2005. The 8 k event: cause and consequences of a
major Holocene abrupt climate change. Quaternary Science Reviews, 24, 1123–
1149.
Alley, R.B., Mayewski, P.A., Sowers, T., Stuiver, M., Taylor, K.C. and Clark, P.U.,
1997. Holocene climatic instability: a prominent, widespread event 8200 yr ago.
Geology, 25, 483-486.
Álvarez, M.C., Flores, J.A., Sierro, F.J., Diz, P., Francés, G., Pelejero, C., Grimalt.,
2005. Millennial surface water dynamics in the Ría de Vigo during the last 3000
years as revealed by coccoliths and molecular biomarkers. Palaeogeogr
Palaeoclimatol Palaeoecol 218: 1– 13.
Andersen, A., Koc, N., Jennings, A., and Andrews, J.T., 2004. Nonuniform response
of the major surface currents in the Nordic Seas to Insolation forcing: implications
for the Holocene climate variability. Paleoceanography, 19, 2003, DOI:
10.1029/2002PA000873.
Andrade, A., Rubio, B., Rey, D., Alvarez-Iglesias, P., Bernabeu, A.M., and Vilas, F.,
2011. Palaeoclimatic changes in the NW Iberian Peninsula during the last 3000
years inferred from diagenetic proxies in the Ria de Muros sedimentary record.
Climate Research 48: 247-259.
Andrews, J. T. and Giraudeau, J., 2002. Multi-proxy records showing Holocene
oceanographic variability: the inner N. Iceland Shelf (Hunafloi). Quaternary Science
Reviews, 22, 175-193.
Andrews, J.T., Jennings, A.E., Moros, M., Hillaire-Marcel, C., Eberl, D., 2006. Is
there a pervasive Holocene ice-rafted debris (IRD) signal in the northern North
Atlantic? The answer appears to be either no, or it depends on the proxy! PAGES
Newsletter, 14, 7–9.
References
47
Archer, D., Winguth, A., Lea, D. and Mahowald, N., 2000. What caused the
glacial/interglacial atmospheric pCO(2) cycles? Reviews of Geophysics, 38(2), 159-
189.
Baas, J.H., Nienert, J., Abrantes, F. and Prins, M. A., 1997. Late Quaternary
sedimentation on the Portuguese continental margin: climate-related processes and
products. Paleo, 130, 1-23.
Balsam, W.L. and Heusser, L.E., 1976. Direct correlation of sea surface
paleotemperatures, deep circulation, and terrestrial paleoclimates: foraminiferal and
palynological evidences from two cores off Chesapeake Bay. Mar. Geol. 21, 121–
147.
Barber, D.C., Dyke, A., Hillaire-Marcel, C., Jennings, A.E., Andrews, J.T., Kerwin,
M.W., Bilodeau, G., McNeely, R., Southon, J., Morehead, M.D. and Gagnon, J.-M.,
1999. Forcing of the cold event of 8,200 years ago by catastrophic drainage of
Laurentide lakes. Nature, 400, 344-348.
Bard, E., Rostek, F., Turon, J.L., and Gendreau, S., 2000. Hydrological Impact of
Heinrich Events in the Subtropical Northeast Atlantic. Science, 289, 1321–1324.
Barnston, A.G. and Livezey, R. E., 1987. Classification, Seasonality and Persistence
of Low-Frequency Atmospheric Circulation Patterns, Mon. Wea. Rev. 115, 1083-
1127.
Barnston, A.G., and. Livezey, R.E, 1987. Classification, seasonality and persistence of
low-frequency atmospheric circulation patterns. Mon. Wea. Rev, 115, 1083-1126.
Beer J. and van Geel B., 2008. Holocene climate change and the evidence for solar
and other forcings. In: R.W. Battarbee and H.A. Binney (eds.) Natural Climate
Variability and Global Warming: a Holocene Perspective. Wiley-Blackwell,
Chichester, 254-268.
Bennett, K. D., 2000. Psimpoll and pscomb: computer programs for data plotting and
analysis. Uppsala, Sweden: Quaternary Geology, Earth Sciences, Uppsala
University. Software available on the internet at http://www.kv.geo.uu.se.
Berger, A. and Loutre, M. F., 1992. Astronomical solutions for paleoclimate studies
over the last 3 million years. Earth and Planetary Science Letters, 111, 369-382.
Berger, A. and Loutre, M.F., 2004. Theorie astronomique des paleoclimats. Comptes
Rendus Geoscience, 336, 701-709.
Berger, A., 1978. Long-term variations of daily insolation and Quaternary climatic
changes. Journal of Atmospheric Science, 35(12), 2362-2367.
Berger, A., 2001. Where astronomy meets geology: from Ice Ages to global warming.
Retrieved 04 February 2012 from
http://www.igpp.ucla.edu/colloquia/lectures/berger/.
Berger, W. H., Schulz, M. and Wefer, G., 2010. Quaternary Oceans and Climate
Change: Lessons for the Future? International Journal of Earth Sciences, 99 (Suppl.
1), 171-189.
Bianchi, G.G. and McCave. I.N., 1999. Holocene periodicity in North Atlantic climate
and deep-ocean flow South of Iceland. Nature, 397, 515–517.
Birks, H.J.B. and Birks, H.H., 1980. Quaternary Palaeoecology. Book Edward Arnold,
London, pp. 289.
References
48
Birks, H.J.B. and Gordon A.D., 1985. Numerical Methods in Quaternary Pollen
Analysis. Academic Press, London, 317 pp.
Bond, G., Broecker, W., Johnsen, S., McManus, J., Labeyrie, L., Jouzel, J. and
Bonani, G., 1993. Correlations between climate records from North Atlantic
sediments and Greenland Ice. Nature, 365, 143.
Bond, G., Kromer, B., Beer, J., Muscheler, R., Evans, M., Showers, W., Hoffmann, S.,
Lotti-Bond, R., Hajdas, I. and Bonani, G., 2001. Persistant solar influence on North
Atlantic climate during the Holocene. Science, 294, 2130-2136.
Bond, G., Showers, W., Cheseby, M., Lotti, R., Almasi, P., deMenocal, P., Priore, P.,
Cullen, H., Hajdas, I. and Bonani, G.l., 1997. A pervasive millenial-scale cycle in
North Atlantic Holocene and Glacial Climates. Science, 278, 1257-1266.
Bond, G.C., and Lotti, R., 1995. Iceberg Discharges into the North Atlantic on
Millennial Time Scales During the Last Glaciation. Science, 267, 1005-1010.
Bond, G.C., Heinrich, H., Broecker, W.S., Labeyrie, L.D., McManus, J.F., Andrews,
J.T., Huon, S., Jantschik, R., Clasen, S., Simet, C., Tedesco, K., Klas, M., Bonani,
G. and Ivy, S., 1992. Evidence for massive discharges of icebergs into the North
Atlantic Ocean during the last glacial period. Nature, 360, 245-249.
Bottema, S., and van Straaten, L.M.J.U., 1966, Malacology and palynology of two
cores from the Adriatic sea floor. Marine Geology, v. 4, p. 553-564
Braconnot, P., Marti, O., Joussaume, S. and Leclainche, Y., 2000. Ocean feedback in
response to 6 kyr BP insolation. Journal of Climate, 13, 1537–1553.
Braconnot, P., Otto-Bliesner, B., Harrison, S., Joussaume, S., Peterchmitt, J.-Y., Abe-
Ouchi, A., Crucifix, M., Driesschaert, E., Fichefet, T., Hewitt, C.D., Kageyama, M.,
Kitoh, A., Laîné, A., Loutre, M.-F., Marti, O., Merkel, U., Ramstein, G., Valdes, P.,
Weber, S.L., Yu, Y. and Zhao, Y., 2007. Results of PMIP2 coupled simulations of
the Mid-Holocene and Last Glacial Maximum – Part 1: experiments and large-scale
features. Climate of the Past, 3, 261-277.
Bradley, R.S., Hughes, M.K. and Diaz, H.F., 2003. Climate in Medieval time. Science
302, 404-405.
Broecker, W.S., 2000. Abrupt climate change: causal constraints provided by the
paleoclimate record. Earth-Science Reviews, 51, 137-154.
Broecker, W.S., Bond, G. and Klas, M., 1990. A salt oscillator in the glacial Atlantic?
1. The concept. Paleoceanography, 5, 469-477.
Broecker, W.S., Peteet, D., Rind and D., 1985. Does the ocean-atmosphere have more
than one stable mode of operation? Nature 315:21-25
Buchdahl, J., 1999. Global Climate Change Student Information Guide: Mesozoic
Climates. Manchester, United Kingdom: Atmosphere, Climate & Environment
Information Programme.
Büntgen, U., W. Tegel, K. Nicolussi, M.l McCormick, D. Frank, V. Trouet, J. O.
Kaplan, F. Herzig, K.-U. Heussner, H. Wanner, J. Luterbacher, and J. Esper, 2011.
2500 years of European climate variability and human susceptibility. Science, 331,
578–582.
Carrión, J., Fernández, S., González-Sampériz, P., Gil-Romera, G., Badal E., Carrión-
Marco. Y., López-Merino, L., López-Sáez, JA., Fierro, E. and Burjachs, F., 2010.
References
49
Expected trends and surprises in the Lateglacial and Holocene vegetation history of
the Iberian Peninsula and Balearic Islands. Review of Palaeobotany and Palynology,
162, 458–475.
Chapman, M.R., Shackleton, N.J., and Duplessy, J.C., 2000. Sea surface temperature
variability during the last glacial-interglacial cycle: assessing the magnitude and
pattern of climate change in the North Atlantic. Palaeogeography,
Palaeoclimatology, Palaeoecology, 157, 1-25.
Chmura, G.L. and Eisma, D., 1995. A palynological study of surface and suspended
sediment on a tidal flat: implications for pollen transport and deposition in coastal
waters. Marine Geology, 128, 183–200.
Clark, P.U., Archer, D., Pollard, D., Blum, J.D., Riale, J.A., Brovkin, V., Mix, A.C.,
Pisias, N.G., and Roy, M., 2006. The middle Pleistocene transition: characteristics,
mechanisms, and implications for long-term changes in atmospheric pCO2:
Quaternary Science Reviews, 25, pp 3150–3184
Clark, P.U., Marshall, S.J., Clarke, G.K.C., Hostetler, S.W., Licciardi, J.M. and Teller,
J.T., 2001. Freshwater forcing of abrupt climate change during the last glaciation.
Science, 293, 283-287.
Clarke, G.K.C., Leverington, D.W., Teller, J.T. and Dyke, A.S., 2004. Paleohydraulics
of the last outburst flood from glacial Lake Agassiz and the 8200 BP cold event.
Quaternary Science Reviews, 23, 389-407.
Combourieu Nebout, N., Peyron, O., Dormoy, I., Desprat, S., Beaudouin, C., Kotthoff,
U. and Marret, F., 2009. Rapid climatic variability in the west Mediterranean during
the last 25,000 years from high resolution pollen data. Climate of the past, 5, 503-
521.
Cooke, H.B.S., 1979. Age control of Quaternary sedimentary/climatic record from
deep boreholes in the Great Hungarian Plain. In Mahaney, W.C. (Ed.) Quaternary
Paleoclimate. University of East Anglia, Geo Books, pp. 1–12.
Cortijo, E., Labeyrie, L., Vidal, L., Vautravers, M., Chapman, M., Duplessy, J.C.,
Elliot, M., Arnold, M., Turon, J. L and Auffret, G., 1997. Changes in sea surface
hydrology associated with Heinrich event 4 in the North Atlantic Ocean between
40°N and 60°N. Earth and Planetary Science Letters, 146, 29-45.
Cronin, Thomas M., 1999. Principles of Climatology. New York: Columbia
University Press. p. 204.
Crucifix, M., Loutre, M.F., Tulkens, P., Fichefet, T. and Berger, A., 2002. Climate
evolution during the Holocene: A study with an Earth system model of intermediate
complexity. Climate Dynamics 19, 43-60.
Cubasch, U., Meehl, G.A., Boer, G.J., Stouffer, R.J., Dix, M., Noda, A., Senior, C.A.,
Raper, S.C.B.and Yap, K.S., 2001. Projections of future climate change. In: Climate
Change 2001: The Scientific Basis: Contribution of Working Group I to the Third
Assessment Report of the Intergovernmental Panel on Climate Change (J.T.
Houghton, Y. Ding, D.J. Griggs, M. Noguer, P.J. Van der Linden, X. Dai, K.
Maskell and C.A. Johnson (Eds.), pp.526-582 Cambridge University Press
(Cambridge, New York).
References
50
Dahl-Jensen, D., Monsegaard, K., Gundestrup, N., Clow, G.D., Johnsen, S.J., Hansen,
A.W. and Balling, N., 1998. Past temperatures directly from the Greenland ice
sheet. Science, 282, 268–271.
Dansgaard, W., Johnsen, S.J., Clausen, H.B., Dahl-Jensen, D., Gundestrup, N.S.,
Hammer, C.U., Hvidberg, C.S., Steffensen, J.P., Sveinbjornsdottir, A.E., Jouzel, J.
and Bond, G., 1993. Evidence for general instability of past climate from a 250-kyr
ice-core record. Nature, 364(6434), 218-220.
Davis, B.A.S., Brewer, S., Stevenson, A.C., Guiot J. and Data Contributors, 2003. The
temperature of Europe during the Holocene reconstructed from pollen data.
Quaternary Science Reviews, 22, 1701-1716.
de Abreu, L., Shackleton, N. J., Schoenfeld, J., Hall, M., and Chapman, M., 2003.
Millennial-scale oceanic climate variability off the Western Iberian margin during
the last two glacial periods, Marine Geology, 196, 1–20.
de Vernal, A., Henry, M. and Bilodeau, G., 1996. Techniques de preparation et
d’analyse en micropaléontologie. In Les cahiers du GEOTOP 3. Département des
Sciences de la terre. Québec University, 16–27. Retrieved 20 January 2012 from
http://www.geotop.uqam.ca/index.php?option=com_docman&task=cat_view&gid=
56&Itemid=98.
de Vernal, A., Hillaire-Marcel, C. and Darby, D.A., 2005, Variability of sea-ice cover
in the Chukchi Sea (western Arctic Ocean) during the Holocene. Paleoceanography
20, 4018, DOI: 10.1029/2005PA001157.
de Vries, H., 1959. Measurement and use of natural radiocarbon. In: Abelson, P.H.
(Ed.), Researches in Geochemistry. Wiley, New York, pp. 169–189.
de Vries, H.L., 1958. Variation in concentration of radiocarbon with time and location
on Earth. Proceedings Koninklijke Nederlandse. Akademie van Wetenschappen,
Series B 61 (2), 94–102.
Debret, M., Bout-Roumazeilles, V., Grousset, F., Desmet, M., McManus, J.F., Massei,
N., Sebag, D., Petit, J.-R., Copard, Y., Trentesaux, A., 2007. The origin of the 1500-
year climate cycles in Holocene North-Atlantic records. Climate of the Past, 3, 569-
575.
Delworth, T.L. and Dixon, K.W., 2006. Have anthropogenic aerosols delayed a
greenhouse gas-induced weakening of the North Atlantic thermohaline circulation?
Geophysics Research Letters, 33, L02606, doi:10.1029/2005GL024980.
Denton, G.H. and Karlén, W., 1973. Holocene climatic variations: their pattern and
possible cause. Quaternary Research, 3, 155– 205.
Denton, G.H., Alley, R.B., Comer, G.C. and Broecker, W.S., 2005. The role of
seasonality in abrupt climate change. Quaternary Science Reviews, 24, 1159-1182.
Desprat, S., 2005. Réponses climatiques marines et continentales du Sud-Ouest de
l’Europe lors des derniers interglaciaires et des entrées en glaciations. PhD Thesis,
Bordeaux University, 282 pp.
Desprat, S., Sánchez-Goñi, M.F. and Loutre, M.F., 2003. Revealing climatic
variability of the last three millennia in northwestern Iberia using pollen influx data.
Earth and Planetary Science Letters, 213, 63-78.
References
51
Díaz, H.F., Trigo, R.M., Hughes, M.K., Mann, M.E., Xoplaki, E. and Barriopedro, D.,
2011. Spatial and temporal characteristics of climate in Medieval times revisited.
Bulletin of the American Meteorological Society, 92, 1487-1500, doi:
10.1175/BAMS-D-10-05003.1
Diz, P., Francés, G., Pelejero, C., Grimalt, J.O. and Vilas, F., 2002. The last 3000
years in the Ría de Vigo (NW Iberian Margin): climatic and hydrographic signals.
The Holocene, 12, 459-468.
Duplessy, J.C., Ivanova, E., Murdmaa, I., Paterne, M. and Labeyrie, L., 2001.
Holocene paleoceanography of the northern Barents Sea and variations of the
northward heat transport by the Atlantic Ocean. Boreas, 30, 2– 16.
Dupont, L., Jahns, S., Marret, F. and Ning, S., 2000. Vegetation change in equatorial
West Africa: time-slices for the last 150 ka Palaeogeogr. Palaeoclimatol. Palaeoecol.
155 (1-2), 95-122.
Edwards, R.L., Beck, J.W., Burr, G.S., Donahue, D.J., Chappell, J.M.A., Bloom, A.L.,
Druffel, E.R.M. and Taylor, F.W., 1993. A large drop in atmospheric 14C/12C and
reduced melting in the Younger Dryas, documented with 230
Th ages of corals.
Science, 260, 962–968.
Eiríksson J, Bartels-Jónsdóttir HB, Cage AG, Gudmundsdóttir ER, Klitgaard-
Kristensen D, Marret F, Rodrigues T, Abrantes F, Austin WEN, Jiang H, Knudsen
KL, Sejrup H-P., 2006. Variability of the North Atlantic Current during the last
2000 years based on shelf bottom water and sea surface temperatures along an open
ocean/shallow marine transect in western Europe. The Holocene 16(7):1017–29.
Elliot, M., Labeyrie, L., Bond, G., Cortijo, E., Turon, J-L., Tisnerat, N. and Duplessy,
J.C., 1998. Millenial-scale iceberg discharges in the Irminger Basin during the last
glacial period: Relationship with the Heinrich events and environmental settings.
Paleoceanography, 13, 433-446.
Ellison, C.R.W., Chapman, M.R. and Hall, I.R., 2006. Surface and deep ocean
interactions during the cold climate event 8200 years ago. Science, 312, 1929–1932.
Erdtman, G., 1947. Suggestions for the classification of fossil and recent pollen grains
and spores. Svensk Bot. Tidskr., 41, 104-114.
Erdtman, G., 1952. Pollen Morphology and Plant Taxonomy. Angiosperms. Almqvist
and Wiksell, Stockholm, 539 pp.
Faegri, K. and Iverson, J., 1989. Textbook of pollen analysis, John Wiley & Sons,
Chichester.
Faegri, K. and L. van der Pijl, 1979. The Principles of Pollination Ecology (3rd ed.).
Pergamon, Oxford, 244 pp.
Faegri, K., 1956. Recent trends in palynology. Bot. Rev., 22, 639-664.
Fagan, B.M., 2000. The Little Age: how climate made history, 1300-1850. Amazon.
Fairbanks, R.G., Mortlock, R.A., Chiu, T.C., Cao, L., Kaplan, A., Guilderson, T.P.,
Fairbanks, T.W., Bloom, A.L., Grootes, P.M. and Nadeau, M.J., 2005. Radiocarbon
Calibration Curve Spanning 0 to 50,000 Years B.P. Based on Paired 230
Th/234
U/238
U
and 14
C Dates on Pristine Corals. Quaternary Science Reviews, 24, 1781-1796.
References
52
Fawcett, P.J., Agustsdottir, A.M., Alley, R.B. and Shuman, C.A., 1997. The Younger
Dryas termination and North Atlantic deepwater formation: insights from climate
model simulations and Greenland ice core data. Paleoceanography, 12, 23-28.
Fleitmann, D., Burns, S.J., Mangini, A., Mudelsee, M., Kramers, J., Villa, I., Neff, U.,
Al-Subbary, A.A., Annett, Buettner, A., Hippler, D. and Matter, A., 2007. Holocene
ITCZ and Indian monsoon dynamics recorded in stalagmites from Oman and
Yemen (Socotra). Quaternary Science Reviews, 26, 170-188.
Flesche-Kleiven, H., Kissel, C., Laj, C., Ninnemann, U.S., Richter, T.O. and Cortijo,
E., 2008. Reduced NADeep Water Coeval with the Glacial Lake Agassiz Freshwater
Outburst. Science, 319, 60-64
Fluckiger, J., Knutti, R. and White, J.W.C., 2006. Oceanic processes as potential
trigger and amplifying mechanisms for Heinrich events. Paleoceanography, 21,
PA2014, doi:10.1029/2005PA001204
Fronval, T., Jansen, E., Bloemendal, J. and Johnsen, S., 1995. Oceanic evidence for
coherent fluctuations in Fennoscandian and Laurentide ice sheets on millennium
timescales. Nature, 374, 443-446.
Ganopolski, A., and Rahmstorf, S., 2001. Rapid changes of glacial climate simulated
in a coupled climate model. Nature, 409, 153-158.
García-Amorena, I., Gómez Manzaneque, F., Rubiales, J.M., Granja, H.M., Soares de
Carvalho, G., Morla, C., 2007. The Late Quaternary coastal forests of western
Iberia; a study of their macroremains. Palaeogeography, Palaeoclimatology,
Palaeoecology, 254, 448–461.
García-Amorena, I., Morla, C., Rubiales, J.M., Gómez Manzaneque, F., 2008.
Taxonomic composition of the Holocene forests of the northern coast of Spain, as
determined from their macroremains. The Holocene, 18, 819–829.
García-Antón, M., Gil Romera, G., Pagés, J.L., Alonso Millán, A., 2006. The
Holocene pollen record in the Villaviciosa Estuary (Asturias, North of Spain) in
relation to changes in sea level. Palaeogeography, Palaeoclimatology,
Palaeoecology, 237, 280–292.
González-Pola, C., Lavin, A., and Vargas-Yanez, M., 2005. Intense warming and
salinity modification of intermediate water masses in the southeastern corner of the
Bay of Biscay for the period 1992-2003. Journal of Geophysics Research, 110,
C05020, doi:10.1029/2004JC002367.
Goodess, C.M., Palutikof, J.P. and Davies, T.D., 1992. The nature and causes of
climate change. Belhaven Press, London. 248pp.
Gordon, A.D. and Birks H.J.B., 1972. Numerical methods in Quaternary
palaeoecology. I. Zonation of pollen diagrams. New Phytology, 71, 961–979.
Goslar, T., Arnold, M., Tisnerat-Laborde, N., Czernik, J. and Wieckowski, K., 2000.
Variations of Younger Dryas atmospheric radiocarbon explicable without ocean
circulation changes. Nature, 403, 877–880.
Grimm, E. C., 1993. TILIA 2.0. (Software). Springfield, Illinois, USA: Illinois State
Museum.
Groot, J.J and Groot, C.R., 1966. Marine Palinology: possibilities, limitations,
problems. Marine Geology, 4(6), 387-395.
References
53
Grousset, F.E., Labeyrie, L., Sinko, J.A., Cremer, M., Bond, G., Duprat, J., Cortijo, E.
and Huon S., 1993. Patterns of ice-rafted detritus in the glacial North Atlantic (40-
55°N). Paleoceanography, 8, 175-192.
Grove, J., 2004. Little Ice Ages: Ancient and Modern. Routledge, New York.
Head, M.J. and Gibbard, P.L. (Eds.), 2005. Early–Middle Pleistocene transitions: the
land–ocean evidence: Geological Society of London Special Publication, 247, p.
326.
Heinrich, H., 1988. Origin and consequences of cyclic ice rafting in the north east
Atlantic ocean during the past 130,000 years. Quaternary Research, 29, 142-152.
Hemming, S.R., 2004. Heinrich events: massive late Pleistocene detritus layers of the
north Atlantic and their global climate imprint. Review of Geophysics, 42, RG1005,
doi: 10.1029/2003RG000128.
Hesse, M., Halbritte, H., Zetter, R., Weber, M., Buchner, R., Frosch-Radivo, A. and
Ulrich, S., 2009. Pollen Terminology. An illustrated handbook. Springer, Wien. 264
p.
Heusser, C. J., Florer, L. E., 1973. Correlation of marine and continental quaternary
pollen records from the Northeast Pacific and Western Washington. Quaternary
Research 3 ,661-670.
Heusser, L.E. and Balsam, W.L., 1977. Pollen distribution in the northeast Pacific
Ocean. Quaternary Research, 7, 45–62.
Heusser, L.E. and Shackleton, N., 1979. Direct marine-continental correlation: 150
000 year oxygen isotope-pollen record from the North Pacific. Science, 204, 837–
839.
Heusser, L.E. and Stock, C.E., 1984. Preparation techniques for concentrating pollen
from marine sediments and other sediments with low pollen density. Palynology, 8,
225-227.
Heusser, L.E. and van de Geer, G., 1994. Direct correlation of terrestrial and marine
paleoclimatic records from four glacial–interglacial cycles – DSDP Site 594
southwest Pacific. Quaternary Science Reviews, 13, 273–282.
Heusser, L.E., 2005. Spores and pollen in the marine realm. In: Armstrong, H.A. and
Brasier, M.D., Microfossils, 2nd ed., Blackwell Publishing, Malden, 296 p.
Hooghiemstra, H., Lézine, A.M., Leroy, S., Dupont, L. and Marret, F., 2006. Late
Quaternary palynology in marine sediments: a synthesis of the understanding of
pollen distribution patterns in the NWAfrican setting. Quat. Intern., 148, 29–44.
Hooghiemstra, H., Stalling, H., Agwu, C.O.C., and Dupont, L.M., 1992. Vegetational
and climatic changes at the northern fringe of the Sahara 250 000–5000 years BP:
evidence from 4 marine pollen records located between Portugal and the Canary
Islands. Rev. Palaeobotany and Palynology, 74, 1–53.
Hughen, K.A., Baillie, M.G.L., Bard, E., Bayliss, A., Beck, J.W., Bertrand, C.,
Blackwell, P.G., Buck, C.E., Burr, G., Cutler, K.B., Damon, P.E., Edwards, R.L.,
Fairbanks, R.G., Friedrich, M., Guilderson, T.P., Kromer, B., McCormac, F.G.,
Manning, S., Bronk Ramsey, C., Reimer, P.J., Reimer, R.W., Remmele, S.,
Southon, J.R., Stuiver, M., Talamo, S., Taylor, F.W., van der Plicht, J. and
References
54
Weyhenmeyer, C.E., 2004. Marine04 Marine Radiocarbon Age Calibration, 0-26
Cal Kyr BP. Radiocarbon, 46, 1059-1086.
Hughen, K.A., Southon, J.R., Lehman, S.J. and Overpeck, J.T., 2000. Synchronous
radiocarbon and climate shifts during the last deglaciation. Science, 290, 1951-1954.
Hughes, M.K., Diaz, H.F., 1994. Was there a "Medieval Warm Period", and if so,
where and when? Climatic Change, 26, 109-142.
Hurrell, J., Kushnir, Y., Ottersen, G., and Visbeck, M., 2003. An overview of the
North Atlantic Oscillation. In: Hurrel, J., Kushnir, Y., Ottersen, G., and Visbeck, M.
(Eds.), The North Atlantic Oscillation: Climatic Significance and Environmental
Impact. AGU, Washington, pp.1-35.
Hurrell, J.W., 1995. Decadal Trends in the North Atlantic Oscillation: Regional
Temperatures and Precipitation. Science, 269, 676-679.
Hurrell, J.W., Kushnir, Y. and Visbeck, M., 2001. The North Atlantic Oscillation.
Science, 291, 603-604.
Imbrie, J., Boyle, E.A., Clemens, S.C., Duffty, A., Howard, W.R., Kukla, G.,
Kutzbach, J., Martinson, D.G., McIntyre, A., Mix, A.C., Molfino, B., Morley, J.J.,
Peterson, L.C., Pisias, N.G., Prell, W.L., Raymo, M.E., Shackleton, N.J. and
Toggweiler, J.R., 1993. On the Struture and origin of Major Glaciation Cycles 2-
The 100,000 Year Cycle. Paleoceanography, 8(6), 699-735.
Imbrie, J., Boyle, E.A., Clemens, S.C., Duffy, A., Howard, W.R., Kukla, G.,
Kutzbach, J., Martinson, D.G., McIntyre, A., Mix, A.C., Molfino, B., Morley, J.J.,
Peterson, L.C., Pisias, N.G., Prell, W.L., Raymo, M.E., Shackleton, N.J. and
Toggweiler, J.R., 1992. On the structure and origin of major glaciation cycles, 1.
Linear response to Milankovitch forcing. Paleoceanography, 7, 701-738.
IPCC, 2001. Climate Change 2001: The Scientific Basis. Contribution of Working
Group I to the Third Assessment Report of the Intergovernmental Panel on Climate
Change [Houghton, J.T.,Y. Ding, D.J. Griggs, M. Noguer, P.J. van der Linden, X.
Dai, K. Maskell, and C.A. Johnson (eds.)]. Cambridge University Press, Cambridge,
United Kingdom and New York, NY, USA, 881pp.
IPCC, 2007. Climate Change 2007: The Physical Science Basis. Contribution of
Working Group I to the Fourth Assessment Report of the Intergovernmental Panel
on Climate Change. Retrieved 11 Aphril 2012 from http://ipcc-wg1.ucar.edu/.
Martín-Chivelet, J., Muñoz-García, M. B., Edwards, R. L., Turrero, M. J. and Ortega
A.I., 2011. Land surface temperature changes in Northern Iberia since 4000 yr BP,
based on δ13
C of speleothems. Global and Planetary Change.
Ji, J., Shen, J., Balsam, W., Chen, J., Liu, L. and Liu, X., 2005. Asian monsoon
oscillations in the northeastern Qinghai-Tibet Plateau since the late glacial as
interpreted from visible reflectance of Qinghai Lake sediments. Earth and Planetary
Science Letters 233: 61-70.
Johnsen, S., Dahl-Jensen, D., Gundestrup, N., Steffensen, J.P., Clausen, H.B., Miller,
H., Masson-Delmotte, V., Sveinbjornsdottir, A.E. and White, J., 2001. Oxygen
isotope and palaeotemperature records from six Greenland ice-core stations: Camp
Century, Dye-3, GRIP, GISP2, Renland and NorthGRIP. Journal of Quaternary
Science, 16, 299-307.
References
55
Jones, P. D., Jonsson, T. and Wheeler, D., 1997. Extension to the North Atlantic
Oscillation using early instrumental pressure observations from Gibraltar and south-
west Iceland, Int. J. Climatol., 17, 1433–1450.
Jones, P.D., Briffa, K.R., Osborn, T.J., Lough, J.M., van Ommen, T.D., Vinther, B.M.,
Luterbacher, J., Wahl, E.R., Zwiers, F.W., Mann, M.E., Schmidt, G.A., Ammann,
C.M., Buckley, B.M., Cobb, K.M., Esper, J., Goosse, H., Graham, N., Jansen, E.,
Kiefer, T., Kull, C., Küttel, M., Mosley-Thompson, E., Overpeck, J.T., Riedwyl, N.,
Schulz, M., Tudhope, A.W., Villalba, R., Wanner, H., Wolff, E. and Xoplaki, E.,
2009. High-resolution palaeoclimatology of the last millennium: A review of current
status and future prospects. The Holocene, 19: 3–49.
Jones, P.D., Osborn, T.J. and Briffa, K.R., 2001. The evolution of climate over the last
millennium. Science, 292, 662-667.
Kaplan, M.R. and Wolfe, A.P., 2006. Spatial and temporal variability of Holocene
temperature in the North Atlantic region. Quaternary Research, 65, 223–231.
Katayama, H. and Watanabe, Y., 2003. The Huanghe and Changjiang contribution to
seasonal variability in terrigenous particulate load to the Okinawa Trough. Deep-Sea
Research II, 50, 475–485.
Kaufman, D.S., Ager, T.A., Anderson, N.J., Anderson, P.M., Andrews, J.T., Bartlein,
P.J., Brubaker, L.B., Coats, L.L., Cwynar, L.C., Duvall., M.L., Dyke, A.S.,
Edwards, M.E., Eisner, W.R., Gejewski, K., Geirsdottir, A., Hu, F.S., Jennings,
A.E., Kaplan, M.R., Kerwin, M.W., Lozhkin, A.V., MacDonald, G.M., Miller, G.H.,
Mock, C.J., Oswald, W.W., Otto-Bliesner, B.L., Porinchu, D.F., Ruhland, K., Smol,
J.P., Steig, E.J. and Wolfe, B.B., 2004. Holocene thermal maximum in the Western
Arctic (0 to 180W). Quaternary Science Reviews, 23, 529-560.
Kaufman, D.S., Schneider, D.P., McKay, N.P., Ammann, C.M., Bradley, R.S., Briffa
K.R., Miller, G.H., Otto-Bliesner, B.L., Overpeck, J.T., Vinther, B.M., Arctic Lakes
2k Project Members (Abbott, M., Axford, Y., Bird, B., Birks, H.J.B., Bjune, A.E.,
Briner, J., Cook, T., Chipman, M., Francus, P., Gajewski, K., Geirsdóttir, Á., Hu,
F.S., Kutchko, B., Lamoureux, S., Loso, M., MacDonald, G., Peros, M., Porinchu,
D., Schiff, C., Seppä, H. and Thomas, E., 2009. Recent warming reverses long-term
Arctic cooling. Science, 325: 1236–1239.
Keigwin, L.D., and Boyle, E.A., 2000. Detecting Holocene Changes in thermohaline
circulation. PNAS, 97(4), 1345.
Keigwin, L.D., Sachs, J.P., Rosenthal, Y. and Boyle, E.A., 2005. The 8200 year B.P.
event in the slope water system, western subpolar North Atlantic.
Palaeoceanography, 20, 2003, DOI: 10.1029/2004PA00174.
Kim, J.H., Rimbu, N., Lorenz, S.J., Lohmann, G., Nam, S.-I., Schouten, S.,
Ruhlemann, C., Schneider, R.R., 2004. North Pacific and North Atlantic sea-surface
temperature variability during the Holocene. Quaternary Science Reviews 23, 2141-
2154.
Klitgaard-Kristensen, D., Sejrup, H.P., Haflidason, H., Johnsen, S. and Spurk, M.,
1998. A regional 8200 cal. yr BP cooling event in northwest Europe, induced by
final stages of the Laurentide ice-sheet deglaciation? Journal of Quaternary Science,
13, 165-169.
References
56
Knudsen, K.L., Jiang, H., Jansen, E., Eriksson, J., Heinemeier, J. and Seidenkrantz,
M.S., 2004. Environmental changes off North Iceland during the deglaciation and
the Holocene: foraminifera, diatoms and stable isotopes. Marine Micropaleontology,
50, 273–305.
Knutti, R., Fluckiger, J., Stocker, T.F. and Tirmmermann, A., 2004. Strong
hemispheric coupling of glacial climate through freshwater discharge and ocean
circulation. Nature, 430, 851-856.
Kobashi, T., Severinghaus, J.P., Brook, E.J., Barnola, J.M., Grachev, A.M.., 2007.
Precise timing and characterization of abrupt climate change 8200 years ago from
air trapped in polar ice. Quaternary Science Reviews 26, 1212-1222.
Korhola, A., Weckström, J., Holmström, L. and Erästö, P., 2000. A quantitative
Holocene climatic record from diatoms in northern Fennoscandia. Quaternary
Research, 54, 284-294.
Koutsikopoulos, C. and Le Cann, B., 1996. Physical processes and hydrological
structures related to the Bay of Biscay anchovy. Sci. Mar. 60 (Supl. 2), 9–19.
Kutzbach, J.E. and Gallimore, R.G., 1988. Sensitivity of a coupled atmosphere/mixed
layer ocean model to changes in orbital forcing at 9000 years BP. Journal of
Geophysical Research, 93, 803–821.
Lamb, H. H., 1977. Climate History and the Future, vol. 2, Climate: Present, Past and
Future, 835 pp., Methuen, New York.
Laskar, J., Robutel, P., Joutel, F., Gastineau, M., Correia, A. C. M. and Levrard, B.,
2004. A long-term numerical solution for the insolation quantities of the Earth.
Astronomy and Astrophysics, 428, 261-285.
Lebreiro, S.M., Francés, G., Abrantes, F.F.G., Diz, P., Bartels- Jónsdóttir, H.B.,
Stroynowski, Z., Gil, I.M., Pena, L.D., Rodrigues, T., Jones, P.D., Nombela, M.A.,
Alejo, I., Briffa, K.R., Harris, I. and Grimalt, J.O., 2006: Climate change and coastal
hydrographic response along the Atlantic Iberian margin (Tagus Prodelta and Muros
Ría) during the last two millenia. The Holocene, 16, 1003-1015.
Lebreiro, S.M., Moreno, J.C., McCave, I.N. and Weaver, P.P.E., 1996. Evidence for
Heinrich layers off Portugal (Tore Seamount: 39°N, 12°W). Marine Geology, 131,
47-56.
Leuschner, D.C. and Sirocko, F., 2000. The low-latitude monsoon climate during
Dansgaard-Oeschger cycles and Heinrich Events. Quaternary Science Reviews, 19,
243-254.
Levac, E., de Vernal, A. and Blake W. Jr., 2001. Sea-surface conditions in
northernmost Baffin Bay during the Holocene: palynological evidence. Journal of
Quaternary Science, 16, 353-363.
Lézine, A.M. and Vergnaud-Grazzini, C., 1993, Evidence of forest extension in West-
Africa since 22,000 BP. A pollen record from eastern tropical Atlantic: Quaternary
Science Reviews, v. 12, p. 203-210.
Libby, W.F., 1952. Radiocarbon dating. The University of Chicago Press, Chicago,
Illinois, USA 161 pp.
Libby, W.F., 1955. Radiocarbon Dating. Chicago: University of Chicago Press.
References
57
Linick, T.W., Long, A., Damon, P.E. and Ferguson, C.W., 1986. High-Precision
Radiocarbon Dating of Bristlecone Pine from 6554 to 5350 BC. Radiocarbon, 28,
943-953.
Lisiecki, L.E. and Raymo, M.E., 2005. A Pliocene-Pleistocene stack of 57 globally
distributed benthic δ18
O records. Paleoceanography, 20, PA1003, doi:
10.1029/2004PA001071
Liu, X., Z. Liu, J. E. Kutzbach, S. C. Clemens, and W. L. Prell, 2006. Hemispheric
insolation forcing of the Indian Ocean and Asian monsoon: Local versus remote
impacts, J. Clim., 19, 6195– 6208.
Ljungqvist, F.C., 2010. A new reconstruction of temperature variability in the
extratropical Northern Hemisphere during the last two millennia. Geogr. Ann. 92A,
339-351.
Lorenz, S.J., Kim, J.H., Rimbu, N., Schneider, R.R. and Lohmann, G., 2006. Orbitally
driven insolation forcing on Holocene climate trends: evidence from alkenone data
and climate modelling. Paleoceanography, 21, 1002, DOI: 10.1029/2005PA001152.
Loutre, M. F. and Berger, A., 2003. Marine Isotope Stage 11 as an analogue for the
present interglacial. Global and planetary change, 762, 1-9.
Magny, M., 2004. Holocene climate variability as reflected by mid-European lake
level fluctuations, and its probable impact on prehistoric human settlements.
Quaternary International, 113, 65-79.
Magny, M., Begeot, C., Guiot, J. and Peyron, O., 2003. Contrasting patterns of
hydrological changes in Europe in response to Holocene climate cooling phases.
Quaternary Science Reviews, 22, 1589–1596.
Maher, L.J. Jr., 1981. Statistics for microfossil concentration measurements employing
samples spiked with marker grains. Review of Palaeobotany and Palynology, 32,
153-191.
Mann, M.E., Zhang, Z., Hughes, M.K., Bradley, R.S., Miller, S.K., Rutherford, S. and
Ni, F., 2008. Proxy-based reconstructions of hemispheric and global surface
temperature variations over the past two millennia. Proceedings of the National
Academy of Sciences, USA, 105: 13252–13257.
Mann, M.E., Zhang, Z., Rutherford, S., Bradley, R.S., Hughes, M.K., Shindell, D.,
Ammann, C., Falugevi, G. and Ni, F., 2009. Global Signatures and Dynamical
Origins of the “Little Ice Age” and “Medieval Climate Anomaly. Science, 326,
1256-1260.
Manten, A.A., 1966. Marine palynology in progress. Marine Geology, 4. 385-386.
Marchal, O., Cacho, I., Stocker, T.F., Grimalt, J.O., Calvo, E., Martrat, B., Shackleton,
N., Vautravers, M., Cortijo, E., van Kreveld, S., Andersson, C., Koc, N., Chapman,
M., Sbaffi, L., Duplessy, J.-C., Sarnthein, M., Turon, J.-L., Duprat, J., and Jansen,
E., 2002. Apparent long-term cooling of the sea surface in the northeast Atlantic and
Mediterranean during the Holocene. Quaternary Science Reviews, 21, 455-483.
Marchal, O., Stocker, T.F., Joos, F., Indermühle, A., Blunier, T. and Tschumi J., 1999.
Modelling the concentration of atmospheric CO2 during the Younger Dryas climate
event. Climate Dynamics 15, 341–354.
References
58
Martinez-Cortizas, A., Valcarcel, M., Pérez-Alberti, A., Castillo, F., Blanco, R., 1999.
Mercury in a Spanish peat bog: archive of climate change and atmospheric metal
deposition. Science 284, 939–942.
Maslin, M.A., Shackleton, N.J. and Pfaumann, U., 1995. Surface water temperature,
salinity, and density changes in the northeast Atlantic during the last 45,000 years:
Heinrich events, deep water formation, and climatic rebounds. Paleoceanography,
10, 527-544.
Mayewski, P.A., Rohling, E., Stager, C., Karlen, W., Maasch, K., Meeker, L.D.,
Meyerson, E., Gasse, F., van Kreveld, S., Holmgren, K., Lee-Thorp, J., Rosqvist,
G., Rack, F., Staubwasser, M. and Schneider, R., 2004. Holocene climate
variability. Quaternary Research, 62, 243-255.
McAndrew, J.H. and King, J.E., 1976. Pollen of the North American Quaternary: The
top twenty. Geoscience and Man, 15, 41-49.
McDermott, F., Mattey, D., and Hawkesworth, C., 2001. Centennial-Scale Holocene
Climate Variability Revealed by a High-Resolution Speleothem ∂18
O Record from
SW Ireland. Science, 294, 1328-1331.
McManus, J.F., Oppo, D.W. and Cullen, J.L., 1999. A 0.5 million year record of
millennial-scale climate variability in the North Atlantic. Science, 283, 971–975.
Meese, D.A., Gow, A.J., Grootes, P., Mayewskiy, P.A., Ram, M., Stuiver, M., Taylor,
K.C., Waddington, E.D., Zielinski, G.A., 1994. The accumulation record from the
GISP2 core as an indicator of climate change throughout the Holocene. Science,
266, 1680-1682.
Milankovitch, M.M., 1920. Théorie mathématique des phénomènes thermique
produits par la radiation solaire, Gauthier-Villars, Paris.
Moberg, A., Sonechkin, D.M., Holmgren, K., Datsenko, N.M., Wibjorn, K., 2005.
Highly variable Northern Hemisphere temperatures reconstructed from lowand
high-resolution proxy data. Nature 433, 613–617.
Moore P.D., Webb, J.A. and Collinson, M.E., 1991. Pollen analysis. Oxford,
Blackwell scientific publication, 2nd edition, 216 p.
Moreno, A., Cacho, I., Canals, M., Prins, M., Sanchez Goñi, M.F., Grimalt, J.O., and
Weltje, G.J., 2002. Saharan dust transport and high-latitude glacial climate
variability: the Alboran sea record: Quaternary Research, v. 58, p. 318-328.
Moros, M., Emeis, K., Risebrobakken, B., Snowball, I., Kuipers, A., McManus, J. and
Jansen, E., 2004. Sea surface temperatures and ice rafting in the Holocene North
Atlantic: climate influences on northern Europe and Greenland. Quaternary Science
Reviews, 23, 2113-2126.
Mudie, P.J. and McCarthy, F.M.G., 2006. Marine palynology: potentials for onshore–
offshore correlation of Pleistocene–Holocene records. Transactions of the Royal
Society of South Africa, 61, 139–157.
Muller, J., 1959. Palynology of recent Orinoco delta and shelf sediments.
Micropaleontology, 5, 1–32.
Muller, R.A., 1977. Radioisotope dating with a cyclotron. Science, 196, 489-494.
References
59
Muscheler, R., Beer, J. and Vonmoos, M., 2004. Causes and timing of the 8200 yr BP
event inferred from the comparison of the GRIP 10
Be and the tree ring ∆14
C record.
Quaternary Science Reviews, 23, 2101-2111.
Naafs, B.D.A., 2011. Long-term evolution of (millennial-scale) climate variability in
the North Atlantic over the last four million years. PhD thesis at the University of
Bremen, Germany.
Naughton, F., Bourillet, J.F., Sánchez-Goñi, M.F., Turon, J.L. and Jouanneau, J.M.,
2007b. Longterm and millennial-scale climate variability in northwestern France
during the last 8850 years. The Holocene, 17, 939-953.
Naughton, F., Sánchez-Goñi, M.F., Desprat, S., Turon, J.L., Duprat, J., Malaize, B.,
Joli, C., Cortijo, E., Drago, T., and Freitas, M. C., 2007a. Present-day and past (last
25 000 years) marine pollen signal off western Iberia. Marine Micropaleontology,
62, 91–114.
Naughton, F., Sánchez-Goñi, M.F., Kageyama, M., Bard, E., Duprat, J., Cortijo, E.,
Desprat, S., Malaizé, B., Joly, C., Rostek., F., Turon, J.L., 2009. Wet to dry climatic
trend in north-western Iberia within Heinrich events. Earth and Planetary Science
Letters, 284 (3-4), 329-342.
Nesje, A. and Dahl, S.O., 1993. Late glacial and Holocene glacier fluctuations and
climate variations in western Norway: a review. Quaternary Science Reviews, 12,
255–261.
North Atlantic Oscillation Home Page, Retrieved 11 Aphril 2012 from
http://www.ldeo.columbia.edu/NAO.
North Greenland Ice Core Project members, 2004. High resolution record of northern
hemisphere climate extending into the last interglacial period. Nature, 431, 147-151.
O’Brien, S.R., Mayewski, P.A., Meeker, L.D., Meese, D.A., Twickler, M.S. and
Whitlow, S.I., 1995. Complexity of Holocene climate as reconstructed from a
Greenland ice core. Science, 270, 1962– 1964.
Paillard, D., and Labeyriet, L., 1994. Role of the thermohaline circulation in the abrupt
warming after Heinrich events, Nature, 372(6502), 162-164.
Pailler, D., and Bard, E., 2002. High frequency paleoceanographic changes during the
past 140 000 yr recorded by the organic matter insedimentaf the Iberin Margin,
Paleoceanigrphy, paleoclimatology, Palaeoecology, 2799, 1-22.
Patterson, W. P., Dietrich, K. A., Holmden, C., and Andrews, J. T., 2010. Two
millennia of North Atlantic seasonality and implications for norse colonies, P. Natl.
Acad. Sci. USA, 107, 5306–5310, doi:10.1073/pnas.0902522107.
Peixoto, J.P. and Oort, A., 1992. Physics of Climate, American Institute of Physics,
520 pp.
Petit, J.R., Jouzel, J., Raynaud, D., Barkov, N.I., Barnola, J.M., Basile, I., Bender,
M.L., Chappellaz, J., Davis, M., Delaygue, G., Delmotte, M., Kotlyakov, V.M.,
Legrand, M., Lipenkov, V.Y., Lorius, C., Pépin, L., Ritz, C., Satzman, E. and
Stievenard, M., 1999. Climate and atmospheric history of the past 420,000 years
from the Vostok ice core, Antarctica. Nature, 399, 429-436.
Pfister, C., 1995. Monthly temperature and precipitation in central Europe from 1529-
1979: quantifying documentary evidence on weather and its effects. In: Bradley,
References
60
R.S., Jones, P.D. (Eds.), Climate since AD 1500. Routledge, London and New York,
pp. 118-142.
Pillans, B., 2007. Quaternary Stratigraphy. Overview, in Encyclopedia of Quaternary
Science, edited by A. E. Scott, pp. 2785-2802, Elsevier, Oxford.
Pollard, R. T. and Pu, S., 1985. Structure and circulation of the upper Atlantic Ocean
northeast of the Azores, Progress in Oceanography, 14 , 443-462.
Pollard, R.T., Griffths, M.J., Cunningham, S.A., Read, J.F., Péerez, F.F. and Ríos,
A.F., 1996. Vivaldi 1991 – A study of the formation, circulation and ventilation of
eastern North Atlantic Central Water, Progress in Oceanography, 37 , 167-172.
Pons, A. and Reille, M., 1986. Nouvelles recherches pollenanalytiques a Padul
(Granada): La fin du dernier glaciaire et l’Holocene. E. Lopez-Vera (Ed.).
Quaternary climate in Western Mediterranean, University Autonoma de Madrid,
405-420.
Punt, W., 1971. Pollen morphology of the genera Norantea, Souroubea and Ruyschia
(Marcgraviaceae). Pollen Spores, 13, 199-232.
Punt, W., Hoen, P.P., Blackmore, S., Nilsson, S. and Le Thomas, A., 2007. Glossary
of pollen and spore terminology. Review of Palaeobotany and Palynology, 143 (1-
2), 1-81.
Quadrelli, R., V. Pavan and Molteni, F., 2001. Wintertime variability of
Mediterranean precipitation and its links with large-scale circulation anomalies,
Clim. Dyn. 17, 5-6, 457-466.
Rahmstorf, S., 2002. Ocean circulation and climate during the past 120,000 years.
Nature, 419, 207-214.
Rahmstorf, S., 2007. Glacial climates - Thermohaline Circulation, in Encyclopedia of
Quaternary Science, edited by S. A. Elias pp. 739-750. Elsevier, Oxford.
Rasmussen, T.L., Thomsen, E., van Weering, T.C.E. and Labeyrie, L., 1996. Rapid
changes in surface and deep water conditions at the Faeroe Islands Margin during
the last 58 ka. Paleoceanography, 11, 757-771.
Reale, O., Dirmeyer, P., 2000. Modeling the effects of vegetation on Mediterranean
climate during the Roman Classical Period: part I: climate history and model
sensitivity. Global Planet Change 25, 163–184.
Reille, M., 1992. Pollen et spores d'Europe et d'Afrique du Nord. Marseille,
Laboratoire de botanique historique et palynologie, 520 p.
Reille, M., de Beaulieu, J. L., Svobodova, H., Andrieu-Ponel, V., and Goeury, C.,
2000. Pollen analytical biostratigraphy of the last five climatic cycles from a long
continental sequence from the Velay region (Massif Central France). Journal of
Quaternary Science, 15(7), 665-685.
Reimer, P.J., Baillie, M.G.L., Bard, E., Bayliss, A., Beck, J.W., Blackwell, P.G.,
Bronk Ramsey, C., Buck, C.E., Burr, G.S., Edwards, R.L., Friedrich, M., Grootes,
P.M., Guilderson, T.P., Hajdas, I., Heaton, T.J., Hogg, A.G., Hughen, K.A., Kaiser,
K.F., Kromer, B., McCormac, F.G., Manning, S.W., Reimer, R.W., Richards, D.A.,
Southon, J.R., Talamo, S., Turney, C.S.M., van der Plicht, J. and Weyhenmeyer,
C.E., 2009. IntCal09 and Marine09 radiocarbon age calibration curves, 0-50,000
years cal. BP. Radiocarbon, 51(4), 1111-1150.
References
61
Renssen, H., Goosse, H. and Muscheler, R., 2006. Coupled climate model simulation
of Holocene cooling events: oceanic feedback amplifies solar forcing. Climate of the
Pas,t 2, 79-90.
Renssen, H., Goosse, H., Fichefet, T. and Campin, J.M., 2001. The 8.2 kyr BP event
simulated by a global atmosphere–sea–ice–ocean model. Geophysical Research
Letters, 28, 1567-1570.
Renssen, H., Goosse, H., Fichefet, T., 2007. Simulation of Holocene cooling events in
a coupled climate model. Quaternary Science Reviews, 26, 2019-2029.
Renssen, H., Goosse, H., Fichefet, T., Brovkin, V., Driesschaert, E., Wolk, F., 2005.
Simulating the Holocene climate evolution at northern high latitudes using a
coupled atmosphere-sea ice-ocean-vegetation model. Climate Dynamics, 24, 23-43.
Renssen, H., Seppä, H., Heiri, O., Roche, D.M., Goosse, H., Fichefet, T., 2009. The
temporal and spatial complexity of the Holocene Thermal Maximum. Nature
Geoscience, doi: 10.1038/ NGEO513.
Rimbu, N., Lohmann, G., Kim, J.H., Arz, H.W. and Schneider, R., 2003. Arctic/North
Atlantic Oscillation signature in Holocene sea surface temperature trends as
obtained from alkenone data. Geophysical Research Letters, 30(6), 1280.
Rind, D., Chandler, M., Lerner, J., Martinson, D.G. and Yuan, X., 2001. Climate
response to basin-specific changes in latitudinal temperature gradients and
implications for sea-ice variability. Journal of Geophysical Research, 106, 20 161–
73.
Risebrobakken, B., Jansen, E., Andersson, C., Mjelde, E. and Hevrøy, K., 2003. A
high resolution study of paleoceanographic changes in the Nordic Sea.
Paleoceanography, 18, 1017, doi: 10.1029/2002PA000764, 2003
Rivas-Martinez, S., 2005. Mapa de Series, Geoseries y Geopermaseries de Vegetacion
de Espana, Parte 1. Memoria del Mapa de Vegetacion Potencial de Espana, 1-28.
Rivas-Martinez, S., Penas A. and Diaz, T. E., 2004. Biogeographic Map of Europe.
Cartographic Service. University of Leon, Spain.
Rodrigues, T., Grimalt, J. O., Abrantes, F., Naughton, F., and Flores, J., 2010. The last
glacial – interglacial transition (LGIT) in the western mid-latitudes of the North
Atlantic: Abrupt sea surface temperature change and sea level implications.
Quaternary Science Reviews: 29 (15), 1853-1862. Elsevier.
Rohling, E.J. and Pälike, H., 2005. Centennial-scale climate cooling with a sudden
cold event around 8,200 years ago. Nature, 434, 975-979.
Ruddiman W.F., 1977. Late Quaternary deposition of ice-rafted sand in the subpolar
north Atlantic (lat. 40º to 65º). Geological Society of America Bulletin, 88, 1813-
1827.
Ruddiman, W.F., 2001. Earth's Climate: Past and Future, New York.
Ruddiman, W.F., 2006. Orbital changes and climate, Quaternary Science Reviews,
25(23-24), 3092-3112.
Rull, V., 1987. A note on pollen counting in paleoecology. Pollen et Spores, 29(4),
471-480.
References
62
Sáenz, J., J. Zubillaga and C. Rodriguez-Puebla, 2001a. Interannual variability of
winter precipitation in northern Iberian Peninsula, Int. J. Climatol. 21, 12, 1503-
1513.
Sáenz, J., Zubillaga, J. and Rodríguez-Puebla, C., 2001b. Interannual winter
temperature variability in the North of the Iberian Peninsula. Climate Research 16,
169-179.
Sánchez-Goñi, M.F., Cacho, I., Turon. J.L., Guiot. J., Sierro, F.J., Peypouquet, J.P.,
Grimalt, J.O. and Shackleton, N.J., 2002. Synchroneity between marine and
terrestrial responses to millennial scale climatic variability during the last glacial
period in the Mediterranean region. Clim Dyn 19:95–105
Sánchez-Goñi, M.F., Eynaud, F., Turon, J.L. and Gendreau, S., 2000. European
climatic response to millenial-scale climatic changes in the atmosphere-ocean
system during the Last Glacial period. Quaternary Research, 54, 394-403.
Seidov, D., and Maslin, M., 1999. North Atlantic deep water circulation collapse
during Heinrich events. Geology, 27(1), 23-26.
Severinghaus, J.P. and Brook, E.J., 1999. Abrupt Climate Change at the End of the
Last Glacial Period Inferred from Trapped Air in Polar Ice. Science, 286, 930-934.
Shackleton, N.J. and Opdyke, N.D., 1973. Oxygen isotope and paleomagnetic
stratigraphy of Equatorial Pacific core V28-238: oxygen isotope temperatures and
ice volumes a 105 year and 106 year scale. Quaternary Research, 3, 39-55.
Shackleton, N.J., 1967. Oxygen Isotope analysis and pleistocene temperature
reassessed. Nature, 215, 15-17.
Shackleton, N.J., 1969. The last interglacial in the marine and terrestrial records.
Proceedings of the Royal Society of London, B174: 135-154.
Sigman, D.M. and Boyle E.A., 2000. Glacial/interglacial variations in atmospheric
carbon dioxide. Nature, 407(6806), 859-869.
Solignac, S., de Vernal, A. and Hillaire-Marcel, C., 2004. Holocene sea-surface
conditions in the North Atlantic—contrasted trends and regimes in the western and
eastern sectors (Labrador Sea vs. Iceland Basin). Quaternary Science Reviews, 23,
319–334.
Stanley, E.A., 1969. Marine Palynology. Oceanography and Marine Biology Annual
Review, 7, 277-292.
Steinhilber, F., Beer, J., Fröhlich, C., 2009. Total solar irradiance during the Holocene.
Geophys. Res. Lett. 36. doi:10.1029/2009GL040142.
Stocker, T.F., 1998. The seesaw effect. Science, 282, 61-62.
Stuiver, M. and Quay, P.D., 1980. Changes in atmospheric carbon-14 attributed to a
variable Sun. Science, 207, 11–19.
Stuiver, M. and Reimer, P.J., 1993. Extended 14C database and revised CALIB
radiocarbon calibration program. Radiocarbon, 35, 215–30.
Stuiver, M., 1961. Variations in radiocarbon concentration and sunspot activity.
Journal of Geophysical Research, 66, 273–276.
References
63
Stuiver, M., Braziunas, T.F., Becker, B. and Kromer, B., 1991. Climatic, solar,
oceanic, and geomagnetic influences on late-glacial and Holocene atmospheric 14
C/12
C change. Quaternary Research, 35, 1-24.
Stuiver, M., Reimer, P.J. and Reimer, R.W., 2005. CALIB 5.0. Retrieved 11 April
2012 from http://calib.qub.ac.uk/calib/.
Suc, J.P., 1984. Origin and evolution of the Mediterranean vegetation and climate in
Europe, Nature, 307, 429-432.
Telford, R.J., Heegaard, E. and Birks, H.J.B., 2004. The intercept is a poor estimate of
a calibrated radiocarbon age. The Holocene, 14, 296–298.
Thomas, E.R., Wolff, E.W., Mulvaney, R., Steffensen, J.P., Johnsen, S.J., Arrowsmith,
C., White, J.W.C., Vaughn, B. and Popp, T., 2007. The 8.2 kyr event from
Greenland ice cores. Quaternary Science Reviews, 26, 70-81
Thompson D.J.W. and Wallace, J.M., 1998. The Arctic Oscillation signature in
wintertime geopotential height and temperature fields. Geaphys. Res. Left. 25,
1297-1300.
Thouveny, N., Moreno, E., Delanghe, D., Candon, L., Lancelot, Y. and Shackleton,
N.J., 2000. Rock magnetic detection of distal ice-rafted debries: clue for the
identification of Heinrich layers on the Portuguese margin. Earth and Planetary
Science Letters, 180, 61-75.
Tibaldi, S., D’Andrea, F., Tosi, E. and Roeckner, E., 1997. Climatology of Northern
Hemisphere blocking in the ECHAM model, Clim Dyn 13, 649-666.
Trigo, R. and DaCamara, C.C., 2000. Circulation Weather Types and Influence on the
Precipitation Regime in Portugal, International Journal of Climatology, 20, 1559-
1581.
Trigo, R., and 21 coauthors, 2006. Relations between Variability in the Mediterranean
region and Mid-Latitude variability (lead author of Chapter 3), in: The
Mediterranean Climate: an overview of the main characteristics and issues, Ed. P.
Lionello, P. Malanotte-Rizzoli, and R. Boscolo, Elsevier, 179-226.
Trigo, R.M., Osborn, T.J., and Corte-Real, J., 2002. The North Atlantic Oscilation
influence on Europe: Climate impacts and associated physical mechanisms, Climate
Research, 20, 9-17.
Trigo, R.M., Pozo-Vázquez, D., Osborn, T.J., Castro-Díez, Y., Gámiz-Fortis, S., and
Esteban-Parra, M.J., 2004a. North Atlantic Oscillation influence on precipitation,
river flow and water resources in the Iberian Peninsula. Int. J. Climatol. 24, 925-
944.
Trigo, R.M., Trigo, I.F., DaCamara, C.C. and Osborn, T.J., 2004b. Climate impact of
the European winter blocking episodes from the NCEP/NCAR Reanalyses, Clim.
Dyn. 23, 17-28.
Trigo, R.M., Valente, M.A., Trigo, I.F., Miranda, P.M.A., Ramos, A.M., Paredes, D.
and García-Herrera R., 2008. The impact of North Atlantic wind and cyclone trends
on European precipitation and significant wave height in the Atlantic. Annals of the
New York Academy of Sciences, 1146, 212–234.
References
64
Trouet, V. R., Esper, J., Graham, N. E., Baker, A., Scourse, J. D., and Frank, D. C.
2009, Persistent positive North Atlantic oscillation mode dominated the medieval
climate anomaly, Science, 324, 78–80, doi:10.1126/science.1166349.
Trouet, V., Scource, J.D., Raible, C.C., 2012. North Atlantic storminess and Atlantic
Meridional Overturning Circulation during the last Millennium: Reconciling
contradictory proxy records of NAO variability. Global and Planetary Change, 84-
85, 48-55.
Turon, J.L., 1984. Le palynoplankton dans l’environnement actuel de l’Atlantique
nord oriental: évolution climatique et hydrologique depuis le dernier maximum
glaciale. Thèse de Doctorate ès Sciences, Université de Bordeaux. 313 pp.
Turon, J.L., A.M. Lézine, and M. Denèfle, 2003. Land-sea correlations for the last
glaciation inferred from a pollen and dinocyst record from the Portuguese Margin.
Quaternary Research, 59, 88-96.
Tzedakis, P.C., 1994. Hierarchical biostratigraphical classification of long pollen
sequences. Jour. Quaternary Science, 9, 257-260.
UMR EPOC, Environnements et Paléoenvironnements Océaniques et Continentaux
Home Page, Retrieved 11 Aphril 2012 from http://www.epoc.u-
bordeaux.fr/index.php?lang=fr&page=eq_paleo_pollens.
Usabiaga, J.I., J. Sáenz, V. Valencia and Á. Borja, 2004. Climate and Meteorology:
variability and its influence on the Ocean. In: Borja, Á., Collins, M. (Eds.)
Oceanography and Marine Environment of the Basque Country, Elsevier
Oceanography Series, 70, 75-95.
van der Hammen, T., Wijmstra, T.A. and Zagwijn, W.H., 1971. The floral record of
the late Cenozoic of Europe. The late Cenozoic glacial ages (K.K. Turekian, ed.),
Yale University Press, New Haven: 391-423.
van Geel, B., van der Plicht, J. and Renssen, H., 2003. Major ∆14C excursions during
the late glacial and early Holocene: changes in ocean ventilation or solar forcing of
climate change? Quaternary International, 105, 71-76.
van Kreveld, S., Sarnthein, M., Erlenkeuser, H., Grootes, P., Jung, S., Nadeau, M.J.,
Pflaumann, U., Voelker, A., 2000. Potential links between surging ice sheets,
circulation changes, and the Dansgaard-Oeschger cycles in the Irminger Sea, 60-18
kyr, Paleoceanography, 15, 425-442.
Vellinga, M. and Wood. R.A., 2002. Global climatic impacts of a collapse of the
Atlantic Thermohaline Circulation. Climatic Change 54:251-267
Voelker, A.H.L. and workshop participants, 2002. Global distribution of
centennialscale records of centennial-scale records for Marine Isotope Stage (MIS)
3: a database. Quaternary Science Reviews, 21: 1185-1212.
Voelker, A.H.L., Sarnthein, M., Grootes, P.M., Erlenkeuser, H., Laj, C., Mazaud, A.,
Nadeau, M.-J., and Schleicher, M., 1998. Correlation of marine 14C ages from the
Nordic seas with the GISP2 isotope record: Implications for 14C calibration beyond
25 ky BP. Radiocarbon, 40, 517-534.
von Grafenstein, U., Erlenkeuser, H., Muller, J., Jouzel, J. and Johnsen, S., 1998. The
cold event 8200 years ago documented in oxygen isotope records of precipitation in
Europe and Greenland. Climate Dynamics, 14, 73-81.
References
65
Walanus, A. and Nalepka, D., 1997. Palynological diagram drawing in Polish
POLPA1 for windows. INQUA Comm. Study Holocene: Work. gr. data-handl.
meth. Newsl, 16, 3.
Walker, M., Johnsen, S., Rasmussen, S.O., Popp, T., Steffensen, J.-P., Gibbard, P.,
Hoek, W., Lowe, J., Andrews, J., Bjorck, S., Cwynar, L.C., Hughen, K., Kershaw,
P., Kromer, B., Litt, T., Lowe, D.J., Nakagawa, T., Newnham, R. and Schwander, J.,
2009. Formal definition and dating of the GSSP (Global Stratotype Section and
Point) for the base of the Holocene using the Greenland NGRIP ice core, and
selected auxiliary records. Journal of Quaternary Science, 24, 3-17.
Walker, M., Johnsen, S., Rasmussen, S.O., Steffensen, J.-P., Popp, T., Gibbard, P.,
Hoek, W., Lowe, J., Andrews, J., Björck, S., Cwynar, L., Hughen, K., Kershaw, P.,
Kromer, B., Litt, T., Lowe, D.J., Nakagawa, T., Newnham, R. and Schwander, J.,
2008. The Global Stratotype Section and Point (GSSP) for the base of the Holocene
Series/Epoch (Quaternary System/Period) in the NGRIP ice core. Episodes 31, 264-
267.
Wallace, J.M. and Gutzler, D.S, 1981, Teleconnections in the geopotential height field
during the Northern Hemisphere winter, Mon. Wea. Rev. 109, 784-812.
Wanner, H. und S. Brönnimann, 2012. Is there a global Holocene climate mode?
PAGESnews Vol. 20, No. 1, 44-45.
Wanner, H., Beer, J., Bütikofer, J., Crowley, T.J., Cubasch, U., Flückiger, J., Goosse,
H., Grosjean, M., Joos, F., Kaplan, J.O., Küttel, M., Müller, S., Prentice, I.C.,
Solomina, O., Stocker, T.F., Tarasov, P., Wagner, M., Widmann, M., 2008. Mid-
tolate Holocene climate change: an overview. Quaternary Science Reviews, 27,
1791-1828.
Wanner, H., Bütikofer, J., 2008. Holocene Bond Cycles e real or imaginary?
Geografie, 4(113), 338-349.
Wanner, H., Solomina, O., Grosjean, M., Ritz, S. P. and Jetel, M., 2011. Structure and
origin of Holocene cold events, Quaternary Science Reviews, 30, 3109–3123.
Weber, S.L. and Oerlemans, J., 2003. Holocene glacier variability: three case studies
using an intermediate-complexity climate model. The Holocene, 13, 353-363.
Weber, S.L., Crowley, T.J., van der Schrier, G., 2004. Solar irradiance forcing of
centennial climate variability during the Holocene. Climate Dynamics, 24, 539–553.
Wiersma, A.P. and Renssen, H., 2006. Model-data comparison for the 8.2 ka BP
event: confirmation of a forcing mechanism by catastrophic drainage of Laurentide
Lakes. Quaternary Science Reviews, 25, 63-88.
Worldwide Bioclimatic Classification System, 1996-2009, S.Rivas-Martinez &
S.Rivas-Saenz, Phytosociological Research Center, Spain. Retrieved 11 Aphril 2012
from http://www.globalbioclimatics.org.
Xoplaki, E., 2002, Climate Variability over the Mediterranean, PhD thesis, University
of Bern, Switzerland, Available through: http://sinus.unibe.ch/
klimet/docs/phd_xoplaki.pdf.
Zachos, J., Pagani M., Sloan L., Thomas E. and Billups K., 2001. Trends, Rhythms,
and Aberrations in Global Climate 65 Ma to Present. Science, 292(5517), 686-693.
References
66
Zahn, R., Schönfeld, J., Kudrass, H.R., Park, M.H., Erlenkeuser, H. and Grootes, P.,
1997., Thermohaline instability in the North Atlantic during meltwater events:
Stable isotope and ice-rafted detritus records from Core SO75-26KL, Portuguese
Margin. Paleoceanography, 12(5), 696–710.
Zielinski, G.A., 2000. Use of paleo-records in determining variability within the
volcanism-climate system. Quaternary Sci. Rev. 19, 417-438.
Chapter II

67
Holocene Climate variability in the
mid-latitudes of the eastern
North Atlantic region
Dulce Oliveira1,2
; Filipa Naughton1,2,3,4
; Ricardo Trigo5; Teresa Rodrigues
1,2; Jean-
Marie Jouanneau6; Olivier Weber
6; Julio Rodriguez
7; Ana Pascual
7; Cristina Lopes
1,2
(1) LNEG, Marine Geology Research Unit, Alfragide, Portugal
(2) CIIMAR, Porto, Portugal
(3) WHOI, Geology & Geophysics Department, USA
(4) GEOTOP, Université du Québec à Montréal, Canada
(5) IDL, University of Lisbon, Lisbon, Portugal
(6) UMR-CNRS EPOC 5805, Bordeaux 1 University, France
(7) UPV/EHU, University of the Basque Country, Spain
Corresponding author:
Prepared for submitting to Quaternary Science Reviews
68
ABSTRACT
Vegetation and climate changes in southwestern France/northern Spain are
documented for the last ca. 9000 cal. yr BP in a well dated shelf core, KS05 10,
retrieved in the southern margin of the Bay of Biscay (Basque country) (43°22’765N,
2°16’744W). The continuous high resolution pollen record shows orbital and suborbital
climate fluctuations contemporaneous with those noticed for the North Atlantic region,
Greenland and Europe.
A gradual long-term oak and pine forest decline along with an increase in
herbaceous plants, reflecting a gradual cooling between 9000 and 1000 yr cal. BP,
replicates the cooling trend in Greenland and the general decrease of mid-latitude
summer insolation. The replacement of oak and pine forest by beech in the mid-
Holocene suggests besides the cooling, an increase of moisture conditions and a
decrease in seasonality mimicking the general increase of the precession.
Superimposed on the orbitally induced long-term cooling, KS05 10 pollen record
detects an abrupt cool and wet episode, marked by the contraction of hazel trees, the
expansion of Cyperaceae and the presence of hornbean, between 8.3 and 8.1 ka in the
southwestern France/northern Spain, which is related to the well-known 8.2 ka event.
The relatively cold conditions were probably the result of the weakening of the
Meridional Overturnig Circulation triggered by the final catastrophic drainage of the
Laurentide Lakes and consequent input of freshwater in the North Atlantic region.
However, this mechanism can not explain the wet conditions detected in the KS05 10
pollen record. These wet conditions could probably be the result of the influence of the
Atlantic Westerly Jet stream and prevalence of strong zonal flow and frequent low
pressure systems (associated with less blocking events) over southwestern
France/northern Spain. The blockage of sunlight by clouds, which is associated to high
precipitation, may be responsible for the particular decline of Corylus (light-demanding
tree) during this climatic downturn event.
Small-amplitude millennial-scale cooling events until 3 ka are reflected by
oscillations of the hazel trees within a ~500yr cyclicity. The impact of human activity
on vegetation over the last 1000 years is superimposed on the climatic natural changes.
Key words: Holocene, 8.2 ka event, Climate, Vegetation, Southwestern Europe,
Atlantic Westerly Jet stream, Blocking events, Corylus
69
1. INTRODUCTION
Climate is changing significantly since the last few decades, affecting people and
the environment worldwide (IPCC, 2007). In particular, increasing air and ocean
temperatures, widespread melting of ice sheets, and rising sea levels result in a shift in
the Earth’s climate system equilibrium. As the climate of our planet appears to be
heading for unusual rates of climate change, whether due to natural variability or as a
result of human activity, a deeper understanding of the mechanisms that drive the
Earth’s climate, by studying past climate changes, is therefore crucial for predicting
future climate. Hence, there is an urgent need to improve our documentation and
understanding of natural variability for periods stretching back beyond the instrumental
record. From this perspective, it is of extreme importance to know more about natural
climate variations that occurred during the current interglacial, the Holocene (last 11.7
ka), because its boundary conditions are similar to those experienced now and in the
near future.
Growing evidences suggest that variations in Holocene climate were larger than
previously considered. In the last few years, numerous studies have been performed on
several naturally occurring archives such as lake and marine sediments, tree rings,
speleothems and ice cores, together with climate simulations, to understand the nature,
timing and causes of Holocene natural climate oscillations. Such studies have shown
that superimposed on the orbitally-induced long-term cooling sub-orbital millennial-
scale climate variability has affected this interglacial. (e.g. Kutzbach and Gallimore,
1988; Bond et al., 1997; 2001; Klitgaard-Kristensen et al.,1998; Von Grafenstein et al.,
1998; 1999; Nesje and Dahl, 2001; Tinner and Lotter, 2001; 2006; Baldini et al., 2002;
Crucifix et al., 2002; Davis et al., 2003; Weber and Oerlemans, 2003; Magny et al.,
2004; Mayewski et al., 2004; Renssen et al., 2005; Lorenz et al., 2006; Naughton et al.,
2007a; Wanner et al., 2008; 2011; Seppä et al., 2009).
However, the mechanisms that control Holocene climate variations are far from
being resolved. Thus, several questions remain unsolved namely on the role played by
the different dynamical processes involved, such as solar activity, volcanic eruptions,
meltwater discharge and consequent disruption of the oceanic thermohaline circulation
(THC), internal climate variability and feedback mechanisms, in the Holocene
millennial scale climate variability (e.g. Bond et al., 1997; 2001; Mayewski et al., 2004;
Renssen et al., 2005; 2009; Wanner et al., 2008; 2011). The most extreme and
70
widespread Holocene short-lived cold event corresponds to the well known 8.2 ka
event, which has been detected in the Greenland ice cores and in several high resolution
terrestrial and marine paleoclimatic records, especially in the North Atlantic region (e.g.
O'Brien et al., 1995; Alley et al., 1997; Bond et al., 1997; 2001; Tinner and Lotter,
2001; 2006; Magny et al., 2003; Muscheler et al., 2004; Veski et al., 2004; Alley and
Ágústsdóttir, 2005; Rohling and Pälike, 2005; Kobashi et al., 2007; Naughton et al.,
2007a; Seppä et al., 2007; Thomas et al., 2007). Several hypotheses have been invoked
to explain this cooling including: a) significant alterations of solar activity (e.g. Bond et
al., 2001; van Geel et al., 2003) or b) changes in the general circulation pattern of the
North Atlantic region (e.g. Barber et al., 1999; Von Grafenstein et al., 1999; Alley et al.,
2003; Ellison et al., 2006). The first hypothesis suggest a reduction of the solar activity
as the result of increasing sunspots (e.g. Bond et al., 2001; van Geel et al., 2003) while
the second assumption suggest that this cooling episode was triggered by the final
catastrophic drainage of the Lakes Agassiz and Ojibway which contributed to the
introduction of large amounts of freshwater into the North Atlantic Ocean, disturbed the
thermohaline circulation and cooled both Europe and North America (e.g. Barber et al.,
1999; Teller et al., 2002; Clarke et al., 2004; Alley and Ágústsdóttir, 2005, and
references therein; Ellison et al., 2006; Flesche Kleiven et al., 2008), as supported by
several climate models (e.g. Renssen et al., 2001, 2002; Alley and Ágústsdóttir, 2005;
LeGrande et al., 2006; Wiersma and Renssen, 2006; Wiersma et al., 2006; LeGrande
and Schmidt, 2008; Li et al., 2009).
In contrast, the signature of millennial-scale climate changes during the mid- and
late Holocene (after the “8.2 ka event”) is not easily detected in paleoclimatic records.
Nevertheless, this variability was strong enough to affect human societies, particularly
during the last millennium, as historically documented for the Little Ice Age (LIA) and
the Medieval Warm Period (MWP) (e.g. Desprat et al., 2003; Abrantes et al., 2005;
Jones and Mann, 2004; Lebreiro et al., 2006; Osborn and Briffa, 2006; Mann et al.,
2008; Ljungqvist, 2010; Trouet et al., 2012). The global impact, amplitude, periodicities
and causes of these short-lived climatic oscillations are still a matter of debate (Wanner
et al., 2008, and references therein; Jones et al., 2009).
In the last few years, several studies have been performed in the Northern Iberian
Peninsula and Pyrenees in order to document the Holocene climate variability and
particularly the vegetation response to the Holocene climate oscillations (e.g. García-
71
Antón et al., 2006; González-Sampériz et al., 2006; 2009; Davis and Stevenson, 2007;
Muñoz-Sobrino et al., 2007; 2009; García-Amorena et al., 2008; López-Merino et al.,
2008, Pèlachs et al, 2009; Iriarte, 2009; Morellón et al., 2009; Carrión et al., 2010;
Morales-Molino et al., 2011; Moreno et al., 2011; Rius et al., 2011). However, there are
few continuous palaeoclimate studies in that region with sufficient temporal resolution
and robust chronological framework to detect Holocene millennial-scale climatic
events. Furthermore, high-resolution pollen analysis in marine cores reflecting the
regional vegetation of the neighbor continent only exist in the northwestern France
(Naughton et al., 2007a) and in the northwestern Iberian margin (Naughton et al.,
2007b). Also, there are still some controversies about the climatic signal left by the 8.2
ka in that region. While some authors suggest that this episode was dry (González-
Sampériz et al., 2006; 2009; Davis and Stevenson, 2007) others point out for a wet
event (Muñoz Sobrino et al., 2009).
In order to improve our understanding on the vegetation response either to the
orbitally induced long-term cooling or to suborbital millennial-scale climate variability
in northern Iberian Peninsula and southwestern France, we performed a high resolution
pollen analysis in a shelf core, KS05 10, retrieved in the southern margin of the Bay of
Biscay (Basque country). The Bay of Biscay is considered a key region, being
particularly sensitive to changes in the North Atlantic drift and in the atmosphere
dynamics being, therefore, able to provide crucial information about the nature, timing
and causes of the Holocene climate variability in northern Iberian Peninsula and
southwestern France.
2. ENVIRONMENTAL SETTING
2.1 Morphology and recent sedimentation
The selected key-area for studying the Holocene climate variability is located in
the southwestern French/northern Spain margin and, in particular, in the continental
shelf of the Basque Country (Fig. 1). This continental shelf is narrow, ranging from 7
km off Matxitxako Cape to 20 km off the Oria River estuary (Uriarte, 1998) and is
composed of a mudpatch extending from East to West along 56 km (Jouanneau et al.,
2008a).
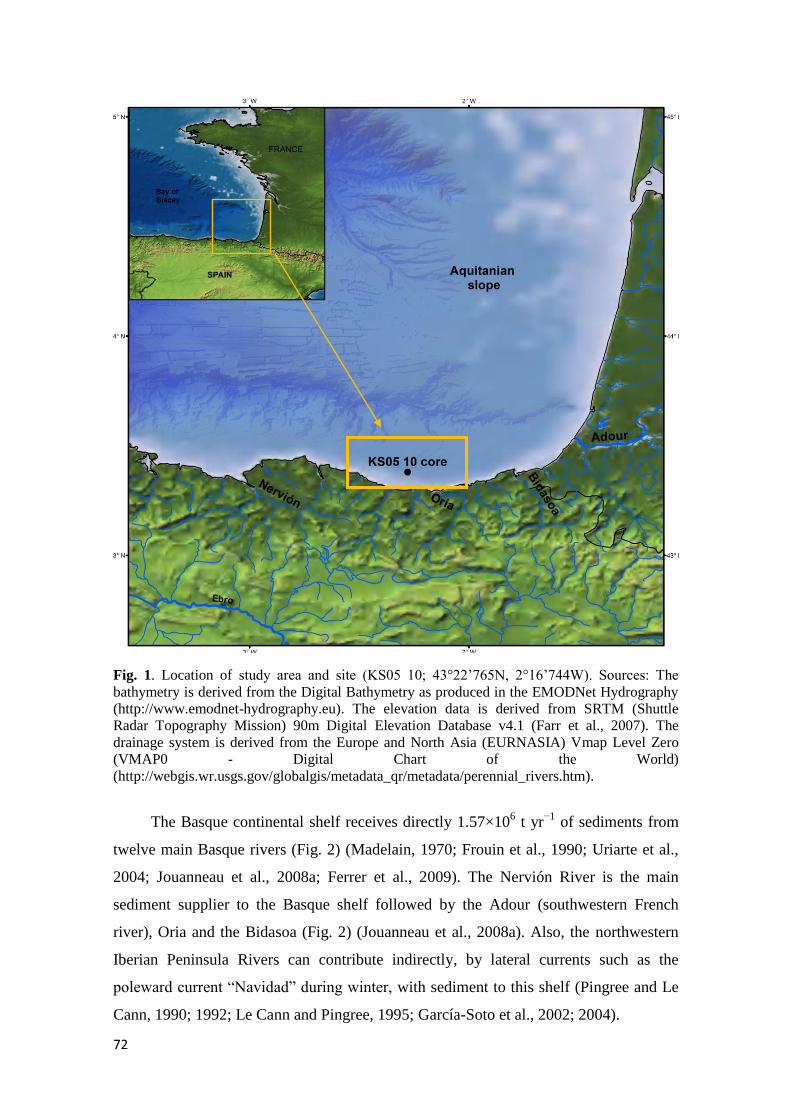
72
Fig. 1. Location of study area and site (KS05 10; 43°22’765N, 2°16’744W). Sources: The
bathymetry is derived from the Digital Bathymetry as produced in the EMODNet Hydrography
(http://www.emodnet-hydrography.eu). The elevation data is derived from SRTM (Shuttle
Radar Topography Mission) 90m Digital Elevation Database v4.1 (Farr et al., 2007). The
drainage system is derived from the Europe and North Asia (EURNASIA) Vmap Level Zero
(VMAP0 - Digital Chart of the World)
(http://webgis.wr.usgs.gov/globalgis/metadata_qr/metadata/perennial_rivers.htm).
The Basque continental shelf receives directly 1.57×10⁶ t yr
−1 of sediments from
twelve main Basque rivers (Fig. 2) (Madelain, 1970; Frouin et al., 1990; Uriarte et al.,
2004; Jouanneau et al., 2008a; Ferrer et al., 2009). The Nervión River is the main
sediment supplier to the Basque shelf followed by the Adour (southwestern French
river), Oria and the Bidasoa (Fig. 2) (Jouanneau et al., 2008a). Also, the northwestern
Iberian Peninsula Rivers can contribute indirectly, by lateral currents such as the
poleward current “Navidad” during winter, with sediment to this shelf (Pingree and Le
Cann, 1990; 1992; Le Cann and Pingree, 1995; García-Soto et al., 2002; 2004).
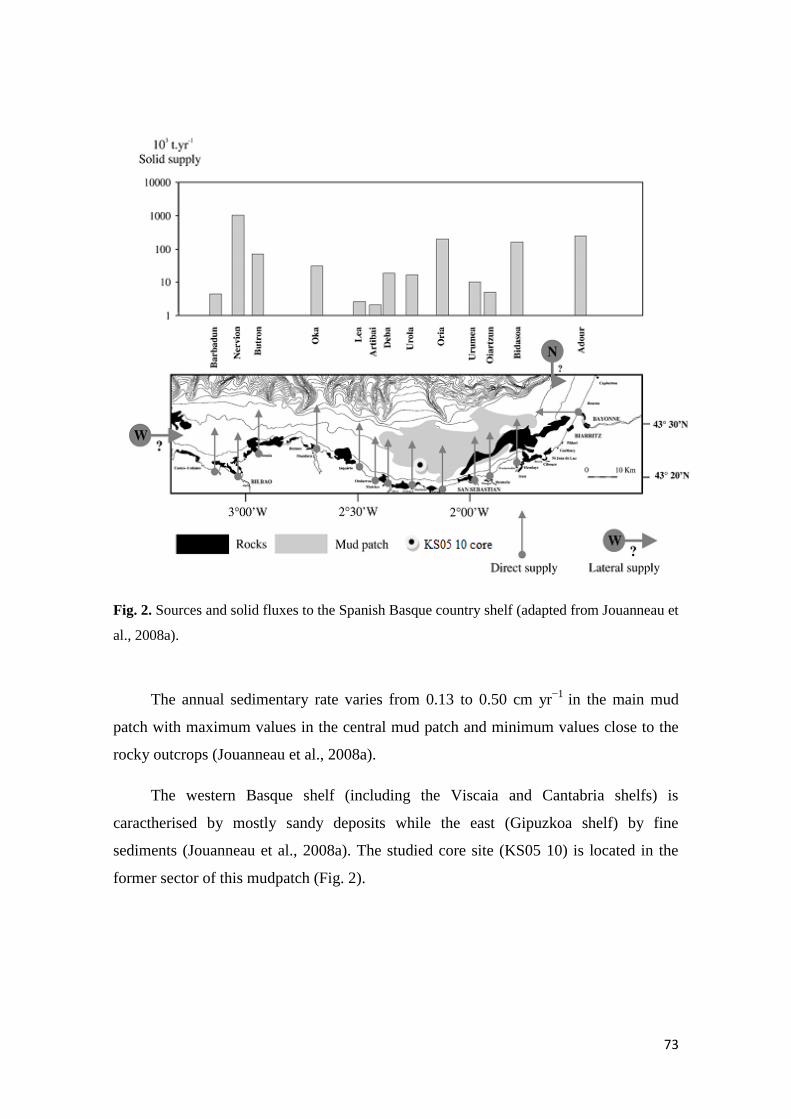
73
Fig. 2. Sources and solid fluxes to the Spanish Basque country shelf (adapted from Jouanneau et
al., 2008a).
The annual sedimentary rate varies from 0.13 to 0.50 cm yr−1
in the main mud
patch with maximum values in the central mud patch and minimum values close to the
rocky outcrops (Jouanneau et al., 2008a).
The western Basque shelf (including the Viscaia and Cantabria shelfs) is
caractherised by mostly sandy deposits while the east (Gipuzkoa shelf) by fine
sediments (Jouanneau et al., 2008a). The studied core site (KS05 10) is located in the
former sector of this mudpatch (Fig. 2).
74
2.2 Present-day pollen deposition
Numerous studies in coastal areas with well developed hydrographic basins and
prevailing offshore winds have shown that pollen grains after being produced and
initially dispersed by the wind can sink down and be mainly transported to the sea by
rivers and streams (Muller, 1959; Bottema and Van Straaten, 1966; Peck, 1973; Heusser
and Balsam, 1977; Heusser, 1978; Turon, 1984; Dupont and Wyputta, 2003; Naughton
et al., 2007b). In particular, Turon (1984) has shown that in the French margin, which
includes the Basque shelf, the fluvial systems are the primary seaward pollen suppliers,
since the westerly prevailing winds and regional complex topography do not favour
direct airborne transport of pollen to the sea. Also, Turon (1984) has demonstrated that
the marine pollen signature from the French margin reflects an integrated image of the
regional vegetation of the close continent. Hence, pollen grains preserved in core KS05
10 are essentially recruited by the rivers from the southern part of the Bay of Biscay and
in particular, by those considered as the main sediment suppliers of the Basque shelf
(Nervión, Adour, Oria and the Bidasoa rivers). Moreover, and following the
experimental work made by Turon (1984) in the French margin, we assumed that pollen
grains included in the Basque mud patch represent an integrated image of the regional
vegetation of the adjacent continent and in particular that of the Basque country and
southwestern France including the Pyrenees.
2.3 Present-day climate and vegetation
The climate of southwestern France and Basque country is particularly sensitive
to interannual shifts in the trajectories of mid-latitude cyclones that can lead to
significant anomalies of precipitation and, to a lesser extent, of temperature (Trigo et al.,
2008). Nevertheless, unlike most of the Iberian Peninsula, the climate of this region is
not related with a single mode of variability (Sáenz et al., 2001a). In particular, this
region is more affected by the Eastern Atlantic (EA) and Scandinavian (SCAND)
modes (Xoplaki, 2002; Trigo et al., 2006) than by the North Atlantic Oscillation mode
(NAO) (Trigo et al., 2004a). The SCAND pattern consists of a primary circulation
center over the Scandinavia Peninsula and an additional weaker center with opposite
sign located over southwestern Europe, being responsible for a large fraction of
precipitation registered over central and western Mediterranean basin (Quadrelli et al.,
75
2001; Xoplaki, 2002; Trigo et al., 2008). This circulation mode corresponds to the
typical configuration of the European blocking pattern, usually described in studies
using sub-monthly scales (e.g. Tibaldi et al., 1997). Blocking episodes are known to
produce significant impacts on both the precipitation and temperature fields of the
Mediterranean Region (Trigo et al., 2004b).
The present day climate of this region is temperate, humid and oceanic, with a
mean annual temperature higher than 10ºC and a mean annual precipitation of 1500 mm
per year (Usabiaga et al., 2004). It corresponds to a Cfb climate (marine west coast-
mild) according to Koppen’s classification, and presents a more variable distribution of
precipitation than of temperature (Sáenz et al., 2001a; b). These climatic conditions are
favourable to the expansion of a temperate deciduous mixed forest mainly composed of
deciduous oak woodlands (Quercus robur, Q. pyrenaica and Q. petraea) with ash
(Fraxinus excelsior), birch (Betula alba), alder (Alnus glutinosa), sycamore (Acer
pseudoplatanus), hazel (Corylus avellana) and elm (Ulmus) (García-Antón et al., 2006;
García-Amorena et al., 2008). There are also shrubs of Ulex europaeus, heaths with
different species of the genus Erica and brooms (Genista). Further back from the coast
and at higher altitudes, beech forests (Fagus sylvatica) can be found. The Mediterranean
influence is noted by the presence of some scattered evergreen sclerophyllous species
(Quercus ilex, Phillyrea spp., Olea europaea).
The Basque Country vegetation has been affected by intense human intervention
throughout the last millennium. The development of agriculture and arboriculture has
favored the expansion of cereals and numerous species of trees, such as Castanea sativa
(chestnut) and Juglans regia (walnut). Nevertheless, after centuries of continuous
deforestation, the traditional human-use has undergone a change since the early 19th
century, and has been largely replaced by intensive plantations of haloctonous trees,
essentially pine (Pinus radiate, P. pinaster.) and eucalyptus (Eucalyptus globulus)
(Irizar et al., 2004; Rigueiro-Rodríguez et al., 2005). Currently, forests represent more
than half of the total Atlantic-influenced area of the Basque Country, of which nearly
two-thirds are planted haloctonous conifers and less than 15% are broad-leaved forests
(mainly beech, followed by oak and chestnut) (Irizar et al., 2004).
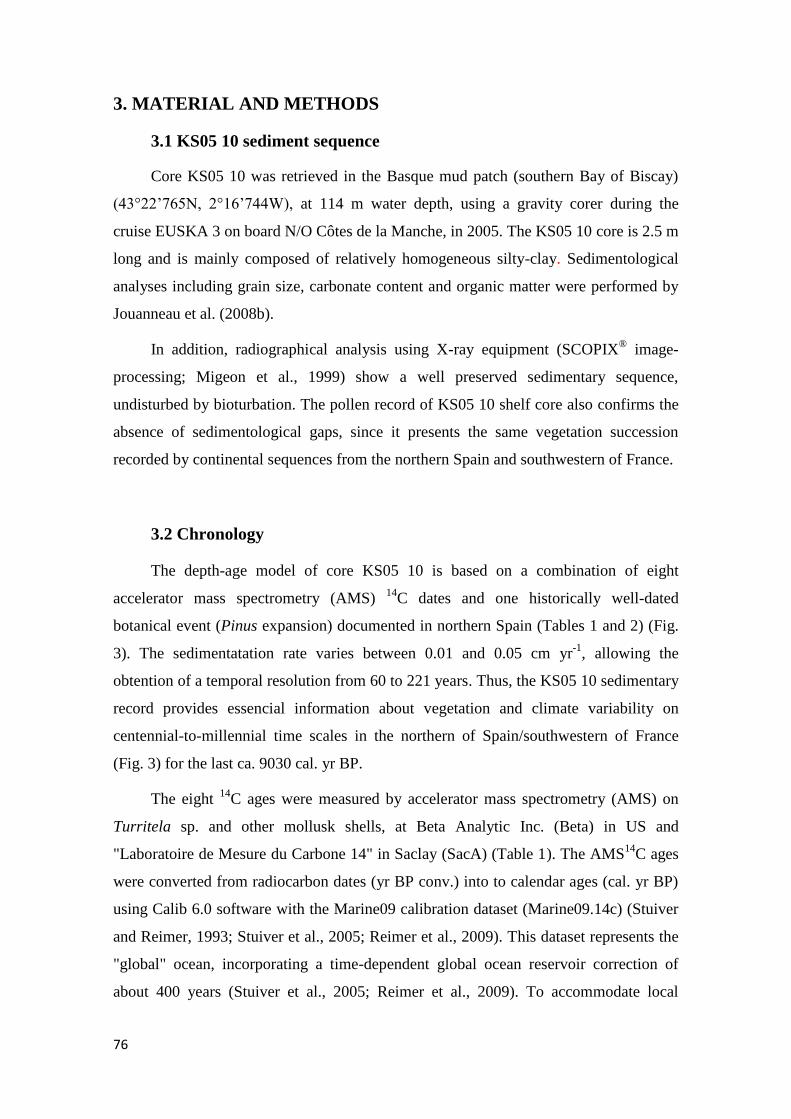
76
3. MATERIAL AND METHODS
3.1 KS05 10 sediment sequence
Core KS05 10 was retrieved in the Basque mud patch (southern Bay of Biscay)
(43°22’765N, 2°16’744W), at 114 m water depth, using a gravity corer during the
cruise EUSKA 3 on board N/O Côtes de la Manche, in 2005. The KS05 10 core is 2.5 m
long and is mainly composed of relatively homogeneous silty-clay. Sedimentological
analyses including grain size, carbonate content and organic matter were performed by
Jouanneau et al. (2008b).
In addition, radiographical analysis using X-ray equipment (SCOPIX®
image-
processing; Migeon et al., 1999) show a well preserved sedimentary sequence,
undisturbed by bioturbation. The pollen record of KS05 10 shelf core also confirms the
absence of sedimentological gaps, since it presents the same vegetation succession
recorded by continental sequences from the northern Spain and southwestern of France.
3.2 Chronology
The depth-age model of core KS05 10 is based on a combination of eight
accelerator mass spectrometry (AMS) 14
C dates and one historically well-dated
botanical event (Pinus expansion) documented in northern Spain (Tables 1 and 2) (Fig.
3). The sedimentatation rate varies between 0.01 and 0.05 cm yr-1
, allowing the
obtention of a temporal resolution from 60 to 221 years. Thus, the KS05 10 sedimentary
record provides essencial information about vegetation and climate variability on
centennial-to-millennial time scales in the northern of Spain/southwestern of France
(Fig. 3) for the last ca. 9030 cal. yr BP.
The eight 14
C ages were measured by accelerator mass spectrometry (AMS) on
Turritela sp. and other mollusk shells, at Beta Analytic Inc. (Beta) in US and
"Laboratoire de Mesure du Carbone 14" in Saclay (SacA) (Table 1). The AMS14
C ages
were converted from radiocarbon dates (yr BP conv.) into to calendar ages (cal. yr BP)
using Calib 6.0 software with the Marine09 calibration dataset (Marine09.14c) (Stuiver
and Reimer, 1993; Stuiver et al., 2005; Reimer et al., 2009). This dataset represents the
"global" ocean, incorporating a time-dependent global ocean reservoir correction of
about 400 years (Stuiver et al., 2005; Reimer et al., 2009). To accommodate local
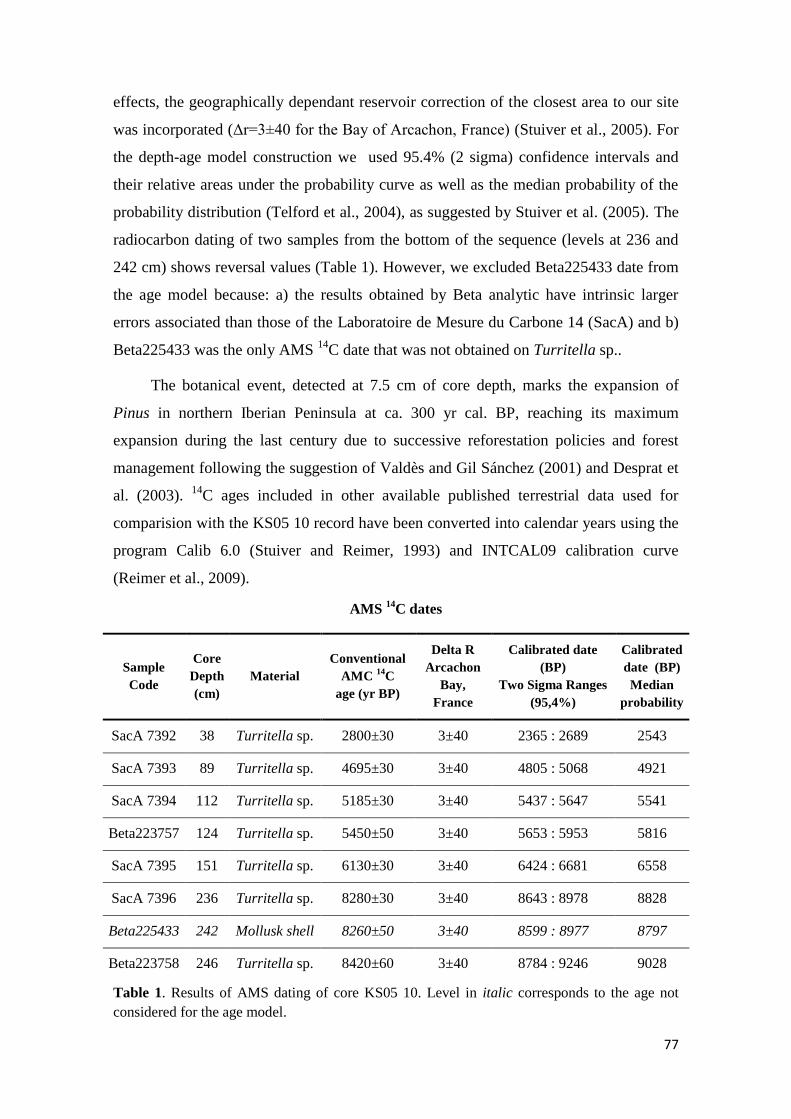
77
effects, the geographically dependant reservoir correction of the closest area to our site
was incorporated (Δr=3±40 for the Bay of Arcachon, France) (Stuiver et al., 2005). For
the depth-age model construction we used 95.4% (2 sigma) confidence intervals and
their relative areas under the probability curve as well as the median probability of the
probability distribution (Telford et al., 2004), as suggested by Stuiver et al. (2005). The
radiocarbon dating of two samples from the bottom of the sequence (levels at 236 and
242 cm) shows reversal values (Table 1). However, we excluded Beta225433 date from
the age model because: a) the results obtained by Beta analytic have intrinsic larger
errors associated than those of the Laboratoire de Mesure du Carbone 14 (SacA) and b)
Beta225433 was the only AMS 14
C date that was not obtained on Turritella sp..
The botanical event, detected at 7.5 cm of core depth, marks the expansion of
Pinus in northern Iberian Peninsula at ca. 300 yr cal. BP, reaching its maximum
expansion during the last century due to successive reforestation policies and forest
management following the suggestion of Valdès and Gil Sánchez (2001) and Desprat et
al. (2003). 14
C ages included in other available published terrestrial data used for
comparision with the KS05 10 record have been converted into calendar years using the
program Calib 6.0 (Stuiver and Reimer, 1993) and INTCAL09 calibration curve
(Reimer et al., 2009).
AMS 14
C dates
Sample
Code
Core
Depth
(cm)
Material
Conventional
AMC 14
C
age (yr BP)
Delta R
Arcachon
Bay,
France
Calibrated date
(BP)
Two Sigma Ranges
(95,4%)
Calibrated
date (BP)
Median
probability
SacA 7392 38 Turritella sp. 2800±30 3±40 2365 : 2689 2543
SacA 7393 89 Turritella sp. 4695±30 3±40 4805 : 5068 4921
SacA 7394 112 Turritella sp. 5185±30 3±40 5437 : 5647 5541
Beta223757 124 Turritella sp. 5450±50 3±40 5653 : 5953 5816
SacA 7395 151 Turritella sp. 6130±30 3±40 6424 : 6681 6558
SacA 7396 236 Turritella sp. 8280±30 3±40 8643 : 8978 8828
Beta225433 242 Mollusk shell 8260±50 3±40 8599 : 8977 8797
Beta223758 246 Turritella sp. 8420±60 3±40 8784 : 9246 9028
Table 1. Results of AMS dating of core KS05 10. Level in italic corresponds to the age not
considered for the age model.
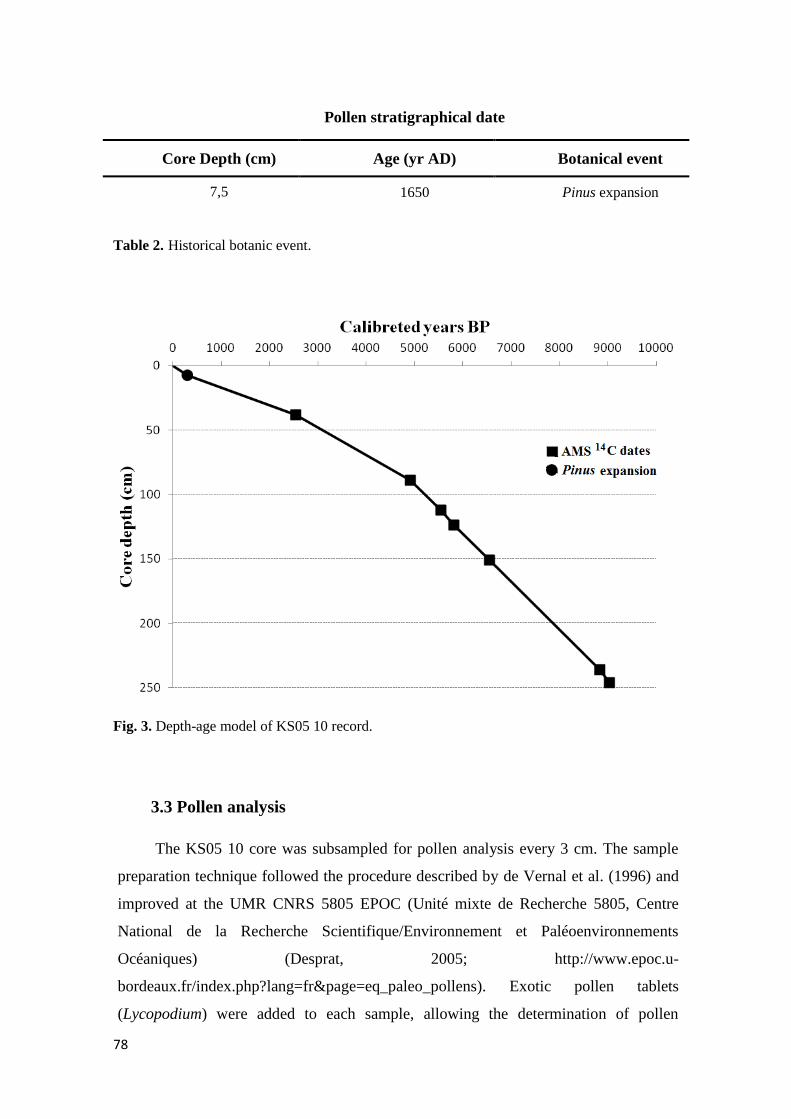
78
Pollen stratigraphical date
Core Depth (cm) Age (yr AD) Botanical event
7,5
1650
Pinus expansion
Table 2. Historical botanic event.
Fig. 3. Depth-age model of KS05 10 record.
3.3 Pollen analysis
The KS05 10 core was subsampled for pollen analysis every 3 cm. The sample
preparation technique followed the procedure described by de Vernal et al. (1996) and
improved at the UMR CNRS 5805 EPOC (Unité mixte de Recherche 5805, Centre
National de la Recherche Scientifique/Environnement et Paléoenvironnements
Océaniques) (Desprat, 2005; http://www.epoc.u-
bordeaux.fr/index.php?lang=fr&page=eq_paleo_pollens). Exotic pollen tablets
(Lycopodium) were added to each sample, allowing the determination of pollen
79
concentrations (pollen grains per unit of sediment volume). To remove carbonates,
treatment with cold hydrochloric acid (HCl) was carried out successively at 10%, 25%
and 50%. To avoid pollen being obscure when mounted, silica and silicates were
eliminated by chemical digestion using cold HF at 25% and 70% (Moore et al., 1991).
Colloidal silica and silicofluorides were removed with two successive attacks with 25%
cold HCl. The final residue was sieved through 10 µm nylon mesh screens (Heusser
and Stock, 1984) and mounted unstained in glycerol, which allowed the understanding
of the pollen three-dimensional structure (Moore et al., 1991).
Pollen slides were counted on a light Nikon microscope at x 500 (oil immersion)
magnification, accompanied by the use of x1000 magnification (oil immersion) for
confirmation/identification of critical grains. The slides were scanned along parallel
equidistant lines and identifications were achieved through comparison with specialist
atlases (Reille (1992) and Moore et al. (1991)). A minimum of 200 pollen grains (200
to 243, excluding Pinus, aquatic plants, spores and indeterminable pollen grains), 100
Lycopodium grains and 20 pollen types were counted in the 83 samples analyzed. This
method provides a representation of the total population in the original sample and
ensures statistically reliable pollen spectra (McAndrew and King, 1976; Maher, 1981;
Rull, 1987).
Pollen data was expressed as percentages of the main sum, which excludes Pinus,
aquatic plants, spores, indeterminate and unknown pollens. Pinus was excluded from
the main sum since it is strongly over-represented in most of marine deposits (Heusser
and Balsam, 1977; Turon, 1984; Naughton et al., 2007b). The percentages of pine were
calculated by using the total sum (pollen+spores+indeterminable+unknowns). The
pollen diagrams were performed by using the Psimpoll program (Bennett, 2000).
The overall trends of pollen data are similar whether calculated as percentages,
concentrations or accumulation rates, thus for the sake of brevity we only present the
pollen diagram expressed in percentages. The pollen percentages are plotted against age
in a synthetic diagram, which only includes the most representative taxa and the
ecologically meaningful groups of taxa (Fig. 4). These ecological groups indicate
different climatic conditions: (1) Deciduous Quercus, Acer, Alnus, Betula, Corylus,
Hedera, Ulmus, Tilia, Fraxinus excelsior-type and Fagus are the most important
components of the temperate group, indicating a humid and temperate climate; (2) the
ubiquist plant group, principally formed by Taraxacum, Poaceae, Cyperaceae and
80
Ericaceae, may reflect cold/cool conditions or, on the other hand, open forests or the
development of pasturelands; and (3) the semi-desert group, composed by Ephedra
fragilis-type, Artemisia and Chenopodiaceae, record dry conditions. Cereals, Juglans
and Castanea constitute the group of anthropogenic indicators, representing the
influence of human activities in the vegetation composition of the studied region.
The arrangement of the taxa within each group firstly followed the order of
appearance in the KS05 10 pollen record and after that of alphabetic order. Arboreal
pollen (AP), non-arboreal pollen (NAP) and Pinus curves are presented at the bottom of
the figure (Fig. 4).
We established a number of pollen zones by using qualitative and quantitative
fluctuations of a minimum of 2 curves of ecologically important taxa (Pons and Reille,
1986).
The synthetic pollen diagram is presented jointly with a table which includes a
detailed description of the diagram (see below).
3.4 Spectral analysis
Wavelet spectral analysis (Torrence and Compo, 1998) was applied to the
obtained pollen data to detect potential cyclicities of vegetation and climate changes.
Analysis was undertaken using interactive software available at
http://paos.colorado.edu/research/wavelets/ and selecting 90% confidence level against
a red noise spectrum.
4. RESULTS AND DISCUSSION
4.1 Vegetation history and climatic variations inferred from KS05 10 pollen
record
Pollen analysis of the KS05 10 record allows the recognition of eight major pollen
zones numbered from bottom to the top and designated by the sequence name (KS05
10) plus number.
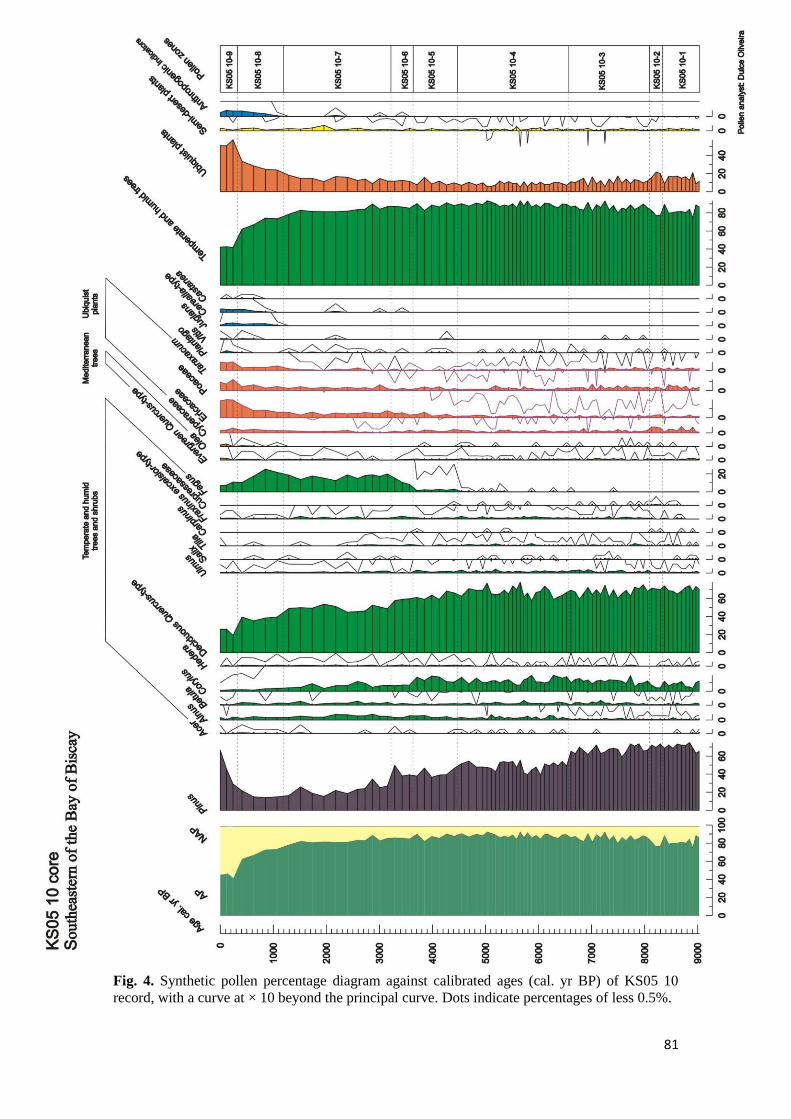
81
Fig. 4. Synthetic pollen percentage diagram against calibrated ages (cal. yr BP) of KS05 10
record, with a curve at × 10 beyond the principal curve. Dots indicate percentages of less 0.5%.
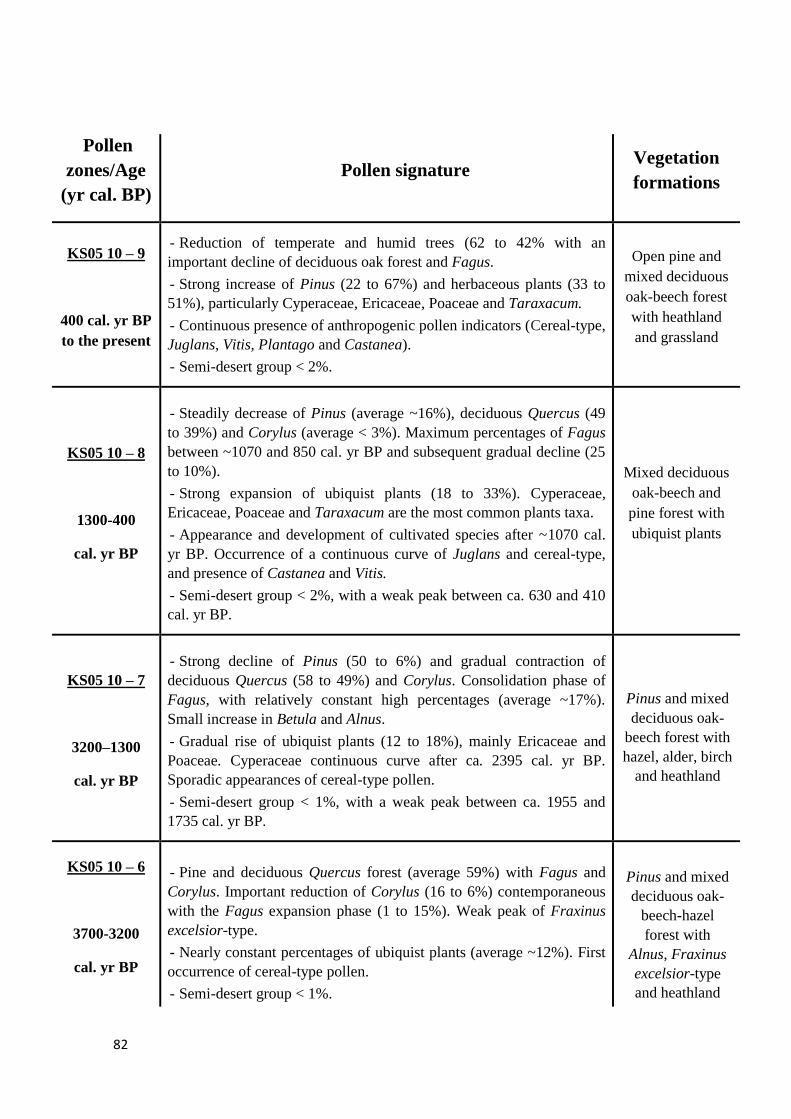
82
Pollen
zones/Age
(yr cal. BP)
Pollen signature Vegetation
formations
KS05 10 – 9
400 cal. yr BP
to the present
- Reduction of temperate and humid trees (62 to 42% with an
important decline of deciduous oak forest and Fagus.
- Strong increase of Pinus (22 to 67%) and herbaceous plants (33 to
51%), particularly Cyperaceae, Ericaceae, Poaceae and Taraxacum.
- Continuous presence of anthropogenic pollen indicators (Cereal-type,
Juglans, Vitis, Plantago and Castanea).
- Semi-desert group < 2%.
Open pine and
mixed deciduous
oak-beech forest
with heathland
and grassland
KS05 10 – 8
1300-400
cal. yr BP
- Steadily decrease of Pinus (average ~16%), deciduous Quercus (49
to 39%) and Corylus (average < 3%). Maximum percentages of Fagus
between ~1070 and 850 cal. yr BP and subsequent gradual decline (25
to 10%).
- Strong expansion of ubiquist plants (18 to 33%). Cyperaceae,
Ericaceae, Poaceae and Taraxacum are the most common plants taxa.
- Appearance and development of cultivated species after ~1070 cal.
yr BP. Occurrence of a continuous curve of Juglans and cereal-type,
and presence of Castanea and Vitis.
- Semi-desert group < 2%, with a weak peak between ca. 630 and 410
cal. yr BP.
Mixed deciduous
oak-beech and
pine forest with
ubiquist plants
KS05 10 – 7
3200–1300
cal. yr BP
- Strong decline of Pinus (50 to 6%) and gradual contraction of
deciduous Quercus (58 to 49%) and Corylus. Consolidation phase of
Fagus, with relatively constant high percentages (average ~17%).
Small increase in Betula and Alnus.
- Gradual rise of ubiquist plants (12 to 18%), mainly Ericaceae and
Poaceae. Cyperaceae continuous curve after ca. 2395 cal. yr BP.
Sporadic appearances of cereal-type pollen.
- Semi-desert group < 1%, with a weak peak between ca. 1955 and
1735 cal. yr BP.
Pinus and mixed
deciduous oak-
beech forest with
hazel, alder, birch
and heathland
KS05 10 – 6
3700-3200
cal. yr BP
- Pine and deciduous Quercus forest (average 59%) with Fagus and
Corylus. Important reduction of Corylus (16 to 6%) contemporaneous
with the Fagus expansion phase (1 to 15%). Weak peak of Fraxinus
excelsior-type.
- Nearly constant percentages of ubiquist plants (average ~12%). First
occurrence of cereal-type pollen.
- Semi-desert group < 1%.
Pinus and mixed
deciduous oak-
beech-hazel
forest with
Alnus, Fraxinus
excelsior-type
and heathland
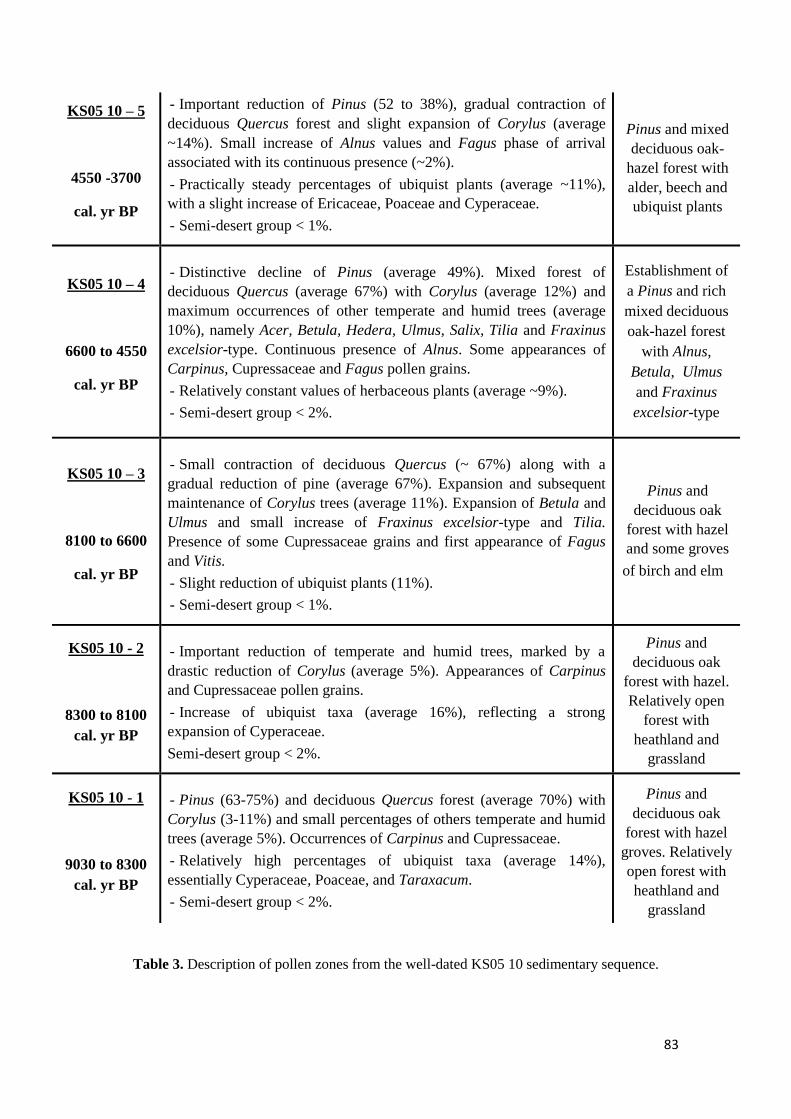
83
KS05 10 – 5
4550 -3700
cal. yr BP
- Important reduction of Pinus (52 to 38%), gradual contraction of
deciduous Quercus forest and slight expansion of Corylus (average
~14%). Small increase of Alnus values and Fagus phase of arrival
associated with its continuous presence (~2%).
- Practically steady percentages of ubiquist plants (average ~11%),
with a slight increase of Ericaceae, Poaceae and Cyperaceae.
- Semi-desert group < 1%.
Pinus and mixed
deciduous oak-
hazel forest with
alder, beech and
ubiquist plants
KS05 10 – 4
6600 to 4550
cal. yr BP
- Distinctive decline of Pinus (average 49%). Mixed forest of
deciduous Quercus (average 67%) with Corylus (average 12%) and
maximum occurrences of other temperate and humid trees (average
10%), namely Acer, Betula, Hedera, Ulmus, Salix, Tilia and Fraxinus
excelsior-type. Continuous presence of Alnus. Some appearances of
Carpinus, Cupressaceae and Fagus pollen grains.
- Relatively constant values of herbaceous plants (average ~9%).
- Semi-desert group < 2%.
Establishment of
a Pinus and rich
mixed deciduous
oak-hazel forest
with Alnus,
Betula, Ulmus
and Fraxinus
excelsior-type
KS05 10 – 3
8100 to 6600
cal. yr BP
- Small contraction of deciduous Quercus (~ 67%) along with a
gradual reduction of pine (average 67%). Expansion and subsequent
maintenance of Corylus trees (average 11%). Expansion of Betula and
Ulmus and small increase of Fraxinus excelsior-type and Tilia.
Presence of some Cupressaceae grains and first appearance of Fagus
and Vitis.
- Slight reduction of ubiquist plants (11%).
- Semi-desert group < 1%.
Pinus and
deciduous oak
forest with hazel
and some groves
of birch and elm
KS05 10 - 2
8300 to 8100
cal. yr BP
- Important reduction of temperate and humid trees, marked by a
drastic reduction of Corylus (average 5%). Appearances of Carpinus
and Cupressaceae pollen grains.
- Increase of ubiquist taxa (average 16%), reflecting a strong
expansion of Cyperaceae.
Semi-desert group < 2%.
Pinus and
deciduous oak
forest with hazel.
Relatively open
forest with
heathland and
grassland
KS05 10 - 1
9030 to 8300
cal. yr BP
- Pinus (63-75%) and deciduous Quercus forest (average 70%) with
Corylus (3-11%) and small percentages of others temperate and humid
trees (average 5%). Occurrences of Carpinus and Cupressaceae.
- Relatively high percentages of ubiquist taxa (average 14%),
essentially Cyperaceae, Poaceae, and Taraxacum.
- Semi-desert group < 2%.
Pinus and
deciduous oak
forest with hazel
groves. Relatively
open forest with
heathland and
grassland
Table 3. Description of pollen zones from the well-dated KS05 10 sedimentary sequence.
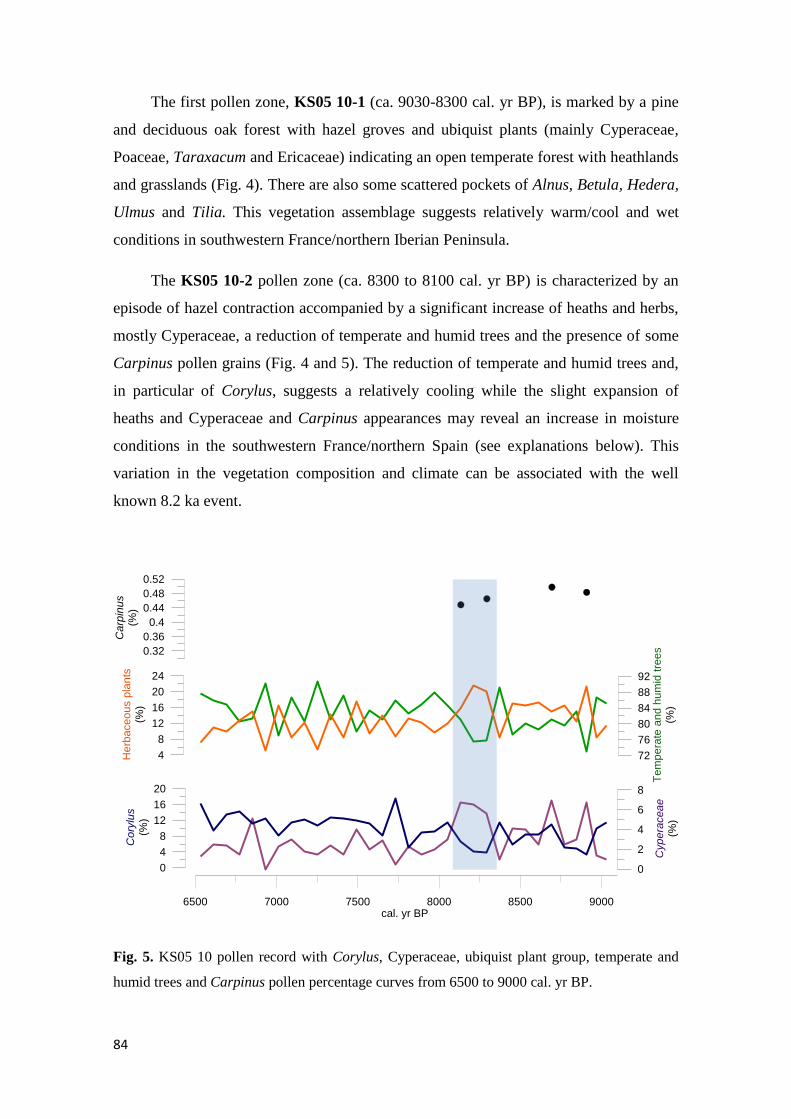
84
The first pollen zone, KS05 10-1 (ca. 9030-8300 cal. yr BP), is marked by a pine
and deciduous oak forest with hazel groves and ubiquist plants (mainly Cyperaceae,
Poaceae, Taraxacum and Ericaceae) indicating an open temperate forest with heathlands
and grasslands (Fig. 4). There are also some scattered pockets of Alnus, Betula, Hedera,
Ulmus and Tilia. This vegetation assemblage suggests relatively warm/cool and wet
conditions in southwestern France/northern Iberian Peninsula.
The KS05 10-2 pollen zone (ca. 8300 to 8100 cal. yr BP) is characterized by an
episode of hazel contraction accompanied by a significant increase of heaths and herbs,
mostly Cyperaceae, a reduction of temperate and humid trees and the presence of some
Carpinus pollen grains (Fig. 4 and 5). The reduction of temperate and humid trees and,
in particular of Corylus, suggests a relatively cooling while the slight expansion of
heaths and Cyperaceae and Carpinus appearances may reveal an increase in moisture
conditions in the southwestern France/northern Spain (see explanations below). This
variation in the vegetation composition and climate can be associated with the well
known 8.2 ka event.
6500 7000 7500 8000 8500 9000cal. yr BP
72
76
80
84
88
92
Te
mp
era
te a
nd
hu
mid
tre
es
(%)
0.32
0.36
0.4
0.44
0.48
0.52
Ca
rpin
us
(%)
4
8
12
16
20
24
He
rba
ce
ou
s p
lan
ts(%
)
0
2
4
6
8
Cyp
era
cea
e(%
)
0
4
8
12
16
20
Co
rylu
s
(%)
Fig. 5. KS05 10 pollen record with Corylus, Cyperaceae, ubiquist plant group, temperate and
humid trees and Carpinus pollen percentage curves from 6500 to 9000 cal. yr BP.
85
Temperate and humid trees contraction during the 8.2 ka event, associated with a
temperature drop of ~0.5-1.5ºC (e.g. Seppä et al., 2007) were detected in many
European records below 61ºN (e.g. Seppä et al., 2007) as far south as the southern
Iberian Peninsula (e.g. Fletcher et al., 2007; Combourieu Nebout et al., 2009).
Evidences of slightly declining of temperate and humid trees and decrease of arboreal
pollen around 8.2 ka cal. BP have been detected in northern Iberian Peninsula and in
particular the Cantabrian region (Penido Vello and Puerto de los Tornos-1, Muñoz
Sobrino et al., 2005; Pozo do Carballal, Muñoz Sobrino et al., 1997; La Roya , Allen et
al., 1996; Lagoa de Lucenza, Muñoz Sobrino et al., 2001 and Lago Enol, Moreno et al.,
2011), the central-western Spanish Pyrenees (El Portalet; González-Sampériz et al.,
2006) and the northwestern Iberian Peninsula (Naughton et al., 2007b).
The particular reduction of hazel trees in the forest cover, as a response to the 8.2
ka event, has also been detected in several regions as in northern Europe (Raigastvere,
Viitna, Rõuge, Ruila in Estonia and Lake Flarken in Sweden; Seppä and Poska, 2004;
Veski et al., 2004; Seppä et al., 2005; 2007), southern-central Europe (Soppensee and
Bibersee in Switzerland and Schleinsee in Germany; Tinner and Lotter, 2001; 2006) and
in northwestern France (Naughton et al., 2007a).
Cyperaceae expansion, around 8.2 ka cal. BP has also been identified in others
pollen diagrams from northern Spain, namely: El Portalet in central-western Spanish
Pyrenees (González-Sampériz et al., 2006) and Puerto de los Tornos-I in eastern
Cantabrian (Muñoz Sobrino et al., 2009). However, there is no agreement on the climate
conditions associated to this change. González-Sampériz et al. (2006) suggest that this
episode was relatively dry while this work and Muñoz Sobrino et al. (2009) points to a
wet phase during the 8.2 ka event. Indeed, Cyperaceae expansion is normally associated
with wet conditions (Dupont et al., 1989; Mighall et al., 2006; Muñoz Rodrigues et al.,
2007) and can be used as a proxy for determine past changes in moisture (Mighall et al.,
2006).
Since Carpinus is considered as a moisture-demanding taxa (de Nascimento et al.,
2009; Pons et al., 1992; Sanchez Goñi et al., 1999), its presence in the KS05 10 pollen
record during the 8.2 ka event further confirms the wet conditions in the area.
Nonetheless, only few zones of northern Spain detect the occasional presence of
Carpinus in their pollen records dispersed along the Holocene period such as in the
86
Cantabrian–Atlantic region including Lago Marinho, Chan do Lamoso, La Piedra
(Ramil-Rego et al., 1998), Urtiaga (Sánchez Goñi, 1992) and Bidasoa basin (Sánchez
Goñi, 1996). Some authors suggest that the sporadic appearances of Carpinus are very
locally confined (Aizpuru and Catalan, 1984; Peñalba, 1994) while others point to the
existence of Pleistocene refugia (Ramil-Rego et al., 1998; Postigo-Mijarra et al., 2010).
In fact some Iberian and France pollen records from the last glacial (Reille and Lowe,
1993; Burjachs and Julia, 1994) and previous interglacial periods (Sánchez Goñi et al.,
1999; 2005) show sporadic occurrences of this taxa suggesting that these areas could
have sustained so far undetected refugia (Rodríguez-Sánchez et al., 2010).
These wet conditions within the 8.2 ka event have been also detected in other
European records such as in the: West-Central-Europe (high lake-levels, Magny et al.,
2003; Magny, 2007), northwestern France (vegetation and quantitative climate
reconstructions, Naughton et al., 2007a), Austrian Central Alps (sedimentological and
biological analysis, Schmidt et al., 2006), Denmark (macrofossil data and pollen
analysis, Hede et al., 2010), Swiss Alps (sedimentological, palynological and
macrofossil record, Haas et al., 1998), and in Switzerland and Germany (pollen and
charcoal analysis, Tinner and Lotter, 2001; 2006).
A minor reduction of deciduous Quercus and gradual contraction of pine
associated with the expansion of other temperate and humid trees including Corylus, the
small spread of Betula, Ulmus, Tilia and Fraxinus excelsior-type and reduction of
ubiquist plants suggesting that the woodland formation became more closed, marks the
KS05 10-3 pollen zone (ca. 8100-6600 cal. yr BP) (Fig. 4). This suggests a slight
warming and the prevalence of moisture conditions when compared with the previous
pollen zone. The first appearance of Fagus, around 7410 cal. yr BP, is detected in the
KS05 10-3 pollen zone. The detection of Fagus pollen prior to its widespread in mid- to
late- Holocene is widely recognized in northern Spain and Pyrenees (e.g. Mallarach et
al., 1986; Costa Tenorio et al. 1990; Montserrat, 1992; Ramil Rego, 1992; Maldonado,
1994; Penãlba, 1994; Uzquiano, 1995; Rodríguez Guitián et al., 1996; Sánchez Goñi,
1996; Costa et al., 1998; Sánchez Goñi and Hannon, 1999; Ramil-Rego et al., 2000;
Muñoz Sobrino, 2001; Gómez-Orellana et al., 2007; Muñoz Sobrino et al., 2009).
87
The next pollen zone, KS05 10-4 (ca. 6600-4550 cal. yr BP) is marked by a mixed
deciduous Quercus forest with Corylus, Alnus, Betula, Ulmus, Tilia and Fraxinus
excelsior-type and a clear decline of pine. Occurrences of Acer, Hedera, Salix and
Fagus became more regular (Fig. 4). This vegetation cover indicates a stable period of
rich and mixed Quercus forest, suggesting milder (reduced seasonality) and humid
climatic conditions.
The KS05 10 record shows the beginning of a continuous presence of Fagus
(phase of arrival, KS05 10-5; 4550-3700 cal. yr BP) followed by its expansion phase
(KS05 10-6; 3700-3300 cal. yr BP), a consolidation phase (KS05 10-7; ca. 3300-1300
cal. yr BP) and its maximum development (KS05 10-8; 1300-400 cal. yr BP). Several
pollen diagrams of the northern Spain, exhibit the same pattern of Fagus development
(e.g. Lagos Altamirano, 1990; Peñalba et al., 1994; von Engelbrechten, 1998; Sánchez
Goñi and Hannon, 1999). Also, the timing of beech expansion in KS05 10 record is in
agreement with that of northern Spain pollen data (Muñoz Sobrino et al., 2009) and of
other Europe records (e.g. Tinner and Lotter 2006; Giesecke et al., 2007; Naughton et
al., 2007a). Pollen zones KS05 10-5 to KS05 10-8 are also marked by the gradual
contraction of pine and oak and the steady increase of ubiquist plants. The beginning of
beech expansion contemporaneous with the onset of oak forest decline as been also
noticed in several Holocene sequences from southwestern France (Reille and Lowe,
1993; Reille and Andrieu, 1995; Reille et al., 2000) and northern Spain (Allen et al.,
1996; Muñoz Sobrino et al., 2009). Moreover, previous studies on past interglacials in
western Iberian Peninsula and in particular, on the possible analogue of the present day
interglacial such as the MIS (Marine Isotopic Stage) 11 shown the presence of Fagus in
the end phase of VIGO interglacial, associated with a decrease of northern hemisphere
summer insolation (Desprat et al., 2005; 2007). The same pattern of Fagus development
is detected during the PONTEVEDRA interglacial within the MIS 9 (Desprat et al.,
2009). The expansion of Fagus is probably driven by a long term gradual cooling,
reduction of seasonality and increase of moisture conditions during the present
interglacial. Similar climatic conditions have been detected by several works on Iberian
Peninsula (Laguna de la Roya; Allen et al., 1996) and in northwestern France
(Naughton et al., 2007a). Tinner and Lotter (2006) also suggested that Fagus expanded
naturally across southern Central Europe in response to gradual climatic changes,
favoured by more humid summer conditions and less extreme seasonality.
88
The beginning of the continuous presence of anthropogenic indicators such as
Juglans, Cerealia, Castanea and Vitis is evident in KS05 10-8 pollen zone (1300-400
cal. yr BP) reflecting the widespread human activity in south-western France and
northern of Spain since ca. 1100 cal. yr BP. This is in agreement to what have been
proposed by Allen et al. (1996). Palynological data from a peat bog in València d'Àneu
(Lleida, NE Iberian Peninsula; Pèlachs et al., 2009) and from Queixa Sierra
(northwestern Iberian Peninsula; Santos et al., 2004) also shows that human impact
became stronger and reaches its maximum activity in this last millennium. The
maximum values of Fagus between ca. 1070 and 850 cal. yr BP might be also related to
human actions by the opening of the forest cover. Since Fagus compete for slightly
opened ground, and exclude other trees when it forms a closed canopy (García Antón et
al., 1997; Negral et al., 1997; Pott, 1997), human activities appear to have provided the
suitable conditions for its expansion during this interval. This final peak of Fagus, was
also detected in the eastern Cantabria at around 1250 cal. yr BP by Muñoz Sobrino et al.
(2009) and in Central Europe by Tinner and Lotter (2006).
In the last pollen zone, KS05 10-9 (last ca. 400 cal. yr BP) (Fig. 4) there is a
strong increase of pine, heathlands and herbaceous plants, mainly Cyperaceae,
Ericaceae, Poaceae and Taraxacum. In contrast, temperate and humid trees exhibit a
strong decline, principally oak and beech woodlands. The substantial reduction of all
trees, except pine, combined with the elevated frequencies of ubiquist plants suggests an
open environment probably resulting of more intense human activity. Evidences for
anthropogenic deforestation exist from at least the 15th
century in the Basque country.
At this time the forests were a key factor in the development of the region because of
the demand of wood for the shipbuilding, as well as for warfare, and the industrial use
of the abundant iron ore together with charcoal (Rodríguez, 2004). Moreover, the
continuous presence of cereal-type and Juglans and the occurrences of Castanea and
Vitis confirm the effect of human disturbance on vegetation. It should be also noted the
increase in Plantago and Olea values, that reflect as well agriculture/arboriculture
activities (e.g. Carrión et al., 2010, and references therein). Pinus re-expansion, which
began at ca. 300 yr BP ago, reflects the reforestations policies that were implemented
with the main aim of preventing the extinction or degradation of the forests (Valdès and
Gil Sánchez, 2001; Desprat et al., 2003; Rodríguez, 2004).
89
4.2. Primary causes of Holocene climate variability in the northern Iberian
Peninsula/southwestern France
4.2.1 Holocene long term climatic changes
A general trend of pine and oak trees decline and the increase of herbaceous
plants reflect a long term cooling in southwestern France/northern Spain between 9000
and 1000 cal. yr BP (Fig. 6). This small-amplitude long-term pine and oak trees
contraction pattern follows the general reduction of mid-latitude summer insolation and
also mimics the general decreasing trend observed in the δ18
O-isotope composition of
the NorthGRIP ice-core (Johnsen et al., 2001; NGRIP Members, 2004; Rasmussen et
al., 2006) and of southwestern Iberian margin Sea Surface Temperature (SST)
(Rodrigues et al., 2009), until at least 1000 cal. yr BP (Fig. 6). The reduction in the
temperate forest coeval with the general decrease in mid-latitude summer insolation has
also been detected in the northwestern France (Naughton et al., 2007a) during the
Holocene, as well as in north and southwestern Iberian Peninsula during previous
interglacial periods (MIS 5, 7, 9 and 11; Desprat et al., 2005; 2007; 2009; Sánchez Goñi
et al., 2005). All these evidences point to an orbital induced long term cooling, which
has been confirmed by climate simulations (e.g. Crucifix et al., 2002; Weber and
Oerlemans, 2003; Renssen et al., 2005).
The gradual replacement of the oak forest by beech in southwestern
France/northern Spain reflects not only the long term cooling pattern but also the
reduction of seasonality and the increase of moisture conditions in mid to late Holocene
(Fig. 6). The reduction of seasonality was probably triggered by the gradual increase of
the precession (Fig. 6) as revealed by the pollen quantitative climate estimates from a
northwestern France shelf core (Naughton et al., 2007a).
These findings support the hypothesis of Magri (1995) and Naughton et al.
(2007a) that Holocene forest decline was mainly controlled by natural processes rather
than human impact as suggested by Iriarte (1997; 2009). However, human disturbance
on vegetation seems to be superimposed since ca. 1000 cal. yr BP.
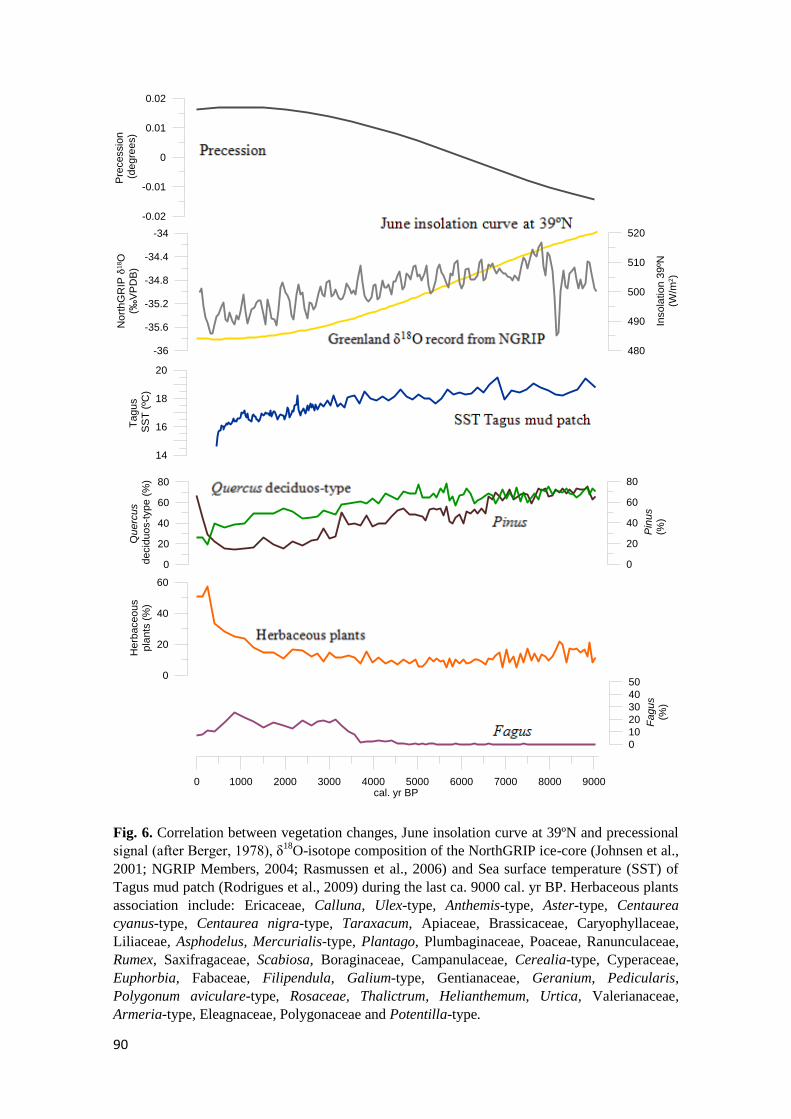
90
0 1000 2000 3000 4000 5000 6000 7000 8000 9000cal. yr BP
0
20
40
60
80
Pin
us
(%)
0
20
40
60
80
Qu
erc
us
de
cid
uo
s-t
yp
e (
%)
480
490
500
510
520
Inso
latio
n 3
9ºN
(W/m
2)
0
20
40
60
He
rba
ce
ou
s
pla
nts
(%
)
-36
-35.6
-35.2
-34.8
-34.4
-34
No
rth
GR
IP
18O
(‰V
PD
B)
-0.02
-0.01
0
0.01
0.02
Pre
cessio
n
(de
gre
es)
0
10
20
30
40
50
Fag
us
(%)
14
16
18
20
Tag
us
SS
T (
ºC)
Fig. 6. Correlation between vegetation changes, June insolation curve at 39ºN and precessional
signal (after Berger, 1978), δ18
O-isotope composition of the NorthGRIP ice-core (Johnsen et al.,
2001; NGRIP Members, 2004; Rasmussen et al., 2006) and Sea surface temperature (SST) of
Tagus mud patch (Rodrigues et al., 2009) during the last ca. 9000 cal. yr BP. Herbaceous plants
association include: Ericaceae, Calluna, Ulex-type, Anthemis-type, Aster-type, Centaurea
cyanus-type, Centaurea nigra-type, Taraxacum, Apiaceae, Brassicaceae, Caryophyllaceae,
Liliaceae, Asphodelus, Mercurialis-type, Plantago, Plumbaginaceae, Poaceae, Ranunculaceae,
Rumex, Saxifragaceae, Scabiosa, Boraginaceae, Campanulaceae, Cerealia-type, Cyperaceae,
Euphorbia, Fabaceae, Filipendula, Galium-type, Gentianaceae, Geranium, Pedicularis,
Polygonum aviculare-type, Rosaceae, Thalictrum, Helianthemum, Urtica, Valerianaceae,
Armeria-type, Eleagnaceae, Polygonaceae and Potentilla-type.
91
4.2.2 Sub-orbital climate variability
Superimposed on the orbitally induced Holocene long-term cooling, sub-orbital
climatic oscillations were detected in southwestern France/northern Iberian Peninsula
during the last ca. 9000 cal. yr BP.
The 8.2 ka event
The most extreme short-lived Holocene episode detected between 8.3 and 8.1 ka
in KS05 10 pollen record is marked by the contraction of temperate trees including
hazel, the synchronous expansion of herbaceous plants including cyperaceous plants
and the presence of hornbeam (Carpinus), suggesting relatively cool and wet
conditions. This episode is associated with the well-known 8.2 ka event (Fig. 7).
These vegetation changes are contemporaneous with the decrease of the δ18
O-
isotope composition recorded in the NorthGRIP record (Johnsen et al., 2001; NGRIP
Members, 2004; Rasmussen et al., 2006) and with the southwestern Iberian margin
cooling of about 1-2 °C (Rodrigues et al., 2009) (Fig. 7). This event has been also
detected in several other records such as: in the mid- and high-latitudes of the North
Atlantic (e.g. Marchal et al., 2002; Knudsen et al., 2004; Ellison et al., 2006), in
northern and central Europe (e.g. von Grafenstein et al., 1998; Nesje and Dahl, 2001;
Tinner and Lotter, 2001; 2006; Hammarlund et al., 2003, Magny et al., 2003; Veski et
al., 2004; Seppä et al., 2007), in southern Europe (including Iberian Peninsula and
France) (Muñoz Sobrino et al., 2005; 2009; González-Sampériz et al., 2006; Fletcher et
al., 2007; Naughton et al. 2007a; b; Combourieu Nebout et al., 2009; Moreno et al.,
2011) and other Greenland ice cores records (GRIP, Dye-3, Renland, NorthGRIP and
GISP2 ice cores) (Alley et al., 1997; Johnsen et al., 2001; NGRIP Members, 2004;
Rasmussen et al., 2006; Thomas et al., 2007).
This cooling was triggered by a succession of events which began with the
catastrophic freshwater influxes from the proglacial Laurentide lakes (lakes Agassiz and
Ojibway) into the Hudson Bay at ca. 8470 cal. yr BP (Fig. 7) (e.g. Barber et al., 1999;
Teller et al., 2002; Clarke et al., 2004). The introduction of large amounts of freshwater
into the North Atlantic (Alley et al., 1997; Clark et al., 2001) affected the thermohaline
circulation (THC) as showed by model simulations (e.g. Wiersma and Renssen, 2006;
Wiersma et al., 2006) and reduced the formation of North Atlantic Deep Water
92
(NADW), causing a weakening in the conveyor belt (e.g. Barber et al., 1999;
Rahmstorf, 2002; Renssen et al., 2001; LeGrande et al., 2006; Wiersma and Renssen,
2006; Wiersma et al., 2006; Li et al., 2009). Consequently, the ocean's heat transport
was affected (decreased) and the North Atlantic and Europe underwent a significant
cooling. Paleoclimatic records from the North Atlantic also reveal changes in the deep
ocean circulation (Fig.7) (Oppo et al., 2003; Hall et al., 2004; Piotrowski et al., 2004;
Ellison et al., 2006; Flesche Kleiven et al., 2008).
Other hypotheses have been invoked for explain this cooling episode. A reduction
in solar irradiance (Bond et al., 2001; van Geel et al., 2003) could have modified the
behaviour of the oceanic circulation (Weber et al., 2004; Renssen et al., 2006). Also,
and based on western-central Europe lake levels data Magny and Bégeot (2004) suggest
that the solar activity might have played an essential role in amplifying (or damping) the
potential effects on climate of freshwater outbursts events. Nevertheless, the fact that
this event is more prominent in the North Atlantic region; that took place after
following outbursts flooding episodes; and that the existing similarities between
reconstructed anomaly patterns and patterns expected following a North Atlantic
freshening appears to favour the freshwater pulse mechanism as the primary cause of
the 8.2 event (Alley and Ágústsdóttir, 2005). In addition, corroborative modeling
studies also stresses that low solar output can be hardly considered as a main triggering
factor for abrupt climate events (Ganopolsky et al., 2001; Goosse et al., 2002; Bauer et
al., 2003).

93
6000 6500 7000 7500 8000 8500 9000cal. yr BP
72
76
80
84
88
92
Te
mp
era
te a
nd
hu
mid
tre
es (
%)
17.6
18
18.4
18.8
19.2
19.6
Ta
gus m
ud
pa
tch
SS
T(º
C)
4
8
12
16
20
24
He
rba
ce
ou
s p
lan
ts(%
)
-35.6
-35.2
-34.8
-34.4
No
rth
GR
IP
18O
(‰ V
PD
B)
0
2
4
6
8
Cyp
era
ce
ae
(%)
0
4
8
12
16
20
Co
rylu
s(%
)
14
16
18
20
22
Co
re M
D9
9-2
25
1
SS
me
an
(
m)
Mid-European high-lake
levels (Magny, 2007)
Catastrophic final drainage episodes from the proglacialLaurentide lakes into the Hudson Bay (Barber et al., 1999)
Fig. 7. Correlation between KS05 10 vegetation changes, δ18
O-isotope composition of the
NorthGRIP ice-core (Johnsen et al., 2001; NGRIP Members, 2004; Rasmussen et al., 2006), Sea
Surface Temperature in the Tagus mud patch (Rodrigues et al., 2009), mean grain size
(paleocurrent flow speed proxy, higher mean indicates stronger flow of the depositing current
and vice versa; Ellison et al., 2006), the catastrophic final drainage episodes from the proglacial
Laurentide lakes into the Hudson Bay at ca. 8470 cal. yr BP (error range of 8160–8740 cal. yr
BP; Barber et al., 1999) and episodes of higher lake level in west-central Europe (Magny,
2007), during the 8.2 ka cooling event.
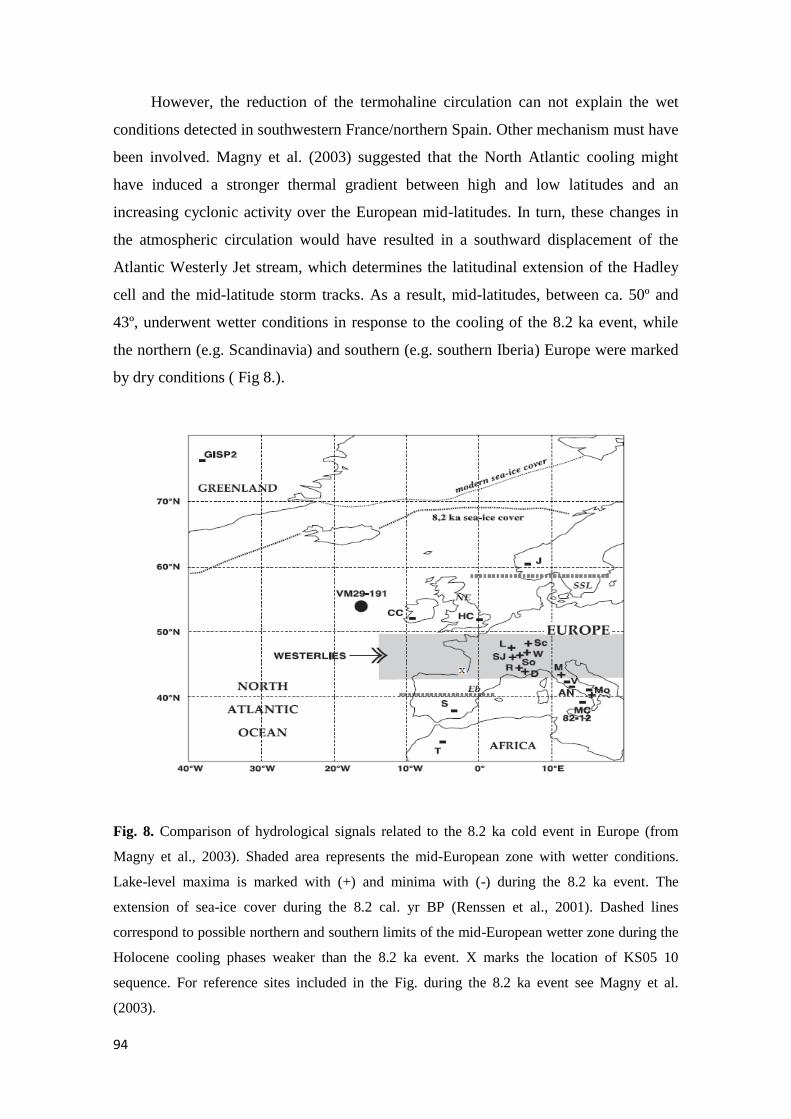
94
However, the reduction of the termohaline circulation can not explain the wet
conditions detected in southwestern France/northern Spain. Other mechanism must have
been involved. Magny et al. (2003) suggested that the North Atlantic cooling might
have induced a stronger thermal gradient between high and low latitudes and an
increasing cyclonic activity over the European mid-latitudes. In turn, these changes in
the atmospheric circulation would have resulted in a southward displacement of the
Atlantic Westerly Jet stream, which determines the latitudinal extension of the Hadley
cell and the mid-latitude storm tracks. As a result, mid-latitudes, between ca. 50º and
43º, underwent wetter conditions in response to the cooling of the 8.2 ka event, while
the northern (e.g. Scandinavia) and southern (e.g. southern Iberia) Europe were marked
by dry conditions ( Fig 8.).
Fig. 8. Comparison of hydrological signals related to the 8.2 ka cold event in Europe (from
Magny et al., 2003). Shaded area represents the mid-European zone with wetter conditions.
Lake-level maxima is marked with (+) and minima with (-) during the 8.2 ka event. The
extension of sea-ice cover during the 8.2 cal. yr BP (Renssen et al., 2001). Dashed lines
correspond to possible northern and southern limits of the mid-European wetter zone during the
Holocene cooling phases weaker than the 8.2 ka event. X marks the location of KS05 10
sequence. For reference sites included in the Fig. during the 8.2 ka event see Magny et al.
(2003).
95
We propose that the mentioned large scale atmospheric mechanism associated
with more storms crossing the North Atlantic region mid-latitudes might be related with
the absence of blocking episodes, more specifically a prevalence of strong zonal flow.
This situation could explain the observed wet conditions in southwestern
France/northern Spain during the 8.2 ka event. The blocking episodes correspond to an
atmospheric setting of predominantly meridional circulation that favours the formation
of strong slow-moving or stationary anticyclones (blocking events) over the European
mid-latitudes (Treidl et al., 1981). Blocking events are related with the blocking of the
mid-latitude westerly Jet stream, which is usually located over the Atlantic at around
50ºN latitude. These atmospheric events are characterised by enhanced meridional
component of the mid-troposphere circulation, clearly visible up and downstream of the
British Isles, and by a configuration that usually involves a branching of the Jet stream
into two divergent branches (Fig. 9a) (Rex 1950a,b; Treidl et al. 1981, Trigo et al.,
2004b). Conversely, a situation of strong zonal flow (non-blocking events) is
characterised by a strengthening of the zonal circulation (Fig. 9b) (Trigo et al., 2004b).
In the Euro-Atlantic sector, Trigo et al. (2004b) through a 40-year (1958–97)
consistent dataset from NCEP/NCAR showed that the precipitation rate variability
(Fig.11) is controlled by synoptic low pressure mid-latitude systems that induce
precipitation, often known as mid-latitude cyclones. A simple proxy variable to depict
these disturbances is given by the surface vorticity field that is related to the favoured
locations of associated cyclones (Fig.10). In the studied region, during blocking
situations there is a lack cyclones centres crossing the Northern Europe, including the
western France, and a small number travelling in the northern Iberian Peninsula
(Fig.10a), and drier than normal conditions in all western Europe, including the northern
Iberian Peninsula and southwestern France (Fig. 11a) (Trigo et al., 2004b). Conversely,
months dominated by strong zonal flow (i.e. no blocking events) are characterised by a
significant increase of cyclones (Fig.10b) that lead to wetter than normal anomalies in
western Europe, including the northern Iberian Peninsula and southwestern France
(Fig.11b) (Trigo et al., 2004b). The anomalies of the precipitation rate associated with
non-blocking events in the study region during the period 1958–1997, ranges from ~0.3
to 1.5 mm/day (northern Iberian Peninsula and western France, respectively) for the 90-
day winter period (Trigo et al., 2004b).
96
Since individual blocking episodes can persist for several weeks, a small number
of blocking episodes might influence the climate characteristics of one winter (Stein,
2000). In this sense, we can hypothesize that past oscillations in the predominance and
spatial distribution of blocking episodes (and their non-blocking counterpart; strong
zonal flow) could explain changes in the precipitation rate of the studied region
(prevalence of strong zonal flow situation) during the 8.2 ka event, as well as support
the hydrological tripartite division of Europe (dry-wet-dry) during this event described
by Magny et al. (2003) and Magny (2007).
In agreement with the hypothesis of moister conditions during the 8.2 ka event in
the studied region, higher precipitation rate can be appropriately related to increased
cloudiness and the consequent decreasing of incoming sunlight. Since Corylus is a light-
demanding tree (Bradshaw and Hannon, 2004), this cloudiness effect may have
contributed to the significant hazel decrease by affecting negatively populations growth
and/or pollen productivity.
Fig. 9. The mean 500 hPa geopotential height (gpm) anomalies for all winter a) blocking, and,
b) non-blocking (strong zonal flow) episodes, with a minimum duration of 10 days (from Trigo
et al., 2004b). The shading shows the corresponding 850 hPa temperature field (ºC); c)
Differences between the mean 500 hPa geopotential height (gpm) composites and the
corresponding 850 hPa (ºC) temperature composites (represented only if significant at the 1%
level).
97
Fig. 10. Number of cyclones per winter,
detected per 5º x 5º area normalised for 50ºN,
for a) blocking, b) non-blocking, and c) their
difference (from Trigo et al., 2004b).
Fig. 11. Anomalies of the precipitation rate
(mm/day) for winter composites of a)
blocking episodes, b) non-blocking episodes,
and c) their difference (represented only if
significant at the 5% level). The arrows show
the respective anomaly of the 2.5 m wind field
(ms–1
) (adapted from Trigo et al., 2004b).
Discrete millennial scale climatic events after the 8.2 ka event
After the strong short-term climate anomaly at ca. 8.2 ka, millennial scale climatic
events became less perceptible. The application of standard spectral analysis such as the
widely used Fast Fourier analysis can lead to misleading results because the power
spectrum associated with the major periodicities can vary with time. Here, we decided
to apply a more robust technique that can depict changes of periodicities trough time,
i.e. wavelet analyses revealing that Corylus percentages exhibits prominent
98
concentrations of variance centered at 512 years (Fig. 12) from 9000 to 3000 cal. yr BP.
This climatic cyclicity might be related to that of ~500-yr recognized in several the
North Atlantic paleoclimate records (e.g. Chapman and Shackleton, 2000; Bond et al.,
2001; Yu and Ito, 2002) and over Greenland (Stuiver and Braziunas, 1993; Stuiver et
al., 1995) for the mid-late Holocene. If so, these findings could suggest that Corylus
trees in northern Iberian Peninsula/southwestern France may have responded to the
same climate forcing mechanisms of the mentioned studies, such as changes in solar
irradiance (e.g. Bond et al., 2001) and perturbation of the North Atlantic circulation
(e.g. Chapman and Shackleton, 2000). Nevertheless, additional palaeoclimate records
with sufficient resolution and/or chronological control are necessary to investigate this
connection.
Fig. 12. Wavelet analysis of the hazel percentages for the last ca. 9000 yr. Wavelet power
spectra illustrate the change in concentration of spectral power with time in Corylus values.
Black line defines power spectrum significant at 90% red noise spectrum. Dashed lines define
the cone of influence where the spectrum has no significance at all. Analysis undertaken using
interactive software available at http://paos.colorado.edu/research/wavelets/.
99
5. CONCLUDING REMARKS AND FUTURE RESEARCH
High-resolution pollen analysis performed on the KS05 10 shelf core reflects the
paleoclimatic evolution and vegetation’s history over the southwestern France/northern
Spain for the last ca. 9000 years.
The major findings of this study can be summarized as follows:
The gradual decline of some temperate trees, namely pine and deciduous
Quercus, together with the steady increase of herbaceous plants follows the general
long-term cooling trend driven by mid latitude summer insolation until at least 1000
cal. yr BP. The gradual decrease of deciduous Quercus and steady increase of Fagus
during the mid-Holocene might reflect besides the long term cooling, an increase in
moisture conditions and a decrease of seasonality;
The contraction of Corylus together with synchronous expansion of herbaceous
plants including Cyperaceae and the presence of Carpinus, suggesting cool and wet
conditions was detected between 8.3 and 8.1 ka and is associated with the well known
8.2 ka event;
The particular cool conditions associated with the 8.2 ka event were triggered by
a succession of events: a) catastrophic drainage episodes of the proglacial Laurentide
lakes b) freshwater input in the North Atlantic region and c) consequent perturbation
of the thermohaline circulation which preclude the transfer of warm and wet
conditions to the southwestern France/northern Spain;
The particular wet conditions associated with the 8.2 ka event were triggered by
the North Atlantic cooling which produce an increase of the thermal gradient between
high and low latitudes favouring the southward displacement of the Atlantic Westerly
Jet in conjunction with the prevalence of strong zonal flow in the studied region;
Corylus (light-demanding tree) decline can also be explained by the increase of
clouds (high precipitation) which may have contributed to a reduction of incoming
sunlight;
100
After ca. 9000 cal. yr BP, Corylus changes occurred every 500 years until 3000
cal. yr BP;
The climate variability over the last millennium was possibly masked by human
disturbance.
This study highlights the need for Holocene multi-proxy records with high
temporal resolution and robust chronology from the North Atlantic region and Europe,
which will: a) provide an accurate reconstruction of the vegetation’s response to the
global orbital induced long-term cooling and to millennial-scale climate variability of
the North-Atlantic, including oceanic and atmospheric dynamics; and b) allow the
identification of the nature, timing and causes of climate oscillations and to determine
how widespread, systematic and abrupt they may have been. In this sense, the results of
this master thesis will be integrated with the existing high resolution data from several
key geographic sites of the Atlantic realm included in the CLIMHOL project “Holocene
climatic variability in the North Atlantic and adjacent landmasses: land-sea direct
correlation” (reference PTDC/AAC-CLI/100157/2008).
ACKNOWLEDGEMENTS
This research was funded through the project “Holocene climatic variability in the
North Atlantic and adjacent landmasses: land-sea direct correlation” CLIMHOL
(reference PTDC/AAC-CLI/100157/2008), which was approved for financing by the
Directive Commission of the COMPETE and by the FCT (Fundação para a Ciência e a
Tecnologia). R.T. was partially supported by The Spanish Ministry of Science and
Innovation project PALEONAO (CGL2010-15767). The authors express their sincere
thanks to J. Noiva for his help with the figure drawings and to Marie Helene Castera
and Warley Soares for palynological treatments.
101
REFERENCES
Abrantes, F., S. Lebreiro, T. Rodrigues, I. Gil, H. Bartels-Jonsdottir, P. Oliveira, C.
Kissel, and J. G. O., 2005. Shallow-marine sediment cores record climate variability
and earthquake activity off Lisbon (Portugal) for the last 2000 years. Quaternary
Science Reviews, 24, 2477-2494
Aizpuru, I. and Catalán, P., 1984. Presencia del Carpe en la Península Ibérica. Anales
Jard. Bot. Madrid 41 (1): 143-146.
Allen, J.R., Huntley, B. and Watts, W., 1996. The vegetation and climate of northwest
Iberia over the last 14000 yr. Journal of Quaternary Science 11 (2), 125–147.
Alley, R.B. and Agustsdottir, A.M., 2005. The 8 k event: cause and consequences of a
major Holocene abrupt climate change. Quaternary Science Reviews, 24: 1123–
1149.
Alley, R.B., Marotzke, J., Nordhaus, W.D., Overpeck, J.T., Peteet, D.M., Pielke, R.A.,
Pierrehumbert, R.T., Jr, Rhines, P.B., Stocker, T.F., Talley, L.D. and Wallace, J.M.,
2003. Abrupt climate change. Science 299, 2005–10.
Alley, R.B., Mayewski, P.A., Sowers, T., Stuiver, M., Taylor, K.C. and Clark, P.U.,
1997. Holocene climatic instability: a prominent, widespread event 8200 yr ago.
Geology, 25: 483-486.
Andersen, A., Koç, N., Jennings, A. and Andrews, J.T., 2004. Nonuniform response of
the major surface currents in the Nordic Seas to insolation forcing: implications for
the Holocene climate variability. Paleoceanography 19, 2003, DOI:
10.1029/2002PA000873.
Aravena, G., Villate, F., Iriarte, A., Uriarte, I. and Ibáñez, B., 2009. Influence of the
North Atlantic Oscillation (NAO) on climatic factors and estuarine water
temperature on the Basque coast (Bay of Biscay): comparative analysis of three
seasonal NAO indices. Continental Shelf Research 29, 750 – 758.
Baldini, J. U., McDermott, F. and Fairchild, I. J., 2002. Structure of the 8200-year cold
event revealed by a speleothem trace element record. Science 296, 2203–2206.
Barber, D.C., Dyke, A., Hillaire-Marcel, C., Jennings, A.E., Andrews, J.T., Kerwin,
M.W., Bilodeau, G., McNeely, R., Southon, J., Morehead, M.D. and Gagnon, J.-M.,
1999. Forcing of the cold event of 8,200 years ago by catastrophic drainage of
Laurentide lakes. Nature, 400: 344-348.
Barnston, A.G. and Livezey, R. E., 1987. Classification, Seasonality and Persistence
of Low-Frequency Atmospheric Circulation Patterns. Mon. Wea. Rev. 115, 1083-
1127.
Baroni, C. and Orombelli, G., 1996. The Alpine ‘Iceman’ and Holocene climatic
change. Quaternary Research, 46: 78– 83.
Bauer, E., Claussen, M., Brovkin, V., and Hunerbein, A., 2003. Assessing climate
forcings of the Earth system for the past millennium. Geophys. Res. Lett., 30 (6),
1276, doi: 10.1029/2002GL016639.
102
Bennett, K.D. and Birks, H.J.B., 1990. Postglacial history of alder (Alnus glutinosa
(L.) Gaertn.) in the British Isles. Journal of Quaternary Science 5 (2), 123-133.
Bennett, K.D., 2000. Psimpoll and pscomb: computer programs for data plotting and
analysis. Uppsala, Sweden: Quaternary Geology, Earth Sciences, Uppsala
University. Software available on the internet at http://www.kv.geo.uu.se.
Berger, A., 1978. Long-term variations of daily insolation and Quaternary climatic
changes. Journal of the Atmospheric Sciences 35, 2362–67.
Blanco Castro E., Casado González M.A., Costa Tenorio M., Escribano Bombín R.,
García Antón M., Génova Fuster M., Gómez Manzaneque F., Moreno Sáiz J.C.,
Morla Juaristi C., Regato Pajares P. and Sáiz Ollero H., 1997. Los Bosques ibericos:
una Interpretación Geobotánica. Editorial Planeta, 572 p., Barcelona.
Bond, G., Kromer, B., Beer, J., Muscheler, R., Evans, M., Showers, W., Hoffmann, S.,
Lotti-Bond, R., Hajdas, I. and Bonani, G., 2001. Persistent solar influence on North
Atlantic climate during the Holocene. Science 294, 2130–36.
Bond, G., Showers, W., Cheseby, M., Lotti, R., Almasi, P., deMenocal, P., Priore, P.,
Cullen, H., Hajdas, I. and Bonani, G.l., 1997. A pervasive millenial-scale cycle in
North Atlantic Holocene and Glacial Climates. Science, 278: 1257-1266.
Bottema, S. and van Straaten, L.M.J.U., 1966. Malacology and palynology of two
cores from the Adriatic sea floor. Marine Geology 4, 553–64.
Bradshaw, R.H.W. and Hannon, G.E., 2004. The Holocene structure of north-west
European temperate forest induced from palaeoecological data. In Honnay, O.,
Verheyen, K., Bossuyt, B. and Hermy, M., editors, Forest biodiversity: lessons from
history for conservation. CABI, 11–25.
Broecker, W.S., 2003. Does the trigger for abrupt climate change reside in the ocean
or in the atmosphere? Science, v. 300, p. 1519–1522.
Burjachs, F., and Julia, R., 1994. Abrupt climatic changes during the last glaciation
based on pollen analysis of the Abric Romani, Catalonia, Spain. Quaternary
Research, 42, 308}315.
Carrión, J.S., Fernández, S., González-Sampériz, P., Gil-Romera, G., Badal, E.,
Carrión-Marco, Y., López-Merino, L., López-Sáez, J.A., Fierro, E. and Burjachs, F.,
2010. Expected trends and surprises in the Lateglacial and Holocene vegetation
history of the Iberian Peninsula and Balearic Islands. Review of Palaeobotany and
Palynology 162 (3), 458-475.
Castaing, P., Froidefond, J.M., Lazure, P.,Weber, O., Prud'homme, R. and Jouanneau,
J.M., 1999. Relationship between hydrology and seasonal distribution of suspended
sediments on the continental shelf of the Bay of Biscay. Deep-Sea Research II 46,
1979–2001.
Cescatti A. and Piutti E., 1998. Silvicultural alternatives, competition regime and
sensitivity to climate in a European beech forest. Forest Ecology and Management
102, 213-223.
103
Chapman, M.R. and Shackleton, N.J., 2000. Evidence of 550-year and 1000-year
cyclicities in North Atlantic circulation patterns during the Holocene. Holocene.
2000; 10(3): 287-291.
Chmura, G.L. and Eisma, D., 1995. A palynological study of surface and suspended
sediment on a tidal flat: implications for pollen transport and deposition in coastal
waters. Marine Geology 128, 183–200.
Clark, P.U., Marshall, S.J., Clarke, G.K.C., Hostetler, S.W., Licciardi, J.M. and Teller,
J.T., 2001. Freshwater forcing of abrupt climate change during the last glaciation.
Science 293, 283–87.
Clarke, G.K.C., Leverington, D.W., Teller, J.T. and Dyke, A.S., 2004. Paleohydraulics
of the last outburst flood from glacial Lake Agassiz and the 8200 BP cold event.
Quaternary Science Reviews 23, 389–407.
Combourieu Nebout, N., Peyron, O., Dormoy, I., Desprat, S., Beaudouin, C., Kotthoff,
U. and Marret, F., 2009. Rapid climatic variability in the west Mediterranean during
the last 25,000 years from high resolution pollen data. Climate of the past, 5, 503-
521.
Costa T. M., García Antón, M., Morla Juaristi, C. and Sainz Ollero, H., 1990. La
evolución de los bosques de la Península Ibérica: una interpretación basada en datos
paleobiogeográficos. Ecología, Fuera de Serie 1, 31–58.
Costa T., M., Morla, C. and Sainz, H., 1998. Los bosques ibéricos. Una interpretación
geobotánica. Editorial Planeta, Barcelona.
Costa Tenorio, M., García Antón, M., Morla, C. and Sainz Ollero, H., 1990. La
evolución de los bosques de la Península Ibérica: Una interpretación basada en datos
paleobiogeográficos. Ecología, fuera de serie 1, 31–58.
Crucifix, M., Loutre, M.-F., Tulkens, P., Fichefet, T. and Berger, A., 2002. Climate
evolution during the Holocene: a study with an Earth system model of intermediate
complexity. Climate Dynamics 19, 43–60.
Cubasch, U., Meehl, G.A., Boer, G.J., Stouffer, R.J., Dix, M., Noda, A., Senior, C.A.,
Raper, S.C.B.and Yap, K.S., 2001. Projections of future climate change. In: Climate
Change 2001: The Scientific Basis: Contribution of Working Group I to the Third
Assessment Report of the Intergovernmental Panel on Climate Change [J.T.
Houghton, Y. Ding, D.J. Griggs, M. Noguer, P.J. Van der Linden, X. Dai, K.
Maskell and C.A. Johnson (Eds.)], pp.526-582 Cambridge University Press
(Cambridge, New York).
Dansgaard, W., Johnsen, S. J., Clausen, H. B., Dahl-Jensen, D., Gundestrup, N.
Hammer, S., C. U., Hvidberg, C. S., Steffensen, J. P., Sveinbjornsdottir, A. E.,
Jouzel, J. and Bond, G., 1993. Evidence for general instability of past climate from a
250-kyr ice-core record. Nature, 364 (6434), 218-220.
Davis, B.A.S. and Stevenson, A.C., 2007. The 8.2 ka event and early-mid Holocene
forests, fires and flooding in the Central Ebro Desert, NE Spain. Quaternary Science
Reviews 26, 1695–1712.
104
Davis, B.A.S., Brewer, S., Stevenson, A.C., Guiot J. and Data Contributors, 2003. The
temperature of Europe during the Holocene reconstructed from pollen data.
Quaternary Science Reviews 22, 1701–16.
de Nascimento, L., Willis, K.J., Ferna´ndez-Palacios, J.M., Criado, C. & Whittaker,
R.J. (2009) The long-term ecology of the lost forests of La Laguna, Tenerife (Canary
Islands). Journal of Biogeography, 36, 499–514.
de Vernal, A., Henry, M. and Bilodeau, G., 1996. Techniques de préparation et
d’analyse en micropaléontologie. In Les cahiers du GEOTOP 3. Département des
Sciences de la terre. Québec University, 16–27. Retrieved 10 January 2012 from
http://www.geotop.uqam.ca/index.php?option=com_docman&task=cat_view&gid=5
6&Itemid=98.
Delworth, T. L. and Dixon, K. W., 2006. Have anthropogenic aerosols delayed a
greenhouse gas-induced weakening of the North Atlantic thermohaline circulation?
Geophys. Res. Lett., 33, L02606, doi:10.1029/2005GL024980
Desprat, S., 2005. Réponses climatiques marines et continentales du Sud-Ouest de
l’Europe lors des derniers interglaciaires et des entrées en glaciations. PhD Thesis,
Bordeaux University, 282 pp.
Desprat, S., Sánchez Goñi, M. F., McManus, J. F., Duprat, J., and Cortijo, E., 2009.
Millennial-scale climatic variability between 340 000 and 270 000 years ago in SW
Europe: evidence from a NW Iberian margin pollen sequence. Clim. Past, 5, 53–72,
2009, http://www.clim-past.net/5/53/2009/.
Desprat, S., Sánchez Goñi, M.F., Naughton, F., Turon, J.-L., Duprat, J., Malaizé, B.
and Peypouquet, J.-P., 2007. Climate variability of the last five isotopic interglacials
from direct land–sea ice correlation. In Sirocko, F., Litt, T., Claussen, M. and
Sánchez Goñi, M.F., editors, Climate of past interglacials. Developments in
Quaternary Sciences, 7. Elsevier, 277–88.
Desprat, S., Sánchez Goñi, M.F., Turon, J.-L., Duprat, J., Malaizé, B. and Peypouquet,
J.-P., 2006. Climatic variability of Marine Isotope Stage 7: direct land–sea-ice
correlation from a multiproxy analysis of a northwestern Iberian margin deep-sea
core. Quaternary Science Reviews 25, 1010–26.
Desprat, S., Sánchez Goñi, M.F., Turon, J.-L., McManus, J.F., Loutre, M.F., Duprat,
J., Malaizé, B., Peyron, O. and Peypouquet, J.-P., 2005. Is vegetation responsible for
glacial inception during periods of muted insolation changes? Quaternary Science
Reviews 24, 1361–74.
Desprat, S., Sánchez-Goñi, M.F. and Loutre, M.-F., 2003. Revealing climatic
variability of the last three millennia in northwestern Iberia using pollen influx data.
Earth and Planetary Science Letters 213, 63–78.
Dupont, L. and Wyputta, U., 2003. Reconstructing pathways of aeolian pollen
transport to the marine sediments along the coastline of SW Africa. Quaternary
Science Reviews, 22, 157-174.
Dupont, L.M., Beug H.-J., Stalling H. and Tiedemann, R., 1989. First palynological
results from site 658 at 21°N off northwest Africa: pollen as climate indicators. In
105
Ruddiman, W., Sarnthein, M., et al., 1989. Proceedings of the Ocean Drilling
Project, Scientific Results v. 108, p. 93-111.
Ellison, C.R.W., Chapman, M.R. and Hall, I.R., 2006. Surface and deep ocean
interactions during the cold climate event 8200 years ago. Science 312, 1929–32.
EMODnet (European Marine Observation and Data Network) Home Page, Retrieved
11 Aphril 2012 from http://www.emodnet-hydrography.eu. The bathymetry is
derived from the Digital Bathymetry as produced in the EMODNet Hydrography -
Seabed Mapping projects by a European consortium under a contract with the EU
DG MARE.
Farr, T.G., Rosen, P.A., Caro, E., Crippen, R., Duren, R., Hensley, S., Kobrick, M.,
Paller, M., Rodriguez, E., Roth, L., Seal, D., Shaffer, S., Shimada, J., Umland, J.,
Werner, M., Oskin, M., Burbank, D. and Alsdorf, D., 2007. The Shuttle Radar
Topography Mission. Review in Geophysics, v. 45, n. 2, p. 21-35.
Ferrer, L., Fontán, A., Mader, J., Chust, G., González, M., Valencia, V., Ad, Uriarte
and Collins, M.B., 2009. Low-salinity plumes in the oceanic region of the Basque
Country. Continental Shelf Research 29, 970–984.
Flesche Kleiven, H., Kissel, C., Laj, C., Ninnemann, U. S., Richter, T. O., and Cortijo,
E., 2008. Reduced North Atlantic Deep Water Coeval with the Glacial Lake Agassiz
Freshwater Outburst, Science, 319, 62–64.
Fletcher, W.J., Boski, T. and Moura, D., 2007. Palynological evidence for
environmental and climatic change in the lower Guadiana valley, Portugal, during
the last 13000 years. The Holocene 17: 481–494.
Frouin, R., Fiuza, A.F.G., Ambar, I. and Boyd, T., 1990. Observations of a Poleward
surface current off the coasts of Portugal and Spain during winter. Journal of
Geophysical Research 95, 679–681.
Ganopolsky, A., Petoukhov, V.K., Rahmstorf, S., Brovkin, V., Claussen, M., Eliseev,
A. and Kubatzki, C., 2001. CLIMBER-2: a climate system model of intermediate
complexity. Part II: Sensitivity experiments. Climate Dynamics 17, 735-51.
García Antón, F., Franco Mújica, F., Maldonado, J., Morla Jauristi, C. and Sainz
Ollero, H., 1997. New data concerning the evolution of the vegetation in the Lillo
pinewood (León, Spain). Journal of Biogeography 24 (9), 29–934.
García-Amorena, I., Morla, C., Rubiales, J.M. and Gómwz, F., 2008. Taxonomic
composition of the Holocene forests of the northern coast of Spain, as determined
from their macroremains. The Holocene (18,5), 819-829.
García-Antón, M., Gil Romera, G., Pagés, J.L. and Alonso Millán, A., 2006. The
Holocene pollen record in the Villaviciosa Estuary (Asturias, North of Spain) in
relation to changes in sea level. Palaeogeography, Palaeoclimatology, Palaeoecology
237, 280–292.
García-Soto, C., 2004. Prestige oil spilland Navidad flow. Journal of the Marine
Biological association of the UK 84 (02), 297–300.
106
García-Soto, C., Pingree, R.D. and Valdés, L., 2002. Navidad development in the
southern Bay of Biscay: climate change and swoddy structure from remote sensing
and in situ measurements. Journal of Geophysical Research, 107:3118
doi:10.1029/2001JC001012
Gardner, A.R. and Willis, K.J., 1999. Prehistoric farming and the postglacial
expansion of beech and hornbeam: a comment on Küster. Holocene 9(1), 119–121.
Garmendia, M., Revilla, M., Bald, J., Franco, J., Laza-Martínez, A., Orive, E., Seoane,
S., Valencia, V. and Borja, Á., 2010. Phytoplankton communities and biomass size
structure (fractionated chlorophyll "a"), along trophic gradients of the Basque coast
(northern Spain). Biogeochemistry.
Giesecke, T., Bennett, K.D., Birks, H.J.B., Bjune, A.E., Bozilova, E., Feurdean, A.,
Finsinger, W., Froyd, C., Pokorný, P., Rösch, M., Seppä, H., Tonkov, S., Valsecchi,
V. and Wolters, S., 2011. The pace of Holocene vegetation change - testing for
synchronous developments. Quaternary Science Reviews 30: 2805-2814.
10.1016/j.quascirev.2011.06.014.
Giesecke, T., Hickler, T., Kunkel, T., Sykes, M.T. and Bradshaw, R.H.W., 2007.
Towards an understanding of the Holocene distribution of Fagus sylvatica L. Journal
of Biogeography 34, 118–131.
Godwin, H., 1975. History of the British Flora: a factual basis for Phytogeoghraphy,
2nd edn. Cambridge University Press, Cambridge.
Gómez-Orellana, L., Ramil-Rego, P. and Muñoz Sobrino, C., 2007. The Würm in NW
Iberia, a pollen record from Area Longa (Galicia). Quaternary Research 67, 438–452.
González, M., Uriarte, A., Fontán, A., Mader, J. and Gyssels, P., 2004. Chapter 6
Marine Dynamics. Elsevier Oceanography Series. In: Borja, Á., Collins, M. (Eds.),
Oceanography and Marine Environment of the Basque Country. Elsevier, 133–157.
Gonzalez-Ariasa, A., Martınez de Aranob, I., Barcena-Ruızc, M.J., Besgab, G. and
Onaindia, M., 2006. Origin of atmospheric deposition and canopy buffering capacity
in stands of radiata pine and pedunculate oak in the Basque Country. Forest Ecology
and Management 229, 268-284.
González-Sampériz, P., Utrilla, P., Mazo, C., Valero-Garcés, B.L., Sopena, M.C.,
Morellón, M., Sebastián, M., Moreno, A. and Martínez-Bea, M., 2009. Patterns of
human occupation during the Early Holocene in the Central Ebro Basin (NE Spain)
in response to the 8.2 ka climatic event. Quaternary Research 71 (2), 121–132.
González-Sampériz, P., Valero-Garcés, B.L., Moreno, A., Jalut, G., García-Ruiz, J.M.,
Martí- Bono, C., Delgado-Huertas, A., Navas, A., Otto, T. and Dedoubat, J.J., 2006.
Climate variability in the Spanish Pyrenees during the last 30,000 yr revealed by the
El Portalet sequence. Quaternary Research 66, 38–5.
Goosse, H., Renssen, H., Selten, F. M., Haarsma, R. J. and Opsteegh, J. D., 2002.
Potential causes of abrupt climate events: A numerical study with a three-
dimensional climate model. Geophys. Res. Lett., 29(18), 1860,
doi:10.1029/2002GL014993.
107
Guilaine, J., 1991. Pour une archéologie agraire. Armand Colin, Paris.
Guiot, J., Harrison, S.P. and Prentice, I.C., 1993. Reconstruction of Holocene
precipitation patterns in Europe using pollen and lake-level data. Quaternary
Research 40, 139–49.
Haas, J., Richoz, I., Tinner, W. and Wick, L., 1998. Synchronous Holocene climatic
oscillations recorded on the Swiss Plateau and at timberline in the Alps. The
Holocene 8(3): 301-309.
Hall, I. R., Bianchi, G. G., and Evans, J. R., 2004. Centennial to millennial scale
Holocene climate-deep water linkage in the North Atlantic. Quat. Sci. Rev., 23.
Hammarlund, D., Bjὂrck, S., Buchardt, B., Israelson, C., and Thomsen, C.T., 2003.
Rapid hydrological changes during the Holocene revealed by stable isotope records
of lacustrine carbonates from Lake Igelsjὂn, southern Sweden. Quaternary Science
Reviews, v. 22, p. 353–370.
Hede, M.U., Rasmussen, P., Noe-Nygaard, N., Clarke, A., Vinebrooke, R. and Olsen,
J., 2010. Multiproxy evidence for terrestrial and aquatic ecosystem responses during
the 8.2 ka cold event as recorded at Højby Sø, Denmark. Quaternary Research , vol
73, s. 485-496.
Heusser, L., 1978. Spores and pollen in the marine realm in Haq B.U. and Boersma,
A. (eds.).Introduction to marine micropaleontology: New York, Elsevier, 327-339.
Heusser, L.E. and Balsam, W.L., 1977. Pollen distribution in the northeast Pacific
Ocean. Quaternary Research 7, 45–62.
Heusser, L.E. and Stock, C.E., 1984. Preparation techniques for concentrating pollen
from marine sediments and other sediments with low pollen density. Palynology 8,
225–27.
Huntley, B. and Prentice, I.C., 1988. July temperatures in Europe from pollen data,
6000 years before present. Science 241, 687–90.
Huntley, B., 1993. Rapid early Holocene migration and high abundance of hazel
(Corylus avellana L.): alternative hypotheses. In Chambers, F.M., editor, Climate
change and human impact on the landscape. Chapman and Hall, 205–15.
Huntley, B., 1996. Quaternary paleoecology and ecology. Quaternary Science
Reviews 15, 591–606.
Huntley, B., Bartlein, P.J., Prentice, I.C., 1989. Climatic control of the distribution and
abundance of beech (Fagus L.) in Europe and North America. Journal of
Biogeography 16, 551–560.
Huntley, B., Birks, H.J.B., 1983. An atlas of past and present pollen maps for Europe:
0-13000 years ago. Cambridge University Press, Cambridge.
IPCC, 2007. Climate change 2007: The physical science basis. Contribution of
working group I to the fourth assessment report of the Intergovernmental Panel on
Climate Change [Solomon, S., Qin, D., Manning, M., Chen, Z., Marquis, M., Averyt,
K.B., Tignor, M. and Miller, H.L. (eds.)]. Cambridge and New York: Cambridge
University Press: 996 p.
108
Iriarte, M. J., 2009. Vegetation landscape and the anthropization of the environment in
the central sector of the Northern Iberian Peninsula: Current status. Quaternary
International: 200 (1), 66-76. Elsevier.
Iriarte, M.J., 1997. El paisaje vegetal de la Pre historia tardía y primera Historia en el
País Vasco peninsular. Isturiz 9, 667–669.
Irizar, I., Laskurain, N. A. and Herrero J., 2004. Wild boar frugivory in the Atlantic
Basque Country. Galemys 16, 125-133.
Izco, J. and Ramil-Rego, P., 2001. Análisis y valoración de la Sierra de O Xistral: un
modelo de aplicación de la Directiva Hábitat de Galicia. Xunta de Galicia, Santiago
de Compostela.
Jalut, G., Andrieu, V., Delibrias, G., Fontugné, M. and Pagès, P., 1988.
Palaeoenvironment of the valley of Ossau (Western French Pyrénées) during the last
27 000 years. Pollen et Spores 30 (3/4), 357–94.
Johnsen, S.J., Dahl-Jensen, D., Gundestrup, N., Steffensen, J.P., Clausen, H.B., Miller,
H., Masson-Delmotte, V., Sveinbjornsdottir, A.E. and White, J., 2001. Oxygen
isotope and palaeotemperature records from six Greenland ice-core stations: Camp
Century, Dye- 3, GRIP, GISP2, Renland and NorthGRIP. Journal of Quaternary
Science 16, 299 – 307.
Jones, P.D. and Mann, M.E., 2004. Climate over past millennia. Reviews of
Geophysics, 42: RG2002.
Jones, P.D., Briffa, K.R., Osborn, T.J., Lough, J.M., van Ommen, T.D., Vinther, B.M.,
Luterbacher, J., Wahl, E.R., Zwiers, F.W., Mann, M.E., Schmidt, G.A., Ammann,
C.M., Buckley, B.M., Cobb, K.M., Esper, J., Goosse, H., Graham, N., Jansen, E.,
Kiefer, T., Kull, C., Küttel, M., Mosley-Thompson, E., Overpeck, J.T., Riedwyl, N.,
Schulz, M., Tudhope, A.W., Villalba, R., Wanner, H., Wolff, E. and Xoplaki, E.,
2009. High-resolution palaeoclimatology of the last millennium: A review of current
status and future prospects. The Holocene, 19: 3–49.
Jouanneau, J.M., Weber, O., Champilou, N., Cirac, P., Muxika, I., Borja, Á., Pascual,
A., Rodríguez-Lázaro, J. and Donard, O., 2008a. Recent sedimentary study of the
shelf of the Basque country. Journal of Marine Systems 72, 397–406.
Jouanneau, J-M., Weber, O., Cirac, P., Pascual, A., Rodríguez-Lázaro, J., Borjab, A.,
Bareille, G., Naughton, F., Turon, J-L., Sanchez-Goni, M-F., German Rodriguez, J.
and Martins M., 2008b. Sedimentation on the southern margin of the Bay of Biscay
(Basque country) over the last 40 000 years BP. XI International Symposium on
Oceanography of the Bay of Biscay (2-4 April, 2008. Donostia-San Sebastián).
Geology and Sediments poster session: R-067.
Kaplan, M.R. and Wolfe, A.P., 2006. Spatial and temporal variability of Holocene
temperature in the North Atlantic region. Quaternary Research, 65, 223.–231.
Kim, J.H., Rimbu, N., Lorenz, S.J., Lohmann, G., Nam, S.-I., Schouten, S.,
Ruhlemann, C. and Schneider, R.R., 2004. North Pacific and North Atlantic sea-
surface temperature variability during the Holocene. Quaternary Science Reviews 23,
2141-2154.
109
Klitgaard-Kristensen, D., Sejrup, H.P., Haflidason, H., Johnsen, S. and Spurk, M.,
1998. A regional 8200 cal. Yr BP cooling event in northwest Europe, induced by
final stages of the Laurentide ice-sheet deglaciation? Journal of Quaternary Science
13(2), pp. 165-169.
Knudsen, K.L., Jiang, H., Jansen, E., Eiríksson , J., Heinemeier, J. and Seidenkrantz,
M.S., 2004. Environmental changes off North Iceland during the deglaciation and the
Holocene: foraminifera, diatoms and stable isotopes. Marine Micropaleontology 50,
273–305.
Kobashi, T., Severinghaus, J.P., Brook, E.J., Barnola, J.-M. and Grachev, A.M.., 2007.
Precise timing and characterization of abrupt climate change 8200 years ago from air
trapped in polar ice. Quaternary Science Reviews 26:1212-1222,
doi:1210.1016/j.quascirev.2007.1201.1009.
Küster, H., 1997. The role of farming in the postglacial expansion of beech and
hornbeam in the oak woodlands of central Europe. Holocene 7 (2), 239–242.
Küster, H., 1999. Prehistoric farming and the postglacial expansion of beech and
hornbeam: a reply to Gardner and Willis. Holocene 9 (1), 121–12.
Kutzbach, J. E. and Gallimore, R. G., 1988. Sensitivity of a coupled atmosphere/mixed
layer ocean model to changes in orbital forcing at 9000 years BP. Journal of
Geophysical Research, 93: 803–821.
Lagos Altamirano, R., Pinilla, A. and Benayas, J., 1990. Bioindicadores y
micromorfología de una turbera en la Sierra de Urbión. Cuaternario y Geomorfología
4, 27-36.
Le Cann, B. and Pingree, R., 1995. Circulation dans le Golfe de Gascogne: une revue
de travaux récents. Actas del IV Coloquio Internacional sobre Oceanografia del
Golfo de Vizcaya. Santander, Spain, 217–234.
Lebreiro, S. M., Frances, G., Abrantes, F. F. G., Diz, P., Bartels-Jonsdottir, H. B.,
Stroynowski, Z. N., Gil, I. M., Pena, L. D., Rodrigues, T., Jones, P. D., Nombela, M.
A., Alejo, I., Briffa, K. R., Harris, I. and Grimalt, J. O., 2006. Climate change and
coastal hydrographic response along the Atlantic Iberian margin (Tagus Prodelta and
Muros Ria) during the last two millennia. Holocene 16, 1003-1015.
LeGrande, A.N. and Schmidt, G.A., 2008. Ensemble, water isotope-enabled, coupled
general circulation modeling insights into the 8.2 ka event. Paleoceanography 23:
PA3207.
LeGrande, A.N., Schmidt, G.A., Shindell, D.T., Field, C. V., Miller, R. L., Koch, D.
M., Faluvegi, G. and Hoffmann, G., 2006. Consistent simulations of multiple proxy
responses to an abrupt climate change event. Proceedings of the National Academy
of Sciences USA 103: 837–842.
Leuschner C., Backes K., Hertel D., Schipka F., Schmitt U., Terborg O. and Runge
M., 2001. Drought responses at leaf, stem and fine root levels of competitive Fagus
sylvatica L. and Quercus petraea (Matt.) Liebl. trees in dry and wet years. Forest
Ecology and Management 149, 33-46.
110
Li, Y., Renssen, H., Wiersma, A.P. and Törnqvist, T., 2009. Investigating the impact
of Lake Agassiz drainage routes on the 8.2 ka cold event with a climate model.
Climate of the Past 5: 471–480.
Ljungqvist, F.C., 2010. A new reconstruction of temperature variability in the
extratropical Northern Hemisphere during the last two millennia. Geogr. Ann. 92A,
339-351.
López-Merino, L., López-Sáez, J.A., Ruíz-Zapata, M.B. and Gil-García, M.J., 2008.
Reconstructing the history of beech (Fagus sylvatica L.) in the north-western Iberian
Range (Spain): from Late-Glacial refugia to the Holocene anthropic-induced forests.
Review of Palaeobotany and Palynology 152, 58–65.
Lorenz, S.J., Kim, J.-H., Rimbu, N., Schneider, R.R. and Lohmann, G., 2006.
Orbitally driven insolation forcing on Holocene climate trends: evidence from
alkenone data and climate modelling. Paleoceanography, 21: 1002, DOI:
10.1029/2005PA001152.
Madelain, F., 1970. Influence de la topographie du fond sur l'écoulement
méditerranéen entre le détroit de Gibraltar et le Cap Saint-Vincent. Cahier
Océanographique 22, 43–61.
Magny, M. and Bégeot, C., 2004. Hydrological changes in the European midlatitudes
associated with freshwater outbursts from Lake Agassiz during the Younger Dryas
event and the early Holocene. Quaternary Research 61, 181–192.
Magny, M., 2004. Holocene climate variability as reflected by mid-European lake
level fluctuations, and its probable impact on prehistoric human settlements.
Quaternary International, 113: 65-79.
Magny, M., 2007. Lake level studies - West-Central Europe. In: Encyclopedia of
Quaternary Studies, Vol. 2, pp. 1389-1399. Elsevier, Amsterdam.
Magny, M., Begeot, C., Guiot, J. and Peyron, O., 2003. Contrasting patterns of
hydrological changes in Europe in response to Holocene climate cooling phases.
Quaternary Science Reviews, 22, 1589–1596.
Magny, M., Bégeot, C., Guiot, J. and Peyron, O., 2003. Contrasting patterns of
hydrological changes in Europe in response to Holocene climate cooling phases.
Quaternary Science Reviews 22, 1589–96.
Magri, D., 1995. Some questions on the late-Holocene vegetation of Europe. The
Holocene 5, 354 – 60.
Magri, D., Vendramin, G.G., Comps, B., Dupanloup, I., Geburek, T., Gömöry, D.,
Latalowa, M., Litt, T., Paule, L., Roure, J.M., Tantau, I., van der Knaap, W.O., Petit,
R.J. and de Beaulieu, J.L., 2006. A new scenario for the Quaternary history of
European beech populations: palaeobotanical evidence and genetic consequences.
New Phytol 171, 199–221.
Maher, L.J. Jr., 1981. Statistics for microfossil concentration measurements employing
samples spiked with marker grains. Review of Palaeobotany and Palynology 32, 153-
191.
111
Maldonado, F.J., 1994. Evolución tardiglaciar y holocena de la vegetación en los
macizos del Noroeste peninsular. Doctoral Thesis, Universidad Politécnica de
Madrid, Madrid.
Mallarach, J.M., Pérez Obiol, R. and Roure, J.M., 1986. Aportacions al coneixement
del clima i la vegetació durant el quaternari recent, en el NE de la Península Ibèrica.
Vitrina 1, 49–54.
Mann, M.E., Zhang, Z., Hughes, M.K., Bradley, R.S., Miller, S.K., Rutherford, S. and
Ni, F., 2008. Proxy-based reconstructions of hemispheric and global surface
temperature variations over the past two millennia. Proceedings of the National
Academy of Sciences, USA, 105: 13252–13257.
Marchal, O., Cacho, I., Stocker, T.F., Grimalt, J.O., Calvo, E., Martrat, B., Shackleton,
N., Vautravers, M., Cortijo, E., van Kreveld, S., Andersson, C., Koç, N., Chapman,
M., Sbaffi, L., Duplessy, J.-C., Sarnthein, M., Turon, J.-L., Duprat, J. and Jansen, E.,
2002. Apparent long-term cooling of the sea surface in the northeast Atlantic and
Mediterranean during the Holocene. Quaternary Science Reviews 21, 455–83.
Martínez Atienza, F., Morla Juaristi, C., 1992. Aproximación a la paleocorología
holocena de Fagus en la Península Ibérica através de datos paleopolínicos. In: Elena
Rosselló, R. (Ed.), Actas Congreso Internacional del Haya, Pamplona 19 al 23 de
octubre 1992, Investigación Agraria, Sistema y Recursos Forestales. Fuera de Serie 1
(1), 135–145.
Mary, G., 1990. La evolución del litoral cantábrico durante el Holoceno. In: Cearreta,
A., Ugarte, F.M. (Eds.), The Environment and the Human Society in the Western
Pyrenees and the Basque Mountains during the Upper Pleistocene and the Holocene.
Dirección de Medio Ambiente, Diputacin Foral de Álava, Álava, pp. 81– 87.
Mayewski, P.A., Rohling, E., Stager, C., Karlen, W., Maasch, K., Meeker, L.D.,
Meyerson, E., Gasse, F., van Kreveld, S., Holmgren, K., Lee-Thorp, J., Rosqvist, G.,
Rack, F., Staubwasser, M. and Schneider, R., 2004. Holocene climate variability.
Quaternary Research, 62: 243-255.
McAndrew, J.H. and King, J.E., 1976. Pollen of the North American Quaternary: The
top twenty. Geoscience and Man 15, 41-49.
McManus, J.F., Oppo, D.W. and Cullen, J.L., 1999. A 0.5 million year record of
millennial-scale climate variability in the North Atlantic. Science, 283: 971–975.
Migeon, S., Weber, O., Faugeres, J.C. and Saint-Paul, J., 1999. SCOPIX: a new
imaging system for core analysis. Geo-Marine Letters 18, 251–55.
Mighall, T.M., Martínez Cortizas, A., Biester, H. and Turner, S.E., 2006. Proxy
climate and vegetation changes during the last five millenniain NW Iberia: pollen
and non-pollen palynomorph data from two ombrotrophic peat bogs in the North
Western Iberian peninsula.Review of Palaeobotany and Palynology 141, 203–23.
Montserrat, J.M., 1992. Evolución glaciar y postglaciar del clima y la vegetación en la
vertiente sur del Pirineo. Estudio Palinológico. Zaragoza. Instituto Pirenaico de
Ecología — C.S.I.C.
112
Moore, P.D., Webb, J.A. and Collinson, M.E., 1991. Pollen analysis. Oxford,
Blackwell scientific publication, 2nd edition, 216 p.
Morales-Molino, C., García-Antón, M. and Morla C., 2011. Late Holocene vegetation
dynamics on an Atlantic–Mediterranean mountain in NWIberia, Palaeogeogr.
Palaeoclimatol. Palaeoecol., doi:10.1016/j.palaeo.2011.01.020.
Morellón, M., Valero-Garcés, B., González-Sampériz, P., Vegas-Vilarrúbia, T., Rubio,
E., Rieradevall, M., Delgado-Huertas, A., Mata, P., Romero, O., Engstrom, D.R.,
López-Vicente, M., Navas, A. and Soto, J., 2009. Climate changes and human
activities recorded in the sediments of Lake Estanya (NE Spain) during the Medieval
Warm Period and Little Ice Age. Journal of Paleolimnology 46, 423-452.
Moreno, A., López-Merino, L., Leira, M., Marco-Barba, J., González-Sampériz, P.,
Valero-Garcés, B., López-Sáez, J. A., Santos, L., Mata, P. and Ito, E., 2011.
Revealing the last 13,500 years of environmental history from the multiproxy record
of a mountain lake (Lago Enol, northern Iberian Peninsula). Journal of
Paleolimnology, 46 (3) 327-349.
Morichon, D. and Dailloux, D., 2006. River plume monitoring using two combined
remote sensing techniques: satellite (MODIS) and video (ARGUS) images.
Application to the Adour River plume (France). Proceeding of the 30th International
Conference on Coastal Engineering, San Diego, 2095–2105.
Moros, M., Emeis, K., Risebrobakken, B., Snowball, I., Kuipers, A., McManus, J. and
Jansen, E., 2004. Sea surface temperatures and ice rafting in the Holocene North
Atlantic: climate influences on northern Europe and Greenland. Quaternary Science
Reviews 23, 2113–26.
Muller, J., 1959. Palynology of recent Orinoco delta and shelf sediments.
Micropaleontology 5, 1–32.
Muñoz Rodríguez, A.F., Palacios, I. S. and Tormo Molina, R., 2007. Cyperaceae and
Juncaceae pollination measured in the air at two sites in SW Spain. Aerobiologia 23
(4): 259–270. doi:10.1007/s10453-007-9072-0.
Muñoz Sobrino, C, Ramil-Rego, P. and Rodríguez Guitián, M., 2001. Vegetation in
the mountains of northwest Iberia during the last glacial-interglacial transition.
Vegetation History and Archaeobotany 10, 7–21.
Muñoz Sobrino, C., Ramil-Rego, P. and Gómez-Orellana L., 2004. Vegetation of the
Lago de Sanabria area (NW Iberia) since the end of the Pleistocene: a
palaeoecological reconstruction on the basis of two new pollen sequences.
Vegetation History and Archaeobotany 13, 1–22.
Muñoz Sobrino, C., Ramil-Rego, P. and Rodríguez Guitián, M., 1997. Upland
vegetation in the north-west Iberian Peninsula after the last glaciation: forest history
and deforestation dynamics. Vegetation History and Archaeobotany 6, 215–233.
Muñoz Sobrino, C., Ramil-Rego, P.,Gómez-Orellana, L. and Díaz Varela, R.A., 2005.
Palynological data on major Holocene climatic events in NW Iberia. Boreas 34, 381–
400.
113
Muñoz-Sobrino, C., Ramil-Rego, P. and Gomez Orellana, L., 2007. Late Würm and
Early Holocene in the mountains of northwest Iberia: biostratigraphy, chronology
and tree colonization. Vegetation History and Archaeobotany 16, 223–240.
Muñoz-Sobrino, C., Ramil-Rego, P., Gómez-Orellana, L., Ferreiro da Costa, J. and
Varela, R.A.D., 2009. Climatic and human effects on the post-glacial dynamics of
Fagus sylvatica. Plant Ecology 203(2), 317-340.
Muscheler, R., Beer, J. and Vonmoos, M., 2004. Causes and timing of the 8200 yr BP
event inferred from the comparison of the GRIP 10
Be and the tree ring ∆14
C record.
Quaternary Science Reviews, 23: 2101-2111.
Naughton, F., Bourillet, J.F., Sánchez Goñi, M.F., Turon, J.L. and Jouanneau, J.M.,
2007a. Long term and millennial-scale climate variability in northwestern France
during the last 8850 years. The Holocene 17, 939-953.
Naughton, F., Sánchez Goñi, M.F., Desprat, S., Turon, J-L., Duprat, J., Malaizé, B.,
Joli, C., Cortijo, E., Drago, T. and Freitas, M.C., 2007b. Present-day and past (last
25000 years) marine pollen signal off western Iberia. Marine Micropaleontology 62,
91–114.
Negral, M.A., Rodríguez Guitián, M.A. and Díaz-Maroto, I., 1997. Distribución y
caracterización ecológica y dasométrica del haya (Fagus sylvatica) en Galicia. II
Congreso Forestal Español 4, 422–429.
Nesje, A. and Dahl, S.O., 2001. The Greenland 8200 cal yr BP event detected in loss-
on ignition profiles in Norwegian lacustrine sediment sequences. Journal of
Quaternary Science 16, 155–66.
North Greeland Ice Core project member, 2004. High resolution record of Northern
Hemisphere climate extending into the last interglacial period. Nature, 431, 147-151.
O’Brien, S.R., Mayewski, P.A., Meeker, L.D., Meese, D.A., Twickler, M.S. and
Whitlow, S.I., 1995. Complexity of Holocene climate as reconstructed from a
Greenland ice core. Science, 270: 1962– 1964.
Oppo, D.W., McManus, J.F. and Cullen, J.L., 2003. Deepwater variability in the
Holocene epoch. Nature 422, 277–278.
Osborn, T.J. and Briffa, K.R., 2006. The spatial extent of 20th century warmth in the
context of the past 1200 years. Science, 311: 841–844.
Pascual, A., Cearreta, A., Rodríguez-Lázaro, J., Uriarte, A., 2004. Geology and
Palaeoceanography. In: Borja, A. and Collins, M. (Eds.), Oceanography and Marine
Environment of the Basque Country. Elsevier, Amsterdam, 53–73.
Peck, R.M., 1973. Pollen budget studies in a small Yorkshire catchment. In Birks,
H.J.B. and West, R.G., editors, Quaternary plant ecology. The 14th symposium of
the British Ecological Society, University of Cambridge, Blackwell Scientific
Publications, 43–60.
Pèlachs, A., Pérez-Obiol, R., Ninyerola, M. and Nadal, J., 2009. Landscape dynamics
of Abies and Fagus in the southern Pyrenees during the last 2,200 years as a result of
anthropogenic impacts. Review of Palaeobotany and Palynology 156, 337–349.
114
Peñalba, C., 1994. The history of the Holocene vegetation in northern Spain from
pollen analysis. Journal of Ecology 82, 815–32.
Peñalba, M.C., Arnold, M., Guiot, J., Duplessy, J.-C. and de Beaulieu, J.-L., 1997.
Termination of the last glaciation in the Iberian Peninsula inferred from the pollen
sequence of Quintanar de la Sierra. Quaternary Research 48, 205–14.
PIGWAD (Planetary Interactive G.I.S.-on-the-Web Analyzable Database) Home Page,
Retrieved 11 Aphril 2012 from
http://webgis.wr.usgs.gov/globalgis/metadata_qr/metadata/perennial_rivers.htm. The
drainage system is derived from the Europe and North Asia (EURNASIA) Vmap
Level Zero (VMAP0 - Digital Chart of the World). The Level 0 provides worldwide
coverage of geo-spatial data and is equivalent to a small scale (1:1,000,000). Data are
structured following the Vector Product Format (VPF) [1], compliant with standards
MIL-V-89039 and MIL-STD 2407.
Pingree, R. and Le Cann, B., 1990. Structure, strength and seasonality of the slope
currents in the Bay of Biscay region. Journal of the Marine Biological association of
the UK 70, 857–885.
Pingree, R. and Le Cann, B., 1992. Three anticyclonic Slope Water Oceanic Eddies
(Swoddies) in the southern Bay of Biscay in 1990. Deep-Sea Research 39 (7/8),
1147–1175.
Piotrowski, A.M., Goldstein, S.L., Hemming, S.R. and Hemming, R., 2004.
Intensification and variability of ocean thermohaline circulation through the last
deglaciation. Earth and Planetary Science Letters 225: 205–220.
Pons, A. and Reille, M., 1986. Nouvelles recherches pollenanalytiques à Padul
(Granada): La fin du dernier glaciaire et l’Holocene. In López-Vera, E., editor,
Quaternary climate in Western Mediterranean. University Autónoma de Madrid,
405–20.
Pons, A., J. Guiot, De Beaulieu, J.-L. and Reille, M., 1992. Recent contributions to the
climatology of the last glacial-interglacial cycle based on french pollen sequences.
Quaternary Science Reviews 11: 439-448.
Postigo-Mijarra, J.M., Gómez Manzaneque, F., Morla Juaristi, C. and Zazo, C., 2010.
Palaeoecological significance of Late Pleistocene pine macrofossils in the lower
Guadalquivir Basin (Doñana natural park, southwestern Spain). Palaeogeography,
Palaeoclimatology, Palaeoecology 295, 332–343.
Pott, R., 1997. Invasion of beech and establishment of beech forests in Europe. Ann
Bot 55, 27–58.
Pott, R., 2000. Palaeoclimate and vegetation: long-term vegetation dynamics in central
Europe with particular reference to beech. Phytocoenologia 30, 285–333.
Practical Guide to Wavelet Analysis Home Page, Retrieved 11 Aphril 2012 from
http://paos.colorado.edu/research/wavelets/ by Christopher Torrence and Gilbert P.
Combo.
115
Prego, R., Boi, P., and Cobelo-García, A., 2008. The contribution of total suspended
solids to the Bay of Biscay by Cantabrian Rivers (northern coast of the Iberian
Peninsula). Journal of Marine Systems 72, 342–349.
Quadrelli, R., V. Pavan and Molteni F., 2001. Wintertime variability of Mediterranean
precipitation and its links with large-scale circulation anomalies. Clim. Dyn. 17, 5-6,
457-466.
Rahmstorf, S., 2000. The thermohaline ocean circulation: A system with dangerous
thresholds? Climatic Change, v. 46, p. 247–256.
Rahmstorf, S., 2002. Ocean circulation and climate during the past 120,000 years.
Nature 419, 207–14.
Ralska-Jasiewiczowa, M., Nalepka, D. and Goslar, T., 2003. Some problems of forest
transformation at the transition to the oligocratic/Homo sapiens phase of the
Holocene interglacial in northern lowlands of central Europe. Vegetation History and
Archaeobotany 12 (4), 233–247.
Ramil Rego, M., Muñoz Sobrino, C., Rodríguez Guitían, M. and Gómez Orellana, L.,
1998. Differences in the vegetation of the North Iberian Peninsula during the last
16,000 years. Plant Ecology 138, 41–62.
Ramil Rego, P., 1992. La vegetación cuaternaria de las Sierras Septentrionales de
Lugo a través del análisis polínico. Doctoral Thesis, Universidad de Santiago de
Compostela, Santiago de Compostela, 98-114.
Ramil-Rego, P., Rodríguez Guitián, M.A., Muñoz Sobrino, C. and Gomez-Orellana,
L., 2000. Some considerations about the postglacial history and recent distribution of
Fagus sylvatica in the NW Iberian Peninsula. Folia Geobotanica 35, 241–271.
Rasmussen, P., Hede, M.U., Noe-Nygaard, N., Clarke, A.L. and Vinebrooke, R.D.,
2008. Environmental response to the cold event 8200 years ago as recorded in
Højbysø, Denmark. Geological survey of Denmark and Greenland bulletin, vol 15, s.
57-61.
Rasmussen, S. O., Andersen, K. K., Svensson, A. M., Steffensen, J. P., Vinther, B. M.,
Clausen, H. B., Siggaard-Andersen, M. L., Johnsen, S. J., Larsen, L. B., Dahl-Jensen,
D., Bogler, M., Rothlisberger, R., Fischer, H., Goto-Azuma, K., Hansson, M. E. and
Ruth, U., 2006. A new Greenland ice core chronrlogy for the last glacial termination.
Journal of Geophysical Research, 111, doi:10.1029/2005JD006079.
Reille, M. and Andrieu, V., 1991. Données nouvelles sur l’histoire postglaciaire de la
végétation des Pyrénées occidentales (France). Comptes rendus de l’Académie des
sciences, Paris 312, 97–103.
Reille, M. and Andrieu, V., 1994. Vegetation history and human action in Ariege
(Pyrenees, France). Dissertationes Botanicae 234, 413–22.
Reille, M. and Andrieu, V., 1995. The late Pleistocene and Holocene in the Lourdes
Basin, Western Pyrénées, France: new pollen analytical and chronological data.
Vegetation History and Archaeobotany 4, 1–21.
116
Reille, M. and Lowe, J.J., 1993. A re-evaluation of the vegetation history of the
eastern Pyrenees (France) from the end of the last glacial to the present. Quaternary
Science Reviews 12, 47–77.
Reille, M., 1992. Pollen et spores d'Europe et d'Afrique du Nord. Marseille,
Laboratoire de botanique historique et palynologie, 520 p.
Reille, M., de Beaulieu, J.L., Svobodova, H., Andrieu-Ponel, V. and Goeury, C., 2000.
Pollen analytical biostratigraphy of the last five climatic cycles from a long
continental sequence from the Velay region (Massif Central, France). Journal of
Quaternary Science 15, 665–85.
Reimer, P.J., Baillie, M.G.L., Bard, E., Bayliss, A., Beck, J.W., Blackwell, P.G.,
Bronk Ramsey, C., Buck, C.E., Burr, G.S., Edwards, R. L., Friedrich, M., Grootes,
P.M., Guilderson, T.P., Hajdas, I., Heaton, T.J., Hogg, A.G., Hughen, K.A., Kaiser,
K.F., Kromer, B., McCormac, F.G., Manning, S.W., Reimer, R.W., Richards, D.A.,
Southon, J.R., Talamo, S., Turney, C.S.M., van der Plicht, J. and Weyhenmeyer, C.
E., 2009. IntCal09 and Marine09 radiocarbon age calibration curves, 0-50,000 years
cal BP. Radiocarbon 51(4), 1111-1150.
Renssen, H., Goosse, H. and Fichefet, T., 2002. Modeling the effect of freshwater
pulses on the early Holocene climate: the influence of high frequency climate
variability. Paleoceanography 17: 1020.
Renssen, H., Goosse, H. and Fichefet, T., 2007. Simulation of Holocene cooling
events in a coupled climate model. Quaternary Science Reviews, 26, 2019-2029. doi:
10.1016/j.quascirev.2007.07.011
Renssen, H., Goosse, H. and Muscheler, R., 2006. Coupled climate model simulation
of Holocene cooling events: oceanic feedback amplifies solar forcing. Climate of the
Past 2, 79-90.
Renssen, H., Goosse, H., Fichefet, T. and Campin, J.M., 2001. The 8.2 kyr BP event
simulated by a global atmosphere–sea-ice–ocean model. Geophysical Research
Letters 28, 1567–70.
Renssen, H., Goosse, H., Fichefet, T., Brovkin, V., Driesschaert, E. and Wolk, F.,
2005. Simulating the Holocene climate evolution at northern high latitudes using a
coupled atmosphere-sea ice-ocean-vegetation model. Climate Dynamics 24, 23-43.
Renssen, H., Seppä, H., Heiri, O., Roche, D.M., Goosse, H. and Fichefet, T., 2009.
The temporal and spatial complexity of the Holocene Thermal Maximum. Nature
Geoscience, doi: 10.1038/ NGEO513.
Rex, D.F., 1950a. Blocking action in the middle troposphere and its effect upon
regional climate. Part I. An aerological study of blocking action. Tellus 2: 196–211.
Rex, D.F., 1950b. Blocking action in the middle troposphere and its effect upon
regional climate. Part II. The climatology of blocking action. Tellus 2: 275–301.
Rigueiro-Rodríguez, A., Mosquera-Losada, M., Romero-Franco, R., González-
Hernández, M.P. and Villarino-Urtiaga, J.J., 2005. Silvopastoral systems as a forest
fire prevention technique. In: Mosquera-Losada, M.R., McAdam, M.J. and Rigueiro-
117
Rodríguez, A. (eds.). Silvopastoralism and sustainable land management. CAB
International. Wallingford, 380–387.
Rius, D., Vannière, B. and Galop, D., 2011. Holocene history of fire, vegetation and
land use from the central Pyrenees (France), Quat. Res.,
doi:10.1016/j.yqres.2011.09.009
Rivas Martínez, S., 1987. Memoria del mapa de las series de vegetación de España
1:400.000. Madrid, ICONA.
Rodrigues, T., Grimalt, J. O., Abrantes, F., Naughton, F. and Flores, J., 2010. The last
glacial – interglacial transition (LGIT) in the western mid-latitudes of the North
Atlantic: Abrupt sea surface temperature change and sea level implications.
Quaternary Science Reviews: 29 (15), 1853-1862. Elsevier.
Rodrigues, T., Grimalt, J.O., Abrantes, F., Flores, J.A. and Lebreiro, S., 2009.
Holocene interdependences of changes in sea surface temperature, productivity and
fluvial inputs in the Iberian continental shelf (Tagus mud patch). Geochemistry,
Geophysics, Geosystems - G3, 10 (7): Doi:10.1029/2008GC002367.
Rodríguez Guitián, M.A., Ramil-Rego, P., Muñoz Sobrino, C. and Gómez-Orellana,
L., 1996. Consideraciones sobre la migración holocena de Fagus através de la Via
Pirenaico - Cantábrica. In: Ramil-Rego, P., Fernández Rodríguez, C., Rodríguez
Guitián, M.A. (eds) Biogeografía Pleistocena - Holocena de la Península Ibérica.
Xunta de Galicia, Santiago de Compostela, 98–111.
Rodríguez, M., 2004. El Pino Radiata (Pinus Radiata D. Don) en la Historia de la
Comunidad Autónoma de Euskadi. Análisis de un Proceso de Forestalismo
Intensivo. Tesis Doctoral nº 53. Eusko Jaurlaritza, Vitoria-Gasteiz.
Rodríguez-Sánchez, F., Hampe, A., Jordano, P. and Arroyo, J., 2010. Past tree range
dynamics in the Iberian Peninsula inferred through phylogeography and
palaeodistribution modelling: a review. Review of Palaeobotany and Palynology,
162, 507–521.
Rohling, E.J. and Pälike, H., 2005. Centennial-scale climate cooling with a sudden
cold event around 8,200 years ago. Nature 434, 975–79.
Ruas, M.P., 1990. Analyse des paléo-semences carbonisées. In: Raynaud C (ed) Le
village gallo-romain et médiéval de Lunel-Viel (Hérault) La fouille du quartier ouest
(1981–1983). Centre de Recherches d’Histoire Ancienne, 96–104.
Rull, V., 1987. A note on pollen counting in paleoecology. Pollen et Spores, 29 (4),
471-480.
Sáenz, J., Zubillaga, J. and Rodriguez-Puebla, C., 2001a. Interannual variability of
winter precipitation in northern Iberian Peninsula. Int. J. Climatol. 21, 12, 1503-
1513.
Sáenz, J., Zubillaga, J. and Rodríguez-Puebla, C., 2001b. Interannual winter
temperature variability in the North of the Iberian Peninsula. Climate Research 16,
169-179.
118
Sánchez Goñi, M.F. and Hannon, G., 1999. High altitude vegetational patterns on the
Iberian Mountain Chain (north-central Spain) during the Holocene. The Holocene
9(1), 39-57.
Sánchez Goñi, M.F., 1992. Analyse palynologique de sites préhistoriques de Pays
Basque: prémiers résultats pour les grottes de Lezetxiki et Urtiaga. In: The late
Quaternary in the western Pyrenean region. Universidad del País Vasco, pp. 207-233.
Sánchez Goñi, M.F., 1996. Vegetation and sea level changes during the Holocene in
the Estuary of the Bidasoa (Southern part of the bay of Biscay). Quaternaire 7, 207-
219.
Sánchez Goñi, M.F., Eynaud, F., Turon, J.-L. and Shackleton, N.J., 1999. High
resolution palynologicalrecord off the Iberian margin: direct land-sea correlation for
the Last Interglacial complex. Earth and Planetary Science Letters 171, 123-137.
Sánchez Goñi, M.F., Loutre, M.F., Crucifix, M., Peyron, O., Santos, L., Duprat, J.,
Malaizé, B., Turon, J.-L. and Peypouquet, J.-P., 2005. Increasing vegetation and
climate gradient in western Europe over the Last Glacial Inception (122–110 ka):
models-data comparison. Earth and Planetary Science Letters 231, 111–30.
Santos, L., 2004. Late Holocene Forest History and Deforestation Dynamics in the
Queixa Sierra, Galicia, Northwest Iberian Peninsula. Mountain Research and
Development, Vol. 24.3, 251-257.
Schmidt, R., Kamenik, C., Tessadri, R. and Koinig, K.A., 2006. Climatic changes
from 12,000 to 4,000 years ago in the Austrian Central Alps tracked by
sedimentological and biological proxies of a lake sediment core. Journal of
Paleolimnology, Vol. 35, No. 3, (April 2006), pp. 491–505, ISSN 0921-2728.
Seppä, H. and Poska, A., 2004. Holocene annual mean temperature changes in Estonia
and their relationship to solar insolation and atmospheric circulation patterns.
Quaternary Research 61, 22–31.
Seppä, H., Birks, H. J. B., Giesecke, T., Hammarlund, D., Alenius, T., Antonsson, K.,
Bjune, A. E., Heikkil¨a, M., MacDonald, G. M., Ojala, A. E. K., Telford, R. J. and
Veski, S., 2007. Spatial structure of the 8200 cal yr BP event in Northern Europe.
Clim. Past, 3, 225–236, http://www.clim-past.net/3/225/2007/.
Seppä, H., Bjune, A.E., Telford, R.J., Birks, H.J.B. and Veski, S., 2009. Last nine
thousand years of temperature variability in Northern Europe. Climate of the Past, 5,
pp. 523–535.
Seppä, H., Hammarlund, D. and Antonsson, K., 2005. Low-frequency and high-
frequency changes of temperature and effective humidity during the Holocene in
South central Sweden: implications for atmospheric and oceanic forcings of climate.
Climate Dynamics 25, 285–97.
Stein, O., 2000. The variability of Atlantic-European blocking as derived from long
SLP time series. Tellus 52A: 225–236.
Stuiver, M. and Braziunas, T.F., 1993. Modeling atmospheric 14
C influences and 14
C
ages of marine samples to 10,000 bc. Radiocarbon 35, 137–89.
119
Stuiver, M. and Reimer, P.J., 1993. Extended 14
C database and revised CALIB
radiocarbon calibration program. Radiocarbon 35, 215–30.
Stuiver, M., Grootes, P.M. and Braziunas, T.F., 1995. The GISP2 δ18
O record of the
past 16,500 years and the role of the sun, ocean and volcanoes. Quaternary Research
44, 341–5.
Stuiver, M., Reimer, P.J. and Reimer, R.W., 2005. CALIB 5.0. Retrieved 21 January
2012 from http://calib.qub.ac.uk/calib/.
Tallantire, P.A., 2002. The early Holocene spread of hazel (Corylus avellana L.) in
Europe north and west of the Alps: an ecological hypothesis. The Holocene 12, 81–
96.
Telford, R.J., Heegaard, E. and Birks, H.J.B., 2004. The intercept is a poor estimate of
a calibrated radiocarbon age. The Holocene 14, 296–98.
Teller, J.T., Leverington, D.W. and Mann, J.D., 2002. Freshwater outbursts to the
oceans from glacial Lake Agassiz and their role in climate change during the last
deglaciation. Quaternary Science Reviews 21, 879–87.
Thomas, E.R., Wolff, E.W., Mulvaney, R., Steffensen, J.P., Johnsen, S.J., Arrowsmith,
C., White, J.W.C., Vaughn, B. and Popp, T., 2007. The 8.2 kyr event from Greenland
ice cores. Quaternary Science Reviews 26:70-81.
Tibaldi, S., D’Andrea, F., Tosi, E. and Roeckner, E., 1997. Climatology of Northern
Hemisphere blocking in the ECHAM model. Clim Dyn 13, 649-666.
Tinner, W. and Lotter, A.F., 2001. Central European vegetation response to abrupt
climate change at 8.2 ka. Geology 29, 551–54.
Tinner, W. and Lotter, A.F., 2006. Holocene expansions of Fagus sylvatica and Abies
alba in Central Europe: where are we after eight decades of debate? Quaternary
Science Reviews 25, 526–549.
Torrence, C. and Compo, G. P., 1998. A practical guide to wavelet analysis. Bulletin
of the American Meteorological Society 76, 61-78.
Treidl R.A., Birch, E.C. and Sajecki, P., 1981. Blocking action in the Northern
Hemisphere: a climatological study. Atmosphere-Ocean 19: 1–23.
Trigo R.M., Valente, M.A., Trigo, I.F., Miranda, P.M.A., Ramos, A.M., Paredes, D.
and García-Herrera R., 2008. The impact of North Atlantic wind and cyclone trends
on European precipitation and significant wave height in the Atlantic. Annals of the
New York Academy of Sciences 1146, 212–234.
Trigo, R., and 21 coauthors, 2006. Relations between Variability in the Mediterranean
region and Mid-Latitude variability (lead author of Chapter 3), in: The
Mediterranean Climate: an overview of the main characteristics and issues, Ed. P.
Lionello, P. Malanotte-Rizzoli, and R. Boscolo, Elsevier, 179-226.
Trigo, R.M., Pozo-Vázquez, D., Osborn, T.J., Castro-Díez, Y., Gámiz-Fortis, S. and
Esteban-Parra, M.J., 2004a. North Atlantic Oscillation influence on precipitation,
river flow and water resources in the Iberian Peninsula. Int. J. Climatol. 24, 925-944.
120
Trigo, R.M., Trigo, I.F., DaCamara, C.C. and Osborn, T.J., 2004b. Climate impact of
the European winter blocking episodes from the NCEP/NCAR Reanalyses. Clim.
Dyn. 23, 17-28.
Trouet V., Scource, J.D. and Raible, C.C., 2012. North Atlantic storminess and
Atlantic Meridional Overturning Circulation during the last Millennium: Reconciling
contradictory proxy records of NAO variability. Global and Planetary Change 84-85,
48–55.
Turon, J-L., 1984. Le palynoplankton dans l’environnement actuel de l’Atlantique
nord oriental: évolution climatique et hydrologique depuis le dernier maximum
glaciale. Thèse de Doctorate ès Sciences, Université de Bordeaux, 313 pp.
UMR EPOC, Environnements et Paléoenvironnements Océaniques et Continentaux
Home Page, Retrieved 11 Aphril 2012 from http://www.epoc.u-
bordeaux.fr/index.php?lang=fr&page=eq_paleo_pollens.
Uriarte, A., 1998. Sediment Dynamics on the Inner Continental Shelf of the Basque
Country (N. Spain). PhD. Thesis. University of Southampton, 302.
Uriarte, A., Belzunce, M.J., Solaun, O., 2004a. Characteristics of estuarine and marine
sediments. In: Borja, A., Collins, M. (Eds.), Oceanography and Marine Environment
of the Basque Country. Elsevier oceanography series, Amsterdam, pp. 273–282.
Uriarte, A., Collins, M., Cearreta, A., Bald, J. And Evans, G., 2004b. Sediment supply,
transport and deposition: contemporary and Late Quaternary evolution. In: Borja, Á.,
Collins, M. (Eds.), Elsevier Oceanography Series: Oceanography and Marine
Environment of the Basque Country. Elsevier, 97–131.
Usabiaga, J.I., Sáenz, J., Valencia, V. and Borja, Á., 2004. Climate and Meteorology:
variability and its influence on the Ocean. In: Borja, Á., Collins, M. (Eds.)
Oceanography and Marine Environment of the Basque Country, Elsevier
Oceanography Series 70. 75-95.
Uzquiano, P., 1995. L’évolution de la végétation à l’Holocène initial dans le nord de
l’Espagne à partir de l’étude anthracologique de trois sites archéologiques.
Quaternaire 6(2), 77–83.
Valdès, C.M. and Gil Sánchez, L., 2001. La transformación histórica del paisaje
forestal en Galicia, Ministerio de Medio Ambiente, 159 pp.
Van Geel, B., van der Plicht, J. and Renssen, H., 2003. Major Δ14
C excursions during
the late glacial and early Holocene: changes in ocean ventilation or solar forcing of
climate change? Quaternary International 105, 71–76.
Veski, S., Seppä, H. and Ojala, A.E.K., 2004. The cold event 8200 years ago recorded
in annually laminated lake sediments in Eastern Europe. Geology 32, 681–84.
Von Engelbrechten, S., 1998. Late-glacial and Holocene vegetation and environmental
history of the Sierra de Urbión, North-Central Spain. Doctoral Thesis, University of
Dublin, Dublin.
121
Von Grafenstein, U., Erlenkeuser, H., Brauer, A., Jouzel, J. and Johnsen, S., 1999. A
mid-European decadal isotope-climate record from 15000 to 5000 years BP. Science
284, 1654–57.
Von Grafenstein, U., Erlenkeuser, H., Muller, J., Jouzel, J. and Johnsen, S., 1998. The
cold event 8200 years ago documented in oxygen isotope records of precipitation in
Europe and Greenland. Climate Dynamics 14, 73–81.
Wallace, J.M. and Gutzler, D.S., 1981. Teleconnections in the geopotential height
field during the Northern Hemisphere winter. Mon. Wea. Rev. 109, 784-812.
Wanner, H., Beer, J., Bütikofer, J., Crowley, T.J., Cubasch, U., Flückiger, J., Goosse,
H., Grosjean, M., Joos, F., Kaplan, J.O., Küttel, M., Müller, S., Prentice, I.C.,
Solomina, O., Stocker, T.F., Tarasov, P., Wagner, M. and Widmann, M., 2008. Mid-
tolate Holocene climate change: an overview. Quaternary Science Reviews 27, 1791-
1828.
Wanner, H., Solomina, O., Grosjean, M., Ritz, S. P. and Jetel, M., 2011. Structure and
origin of Holocene cold events. Quaternary Science Reviews, 30, 3109–3123.
Weber, S. L., Crowley, T. J. and van der Schrier, G., 2004. Solar irradiance forcing of
centennial 30 climate variability: linear and nonlinear responses in a coupled model.
Clim. Dyn., 22, 539–553.
Weber, S.L. and Oerlemans, J., 2003. Holocene glacier variability: three case studies
using an intermediate-complexity climate model. The Holocene, 13, 353-363.
Wiersma, A.P. and Renssen, H., 2006. Model-data comparison for the 8.2 ka BP
event: confirmation of a forcing mechanism by catastrophic drainage of Laurentide
Lakes. Quaternary Science Reviews 25, 63-88. doi:10.1016/j.quascirev.2005.07.009.
Wiersma, A.P., Renssen, H., Goosse, H. and Fichefet, T., 2006. Evaluation of different
freshwater forcing scenarios for the 8.2 ka BP event in a coupled climate model.
Climate Dynamics 27, 831-849. doi: 10.1007/s00382-006-0166-0.
Wiersma, A.P., Roche, D.M. and Renssen, H., 2011. Fingerprinting the 8.2 ka BP
event climate response in a coupled climate model. Journal of Quaternary Science
26, 118-127. doi: 10.1002/jqs.1439.
Worldwide Bioclimatic Classification System, 1996-2009, S.Rivas-Martinez and
S.Rivas-Saenz, Phytosociological Research Center, Spain.
http://www.globalbioclimatics.org.
Xoplaki, E., 2002, Climate Variability over the Mediterranean, PhD thesis, University
of Bern, Switzerland, Available through: http://sinus.unibe.ch/
klimet/docs/phd_xoplaki.pdf
Yu, Z.C. and Ito, E., 2002. The 400-year wet–dry climate cycle in Interior North
America and its solar connection. In: West, G.J., Blomquist, N.L. (Eds.), Proceedings
of the nineteenth annual pacific climate workshop. Technical Report 71 of the
interagency ecological program for the San Francisco estuary, pp. 159–163.

122

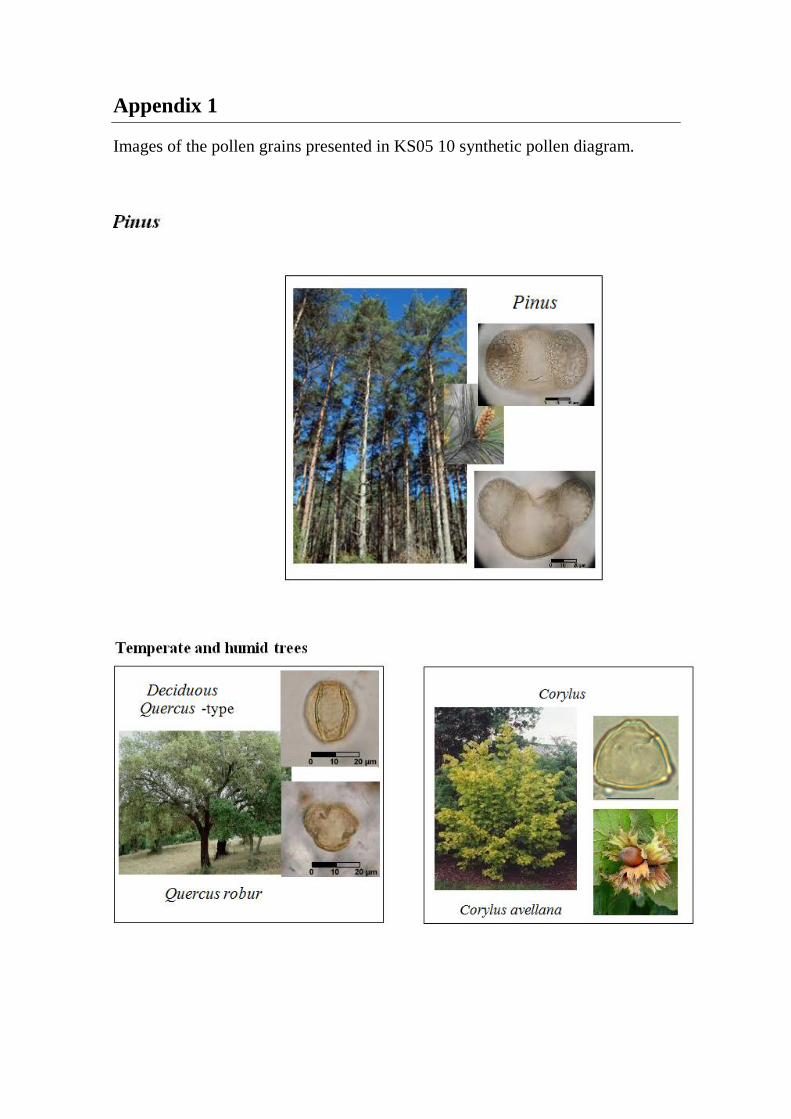
Appendix 1
Images of the pollen grains presented in KS05 10 synthetic pollen diagram.