Embed Size (px)
Citation preview

VEGETATION MAPPING AND WILDLIFE MANAGEMENT SEEKING REPEATABLE MEASUREMENT
NATIONAL MILITARYFISH & WILDLIFEASSOCIATION
Wednesday, March 12, 2014
Jonathan DunnAECOM

Vegetation Mapping and Wildlife HabitatOutline of Presentation
1. How is a fine-scale vegetation map useful to the Wildlife Manager?
2. How are fine-scale vegetation maps typically produced?
3. How do methods for fine-scale and broad-scale mapping differ?
4. How can these methods be used for monitoring habitats and detecting change?

Vegetation Mapping and Wildlife HabitatConcepts
An accurate and sufficiently attributed vegetation map is a fundamentally useful base analysis layer for wildlife management
Minimum attribution should include finest level of vegetation classification possible (Group < Alliance < Association) and additional compositional and structural characteristics (cover density, heterogeneity, height, etc)
But “sufficient” attribution should also consider the habitat requirements and ecologies of the management species

Vegetation Mapping and Wildlife HabitatLocating Survey Areas and Quantifying Effort

Vegetation Mapping and Wildlife HabitatLocating Survey Areas and Quantifying Effort

Wildlife Habitat ModelVegetation Map Forms the Base Analysis Layer

NVCS HierarchyHierarchy Level Criteria
Upper: Physiognomy plays a predominant role.
L1 – Formation Class
road combinations of general dominant growth forms that are adapted to basic temperature (energy budget), moisture, and substrate/aquatic conditions.
L2 - Formation Subclass
Combinations of general dominant and diagnostic growth forms that reflect global macroclimatic factors driven primarily by latitude and continental position, or that reflect overriding substrate/aquatic conditions.
L3 – Formation Combinations of dominant and diagnostic growth forms that reflect global macroclimatic factors as modified by altitude, seasonality of precipitation, substrates, and hydrologic conditions.
Middle: Floristics and physiognomy play predominant roles
L4 – Division Combinations of dominant and diagnostic growth forms and a broad set of diagnostic plant species that reflect biogeographic differences in composition and continental differences in mesoclimate, geology, substrates, hydrology, and disturbance regimes.
L5 – Macrogroup
Combinations of moderate sets of diagnostic plant species and diagnostic growth forms, that reflect biogeographic differences in composition and sub-continental to regional differences in mesoclimate, geology, substrates, hydrology, and disturbance regimes.
L6 – Group Combinations of relatively narrow sets of diagnostic plant species (including dominants and co-dominants), broadly similar composition, and diagnostic growth forms that reflect regional mesoclimate, geology, substrates, hydrology and disturbance regimes.
Lower: Floristics plays a predominant role
L7 – Alliance Diagnostic species, including some from the dominant growth form or layer, and moderately similar composition that reflect regional to subregional climate, substrates, hydrology, moisture/nutrient factors, and disturbance regimes.
L8 – Association Diagnostic species, usually from multiple growth forms or layers, and more narrowly similar composition that reflect topo-edaphic climate, substrates, hydrology, and disturbance regimes.

Wildlife Habitat ModelVegetation Map Forms the Base Analysis Layer
Habitats include:annual grassland and coastal sage scrub with sparse shrub cover, commonly in association with Eriogonum fasciculatum, Artemisia californica, and Erodium cicutarium Typical habitat includes sparsely vegetated areas (perennial cover less than 30%)
with loose, friable, well-drained soil (generally at least 0.5 m deep) and flat or gently rolling terrain.(USFWS, 1997)
Stephens' kangaroo rat (Dipodomys stephensi)

Wildlife Habitat ModelVegetation Map Forms the Base Analysis Layer
Habitats include:annual grassland and coastal sage scrub with sparse shrub cover, commonly in association with Eriogonum fasciculatum, Artemisia californica, and Erodium cicutarium Typical habitat includes sparsely vegetated areas (perennial cover less than 30%)
with loose, friable, well-drained soil (generally at least 0.5 m deep) and flat or gently rolling terrain.(USFWS, 1997)
Vegetation map
NVCS Alliance
Association
Vegetation mapPercent Cover
By Stratum
SoilsNRCS Soil Series
Topography
USGS DEMOthers
Stephens' kangaroo rat (Dipodomys stephensi)

Wildlife Habitat ModelVegetation Map Forms the Base Analysis Layer
Habitats :Prefers vegetation dominated byEriogonum fasciculatum andArtemisia californica
Disfavors vegetation dominated bySalvia mellifera, and Malosma laurina
Typical habitat structure is openwith shrub cover range of 25 – 40%
Disfavors vegetation greater than 2 meters
Vegetation map
NVCS Alliance
Association
Vegetation mapDensity of Cover
By Stratum
Vegetation map Vegetation Height
By Stratum
California gnatcather (Polioptila californica)

Wildlife Habitat ModelVegetation Map Forms the Base Analysis Layer

Wildlife Habitat ModelVegetation Map Forms the Base Analysis Layer

Wildlife Habitat ModelVegetation Map Forms the Base Analysis Layer
Habitats :Prefers vegetation dominated byEriogonum fasciculatum andArtemisia californica
Disfavors vegetation dominated bySalvia mellifera, and Malosma laurina
Nests almost exclusively in Opuntia littoralis, O. oricola, and Cylindropuntia prolifera
Vegetation map
NVCS Alliance
Association
Coastal cactus wren (Campylorhynchus brunneicapillus)

Creating a Fine-Scale Vegetation MapMethodology
• Prepare (or adopt) a Vegetation Classification– Collect quantitative environmental data in the form of Rapid
Assessments (or Relevés)– Conduct statistical analysis of dataset to form basis for
classifications (ordination)– Define the qualitative and quantitative descriptions
(membership rules)
• Define mapping rules – How to spatially apply themes• Field map to begin delineating stands of vegetation • Complete work through heads up digitization in lab • Conduct accuracy assessment of final map

Creating a Fine-Scale Vegetation MapMethodology – Calibration

Creating a Fine-Scale Vegetation MapMethodology – Data Collection

Creating a Fine-Scale Vegetation MapMethodology – Data Analysis
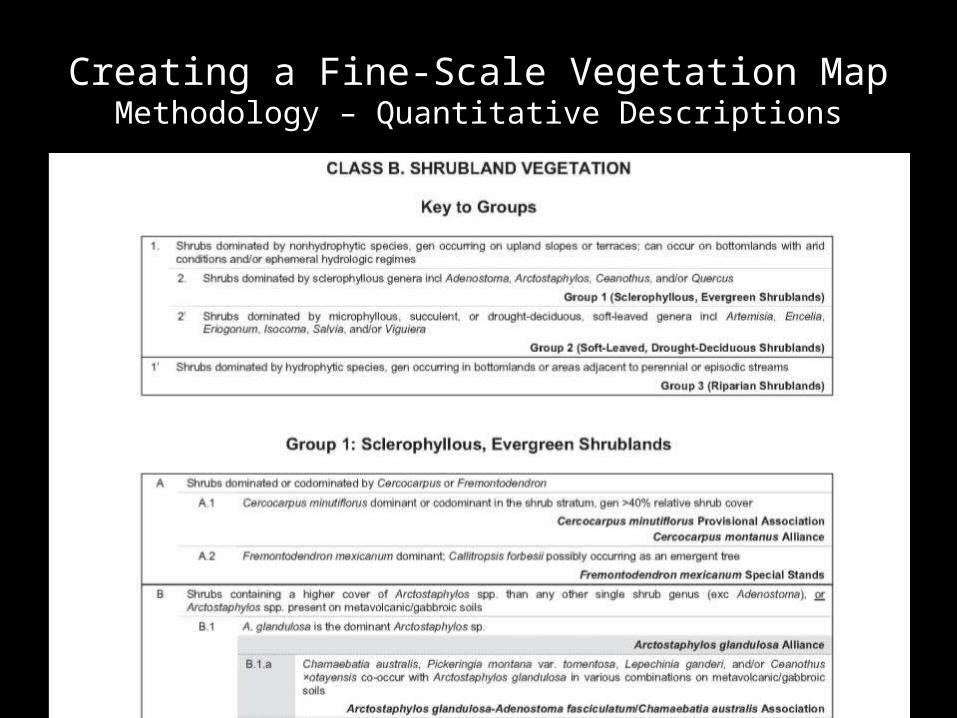
Creating a Fine-Scale Vegetation MapMethodology – Quantitative Descriptions

Creating a Fine-Scale Vegetation MapMethodology – Field Mapping

Creating a Fine-Scale Vegetation MapMethodology – Office Mapping

Creating a Fine-Scale Vegetation MapMethodology – Data Management

Creating a Fine-Scale Vegetation MapMethodology – Accuracy Assessment

Vegetation MappingFine-scale >< Broad-scale
Typically performed by botanists and vegetation ecologists (The Natural Sciences Department)
Typically performed by geographers (The Physical
Sciences Department)
Typically hand-drawn over high resolution 3 or 4 band
imagery
Typically computer generated from low resolution >4 band
imageryAlmost exclusively vector
basedAlmost exclusively raster
basedEven with rules, its subtleties
can be fairly subjective Even with algorithms , its
subtleties can be difficult to interpret
Difficult to sequentially compare
(see above)
Easy to sequentially compare
(see above)

Change Detection MappingSubtleties of Interpretation

Change Detection Mapping
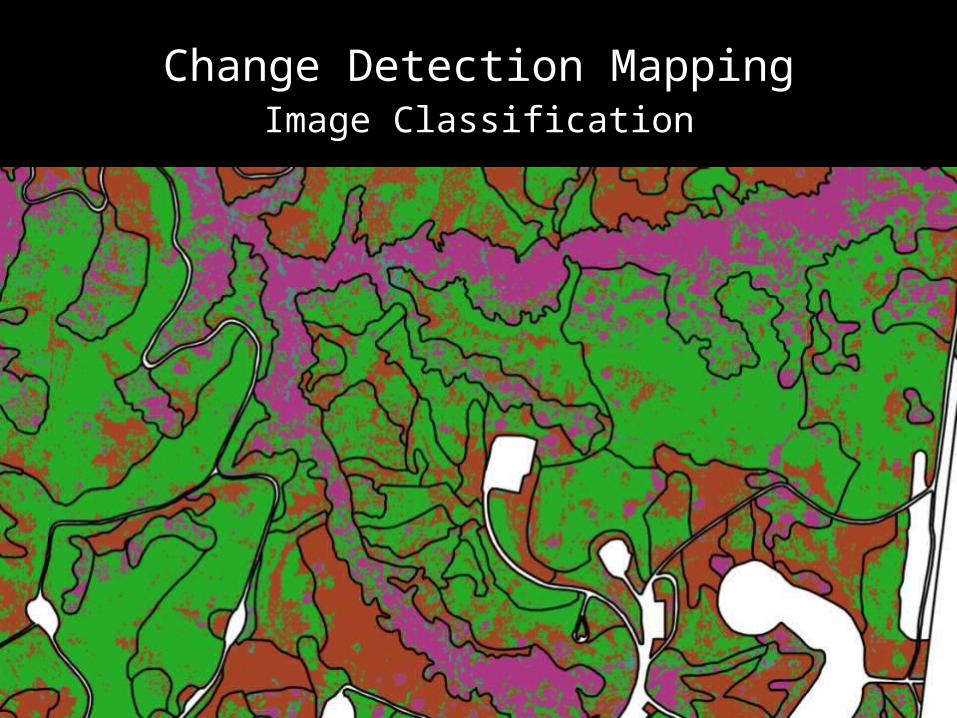
Change Detection MappingImage Classification
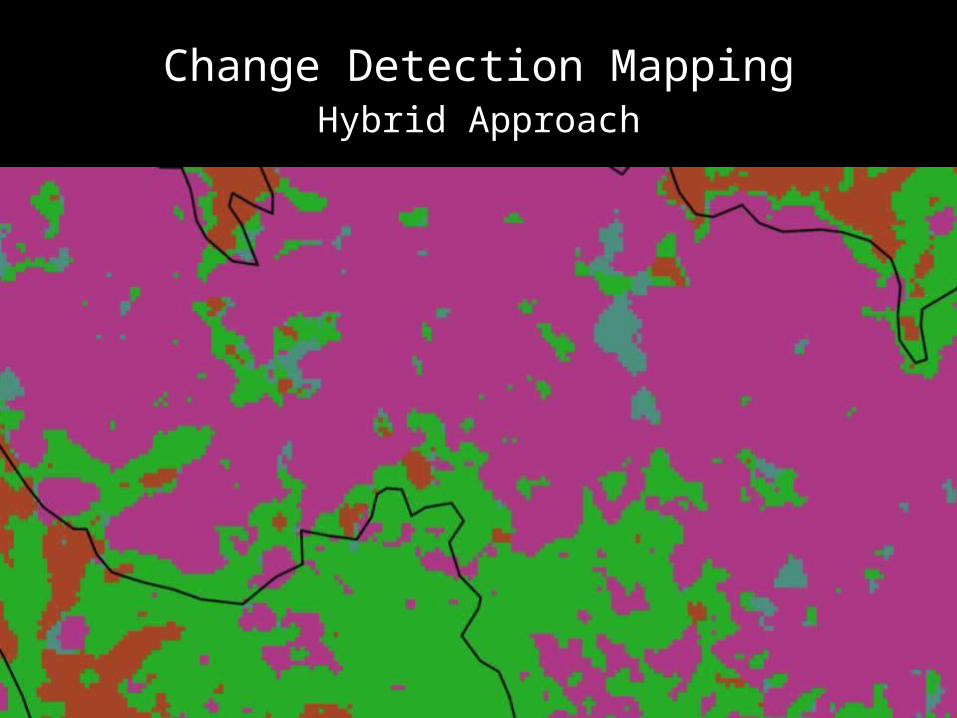
Change Detection MappingHybrid Approach
Change Detection MappingAdvances in Remote Sensing and Classification
• Intellectual Advances• Sub-pixel analysis• Object-based image analysis
• Technological Advances• Increased resolution• Improving cost curve• Increase sampling frequency• Collection of multiple phenologies

Change Detection MappingAdvances in Remote Sensing and Classification


Jonathan Dunn AECOM San Diego, California