Embed Size (px)
Citation preview
VEGETATION MANAGEMENT BYCHEMICAL AND MECHANICAL
METHODS INASPEN (Populus tremuloides)
-DOMINATED CLEARCUTS:Vegetation response six years after treatment
1995
W.L. StrongECOLOGICAL LAND SURVEYS LTD.
S.S. Sidhu and S. NavratilCANADIAN FOREST SERVICE
This publication is based on a joint research project by Canadian ForestService and Land and Forest Services pursuant to theCanada-Alberta Partnership Agreement in Forestry.
A8013-122
DISCLAIMER
The study on which this report is based was funded in part under the Canada-Alberta PartnershipAgreement in Forestry.
The views, conclusions and recommendations are those of the authors. The exclusion of certainmanufactured products does not necessarily imply disapproval nor does the mention of otherproducts necessarily imply endorsement by Canadian Forest Service or Land and Forest Services.
This report did not undergo a scientific review process and may appear as scientific publicationsfollowing an appropriate review.
(c) Minister of Supply and Services Canada 1995Catalogue No.: Fo42-91/122-1995EISBN: 0-662-21726-8
Additional copies of this publication are available at no charge from:
Canadian Forest ServiceNatural Resources CanadaNorthern Forestry Centre
5320 - 122'd StreetEdmonton, Alberta
T6H 3S5Telephone: (403) 435 - 7210
or
Land and Forest ServicesAlberta Environmental Protection
10th Floor, Bramalea Building9920 - 108 Street
Edmonton, AlbertaT5K 2M4
Telephone: (403) 427 - 3551
iii
ABSTRACT
The primary objectives of this study were to assess differences in vegetation composition, plantcommunity structure, biodiversity, and conifer crop seedling growth as a result of different sitepreparation and conifer release treatments. The site preparation experiments (n = 900 plots)involved the use of 2 kg/ha and 4 kg/ha of hexazinone, Rome double disking, and disk trenching.Disk trenching followed by either the application of 2 kg/ha or 4 kg/ha of hexazinone, or bybrushsawing, and Rome double disking were the treatments applied in the conifer releaseexperiments (n = 600 plots). This analysis included pre-treatment data collected in 1986 andpost-treatment data collected in 1988 and 1992-1994. Significant (P <0.05) differences in thevegetation were found after several years of growth among the treatment plots and relative to thecontrol plots. These differences consisted of reduced total plant cover, differences in speciesabundance, and fewer woody stems per hectare. All treatments had an effect on the nativevegetation, but Rome double disking had the most substantial impact (e.g., >60 percent reductionin woody stems) of the site preparation treatments, while disk trenching followed by 4 kg/hahexazinone and Rome double disking tended to be the most effective treatments for coniferrelease. The hexazinone treatments tended to have a greater number of species and higher levelsof diversity than the controls or other treatments. Based on a combination of seedling height,vigor, and survival rate, lodgepole pine (Pines contorta) growth was significantly (P <0.05) betterin the Rome double disking plots of both experiments. The best white spruce (Picea glauca)growth was promoted by the use of 4 kg/ha and 2 kg/ha of hexazinone in the site preparation andconifer release experiments, respectively. These treatments also greatly improved lodgepole pinestocking levels relative to the untreated vegetation. Various competition variables and indiceswere examined to identify parameters that were correlated with crop seedling height growth.
Key words: Site preparation, conifer release, vegetation management, hexazinone, Rome disk,disk trench, brushsawing, white spruce, lodgepole pine
iv

TABLE OF CONTENTS
Page
1.0 INTRODUCTION 1
2.0 STUDY AREA 3
3.0 METHODS 63.1 Experimental Design 63.2 Vegetation Sampling 8
3.2.1 Stem Density 93.2.2 Vegetation Cover Analysis 103.2.3 Seedling Growth and Vigor 11
3.3 Data Analysis 123.3.1 Statistical Description and Testing 123.3.2 Cluster Analysis 133.3 .3 Diversity Measures 14
4.0 RESULTS 154.1 Site Preparation Experiments 15
4.1.1 Pre-treatment Vegetation Characteristics 154.1.2 Post-treatment Vegetation 32
4.1.2.1 Control Plots 324.1.2.2 2 kg/ha Hexazinone Treatment Plots 344.1.2.3 4 kg/ha Hexazinone Treatment Plots 374.1.2.4 Rome Double Disking Treatment Plots 394.1.2.5 Disk Trenching Treatment Plots 41
4.1.3 Comparison of Treatments 434.1.4 Crop Seedling Characteristics 51
4.2 Conifer Release Experiments 564.2.1 Post-treatment Vegetation 56
4.2.1.1 Control Plots 564.2.1.2 Disk Trenching and 2 kg/ha Hexazinone Plots 694.2.1.3 Disk Trenching and 4 kg/ha Hexazinone Plots 714.2.1.4 Rome Double Disking Plots 734.2.1.5 Disk Trenching Followed by Brushsawing Plots 73
4.2.2 Comparison of Treatments 774.2.3 Crop Seedling Characteristics 81
5.0 A PRELIMINARY ANALYSIS OF COMPETITION VARIABLES 875.1 Site Preparation Experiment Blocks 88
5.1.1 Pinus contorta Crop Seedlings 885.1.2 Picea glauca Crop Seedlings 93
5.2 Conifer Release Experiment Blocks 965.2.1 Pinus contorta Crop Seedlings 965.2.2 Picea glauca Crop Seedlings 101
6.0 SUMMARY AND INTERPRETATIONS 1056.1 Site Preparation Experiments 1056.2 Conifer Release Experiments 111
7.0 RECOMMENDATIONS 116
ACKNOWLEDGEMENTS 117
REFERENCES 118
APPENDIX I. PLOT MEMBERSHIP OF SITE PREPARATION DENDROGRAM . . . 121
APPENDIX II. PLOT MEMBERSHIP OF CONIFER RELEASE DENDROGRAM . . • 126
vi
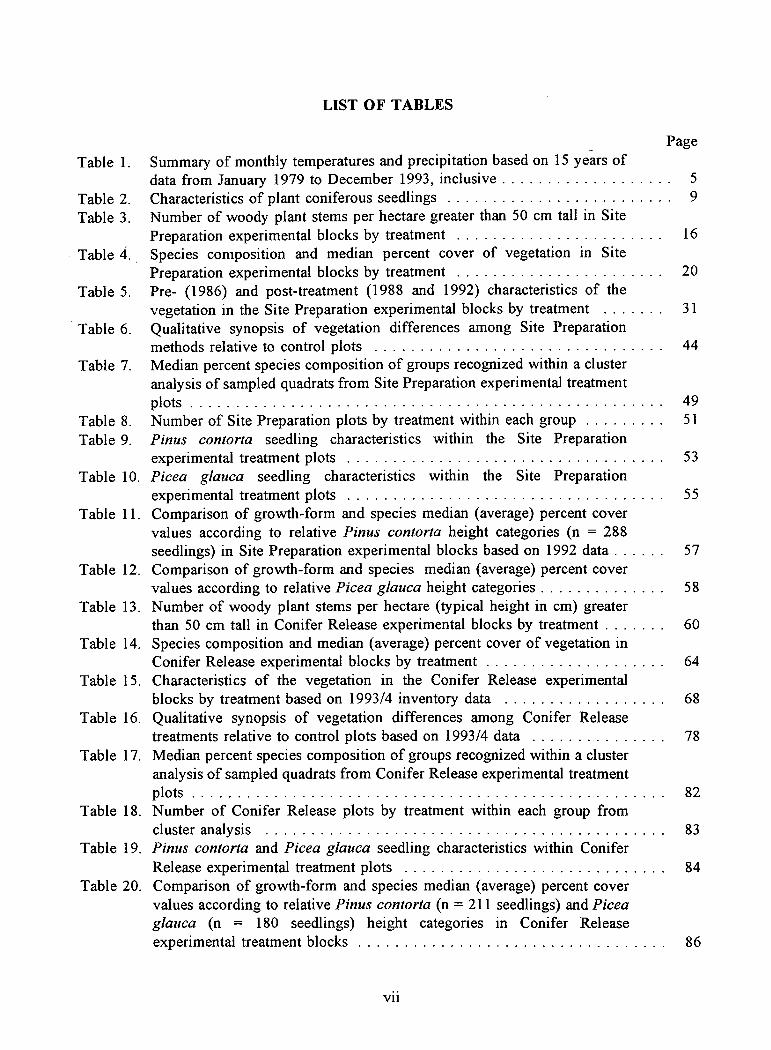
LIST OF TABLES
PageTable 1. Summary of monthly temperatures and precipitation based on 15 years of
data from January 1979 to December 1993, inclusive 5Table 2. Characteristics of plant coniferous seedlings 9Table 3. Number of woody plant stems per hectare greater than 50 cm tall in Site
Preparation experimental blocks by treatment 16Table 4. Species composition and median percent cover of vegetation in Site
Preparation experimental blocks by treatment 20Table 5. Pre- (1986) and post-treatment (1988 and 1992) characteristics of the
vegetation in the Site Preparation experimental blocks by treatment 31Table 6. Qualitative synopsis of vegetation differences among Site Preparation
methods relative to control plots 44Table 7. Median percent species composition of groups recognized within a cluster
analysis of sampled quadrats from Site Preparation experimental treatmentplots 49
Table 8. Number of Site Preparation plots by treatment within each group 51Table 9. Pinus contorta seedling characteristics within the Site Preparation
experimental treatment plots 53Table 10. Picea glauca seedling characteristics within the Site Preparation
experimental treatment plots 55Table 11. Comparison of growth-form and species median (average) percent cover
values according to relative Pinus contorta height categories (n = 288seedlings) in Site Preparation experimental blocks based on 1992 data 57
Table 12. Comparison of growth-form and species median (average) percent covervalues according to relative Picea glauca height categories 58
Table 13. Number of woody plant stems per hectare (typical height in cm) greaterthan 50 cm tall in Conifer Release experimental blocks by treatment 60
Table 14. Species composition and median (average) percent cover of vegetation inConifer Release experimental blocks by treatment 64
Table 15. Characteristics of the vegetation in the Conifer Release experimentalblocks by treatment based on 1993/4 inventory data 68
Table 16. Qualitative synopsis of vegetation differences among Conifer Releasetreatments relative to control plots based on 1993/4 data 78
Table 17. Median percent species composition of groups recognized within a clusteranalysis of sampled quadrats from Conifer Release experimental treatmentplots 82
Table 18. Number of Conifer Release plots by treatment within each group fromcluster analysis 83
Table 19. Pinus contorta and Picea glauca seedling characteristics within ConiferRelease experimental treatment plots 84
Table 20. Comparison of growth-form and species median (average) percent covervalues according to relative Pinus contorta (n = 211 seedlings) and Piceaglauca (n = 180 seedlings) height categories in Conifer Releaseexperimental treatment blocks 86
vii
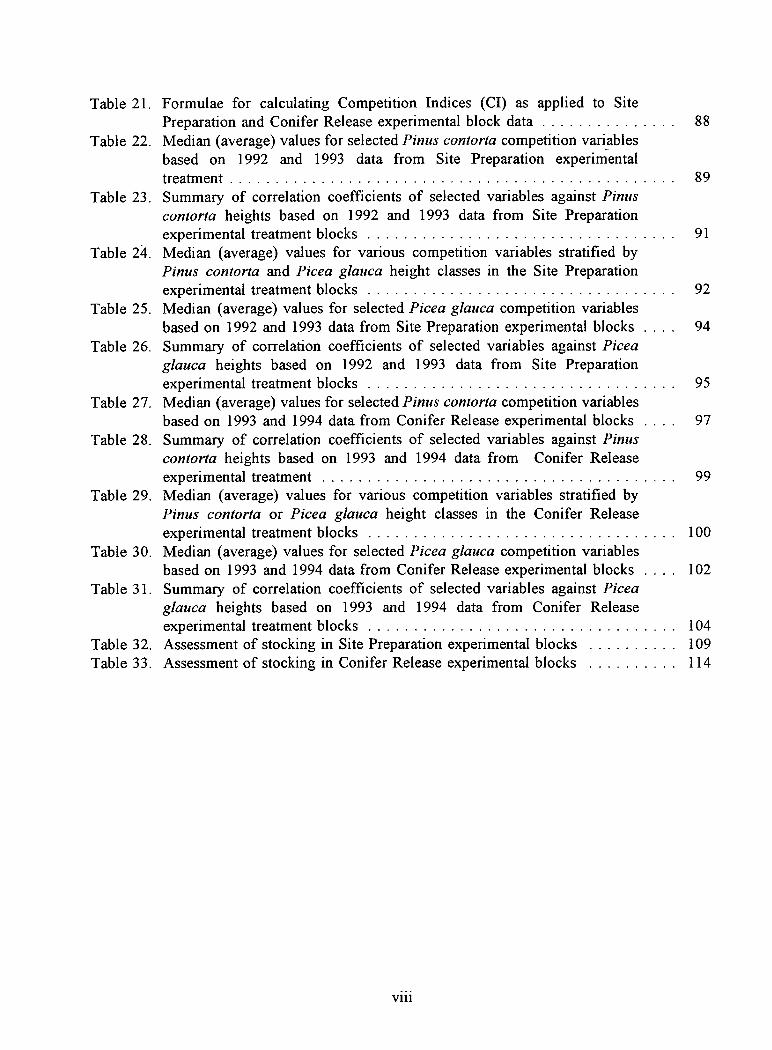
Table 21. Formulae for calculating Competition Indices (CI) as applied to SitePreparation and Conifer Release experimental block data 88
Table 22. Median (average) values for selected Pinus contorta competition variablesbased on 1992 and 1993 data from Site Preparation experimentaltreatment 89
Table 23. Summary of correlation coefficients of selected variables against Pinuscontorta heights based on 1992 and 1993 data from Site Preparationexperimental treatment blocks 91
Table 24. Median (average) values for various competition variables stratified byPinus contorta and Picea glauca height classes in the Site Preparationexperimental treatment blocks 92
Table 25. Median (average) values for selected Picea glauca competition variablesbased on 1992 and 1993 data from Site Preparation experimental blocks . 94
Table 26. Summary of correlation coefficients of selected variables against Piceaglauca heights based on 1992 and 1993 data from Site Preparationexperimental treatment blocks 95
Table 27. Median (average) values for selected Pinus contorta competition variablesbased on 1993 and 1994 data from Conifer Release experimental blocks . 97
Table 28. Summary of correlation coefficients of selected variables against Pinuscontorta heights based on 1993 and 1994 data from Conifer Releaseexperimental treatment 99
Table 29. Median (average) values for various competition variables stratified byPinus contorta or Picea glauca height classes in the Conifer Releaseexperimental treatment blocks 100
Table 30. Median (average) values for selected Picea glauca competition variablesbased on 1993 and 1994 data from Conifer Release experimental blocks . 102
Table 31. Summary of correlation coefficients of selected variables against Piceaglauca heights based on 1993 and 1994 data from Conifer Releaseexperimental treatment blocks 104
Table 32. Assessment of stocking in Site Preparation experimental blocks 109Table 33. Assessment of stocking in Conifer Release experimental blocks 114
viii
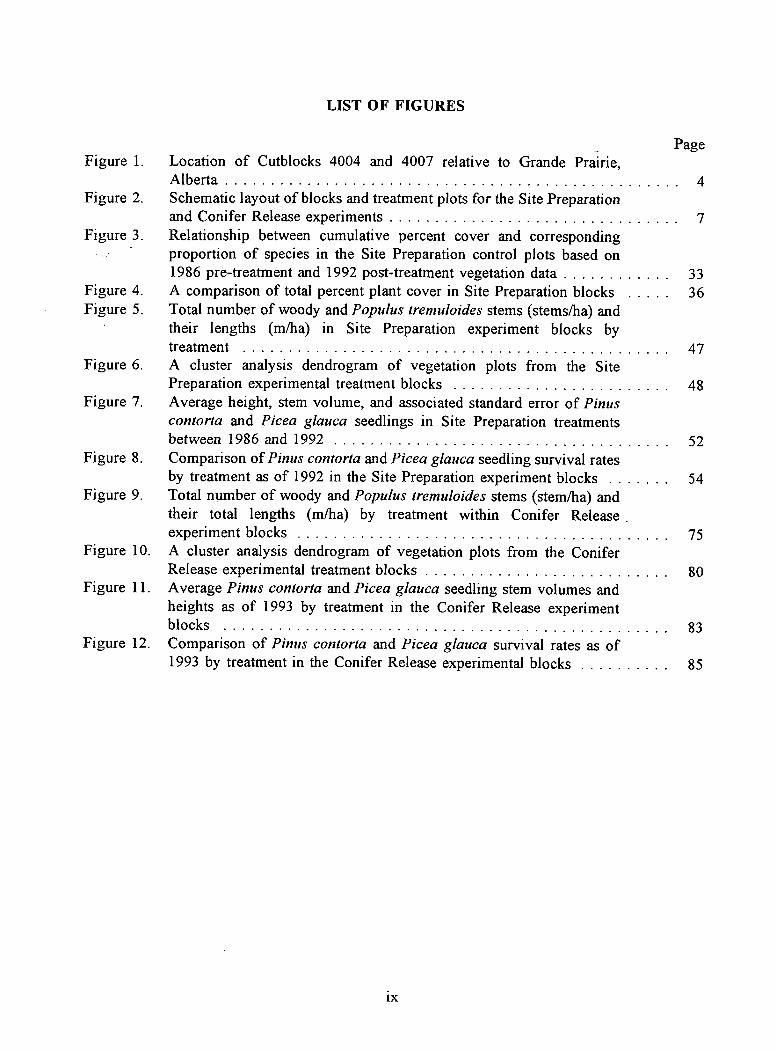
LIST OF FIGURES
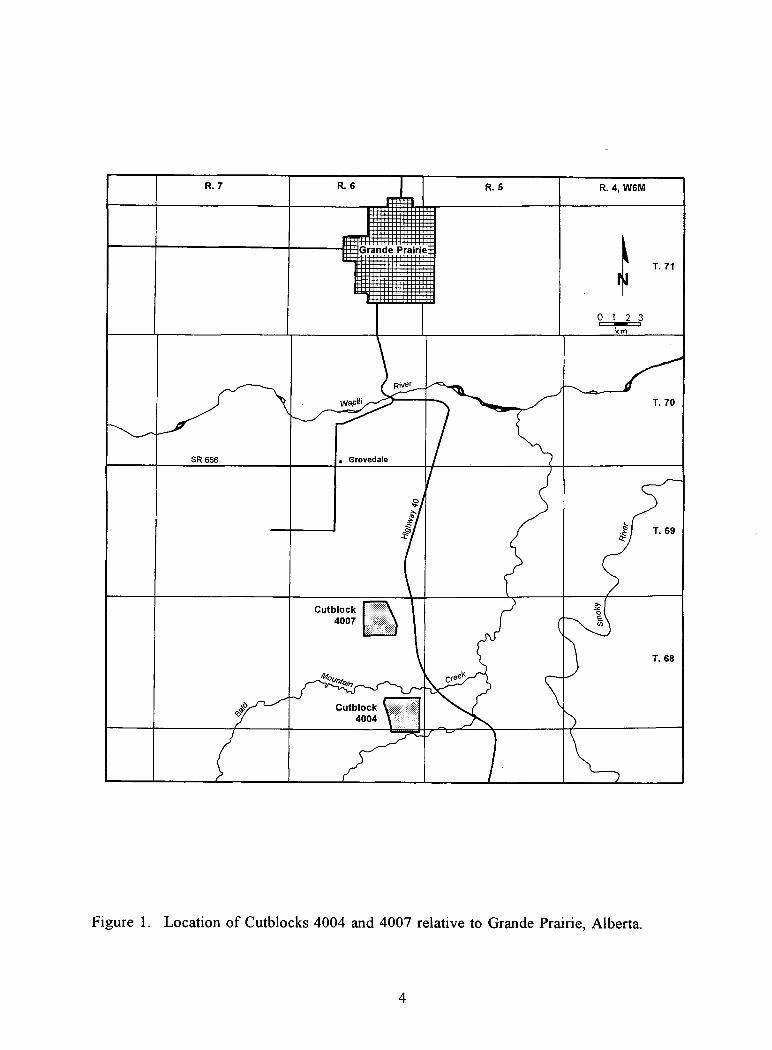
PageFigure 1. Location of Cutblocks 4004 and 4007 relative to Grande Prairie,
Alberta 4Figure 2. Schematic layout of blocks and treatment plots for the Site Preparation
and Conifer Release experiments 7Figure 3. Relationship between cumulative percent cover and corresponding
proportion of species in the Site Preparation control plots based on1986 pre-treatment and 1992 post-treatment vegetation data 33
Figure 4. A comparison of total percent plant cover in Site Preparation blocks 36Figure 5. Total number of woody and Populus tremuloides stems (stems/ha) and
their lengths (m/ha) in Site Preparation experiment blocks bytreatment 47
Figure 6. A cluster analysis dendrogram of vegetation plots from the SitePreparation experimental treatment blocks 48
Figure 7. Average height, stem volume, and associated standard error of Pinuscontorta and Picea glauca seedlings in Site Preparation treatmentsbetween 1986 and 1992 52
Figure 8. Comparison of Pinus contorta and Picea glauca seedling survival ratesby treatment as of 1992 in the Site Preparation experiment blocks 54
Figure 9. Total number of woody and Populus tremuloides stems (stem/ha) andtheir total lengths (m/ha) by treatment within Conifer Release .experiment blocks 75
Figure 10. A cluster analysis dendrogram of vegetation plots from the ConiferRelease experimental treatment blocks 80
Figure 11. Average Pinus contorta and Picea glauca seedling stem volumes andheights as of 1993 by treatment in the Conifer Release experimentblocks 83
Figure 12. Comparison of Pinus contorta and Picea glauca survival rates as of1993 by treatment in the Conifer Release experimental blocks 85
ix
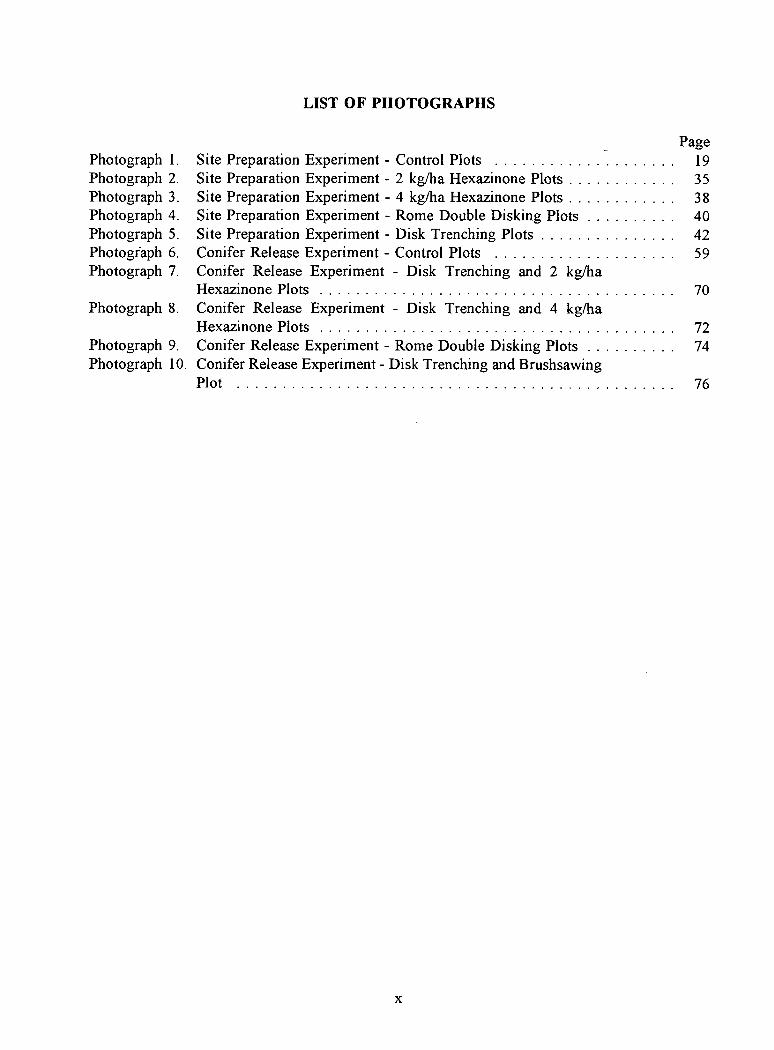
LIST OF PHOTOGRAPHS
Photograph 1.Photograph 2.Photograph 3.Photograph 4.Photograph 5.Photogfaph 6.Photograph 7.
Photograph 8.
Photograph 9.Photograph 10.
PageSite Preparation Experiment - Control Plots 19Site Preparation Experiment - 2 kg/ha Hexazinone Plots 35Site Preparation Experiment - 4 kg/ha Hexazinone Plots 38Site Preparation Experiment - Rome Double Disking Plots 40Site Preparation Experiment - Disk Trenching Plots 42Conifer Release Experiment - Control Plots 59Conifer Release Experiment - Disk Trenching and 2 kg/haHexazinone Plots
70
Conifer Release Experiment - Disk Trenching and 4 kg/haHexazinone Plots
72
Conifer Release Experiment - Rome Double Disking Plots 74Conifer Release Experiment - Disk Trenching and BrushsawingPlot
76
x
1.0 INTRODUCTION
Prior to the mid-1980's forestry activities in Alberta were primarily oriented towards theproduction of lumber and wood pulp for paper from white spruce (Picea glauca (Moench) Voss),Engelmann spruce (Picea engelmannii Parry ex Engelm.), lodgepole pine (Pinus contorta Loudonvar. latifolia Engelm.), and black spruce (Picea inariana (Mill.) BSP.).' These are common treesin the mountain and foothill zones along the west side of the province. White spruce is theprimary commercial species in the mixedwood portion of the boreal forest. To facilitate the long-term sustainability of these softwood forests, loggers are required to meet minimum coniferstocking standards within a few years after cutting (Anonymous 1993). Restocking is usuallyaccomplished by either hand planting with nursery stock or by minimizing the cutblock sizewhich encourages natural regeneration. In addition, a variety of mechanical techniques have beenemployed for site preparation and planting to improve conifer seedling establishment and growth(Corns and Annas 1986, p. 213-215).
During the past ten years, however, most of the unallocated and unprotected deciduous forestsin Alberta were leased to companies for aspen (Populus tremuloides Michx.) harvesting.Historically, these deciduous and mixedwood forests had been of little commercial value, exceptfor their conifer component. Assuming a rotation age of 60 to 80 years (Bella and Yang 1991)and a productive land-base of 186,000 km 2 (Anonymous 1992a), annual cuts of deciduous andmixedwood forests could reach 2,300 to 3,100 km 2. The most common method of harvesting willprobably be clearcutting of aspen dominated area. Many of these clearcuts will be planted towhite spruce or lodgepole pine to ensure a future supply of softwood. The primary problem ofestablishing mixedwood stands is not a lack of adequate stocking but excessively high stemnumbers of aspen and other woody species (e.g., 50,000 to 70,000 stems/ha), since aspenregenerates readily from root suckers on most sites. Because of these high stem densities,coniferous seedlings are often subjected to severe competition from faster growing trees andshrubs, and occasionally from taller native forbs and graminoid species during the early stagesof seedling growth and stand establishment.
Clearcutting of aspen-dominated mixedwood forest stands can result in stocking problems, suchas aspen densities which are too high and inadequate stocking of conifers. Forest companies arerequired to correct the stocking deficiencies. As a result, foresters may need to use mechanicaland chemical forest management methods for site preparation and conifer release to controlcompeting vegetation. Use of chemical methods in forestry has not been accepted by the publicbecause of the large areas of forest that will be cut and the unknown long-terms effects ofchemical herbicides and mechanical methods on native vegetation and wildlife.
To respond to the environmental concerns related to the use of chemical herbicides andmechanical methods to manage forest vegetation, a research and monitoring project wasundertaken in 1985 by the Canadian Forest Service and Alberta Forest Service (Todd and Brace1987; Sidhu and Feng 1991). This experimental study was designed to determine the impact of
Vascular plant nomenclature follows Moss (1983).
chemical and mechanical forest management methods on vegetation as well as the fate ofherbicides and their residues in vegetation, soil, and small mammals. The initial environmentaleffects of these treatments have been measured and published (Feng et al. 1989a, 1989b; Penner1990; Sidhu and Feng 1991, 1993; Sidhu et al. 1994; Sidhu 1994). The present study representscontinued monitoring of these impacts, and analysis of vegetation composition and structureincluding biodiversity, seedling growth and associated competition indices. This report includesthe results of field measurements in 1992 through 1994, and comparison of the results to the pre-treatment baseline established in 1986 and post-treatment data from 1988.
2
2.0 STUDY AREA
The two sites selected for study were located approximately 23 km (Cutblock 4007) and 30 km(Cutblock 4004) south of Grande Prairie in west-central Alberta, Canada (Figure 1). The specificstudy sites were located within clearcuts approximately 130 ha and 85 ha in size (Twardy andDowgray 1985) that were logged in July and March of 1983, respectively. The general studyarea occurs within the Boreal South Cordilleran (SCb) Ecoclimatic region (Zoltai and Strong1989) or the Lower Boreal-Cordilleran Ecoregion (Strong 1992) which is a climatic andbiological transition zone between coniferous Cordilleran and deciduous Boreal forest biomes.Seral forests dominated by aspen with balsam poplar (Populus balsamifera L.), paper birch(Benda papynfera Marsh.), white spruce, and lodgepole pine commonly occur on moderately welldrained sites in this climatic zone.
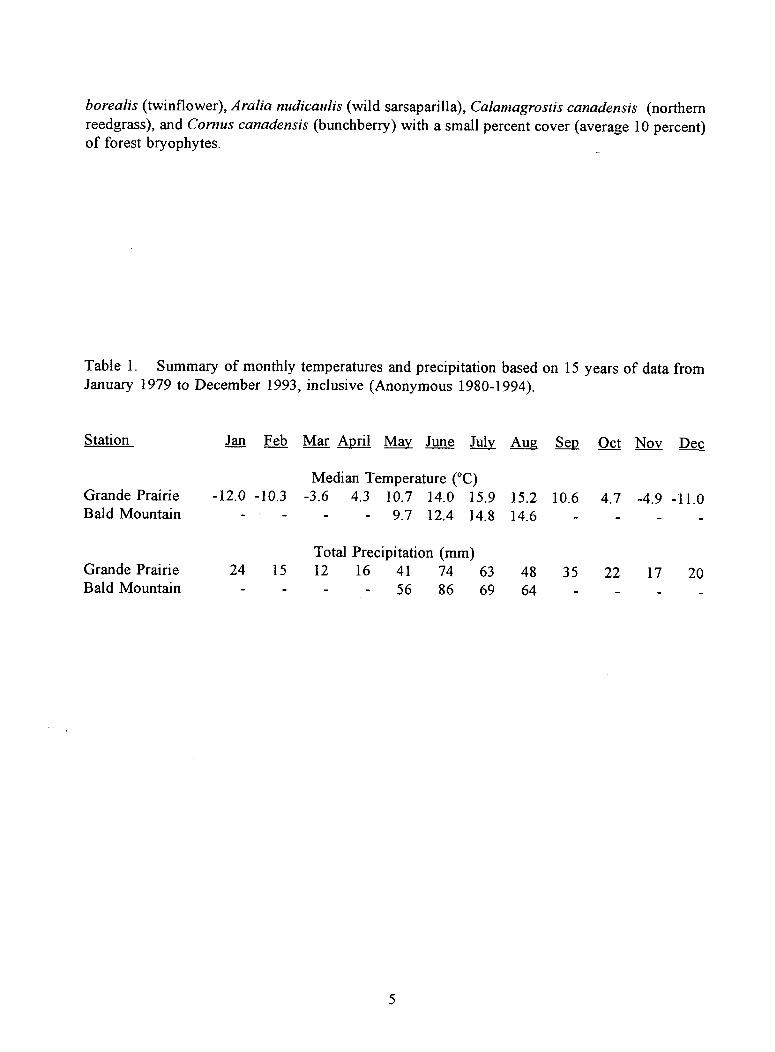
Monthly temperatures and precipitation values that typify the study area probably are betweenmeteorological values measured at the Grande Prairie Airport (Station 3072920) approximately30 km north of the study area -- a Low Boreal Mixedwood Ecoregion site -- and Bald MountainLookout (Station 3070480) -- a Low Boreal-Cordilleran Ecoregion site -- which is locatedapproximately 10 km south of the study area. This data suggests a 0.7° to 2.4°C and a 6 to 16mm difference in monthly temperature and precipitation values between the two stations (Table1). Monthly temperatures and precipitation values within the study area are probably 1°C lowerand 10 mm greater, respectively, than those experienced at Grande Prairie. As a result, the studyarea may have a greater availability of moisture than at Grande Prairie due to decreasedevapotranspiration rates and greater precipitation.
Both cutblocks occur within the Southern Alberta Uplands physiographic region (Pettapiece 1986)or ecodistrict (Strong 1992). This physiographic area consists of relatively flat-lying sedimentarybedrock that is higher in elevation than the adjacent Western Alberta Plain which occurs to thenorth and east, but lower than the more westerly Rocky Mountains or Foothills zones. Slopesin the two study areas were typically between three and five percent, but ranged up to ninepercent. The surficial deposits were dominated by lacustro-tills. Gleyed Solonetzic Gray(Donnelly Series) and less amounts of Gleyed Dark Gray Luvisolic soils (Esher Series) were thetypical soils (Twardy and Dowgray 1985). Surface horizons were silty clay to clay loam intexture, with clay in the subsurface horizons. Both sites were moderately well to imperfectlydrained. Cutblock 4004 seemed to be somewhat wetter than 4007.
Aspen dominated the overstory canopy of both study sites prior to harvesting, although Cutblock4007 was denser than 4004 and had a 20 percent cover of lodgepole pine. Overall canopy coverin Cutblock 4007 occurred within the 71 to 100 percent closure class with a height of 19 to 25m. Canopy closure was up to 50 percent in Cutblock 4004. Forest stands at both sites originatedabout 1918.
Before harvesting, the cutblock vegetation most likely belonged to the aspen facies of the WhiteSpruce/Mooseberry/Wild Sarsaparilla (LB5c) ecosystem described by Corns and Annas (1986),or its equivalent the Aspen-White Spruce-Lodgepole Pine/Low-bush Cranberry (11-D3.4)community-type described by Beckingham (1994). The understory vegetation was probablydominated by a mixture of Viburnum edule (mooseberry), Rosa acicularis (wild rose), Linnaea
3
R. 7 R. 6 R. 5 R. 4, W6M
T. 71
0 1 2 3=won=
km
Grande Prairie
n
SR 666
River — .4 ,
_
T. 70wapiti
. Grovedale
. .
v.,v...,
3r.c2)
ct---T.69
Cutblock4007
=. e
0
T. 68
,„„..9„ ree
III _n—,.. —
Figure 1. Location of Cutblocks 4004 and 4007 relative to Grande Prairie, Alberta.
4
borealis (twinflower), Aralia nudicaulis (wild sarsaparilla), Calainagrosiis canadensis (northernreedgrass), and Cornus canadensis (bunchberry) with a small percent cover (average 10 percent)of forest bryophytes.
Table 1. Summary of monthly temperatures and precipitation based on 15 years of data fromJanuary 1979 to December 1993, inclusive (Anonymous 1980-1994).
Station Jan Feb Mar April May June July Aug &p,Oct Nov Dec
Median Temperature (°C)Grande Prairie -12.0 -10.3 -3.6 4.3 10.7 14.0 15.9 15.2 10.6 4.7 -4.9 -11.0Bald Mountain - 9.7 12.4 14.8 14.6
Total Precipitation (mm)Grande Prairie 24 15 12 16 41 74 63 48 35 22 17 20Bald Mountain - 56 86 69 64
5
3.0 METHODS
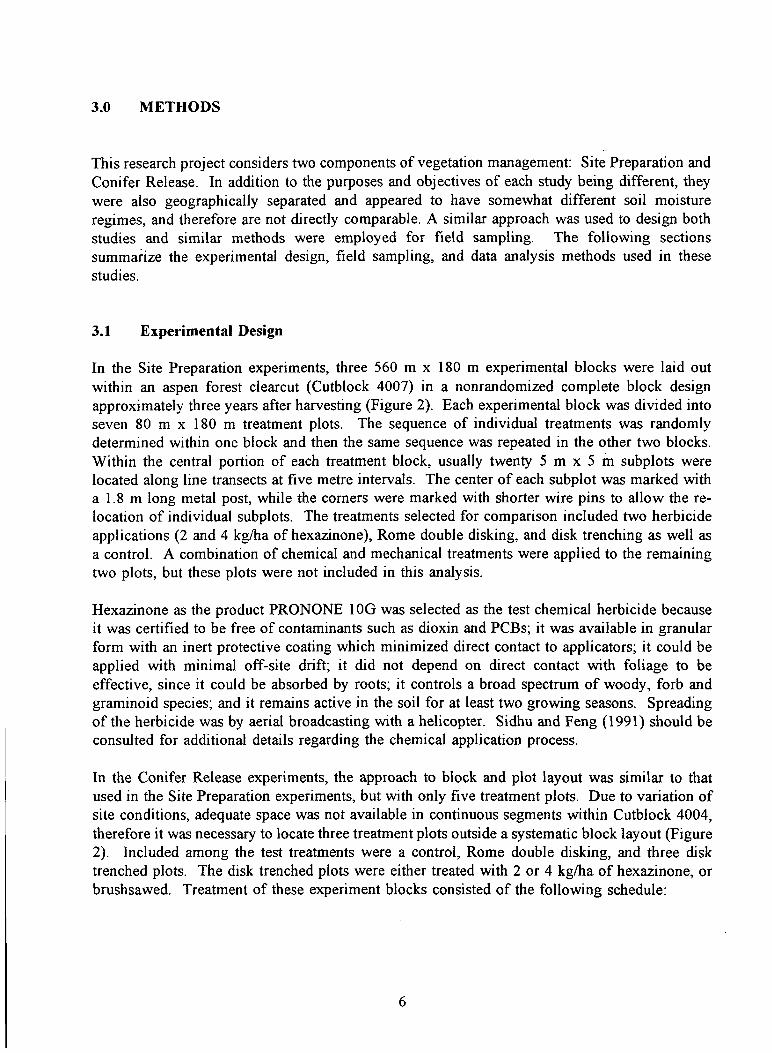
This research project considers two components of vegetation management: Site Preparation andConifer Release. In addition to the purposes and objectives of each study being different, theywere also geographically separated and appeared to have somewhat different soil moistureregimes, and therefore are not directly comparable. A similar approach was used to design bothstudies and similar methods were employed for field sampling. The following sectionssummarize the experimental design, field sampling, and data analysis methods used in thesestudies.
3.1 Experimental Design
In the Site Preparation experiments, three 560 m x 180 m experimental blocks were laid outwithin an aspen forest clearcut (Cutblock 4007) in a nonrandomized complete block designapproximately three years after harvesting (Figure 2). Each experimental block was divided intoseven 80 m x 180 m treatment plots. The sequence of individual treatments was randomlydetermined within one block and then the same sequence was repeated in the other two blocks.Within the central portion of each treatment block, usually twenty 5 m x 5 m subplots werelocated along line transects at five metre intervals. The center of each subplot was marked witha 1.8 m long metal post, while the corners were marked with shorter wire pins to allow the re-location of individual subplots. The treatments selected for comparison included two herbicideapplications (2 and 4 kg/ha of hexazinone), Rome double disking, and disk trenching as well asa control. A combination of chemical and mechanical treatments were applied to the remainingtwo plots, but these plots were not included in this analysis.
Hexazinone as the product PRONONE 10G was selected as the test chemical herbicide becauseit was certified to be free of contaminants such as dioxin and PCBs; it was available in granularform with an inert protective coating which minimized direct contact to applicators; it could beapplied with minimal off-site drift; it did not depend on direct contact with foliage to beeffective, since it could be absorbed by roots; it controls a broad spectrum of woody, forb andgraminoid species; and it remains active in the soil for at least two growing seasons. Spreadingof the herbicide was by aerial broadcasting with a helicopter. Sidhu and Feng (1991) should beconsulted for additional details regarding the chemical application process.
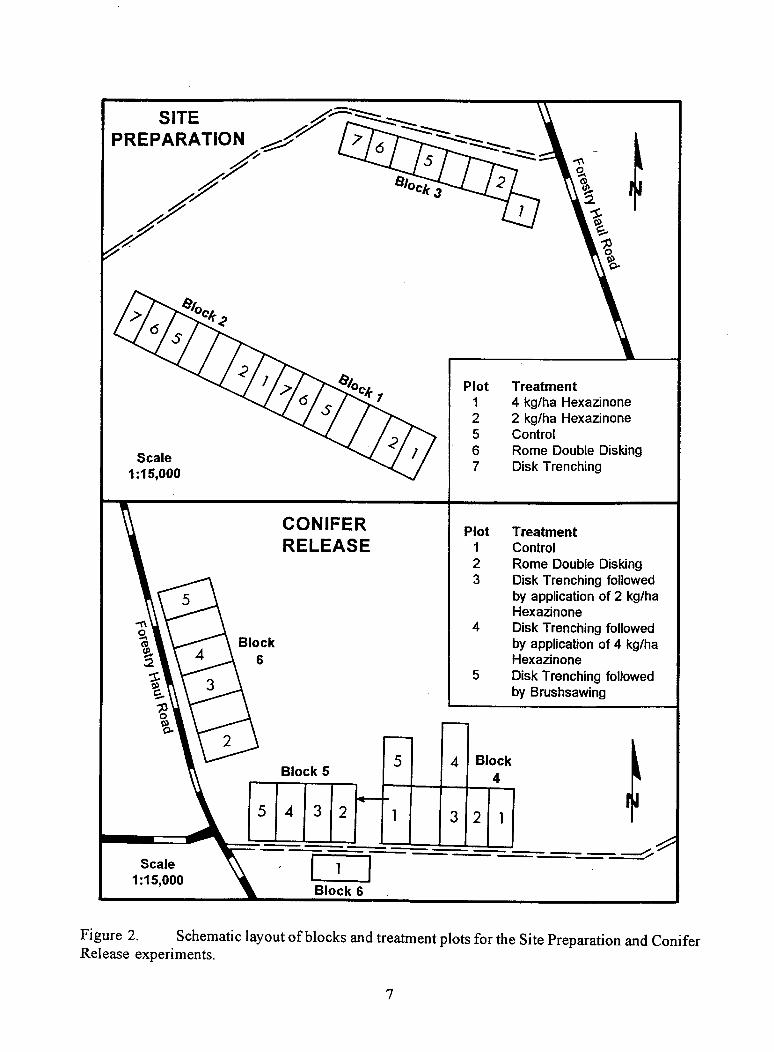
In the Conifer Release experiments, the approach to block and plot layout was similar to thatused in the Site Preparation experiments, but with only five treatment plots. Due to variation ofsite conditions, adequate space was not available in continuous segments within Cutblock 4004,therefore it was necessary to locate three treatment plots outside a systematic block layout (Figure2). Included among the test treatments were a control, Rome double disking, and three disktrenched plots. The disk trenched plots were either treated with 2 or 4 kg/ha of hexazinone, orbrushsawed. Treatment of these experiment blocks consisted of the following schedule:
6
SITEPREPARATION
Plot Treatment1 4 kg/ha Hexazinone2 2 kg/ha Hexazinone5 Control6 Rome Double Disking7 Disk Trenching
Scale1:15,000
Block4Block 5
Scale1:15,000
Block 6
Plot Treatment1 Control2 Rome Double Disking3 Disk Trenching followed
by application of 2 kg/haHexazinone
4 Disk Trenching followedby application of 4 kg/haHexazinone
5 Disk Trenching followedby Brushsawing
6Block
CONIFERRELEASE
Figure 2. Schematic layout of blocks and treatment plots for the Site Preparation and ConiferRelease experiments.
7
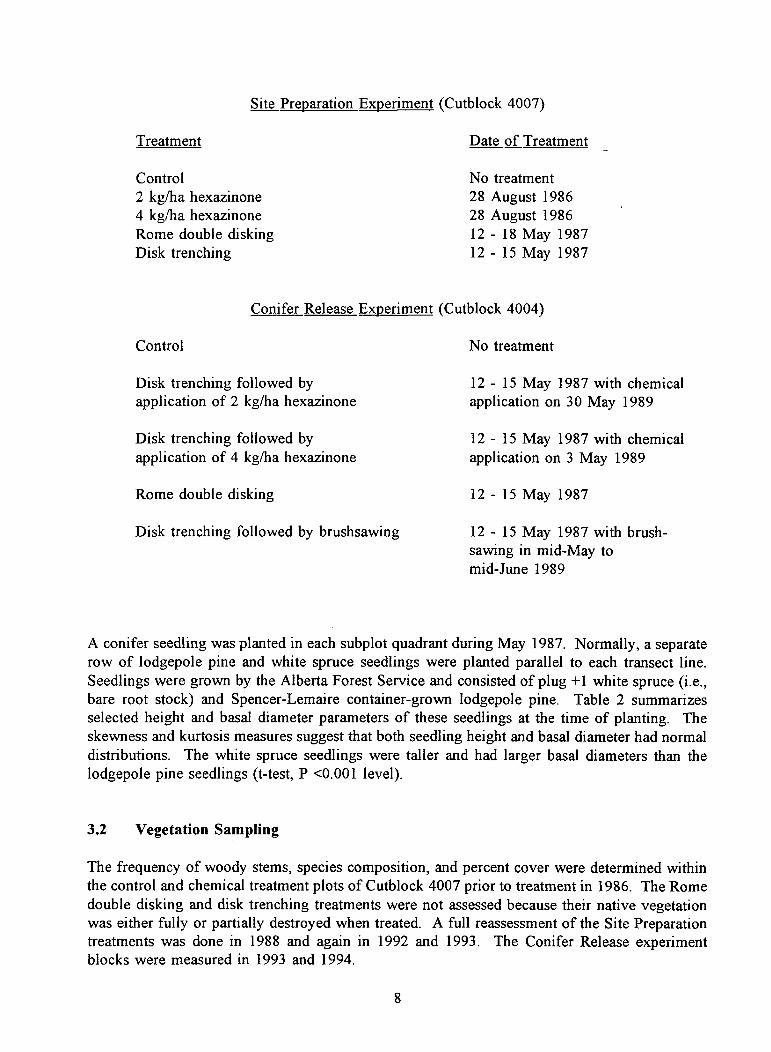
Site Preparation Experiment (Cutblock 4007)
Treatment
Date of Treatment
Control
No treatment2 kg/ha hexazinone
28 August 19864 kg/ha hexazinone
28 August 1986Rome double disking 12 - 18 May 1987
Disk trenching
12 - 15 May 1987
Conifer Release Experiment (Cutblock 4004)
Control
Disk trenching followed byapplication of 2 kg/ha hexazinone
Disk trenching followed byapplication of 4 kg/ha hexazinone
Rome double disking
Disk trenching followed by brushsawing
No treatment
12 - 15 May 1987 with chemicalapplication on 30 May 1989
12 - 15 May 1987 with chemicalapplication on 3 May 1989
12 - 15 May 1987
12 - 15 May 1987 with brush-sawing in mid-May tomid-June 1989
A conifer seedling was planted in each subplot quadrant during May 1987. Normally, a separaterow of lodgepole pine and white spruce seedlings were planted parallel to each transect line.Seedlings were grown by the Alberta Forest Service and consisted of plug +1 white spruce (i.e.,bare root stock) and Spencer-Lemaire container-grown lodgepole pine. Table 2 summarizesselected height and basal diameter parameters of these seedlings at the time of planting. Theskewness and kurtosis measures suggest that both seedling height and basal diameter had normaldistributions. The white spruce seedlings were taller and had larger basal diameters than thelodgepole pine seedlings (t-test, P <0.001 level).
3.2 Vegetation Sampling
The frequency of woody stems, species composition, and percent cover were determined withinthe control and chemical treatment plots of Cutblock 4007 prior to treatment in 1986. The Romedouble disking and disk trenching treatments were not assessed because their native vegetationwas either fully or partially destroyed when treated. A full reassessment of the Site Preparationtreatments was done in 1988 and again in 1992 and 1993. The Conifer Release experimentblocks were measured in 1993 and 1994.
8
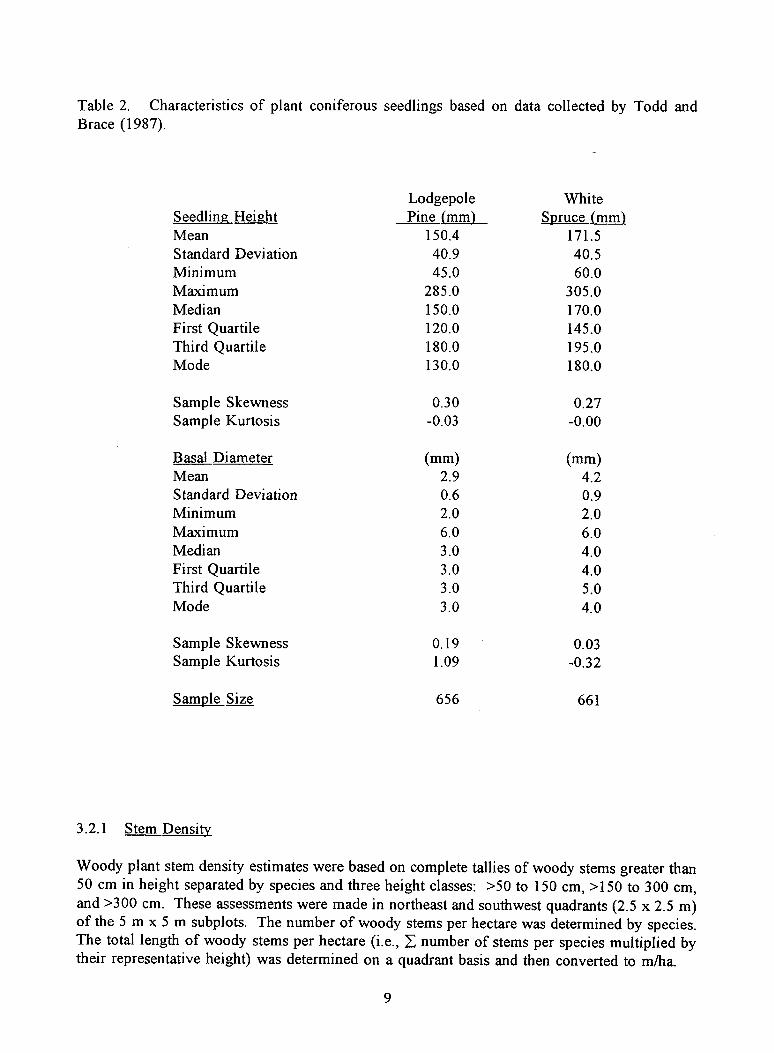
Table 2. Characteristics of plant coniferous seedlings based on data collected by Todd andBrace (1987).
Lodgepole WhiteSeedling Height Pine (mm) Spruce (mm)Mean 150.4 171.5Standard Deviation 40.9 40.5Minimum 45.0 60.0Maximum 285.0 305.0Median 150.0 170.0First Quartile 120.0 145.0Third Quartile 180.0 195.0Mode 130.0 180.0
Sample Skewness 0.30 0.27Sample Kurtosis -0.03 -0.00
Basal Diameter (mm) (mm)Mean 2.9 4.2Standard Deviation 0.6 0.9Minimum 2.0 2.0Maximum 6.0 6.0Median 3.0 4.0First Quartile 3.0 4.0Third Quartile 3.0 5.0Mode 3.0 4.0
Sample Skewness 0.19 0.03Sample Kurtosis 1.09 -0.32
Sample Size 656 661
3.2.1 Stem Density
Woody plant stem density estimates were based on complete tallies of woody stems greater than50 cm in height separated by species and three height classes: >50 to 150 cm, >150 to 300 cm,and >300 cm. These assessments were made in northeast and southwest quadrants (2.5 x 2.5 m)of the 5 m x 5 m subplots. The number of woody stems per hectare was determined by species.The total length of woody stems per hectare (i.e., E number of stems per species multiplied bytheir representative height) was determined on a quadrant basis and then converted to m/ha.
9
3.2.2 Vegetation Cover Analysis
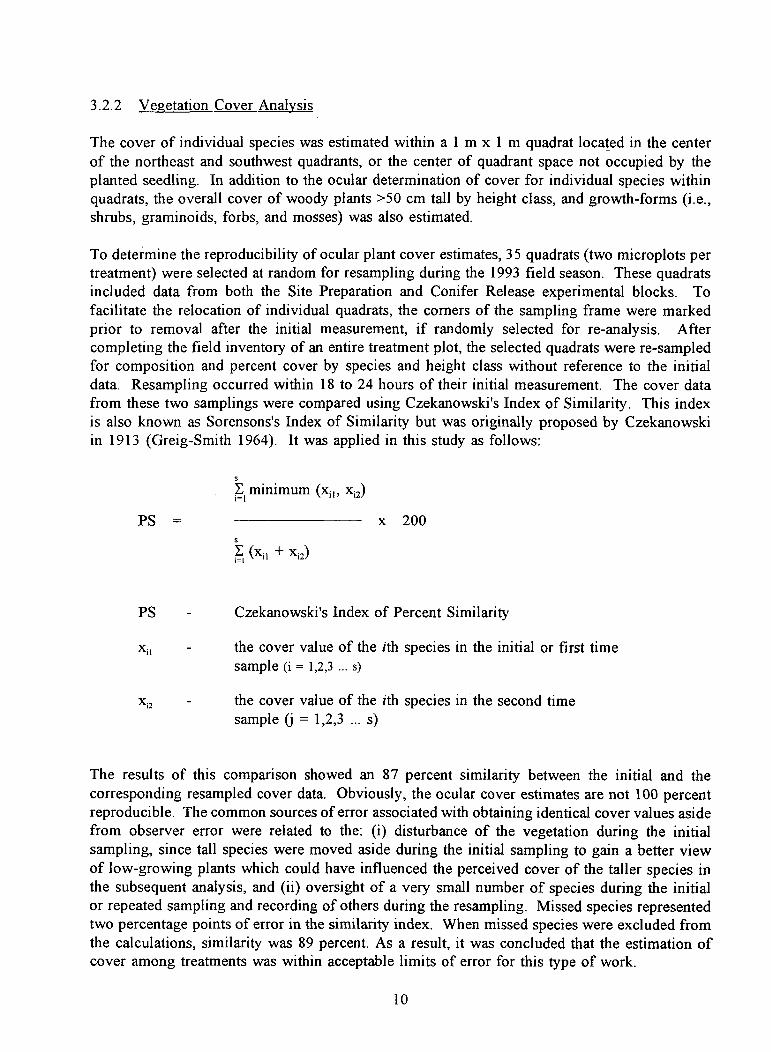
The cover of individual species was estimated within al m x 1 m quadrat located in the centerof the northeast and southwest quadrants, or the center of quadrant space not occupied by theplanted seedling. In addition to the ocular determination of cover for individual species withinquadrats, the overall cover of woody plants >50 cm tall by height class, and growth-forms (i.e.,shrubs, graminoids, forbs, and mosses) was also estimated.
To deteimine the reproducibility of ocular plant cover estimates, 35 quadrats (two microplots pertreatment) were selected at random for resampling during the 1993 field season. These quadratsincluded data from both the Site Preparation and Conifer Release experimental blocks. Tofacilitate the relocation of individual quadrats, the corners of the sampling frame were markedprior to removal after the initial measurement, if randomly selected for re-analysis. Aftercompleting the field inventory of an entire treatment plot, the selected quadrats were re-sampledfor composition and percent cover by species and height class without reference to the initialdata. Resampling occurred within 18 to 24 hours of their initial measurement. The cover datafrom these two samplings were compared using Czekanowski's Index of Similarity. This indexis also known as Sorensons's Index of Similarity but was originally proposed by Czekanowskiin 1913 (Greig-Smith 1964). It was applied in this study as follows:
sE minimum (x il , xi2)
PS = x 200
E (x11 + x12)
PS Czekanowski's Index of Percent Similarity
the cover value of the ith species in the initial or first timesample (i = 1,2,3 ... s)
the cover value of the ith species in the second timesample (j = 1,2,3 ... s)
The results of this comparison showed an 87 percent similarity between the initial and thecorresponding resampled cover data. Obviously, the ocular cover estimates are not 100 percentreproducible. The common sources of error associated with obtaining identical cover values asidefrom observer error were related to the: (i) disturbance of the vegetation during the initialsampling, since tall species were moved aside during the initial sampling to gain a better viewof low-growing plants which could have influenced the perceived cover of the taller species inthe subsequent analysis, and (ii) oversight of a very small number of species during the initialor repeated sampling and recording of others during the resampling. Missed species representedtwo percentage points of error in the similarity index. When missed species were excluded fromthe calculations, similarity was 89 percent. As a result, it was concluded that the estimation ofcover among treatments was within acceptable limits of error for this type of work.
10
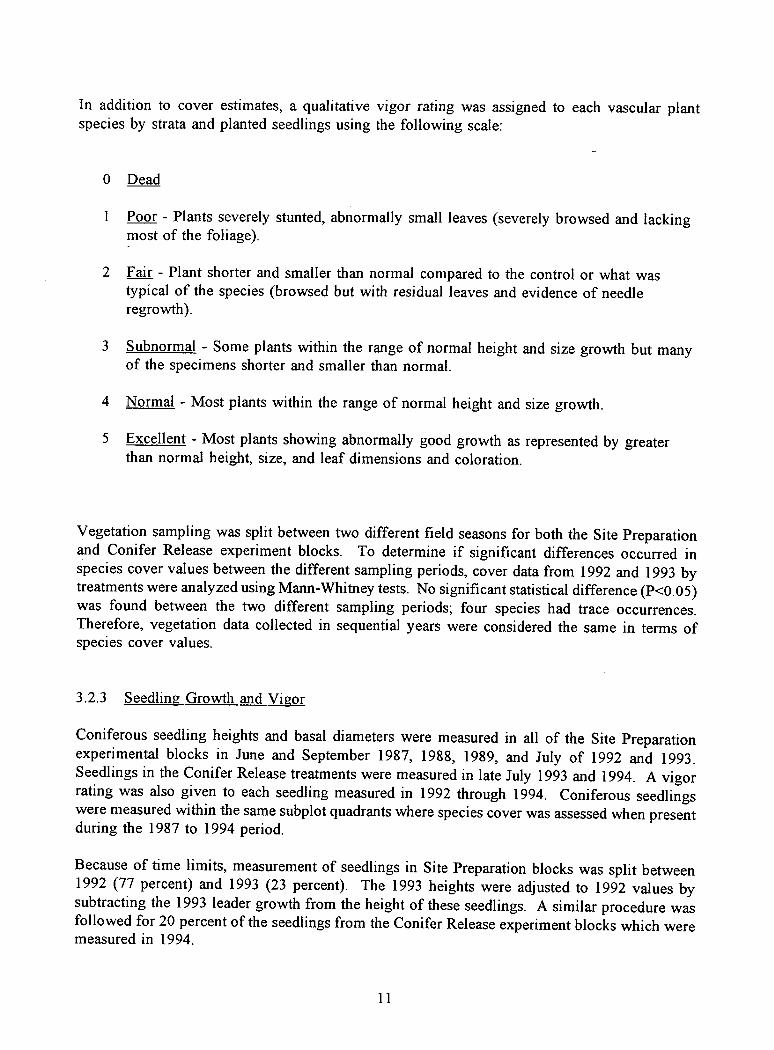
In addition to cover estimates, a qualitative vigor rating was assigned to each vascular plantspecies by strata and planted seedlings using the following scale:
0 Dead
1 Poor - Plants severely stunted, abnormally small leaves (severely browsed and lackingmost of the foliage).
2 Fair - Plant shorter and smaller than normal compared to the control or what wastypical of the species (browsed but with residual leaves and evidence of needleregrowth).
3 Subnormal - Some plants within the range of normal height and size growth but manyof the specimens shorter and smaller than normal.
4 Normal - Most plants within the range of normal height and size growth.
5 Excellent - Most plants showing abnormally good growth as represented by greaterthan normal height, size, and leaf dimensions and coloration.
Vegetation sampling was split between two different field seasons for both the Site Preparationand Conifer Release experiment blocks. To determine if significant differences occurred inspecies cover values between the different sampling periods, cover data from 1992 and 1993 bytreatments were analyzed using Mann-Whitney tests. No significant statistical difference (P<0.05)was found between the two different sampling periods; four species had trace occurrences.Therefore, vegetation data collected in sequential years were considered the same in terms ofspecies cover values.
3.2.3 Seedling Growth and Vigor
Coniferous seedling heights and basal diameters were measured in all of the Site Preparationexperimental blocks in June and September 1987, 1988, 1989, and July of 1992 and 1993.Seedlings in the Conifer Release treatments were measured in late July 1993 and 1994. A vigorrating was also given to each seedling measured in 1992 through 1994. Coniferous seedlingswere measured within the same subplot quadrants where species cover was assessed when presentduring the 1987 to 1994 period.
Because of time limits, measurement of seedlings in Site Preparation blocks was split between1992 (77 percent) and 1993 (23 percent). The 1993 heights were adjusted to 1992 values bysubtracting the 1993 leader growth from the height of these seedlings. A similar procedure wasfollowed for 20 percent of the seedlings from the Conifer Release experiment blocks which weremeasured in 1994.
11
In addition to seedling measurements, the following measures of competing woody vegetationwere made with respect to crop seedlings in both the Site Preparation and Conifer Releaseexperiment blocks during the July 1992 to August 1994 period:
distance from the seedling to nearest aspen within 180 cm;basal diameter and height of nearest aspen;distance from the seedling to tallest aspen within 180 cm;basal diameter and height of tallest aspen;distance from seedling to nearest woody shrub greater than 50 cm tall within 180 cm;andbasal diameter and height of nearest shrub.
No attempt was made to adjust seedling basal diameters or the height and basal diameter ofcompeting species when field sampling occurred in two different years. No attempt was madeto correct crop seedling basal diameter, since differences would probably have been a fractionof a millimeter which was more precise than the field measures (i.e., nearest millimeter). It wasnot considered necessary to adjust the competing species measurements, since changes in theconifer seedling and competing vegetation are presumably linked and reflective of each other.
3.3 Data Analysis
3.3.1 Statistical Description and Testing
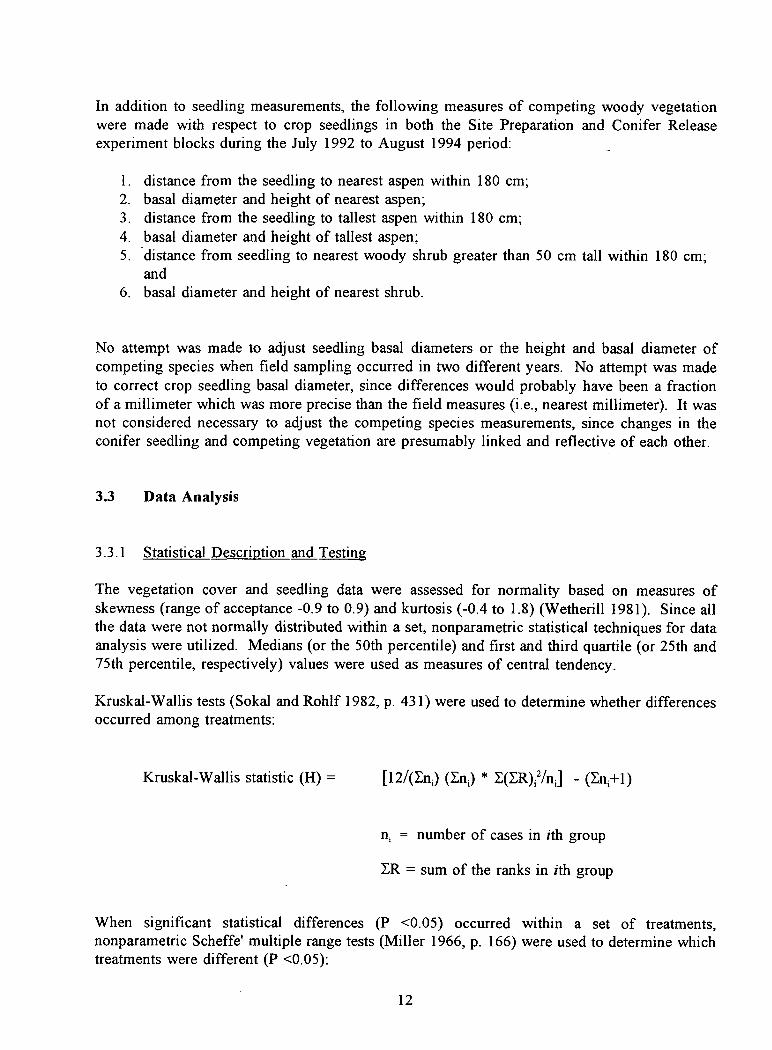
The vegetation cover and seedling data were assessed for normality based on measures ofskewness (range of acceptance -0.9 to 0.9) and kurtosis (-0.4 to 1.8) (Wetherill 1981). Since allthe data were not normally distributed within a set, nonparametric statistical techniques for dataanalysis were utilized. Medians (or the 50th percentile) and first and third quartile (or 25th and75th percentile, respectively) values were used as measures of central tendency.
Kruskal-Wallis tests (Sokal and Rohlf 1982, p. 431) were used to determine whether differencesoccurred among treatments:
Kruskal-Wallis statistic (H) = [12/(a) (E0 * E(ER);2in i] - (Eni+1)
ni = number of cases in ith group
ER = sum of the ranks in ith group
When significant statistical differences (P <0.05) occurred within a set of treatments,nonparametric Scheffe' multiple range tests (Miller 1966, p. 166) were used to determine whichtreatments were different (P <0.05):
12
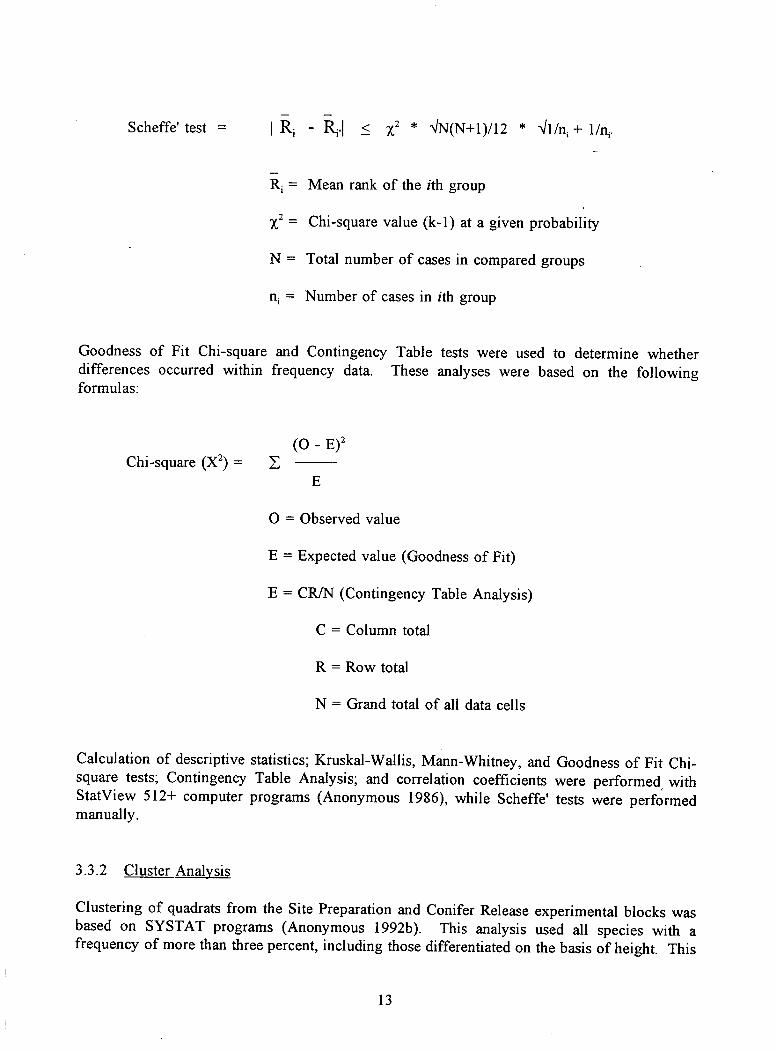
Scheffe' test =
Ri - < X2 * 4N(N+1)/12 * .n11/n, + 1/n,,
R, = Mean rank of the ith group
x2 = Chi-square value (k-1) at a given probability
N = Total number of cases in compared groups
n. = Number of cases in ith group
Goodness of Fit Chi-square and Contingency Table tests were used to determine whetherdifferences occurred within frequency data. These analyses were based on the followingformulas:
(0 - E)2Chi-square (X2) = E
0 = Observed value
E = Expected value (Goodness of Fit)
E = CR/N (Contingency Table Analysis)
C = Column total
R = Row total
N = Grand total of all data cells
Calculation of descriptive statistics; Kruskal-Wallis, Mann-Whitney, and Goodness of Fit Chi-square tests; Contingency Table Analysis; and correlation coefficients were performed withStatView 512+ computer programs (Anonymous 1986), while Scheffe' tests were performedmanually.
3.3.2 Cluster Analysis
Clustering of quadrats from the Site Preparation and Conifer Release experimental blocks wasbased on SYSTAT programs (Anonymous 1992b). This analysis used all species with afrequency of more than three percent, including those differentiated on the basis of height. This
13

restriction on included species was necessary due to limitations within the cluster analysisprogram. Dissimilarity/similarity differences were based on Euclidean distance measures, whilethe minimum variance (Ward) method was used for grouping. These methods were used becausethey often provide distinctive groups with minimal chaining. Clusters were recognized withinthe resulting dendrogram when a distinctive increase in grouping error occurred.
3.3.3 Diversity Measures
Simpson's Index and Shannon-Wiener's Index were used to assess vegetation diversity. Simpson'sIndex (Simpson 1949) was used in this study as follows:
Simpson's Index (X) = pi' where p i = ni / N
= Percent cover of individual species (i = 1,2,3 ... s)
N = Total cover of all individual species
This index varies from 0 to 1 and gives the probability that two individual plants drawn atrandom would belong to the same species. If X is low, community diversity is high, and if it ishigh the community diversity is low.
Shannon-Wiener's Index (Whittaker 1975, p. 95) is a measure of how equally abundant speciesare in a community :
Shannon-Wiener's Index (H') = pn * log p,
pi = ni / N (See Simpson's Index)
The index is maximum when all species are equally abundant and decreases towards zero if therelative abundance of species diverges away from evenness. This index is also known by thename Information Index (Whittaker 1975) and was derived independently by Shannon and Wiener(Magurran 1988, p. 34-35).
14

4.0 RESULTS
The study results are divided into three sections: 1) Site Preparation experiments; 2) ConiferRelease Experiments; and 3) Crop Seedling Competition Analysis. Within the Site PreparationExperiments section an attempt is made to: (i) summarize the characteristics of the pre- and post-treatment vegetation, (ii) compare the effects of the various treatments on native vegetation, and(iii) compare the effectiveness of the treatments with respect to coniferous seedling growth.Analyses of the Conifer Release experiments are truncated relative to the Site Preparationanalysis, since the pre-treatment and the first-year post-treatment data were not collected becauseof limited resources. Therefore, the section on Conifer Release experiments was limited to: (i)summarizing the characteristics of the 1993 post-treatment vegetation, (ii) comparing the effectsof the various treatments on native vegetation, and (iii) comparing the effectiveness of thetreatments with respect to coniferous seedling growth. The crop seedling competition analysissegment (Section 5.0) involves the summarization and modelling of various ecological parametersin an attempt to correlate different factors to coniferous seedling growth.
4.1 Site Preparation Experiments
4.1.1 Pre-treatment Vegetation Characteristics
In 1986, prior to treatment of the Site Preparation experimental blocks, an assessment of speciescomposition and cover, and density of woody plant stems was conducted within control plots andchemical treatment plots (n = 540 quadrants 2.5 m x 2.5 m). Stem densities were also estimatedin the Rome double disking treatment plots (n = 180 quadrants). The results of these surveysindicate that the vegetation in Cutblock 4007 was dominated by an A-stratum composed primarilyof Populus treinuloides suckers with a median cover of 15 percent and a typical height of 90 cm.The number of suckers ranged from 43,609 to 51,897 stems/ha with an additional 1,058 Populusstems/ha that ranged from 160 to 165 cm tall (Table 3 and Photograph 1A). Mixed with thePopulus stems were Amelanchier alnifolia, Corylus cornuta, Prunus virginiana, Rosa acicularis,Salix spp., Shepherdia canadensis, Viburnum edule, and other shrubs; but these species composedless than 20 percent of all woody stems greater than 50 cm tall. Total woody stem densitiesranged from 52,789 to 63,440 stems/ha after three years of growth following clearcutting (Table3). The total length of woody stems was 54,400 + 7,500 m/ha.
The vegetation beneath the woody plant stratum was dominated by forbs which had an , averagecover of 55 percent. Aster ciliolatus, Aster conspicuus, Epilobium angustifolium, Lathyrusochroleucus, Spiraea betulifolia, Corpus canadensis, and Galium boreale were among the mostabundant species (individual cover values of 5 percent) with constancy values greater than 80percent (Table 4). Calamagrostis canadensis was the most common graminoid with mediancover values of five percent or less. Bryophytes had median cover values of five percent.
A total of 85 vascular plant species were found in the 1986 vegetation survey, but only 19 to 22percent of these species had constancy values greater than 50 percent. Most species had less thanten percent constancy. Individual treatment plots contained from 66 to 77 species (Table 5). An
15
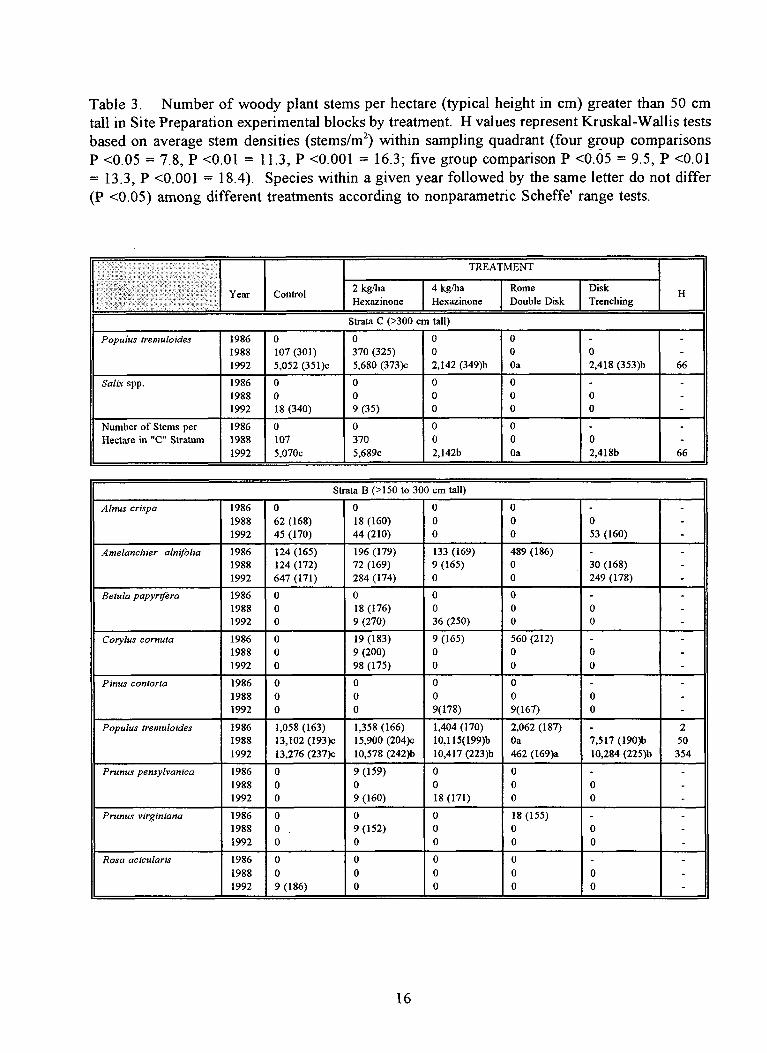
Table 3. Number of woody plant stems per hectare (typical height in cm) greater than 50 cmtall in Site Preparation experimental blocks by treatment. H values represent Kruskal-Wallis testsbased on average stem densities (stems/m 2) within sampling quadrant (four group comparisonsP <0.05 = 7.8, P <0.01 = 11.3, P <0.001 = 16.3; five group comparison P <0.05 = 9.5, P <0.01= 13.3, P <0.001 = 18.4). Species within a given year followed by the same letter do not differ(P <0.05) among different treatments according to nonparametric Scheffe' range tests.
Year Control
TREATMENT
H2 kg/haHexazinone
4 kg/haHexazinone
RomeDouble Disk
DiskTrenching
Strata C (>300 cm tall)
Populus tremuloides 1986 0 0 0 0 - -1988 107 (301) 370 (325) 0 0 0 -1992 5,052 (351)c 5,680 (373)c 2,142 (349)6 Oa 2,418 (353)6 66
Scdix spp. 1986 0 0 0 0 - -1988 0 0 0 0 0 -1992 18 (340) 9 (35) 0 0 0 -
Number of Sterns per 1986 0 0 0 0 - -Hectare in "C" Stratum 1988 107 370 0 0 0 -
1992 5,070c 5,689c 2,142b Oa 2,4186 66
Strata B (>150 to 300 cm tall)
Alnus crispa 1986 0 0 0 0 - -1988 62 (168) 18 (160) 0 0 0 -1992 45 (170) 44 (210) 0 0 53 (160) -
Amelanchier alnifolia 1986 124 (165) 196 (179) 133 (169) 489 (186) - -1988 124 (172) 72 (169) 9 (165) 0 30 (168) -1992 647 (171) 284 (174) 0 0 249 (178) -
Betula papyrifera 1986 0 0 0 0 - -1988 0 18 (176) 0 0 0 -1992 0 9 (270) 36 (250) 0 0 -
Cotylus cornuta 1986 0 19 (183) 9 (165) 560 (212) - -1988 0 9 (200) 0 0 0 -1992 0 98 (175) 0 0 0 -
Pinus contorta 1986 0 0 0 0 - -1988 0 0 0 0 0 -1992 0 0 9(178) 9(167) 0 -
Populus tremuloides 1986 1,058 (163) 1,358 (166) 1,404 (170) 2,062 (187) - 21988 13,102 (193)c 15,900 (204)c 10,115(199)b Oa 7,517 (190)6 501992 13,276 (237)c 10,578 (242)b 10,417 (223)b 462 (169)a 10,284 (225)b 354
Prunus pensylvanica 1986 0 9 (159) 0 0 - -1988 0 0 0 0 0 -1992 0 9 (160) 18 (171) 0 0 -
Prunus virginiana 1986 0 0 0 18 (155) - -1988 0. 9 (152) 0 0 0 -1992 0 0 0 0 0 -
Rosa acicularis 1986 0 0 0 0 - -1988 0 0 0 0 0 -1992 9 (186) 0 0 0 0 -
16
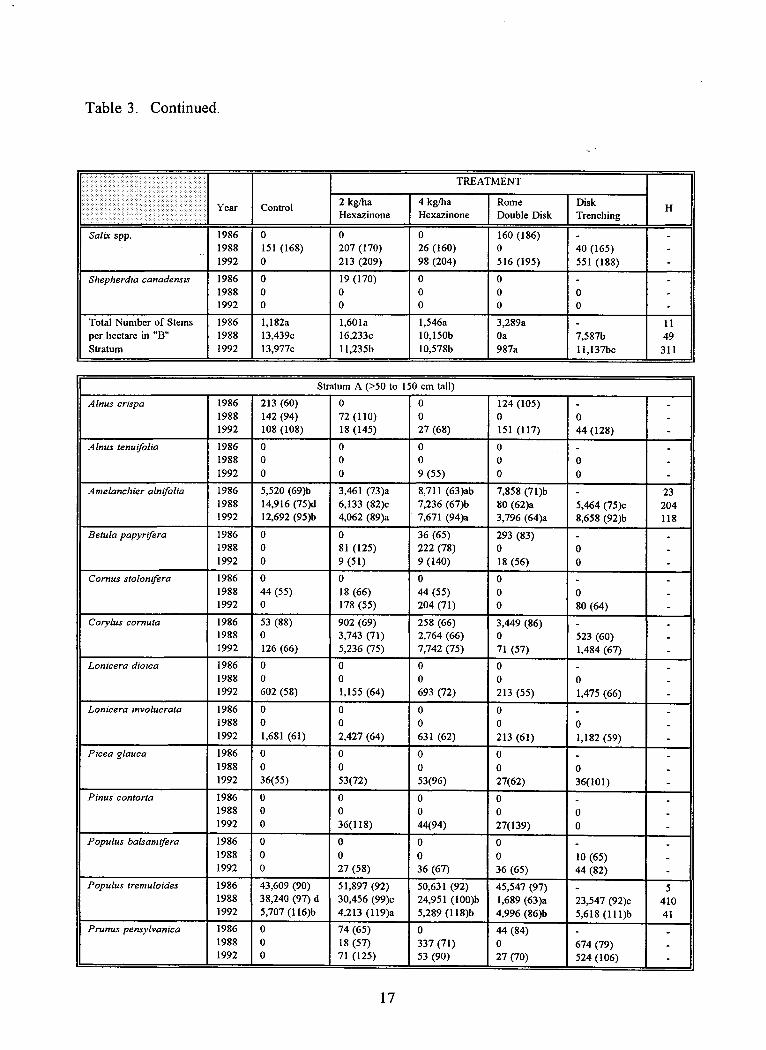
Table 3. Continued.
Year Control
TREATMENT
H2 kg/haHexazinone
4 kg/haHexazinone
RomeDouble Disk
DiskTrenching
Salix spp. 1986 0 0 0 160 (186) - -• 1988 151 (168) 207 (170) 26 (160) 0 40 (165) -
1992 0 213 (209) 98 (204) 516 (195) 551 (188) -
Shepherdia canadensis 1986 0 19 (170) 0 0 - -1988 0 0 0 0 0 -1992 0 0 0 0 0 -
Total Number of Stems 1986 1,182a 1,601a 1,546a 3,289a - 11per hectare in "B" 1988 13,439c 16,233c 10,15013 Oa 7,587b 49Stratum 1992 13,977c 11,235b 10,5786 987a 11,137bc 311
Stratum A (>50 to 150 cm tall)
Alnus crispa 1986 213 (60) 0 0 124 (105) - -1988 142 (94) 72 (110) 0 0 0 -1992 108 (108) 18 (145) 27 (68) 151 (117) 44 (128) -
Alnus tenuifolia 1986 0 0 0 0 - -1988 0 0 0 0 0 -1992 0 0 9 (55) 0 0 -
Amelanchier alnifolia 1986 5,520 (69)b 3,461 (73)a 8,711 (63)ab 7,858 (71)b - 231988 14.916 (75)d 6,133 (82)c 7,236 (67)b 80 (62)a 5,464 (75)c 2041992 12,692 (95)b 4,062 (89)a 7,671 (94)a 3,796 (64)a 8,658 (92)b 118
Betula papyrifera 1986 0 0 36 (65) 293 (83) - -1988 0 81 (125) 222 (78) 0 0 -1992 0 9 (51) 9 (140) 18 (56) 0 -
Cornus stolonifera 1986 0 0 0 0 - -1988 44 (55) 18 (66) 44 (55) 0 0 -1992 0 178 (55) 204 (71) 0 80 (64) -
Corylus cornuta 1986 53 (88) 902 (69) 258 (66) 3,449 (86) - -1988 0 3,743 (71) 2,764 (66) 0 523 (60) -1992 126 (66) 5,236 (75) 7,742 (75) 71 (57) 1,484 (67) -
Lonicera dioica 1986 0 0 0 0 - -1988 0 0 0 0 0 -1992 602 (58) 1,155 (64) 693 (72) 213 (55) 1,475 (66) -
Lonicera involucrata 1986 0 0 0 0 - -1988 0 0 0 0 0 -1992 1,681 (61) 2,427 (64) 631 (62) 213 (61) 1,182 (59) -
Picea glauca 1986 0 0 0 0 - -1988 0 0 0 0 0 -1992 36(55) 53(72) 53(96) 27(62) 36(101) -
Pinus contorta 1986 0 0 0 0 - -1988 0 0 0 0 0 -1992 0 36(118) 44(94) 27(139) 0 -
Populus balsamifera 1986 0 0 0 0 - -1988 0 0 0 0 10 (65) -1992 0 27 (58) 36 (67) 36 (65) 44 (82) -
Populus tremuloides 1986 43,609 (90) 51,897 (92) 50,631 (92) 45,547 (97) - 51988 38,240 (97) d 30,456 (99)c 24,951 (100)b 1,689 (63)a 23,547 (92)c 4101992 5,707 (116)b 4,213 (119)a 5,289 (118)b 4,996 (86)b 5,618 (111)b 41
Prunus pensylvanica 1986 0 74 (65) 0 44 (84) - -1988 0 18 (57) 337 (71) 0 674 (79) -1992 0 71 (125) 53 (90) 27 (70) 524 (106) -
17
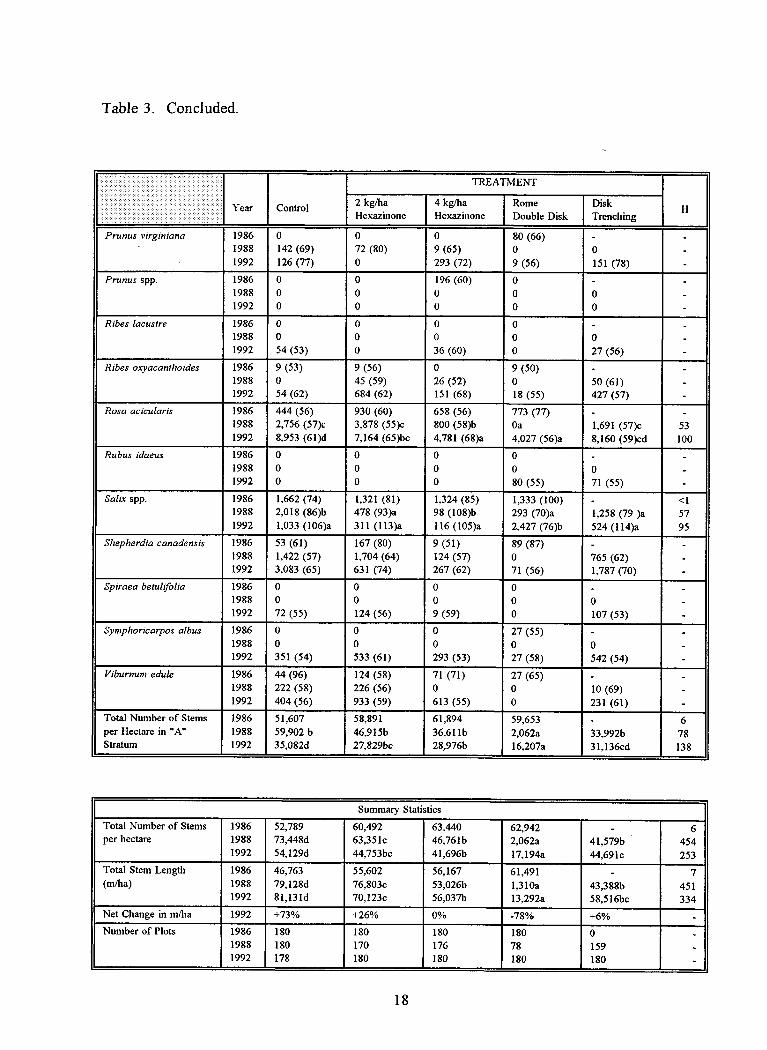
Table 3. Concluded.
Year Control
TREATMENT
H2 kg/haHexazinone
4 kg/haHexazinone
RomeDouble Disk
DiskTrenching
Prunus virginiana 1986 0 0 0 80 (66) - -1988 142 (69) 72 (80) 9 (65) 0 0 -1992 126 (77) 0 293 (72) 9 (56) 151 (78) -
Prunus spp. 1986 0 0 196 (60) 0 - -1988 0 0 0 0 0 -1992 0 0 0 0 0 -
Ribes lacustre 1986 0 0 0 0 - -1988 0 0 0 0 0 -1992 54 (53) 0 36 (60) 0 27 (56) -
Ribes oxyacanthoides 1986 9 (53) 9 (56) 0 9 (50) - -1988 0 45 (59) 26 (52) 0 50 (61) -1992 54 (62) 684 (62) 151 (68) 18 (55) 427 (57) -
Rosa acicularis 1986 444 (56) 930 (60) 658 (56) 773 (77) - -1988 2,756 (57)c 3,878 (55)c 800 (58)b Oa 1,691 (57)c 531992 8,953 (61)d 7,164 (65)bc 4,781 (68)a 4,027 (56)a 8,160 (59)cd 100
Rubus idaeus 1986 0 0 0 0 - -1988 0 0 0 0 0 -1992 0 0 0 80 (55) 71 (55) -
Salix spp. 1986 1,662 (74) 1,321 (81) 1,324 (85) 1,333 (100) - <11988 2,018 (86)b 478 (93)a 98 (108)b 293 (70)a 1,258 (79 )a 571992 1,033 (106)a 311 (113)a 116 (105)a 2,427 (76)b 524 (114)a 95
Shepherdia canadensis 1986 53 (61) 167 (80) 9 (51) 89 (87) - -1988 1,422 (57) 1,704 (64) 124 (57) 0 765 (62) -1992 3,083 (65) 631 (74) 267 (62) 71 (56) 1,787 (70) -
Spiraea betulifolia 1986 0 0 0 0 - -1988 0 0 0 0 0 -1992 72 (55) 124 (56) 9 (59) 0 107 (53) -
Symphoricarpos albus 1986 0 0 0 27 (55) - -1988 0 0 0 0 0 -1992 351 (54) 533 (61) 293 (53) 27 (58) 542 (54) -
Viburnum edule 1986 44 (96) 124 (58) 71 (71) 27 (65) - -1988 222 (58) 226 (56) 0 0 10 (69) -1992 404 (56) 933 (59) 613 (55) 0 231 (61) -
Total Number of Stems 1986 51,607 58,891 61,894 59,653 - 6per Hectare in "A" 1988 59,902 b 46,915b 36,611b 2,062a 33,9926 78Stratum 1992 35,082d 27,829bc 28,976b 16,207a 31,136cd 138
Summary StatisticsTotal Number of Stems 1986 52,789 60,492 63,440 62,942 - 6per hectare 1988 73,448d 63,351c 46,761b 2,062a 41,5796 454
1992 54,129d 44,753bc 41,696b 17,194a 44,691c 253Total Stem Length 1986 46,763 55,602 56,167 61,491 - 7(m/ba) 1988 79,128d 76,803c 53,026b 1,310a 43,388b 451
1992 81,131d 70,123c 56,03713 13,292a 58,516bc 334Net Change in m/ba 1992 +73% +26% 0% -78% +6% -Number of Plots 1986 180 180 180 180 0 -
1988 180 170 176 78 159 -1992 178 180 180 180 180 -
18
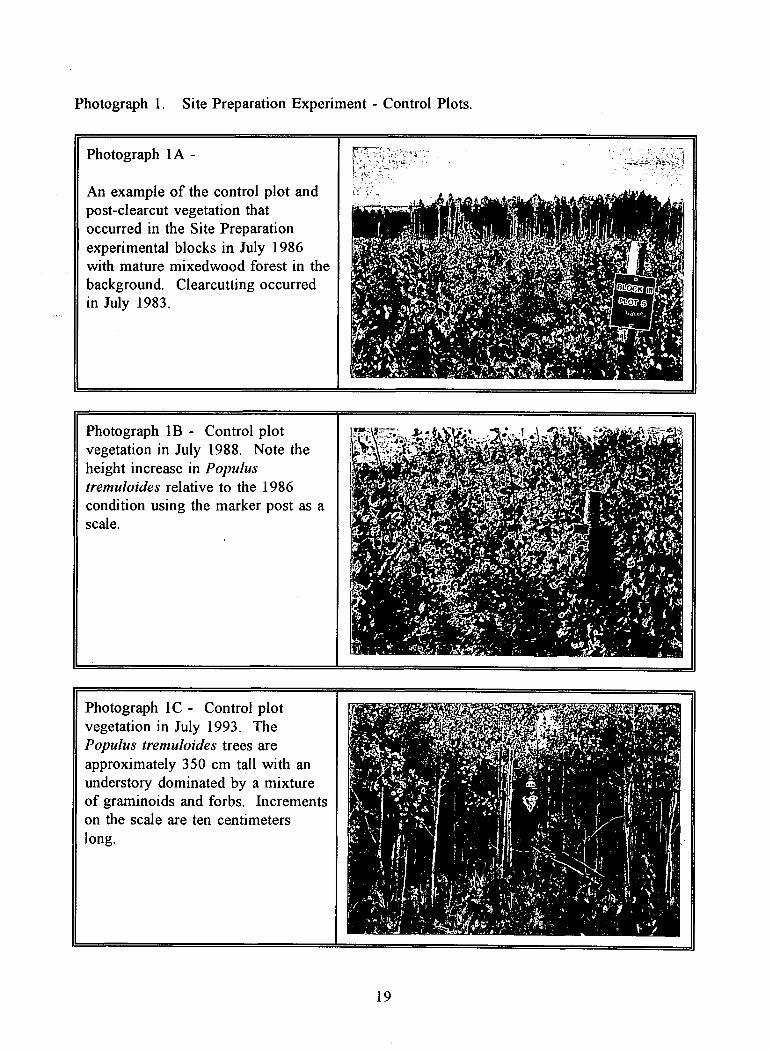
Photograph 1. Site Preparation Experiment - Control Plots.
Photograph 1A -
An example of the control plot andpost-clearcut vegetation thatoccurred in the Site Preparationexperimental blocks in July 1986with mature mixedwood forest in thebackground. Clearcutting occurredin July 1983.
Photograph 1B - Control plotvegetation in July 1988. Note theheight increase in Populustremuloides relative to the 1986condition using the marker post as ascale.
Photograph IC - Control plotvegetation in July 1993. ThePopulus tremuloides trees areapproximately 350 cm tall with anunderstoiy dominated by a mixtureof graminoids and forbs. Incrementson the scale are ten centimeterslong.
19
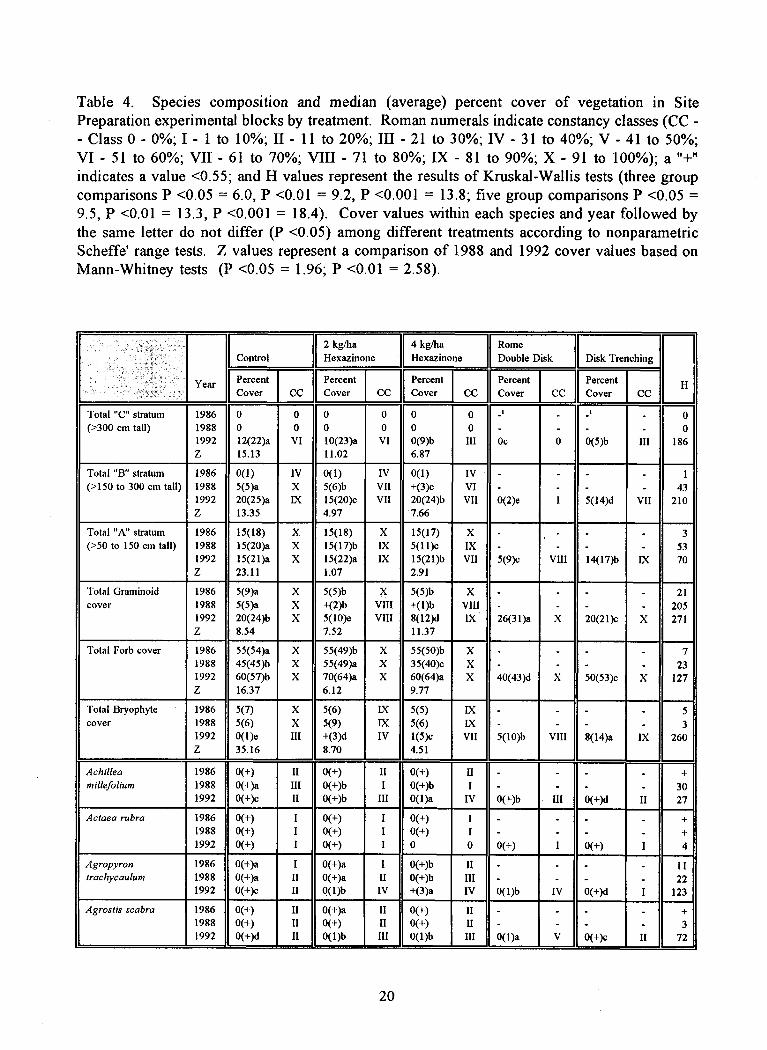
Table 4. Species composition and median (average) percent cover of vegetation in SitePreparation experimental blocks by treatment. Roman numerals indicate constancy classes (CC -- Class 0 - 0%; I - 1 to 10%; II - 11 to 20%; III - 21 to 30%; IV - 31 to 40%; V - 41 to 50%;VI - 51 to 60%; VII - 61 to 70%; VIII - 71 to 80%; IX - 81 to 90%; X - 91 to 100%); a "+"indicates a value <0.55; and H values represent the results of Kruskal-Wallis tests (three groupcomparisons P <0.05 = 6.0, P <0.01 = 9.2, P <0.001 = 13.8; five group comparisons P <0.05 =9.5, P <0.01 = 13.3, P <0.001 = 18.4). Cover values within each species and year followed bythe same letter do not differ (P <0.05) among different treatments according to nonparametricScheffe° range tests. Z values represent a comparison of 1988 and 1992 cover values based onMann-Whitney tests (P <0.05 = 1.96; P <0.01 = 2.58).
Year
Control2 kg/haHexazinone
4 kg/haHexazinone
RomeDouble Disk Disk Trenching
PercentCover CC
PercentCover CC
PercentCover CC
PercentCover CC
PercentCover CC
H
Total "C" stratum 1986 0 0 0 0 0 0 -' - -' - 0(>300 cm tall) 1988 0 0 0 0 0 0 - - - - 0
1992 12(22)a VI 10(23)a VI 0(9)b III Oc 0 0(5)b III 186Z 15.13 11.02 6.87
Total "B" stratum 1986 0(1) IV 0(1) IV 0(1) IV - - - - 1(>150 to 300 cm tall) 1988 5(5)a X 5(6)b VII +(3)c VI - - - - 43
1992 20(25)a IX 15(20)c VII 20(24)b VII 0(2)e I 5(14)d VII 210Z 13.35 4.97 7.66
Total "A" stratum 1986 15(18) X 15(18) X 15(17) X - , - - - 3(>50 to 150 cm tall) 1988 15(20)a X 15(17)b IX 5(11)c IX - - - - 53
1992 15(21)a X 15(22)a IX 15(21)b VII 5(9)c VIII 14(17)6 IX 70Z 23.11 1.07 2.91
Total Graminoid 1986 5(9)a X 5(5)b X 5(5)b X - - - - 21cover 1988 5(5)a X +(2)b VIII +(1)b VIII - - - - 205
1992 20(24)b X 5(10)e VIII 8(12)d IX 26(31)a X 20(21)c X 271Z 8.54 7.52 11.37
Total Forb cover 1986 55(54)a X 55(49)6 X 55(50)b X - - - - 71988 45(45)b X 55(49)a X 35(40)c X - - - - 231992 60(57)b X 70(64)a X 60(64)a X 40(43)d X 50(53)c X 127Z 16.37 6.12 9.77
Total Bryophyte 1986 5(7) X 5(6) IX 5(5) IX - - - - 5cover 1988 5(6) X 5(9) IX 5(6) IX - - - - 3
1992 0(1)e III +(3)d IV 1(5)c VII 5(10)b VIII 8(14)a IX 260Z 35.16 8.70 4.51
Achillea 1986 0(+) II 0(+) II 0(+) II - - - - +millefolium 1988 0(+)a III 0(+)b I 0(+)b I - - - - 30
1992 0(+)c II 0(+)b III 0(1)a IV 0(+)b III 0(+)d II 27
Actaea rubra 1986 0(+) I 0(+) I 0(+) I - - - - +1988 0(+) I 0(+) I 0(+) I - - - - +1992 0(+) I 0(+) I 0 0 0(+) I 0(+) I 4
Agropyron 1986 0(+)a I 0(+)a I 0(+)b II - - - - 1 Itrachycaulum 1988 0(+)a II 0(+)a II 0(+)b III - - - - 22
1992 0(+)c II 0(1)b IV +(3)a IV 0(1)b IV 0(+)d I 123
Agrostis scabra 1986 0(+) II 0(+)a II 0(+) II - - - - +1988 0(+) II 0(+) II 0(+) II - - - - 31992 0(+)d II 0(1)b III 0(1)b III 0(1)a V 0(+)c II 72
20
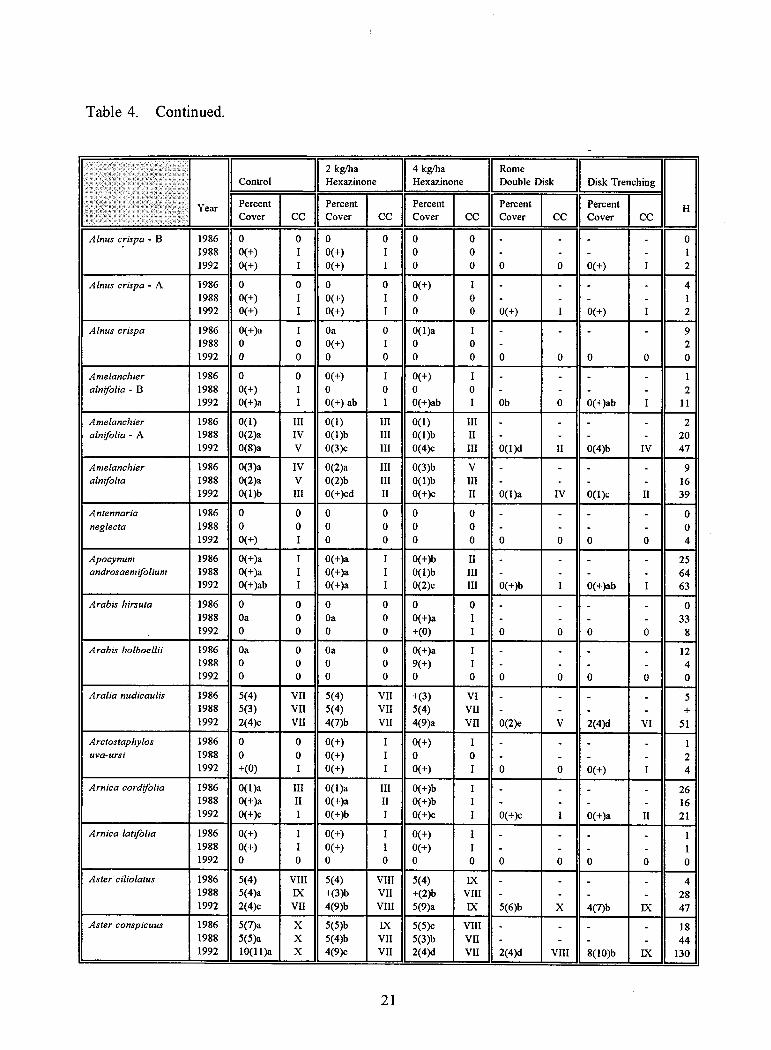
Table 4. Continued.
Year
Control2 kg/haHexazinone
4 kg/haHexazinone
RomeDouble Disk Disk Trenching
HPercentCover CC
PercentCover CC
PercentCover CC
PercentCover CC
PercentCover CC
Alnus crispa - B 1986 0 0 0 0 0 0 - - - 01988 0(+) I 0(+) I 0 0 - - - - 11992 0(+) I 0(+) I 0 0 0 0 0(+) I 2
Alnus crispa - A 1986 0 0 0 0 0(+) I - - - - 41988 0(+) I 0(+) I 0 0 - - - - 11992 0(+) I 0(+) I 0 0 0(+) I 0(+) I 2
Alnus crispa 1986 0(+)a I Oa 0 0(1)a I - - - - 91988 0 0 0(+) I 0 0 - 21992 0 0 0 0 0 0 0 0 0 0 0
Amelanchier 1986 0 0 0(+) I 0(+) I - - - - 1alnifolia - B 1988 0(+) I 0 0 0 0 - - - - 2
1992 0(+)a I 0(+) ab I 0(+)ab I Ob 0 O(+)ab I 11
A melanchier 1986 0(1) III 0(1) III 0(1) III - - - - 2alnifolia - A 1988 0(2)a IV 0(1)b III 0(1)b II - - - - 20
1992 0(8)a V 0(3)c III 0(4)c HI 0(1)d II 0(4)b IV 47
Anielanchier 1986 0(3)a IV 0(2)a III 0(3)b V - - - - 9alnifolia 1988 0(2)a V 0(2)b III 0(1)b HI - - - - 16
1992 0(1)6 III 0(+)cd II 0(+)c II 0(1)a IV 0(1)c II 39
Antennaria 1986 0 0 0 0 0 0 - - - - 0neglecta 1988 0 0 0 0 0 0 - - - - 0
1992 0(+) I 0 0 0 0 0 0 0 0 4
Apocynum 1986 0(+)a I 0(+)a I 0(+)b II - - - - 25androsaemifolium 1988 0(+)a I 0(+)a I 0(1)b III - - - - 64
1992 0(+)ab I 0(+)a I 0(2)c III 0(+)b I 0(+)ab 1 63
Arabis hirsuta 1986 0 0 0 0 0 0 - - - - 01988 Oa 0 Oa 0 0(+)a I - - - - 331992 0 0 0 0 +(0) I 0 0 0 0 8
Arabis holboellii 1986 Oa 0 Oa 0 0(+)a I - - - - 121988 0 0 0 0 9(+) I - - - - 41992 0 0 0 0 0 0 0 0 0 0 0
Aralia nudicaulis 1986 5(4) VII 5(4) VII +(3) VI - - - - 51988 5(3) VII 5(4) VII 5(4) VII - - - - +1992 2(4)c VII 4(7)b VII 4(9)a VII 0(2)e V 2(4)d VI 51
Arctostaphylos 1986 0 0 0(+) I 0(+) I - - - - 1uva-ursi 1988 0 0 0(+) I 0 0 - - - - 2
1992 +(0) I 0(+) I 0(+) I 0 0 0(+) I 4
Arnica cordifolia 1986 0(1)a III 0(1)a III 0(+)b I - - - - 261988 0(+)a II 0(+)a II 0(+)b I - - - - 161992 0(+)c I 0(+)b I 0(+)c I 0(+)c I 0(+)a II 21
Arnica latifolia 1986 0(+) I 0(+) I 0(+) I - - - - I1988 0(+) I 0(+) I 0(+) I - - - - 11992 0 0 0 0 0 0 0 0 0 0 0
Aster ciliolatus 1986 5(4) VIII 5(4) VIII 5(4) IX - - - - 41988 5(4)a IX +(3)b VII +(2)b VIII - - - - 281992 2(4)c VII 4(9)b VIII 5(9)a IX 5(6)b X 4(7)b IX 47
Aster conspicuus 1986 5(7)a X 5(5)b IX 5(5)c VIII - - - - 181988 5(5)a X 5(4)b VII 5(3)b VII - - - - 441992 10(11)a X 4(9)c VII 2(4)d VII 2(4)d VIII 8(10)b IX 130
21
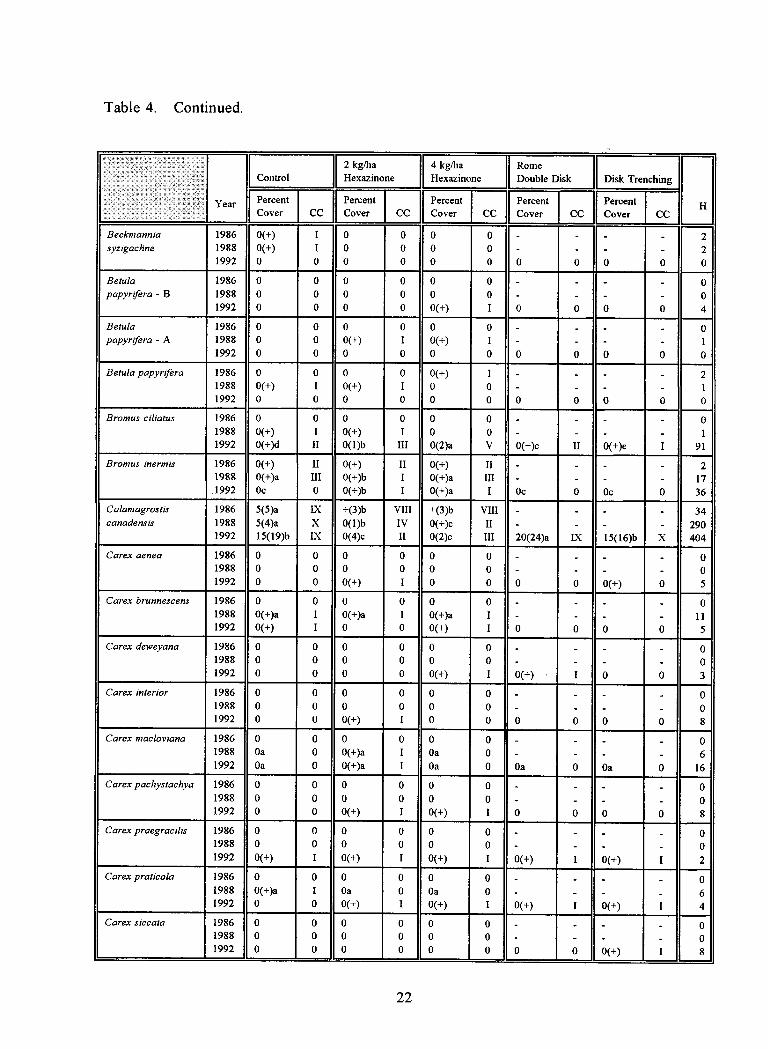
Table 4. Continued.
Year
Control2 kg/haHexazinone
4 kg/haHexazinone
RomeDouble Disk Disk Trenching
PercentCover CC
PercentCover CC
PercentCover CC
PercentCover CC
PercentCover CC
H
Beckmannia 1986 0(+) I 0 0 0 0 - - - - 2syzigachne 1988 0(+) I 0 0 0 0 - - - - 2
1992 0 0 0 0 0 0 0 0 0 0 0
Betula 1986 0 0 0 0 0 0 - - - - 0papyrifera - B 1988 0 0 0 0 0 0 - - - - 0
1992 0 0 0 0 0(+) I 0 0 0 0 4
Betula 1986 0 0 0 0 0 0 - - - - 0papyrifera - A 1988 0 0 0(+) I 0(+) I - - - - 1
1992 0 0 0 0 0 0 0 0 0 0 0
Betula papyrifera 1986 0 0 0 0 0(+) I - - - - 21988 0(+) I 0(+) I 0 0 - - - - 11992 0 0 0 0 0 0 0 0 0 0 0
Bromus ciliatus 1986 0 0 0 0 0 0 - - - - 01988 0(+) I 0(+) I 0 0 - - - - 11992 0(+)d II 0(1)b III 0(2)a V 0(+)c II 0(+)e I 91
Bromus inermis 1986 0(+) II 0(+) II 0(+) II - - - - 21988 0(+)a HI 0(+)b I 0(+)a HI - - - - 17.1992 Oc 0 0(+)b I 0(+)a I Oc 0 Oc 0 36
Calamagrostis 1986 5(5)a IX +(3)b VIII +(3)b VIII - - - - 34canadensis 1988 5(4)a X 0(1)b IV 0(+)c II - - - - 290
1992 15(19)b IX 0(4)c H 0(2)c III 20(24)a LX 15(16)b X 404
Carex aenea 1986 0 0 0 0 0 0 - - - - 01988 0 0 0 0 0 0 - - - - 01992 0 0 0(+) I 0 0 0 0 0(+) 0 5
Carex brunnescens 1986 0 0 0 0 0 0 - - - - 01988 0(+)a I 0(+)a I 0(+)a I - - - - 111992 0(+) I 0 0 0(+) I 0 0 0 0 5
Carex deweyana 1986 0 0 0 0 0 0 - - - - 01988 0 0 0 0 0 0 - - - - 01992 0 0 0 0 0(4-) I 0(+) ' I 0 0 3
Carex interior 1986 0 0 0 0 0 0 - - - _ 01988 0 0 0 0 0 0 - - - - 01992 0 0 0(+) I 0 0 0 0 0 0 8
Carex macloviana 1986 0 0 0 0 0 0 - - - - 01988 Oa 0 0(+)a I Oa 0 - - - - 61992 Oa 0 0(+)a I Oa 0 Oa 0 Oa 0 16
Carex pachystachya 1986 0 0 0 0 0 0 - - - - 01988 0 0 0 0 0 0 - - - - 01992 0 0 0(+) I 0(+) I 0 0 0 0 8
Carex praegracilis 1986 0 0 0 0 0 0 - - - - 01988 0 0 0 0 0 0 - - - - 01992 0(+) I 0(+) I 0(+) I 0(+) I 0(+) I 2
Carex praticola 1986 0 0 0 0 0 0 - - - - 01988 0(+)a I Oa 0 Oa 0 - - - - 61992 0 0 0(+) I 0(+) I 0(+) I 0(+) I 4
Carex siccata 1986 0 0 0 0 0 0 - - - - 01988 0 0 0 0 0 0 - - - - 01992 0 0 0 0 0 0 0 0 0(+) I 8
22
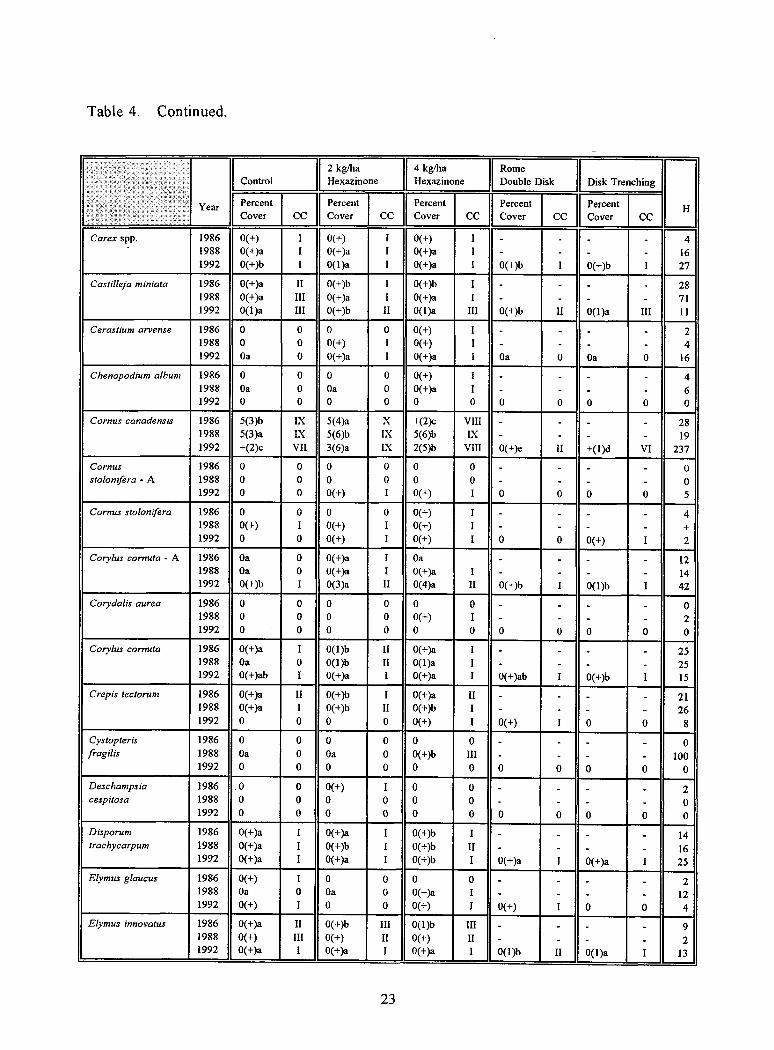
Table 4. Continued.
Year
Control2 kg/haHexazinone
4 kg/haHexazinone
RomeDouble Disk Disk Trenching
PercentCover CC
PercentCover CC
PercentCover CC
PercentCover CC
PercentCover CC
H
Carex spp. 1986 0(+) I 0(+) I 0(+) I - - - - 41988 0(+)a I 0(+)a I 0(+)a I - - - - 161992 0(+)b I 0(1)a I 0(+)a I 0(+)b I 0(+)b I 27
Castilleja miniata 1986 0(+)a II 0(+)b I 0(+)b I - - - - 281988 0(+)a III 0(+)a I 0(+)a I - - - - 711992 0(1)a III 0(+)b H 0(1)a III 0(+)b II 0(1)a III 11
Cerastium arvense 1986 0 0 0 0 0(+) I - - - - 21988 0 0 0(+) I 0(+) I - - - - 41992 Oa 0 0(+)a I 0(+)a I Oa 0 Oa 0 16
Chenopodium album 1986 0 0 0 0 0(+) I - - - - 41988 Oa 0 Oa 0 0(+)a I - - - - 61992 0 0 0 0 0 0 0 0 0 0 0
Cornus canadensis 1986 5(3)b IX 5(4)a X +(2)c VIII - - - - 281988 5(3)a IX 5(6)b IX 5(6)b IX - - - - 191992 +(2)c VII 3(6)a IX 2(5)b VIII 0(+)e II +(1)d VI 237
Cornus 1986 0 0 0 0 0 0 - - - - 0stolonifera - A 1988 0 0 0 0 0 0 - - - - 0
1992 0 0 0(+) I 0(+) I 0 0 0 0 5
Cornus stolonifera 1986 0 0 0 0 0(+) I - - - - 41988 0(+) I 0(+) I 0(+) I - - - - +1992 0 0 0(+) I 0(+) I 0 0 0(+) I 2
Corylus cornuta - A 1986 Oa 0 0(+)a I Oa - - - - 121988 Oa 0 0(+)a I 0(+)a I - - - - 141992 0(+)b I 0(3)a II 0(4)a II 0(+)b I 0(1)b I 42
Corydalis aurea 1986 0 0 0 0 0 0 - - - - 01988 0 0 0 0 0(+) I - - - - 21992 0 0 0 0 0 0 0 0 0 0 0
Corylus cornuta 1986 0(+)a I 0(1)b II 0(+)a I - - - - 251988 Oa 0 0(1)b II 0(1)a I - - - - 251992 0(+)ab I 0(+)a I 0(+)a I 0(+)ab I 0(+)b I 15
Crepis tectorum 1986 0(+)a II 0(+)b I 0(+)a II - - - - 211988 0(+)a I 0(+)b II 0(+)b I - - - - 261992 0 0 0 0 0(+) I 0(+) I 0 0 8
Cystopteris 1986 0 0 0 0 0 0 - - - - 0fragilis 1988 Oa 0 Oa 0 0(+)b III - - - - 100
1992 0 0 0 0 0 0 0 0 0 0 0Deschampsia 1986 .0 0 0(+) I 0 0 - - - - 2cespitosa 1988 0 0 0 0 0 0 - - - - 0
1992 0 0 0 0 0 0 0 0 0 0 0Disporum 1986 0(+)a I 0(+)a I 0(+)b I - - - - 14trachycarpum 1988 0(+)a I 0(+)b I 0(+)b II - - - - 16
1992 0(+)a I 0(+)a I 0(+)b I 0(+)a I 0(+)a 1 25Elymus glaucus 1986 0(+) I 0 0 0 0 - - - - 2
1988 Oa 0 Oa 0 0(+)a I - - - - 121992 0(+) I 0 0 0(+) I 0(+) I 0 0 4
Elymus innovatus 1986 0(+)a II 0(+)b III 0(1)b III - - - - 91988 0(+) III 0(+) II 0(+) II - - - - 21992 0(+)a I 0(+)a I 0(+)a I 0(1)b II 0(1)a I 13
23
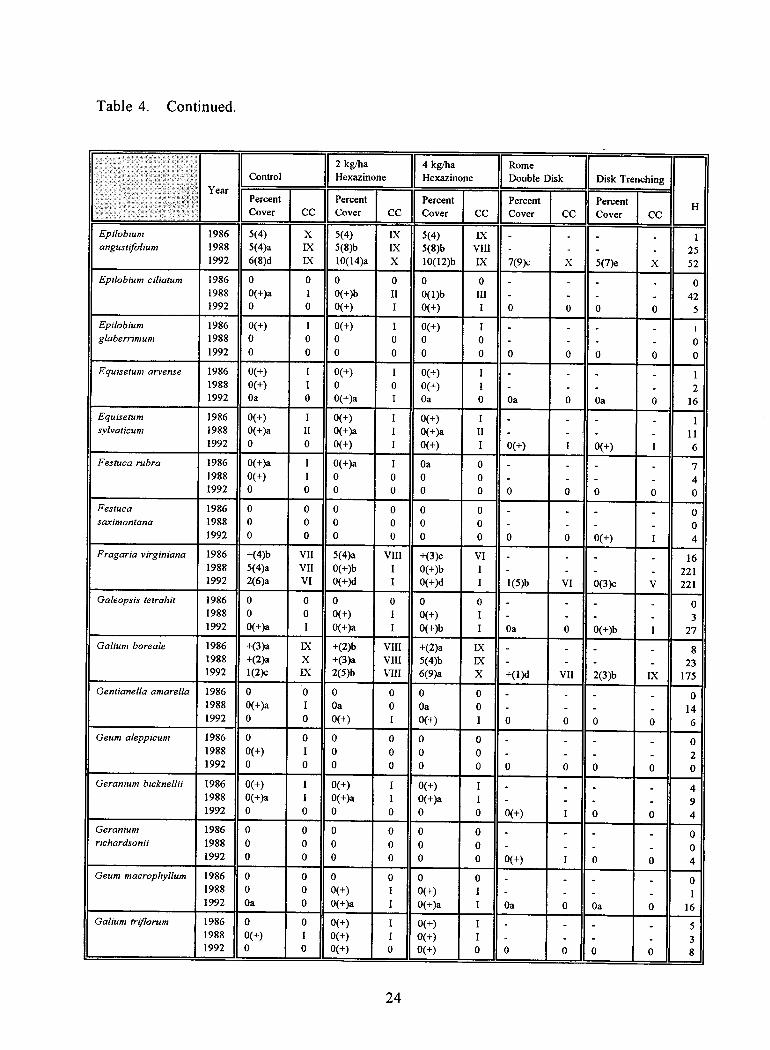
Table 4. Continued.
YearControl
2 kg/haHexazinone
4 kg/haHexazinone
RomeDouble Disk Disk Trenching
PercentCover CC
PercentCover CC
PercentCover CC
PercentCover CC
PercentCover CC
H
Epilobium 1986 5(4) X 5(4) LX 5(4) IX - - - - 1angustifolium 1988 5(4)a IX 5(8)b IX 5(8)b VIII - - - - 25
1992 6(8)d IX 10(14)a X 10(12)b IX 7(9)c X 5(7)e X 52Epilobium ciliatum 1986 0 0 0 0 0 0 - - - - 0
1988 0(+)a I 0(+)b II 0(1)b III - - - - 421992 0 0 0(+) I 0(+) I 0 0 0 0 5
Epilobium 1986 0(+) I 0(+) I 0(+) I - - - - +glaberrimum 1988 0 0 0 0 0 0 - - - - 0
1992 0 0 0 0 0 0 0 0 0 0 0Equisetum arvense 1986 0(+) I 0(+) I 0(+) I - - - - 1
1988 0(+) I 0 0 0(+) I - - - - 21992 Oa 0 0(+)a I Oa 0 Oa 0 Oa 0 16
Equisetum 1986 0(+) I 0(+) I 0(+) I - - - - 1sylvaticum 1988 0(+)a II 0(+)a I 0(+)a II - - - - 11
1992 0 0 O(+) I 0(+) I 0(+) I 0(+) I 6Festuca rubra 1986 0(+)a I 0(+)a I Oa 0 - - - - 7
1988 0(+) I 0 0 0 0 - - - - 41992 0 0 0 0 0 0 0 0 0 0 0
Festuca 1986 0 0 0 0 0 0 - - - - 0saximontana 1988 0 0 0 0 0 0 - - - - 0
1992 0 0 0 0 0 0 0 0 0(+) I 4Fragaria virginiana 1986 +(4)b VII 5(4)a VIII +(3)c VI - - - - 16
1988 5(4)a VII 0(+)b I 0(+)b I - - - - 2211992 2(6)a VI 0(+)d I 0(+)d I 1(5)b VI 0(3)c V 221
Galeopsis tetrahit 1986 0 0 0 0 0 0 - - - - 01988 0 0 0(+) I 0(+) I - - - - 31992 0(+)a I 0(+)a I 0(+)b I Oa 0 0(+)b I 27
Galium boreale 1986 +(3)a IX +(2)b VIII +(2)a IX - - - - 81988 +(2)a X +(3)a VIII 5(4)b LX - - - - 231992 1(2)c IX 2(5)b VIII 6(9)a X +(1)d VII 2(3)b IX 175
Gentianella amarella 1986 0 0 0 0 0 0 - - - - 01988 0(+)a I Oa 0 Oa 0 - - - - 141992 0 0 0(+) I 0(+) I 0 0 0 0 6
Geum aleppicum 1986 0 0 0 0 0 0 - - - - 01988 0(+) I 0 0 0 0 - - - - 21992 0 0 0 0 0 0 0 0 0 0 0
Geranium bicknellii 1986 0(+) I 0(+) I 0(+) I - - - - 41988 0(+)a I 0(+)a I 0(+)a I - - - - 91992 0 0 0 0 0 0 0(+) I 0 0 4
Geranium 1986 0 0 0 0 0 0 - - - - 0richardsonii 1988 0 0 0 0 0 0 - - - - 0
1992 0 0 0 0 0 0 0(+) I 0 0 4Geum macrophyllum 1986 0 0 0 0 0 0 - - - - 0
1988 0 0 0(+) I 0(+) I - - - - 11992 Oa 0 0(+)a I 0(+)a I Oa 0 Oa 0 16
Galium triflorum 1986 0 0 0(+) I 0(+) I - - - - 51988 0(+) I 0(+) I 0(+) I - - - - 31992 0 0 0(+) 0 0(+) 0 0 0 0 0 8
24
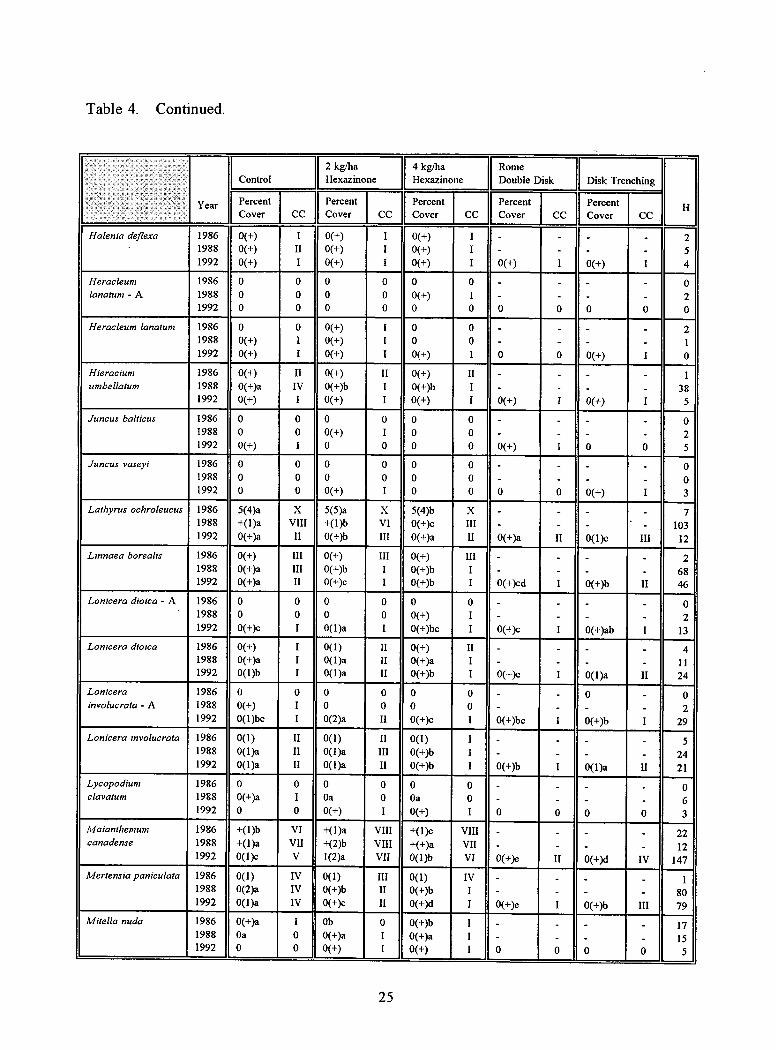
Table 4. Continued.
Year
Control2 kg/haHexazinone
4 kg/haHexazinone
RomeDouble Disk Disk Trenching
PercentCover CC
PercentCover CC
PercentCover CC
PercentCover CC
PercentCover CC
H
Halenia deflexa 1986 0(+) I 0(+) I 0(+) I - - - - 2. 1988 0(+) II 0(+) I 0(+) I - - - - 51992 0(+) I 0(+) I 0(+) I 0(+) I 0(+) I 4
Heracleum 1986 0 0 0 0 0 0 - - - - 0lanatum - A 1988 0 0 0 0 0(+) I - - - - 2
1992 0 0 0 0 0 0 0 0 0 0 0
Heracleum lanatum 1986 0 0 0(+) I 0 0 - - - - 21988 0(+) I 0(+) I 0 0 - - - - 11992 0(+) I 0(+) I 0(+) I 0 0 0(+) I 0
Hieracium 1986 0(+) II 0(+) H 0(+) II - - - - 1umbellatum 1988 0(+)a IV 0(+)b I 0(+)b I - - - - 38
1992 0(+) I 0(+) I 0(+) I 0(+) I 0(+) I 5
Juncus balticus 1986 0 0 0 0 0 0 - - - - 01988 0 0 0(+) I 0 0 - - - - 21992 0(+) I 0 0 0 0 0(+) I 0 0 5
Juncus vaseyi 1986 0 0 0 0 0 0 - - - - 01988 0 0 0 0 0 0 - - - - 01992 0 0 0(+) I 0 0 0 0 0(+) I 3
Lathyrus ochroleucus 1986 5(4)a X 5(5)a X 5(4)b X - - - - 71988 +(1)a VIII +(1)b VI 0(+)c III - - - • - 1031992 0(+)a II 0(+)b III 0(+)a II 0(+)a II 0(1)c III 12
Linnaea borealis 1986 0(+) III 0(+) III 0(+) III - - - - 21988 0(+)a III 0(+)b I 0(+)b I - - - - 681992 0(+)a II 0(+)c I 0(+)b I 0(+)cd I 0(+)b II 46
Lonicera dioica - A 1986 0 0 0 0 0 0 - - - - 01988 0 0 0 0 0(+) I - - - - 21992 0(+)c I 0(1)a I 0(+)bc I 0(+)c I 0(+)ab I 13
Lonicera dioica 1986 0(+) I 0(1) II 0(+) II - - - - 41988 0(+)a I 0(1)a II 0(+)a I - - - - 111992 0(1)b I 0(1)a II 0(+)b I 0(+)c I 0(1)a II 24
Lonicera 1986 0 0 0 0 0 0 - - 0 - 0involucrata - A 1988 0(+) I 0 0 0 0 - - - - 2
1992 0(1 )bc I 0(2)a H 0(+)c 1 0(+)bc I 0(+)b I 29Lonicera involucrata 1986 0(1) II 0(1) II 0(1) I - - - - 5
1988 0(1)a II 0(1)a III 0(+)b I - - - - 241992 0(1)a II 0(1)a II 0(+)b I 0(+)b I 0(1)a II 21
Lycopodium 1986 0 0 0 0 0 0 - - - - 0clavatum 1988 0(+)a I Oa 0 Oa 0 - - - - 6
1992 0 0 0(+) I 0(+) I 0 0 0 0 3Maianthemum 1986 +( 1 )b VI +(1)a VIII +( 1 )c VIII - - - - 22canadense 1988 +(1)a VII +(2)b VIII +(+)a VII - - - - 12
1992 0(1)c V 1(2)a VII 0(1)6 VI 0(+)e II 0(+)d IV 147Mertensia paniculata 1986 0(1) IV 0(1) III 0(1) IV - - - - 1
1988 0(2)a IV 0(+)b II 0(+)b I - - - - 801992 0(1)a IV 0(+)c II 0(+)d I 0(+)e I 0(+)b III 79
Mitella nuda 1986 0(+)a I Ob 0 0(+)b I - - - - 171988 Oa 0 0(+)a I 0(+)a I - - - - 151992 0 0 0(+) I 0(+) I 0 0 0 0 5
25
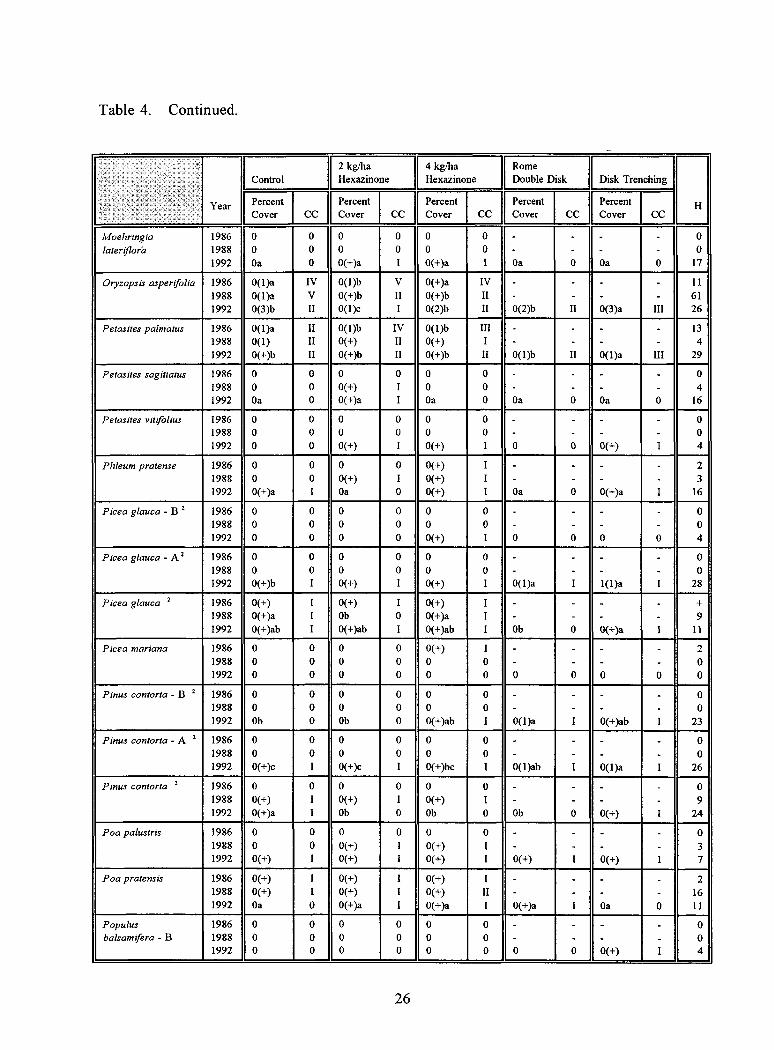
Table 4. Continued.
Control2 kg/haHexazinone
4 kg/haHexazinone
RomeDouble Disk Disk Trenching
HYear PercentCover CC
PercentCover CC
PercentCover CC
PercentCover CC
PercentCover CC
Moehringia 1986 0 0 0 0 0 0 - - - - 0later flora 1988 0 0 0 0 0 0 - - - - 0
1992 Oa 0 0(+)a I 0(+)a I Oa 0 Oa 0 17
Oryzopsis asperifolia 1986 0(1)a IV 0(1)b V 0(+)a IV - - - - 111988 0(1)a V 0(+)b II 0(+)b II - - - - 611992 0(3)b II 0(1)c I 0(2)b II 0(2)b II 0(3)a III 26
Petasites palmatus 1986 0(1)a II 0(1)b IV 0(1)b III - - - - 131988 0(1) II 0(+) II 0(+) I - - - - 41992 0(+)b II 0(+)b II 0(+)b II 0(1)b II 0(1)a III 29
Petasites sagittatus 1986 0 0 0 0 0 0 - - - - 01988 0 0 0(+) I 0 0 - - - - 41992 Oa 0 0(+)a I Oa 0 Oa 0 Oa 0 16
Petasites vitifolius 1986 0 0 0 0 0 0 - - - - 01988 0 0 0 0 0 0 - - - - 01992 0 0 0(+) I 0(+) I 0 0 0(+) I 4
Phleum pratense 1986 0 0 0 0 0(+) I - - - - 21988 0 0 0(+) I 0(+) I - - - - 31992 0(+)a I Oa 0 0(+) I Oa 0 0(+)a 1 16
Picea glauca - B 2 1986 0 0 0 0 0 0 - - - - 01988 0 0 0 0 0 0 - - - - 01992 0 0 0 0 0(+) I 0 0 0 0 4
Picea glauca - A' 1986 0 0 0 0 0 0 - - - - 01988 0 0 0 0 0 0 - - - - 01992 0(+)b I 0(+) I 0(+) I 0(1)a I 1(1)a I 28
Picea glauca 2 1986 0(+) I 0(+) I 0(+) I - - - - +1988 0(+)a I Ob 0 0(+)a I - - - - 91992 0(+)ab I 0(+)ab I 0(+)ab I Ob 0 0(+)a I 11
Picea mariana 1986 0 0 0 0 0(+) I - - - - 21988 0 0 0 0 0 0 - - - - 01992 0 0 0 0 0 0 0 0 0 0 0
Pinus contorta - B 2 1986 0 0 0 0 0 0 - - - - 01988 0 0 0 0 0 0 - - - - 01992 Ob 0 Ob 0 0(+)ab I 0(1)a I 0(+)ab I 23
Pinus contorta - A 2 1986 0 0 0 0 0 0 - - - - 01988 0 0 0 0 0 0 - - - - 01992 0(+)c I 0(+)c I 0(+)bc I 0(1)ab I 0(1)a I 26
Pinus contorta 2 1986 0 0 0 0 0 0 - - - - 01988 0(+) I 0(+) I 0(+) I - - - - 91992 0(+)a I Ob 0 Ob 0 Ob 0 0(+) I 24
Poa palustris 1986 0 0 0 0 0 0 - - - - 01988 0 0 0(+) I 0(+) I - - - - 31992 0(+) I 0(+) I 0(+) I 0(+) I 0(+) I 7
Poa pratensis 1986 0(+) I 0(+) I 0(+) I - - - - 21988 0(+) I 0(+) I 0(+) II - - - - 161992 Oa 0 0(+)a I 0(+)a I 0(+)a I Oa 0 11
Populus 1986 0 0 0 0 0 0 - - - - 0balsamifera -B 1988 0 0 0 0 0 0 - - - - 0
1992 0 0 0 0 0 0 0 0 0(+) I 4
26
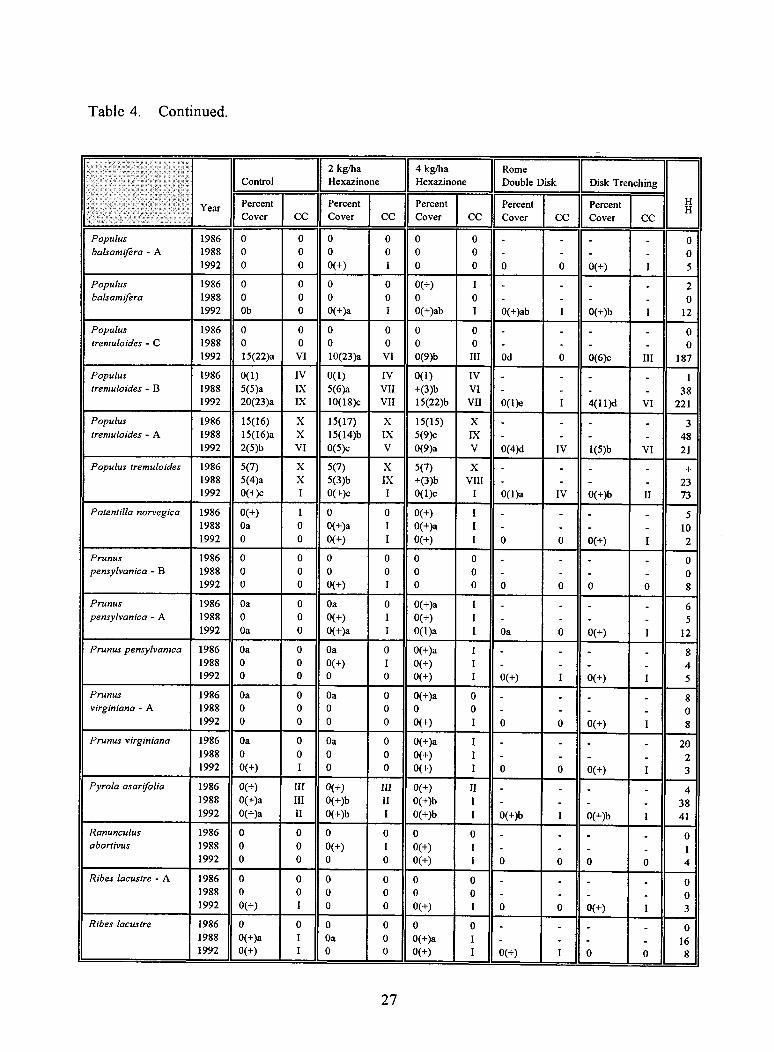
Table 4. Continued.
Year
Control2 kg/haHexazinone
4 kg/haHexazinone
RomeDouble Disk Disk Trenching
PercentCover CC
PercentCover CC
PercentCover CC
PercentCover CC
PercentCover CC
HH
Populus 1986 0 0 0 0 0 0 - - - - 0balsamiféra - A 1988 0 0 0 0 0 0 - - - - 0
1992 0 0 0(+) I 0 0 0 0 0(+) I 5
Populus 1986 0 0 0 0 0(+) I - - - - 2balsamifera 1988 0 0 0 0 0 0 - - - - 0
1992 Ob 0 0(+)a I 0(+)ab I 0(+)ab I 0(+)b I 12
Populus 1986 0 0 0 0 0 0 - - - - 0tremuloides - C 1988 0 0 0 0 0 0 - - - - 0
1992 15(22)a VI 10(23)a VI 0(9)b III Od 0 0(6)c III 187
Populus 1986 0(1) IV 0(1) IV 0(1) IV - - - - 1tremuloides - B 1988 5(5)a LX 5(6)a VII +(3)b VI - - - - 38
1992 20(23)a LX 10(18)c VII 15(22)b VII 0(1)e I 4( I 1)d VI 221
Populus 1986 15(16) X 15(17) X 15(15) X - - - - 3tremuloides - A 1988 15(16)a X 15(14)b IX 5(9)c IX - - - - 48
1992 2(5)b VI 0(5)c V 0(9)a V 0(4)d IV 1(5)b VI 21Populus tremuloides 1986 5(7) X 5(7) X 5(7) X - - - - +
1988 5(4)a X 5(3)b IX +(3)b VIII - - - - 231992 0(+)c I 0(+)c I 0(1)c I 0(1)a IV 0(+)b II 73
Potentilla norvegica 1986 0(+) I 0 0 0(+) I - - - - 51988 Oa 0 0(+)a I 0(+)a I - - - - 101992 0 0 0(+) I 0(+) I 0 0 0(+) I 2
Prunus 1986 0 0 0 0 0 0 - - - - 0pensylvanica - B 1988 0 0 0 0 0 0 - - - - 0
1992 0 0 0(+) I 0 0 0 0 0 0 8Prunus 1986 Oa 0 Oa 0 0(+)a I - - - - 6pensylvanica - A 1988 0 0 0(+) I 0(+) I - - - - 5
1992 Oa 0 0(+)a I 0(1)a I Oa 0 0(+) I 12Prunus pensylvanica 1986 Oa 0 Oa 0 0(+)a I - - - - 8
1988 0 0 0(+) I 0(+) I - - - - 41992 0 0 0 0 0(+) I 0(+) I 0(+) I 5
Prunus 1986 Oa 0 Oa 0 0(+)a 0 - - - - 8virginiana - A 1988 0 0 0 0 0 0 - - - - 0
1992 0 0 0 0 0(+) I 0 0 0(+) I 8Prunus virginiana 1986 Oa 0 Oa 0 0(+)a I - - - - 20
1988 0 0 0 0 0(+) I - - - - 21992 0(+) I 0 0 0(+) I 0 0 0(+) I 3
Pyrola asarifolia 1986 0(+) III 0(+) III 0(4-) II - - - - 41988 0(+)a III 0(+)b II 0(+)b I - - - _ 381992 0(+)a II 0(+)b I 0(+)b I 0(+)b I 0(+)b I 41
Ranunculus 1986 0 0 0 0 0 0 - - - - 0abortivus 1988 0 0 0(+) I 0(+) I - - - - 1
1992 0 0 0 0 0(+) I 0 0 0 0 4Ribes lacustre - A 1986 0 0 0 0 0 0 - - - - 0
1988 0 0 0 0 0 0 - - - - 01992 0(+) I 0 0 0(+) I 0 0 0(+) I 3
Ribes lacustre 1986 0 0 0 0 0 0 - - - - 01988 0(+)a I Oa 0 0(+)a I - - - - 161992 0(+) I 0 0 0(+) I 0(+) I 0 0 8
27
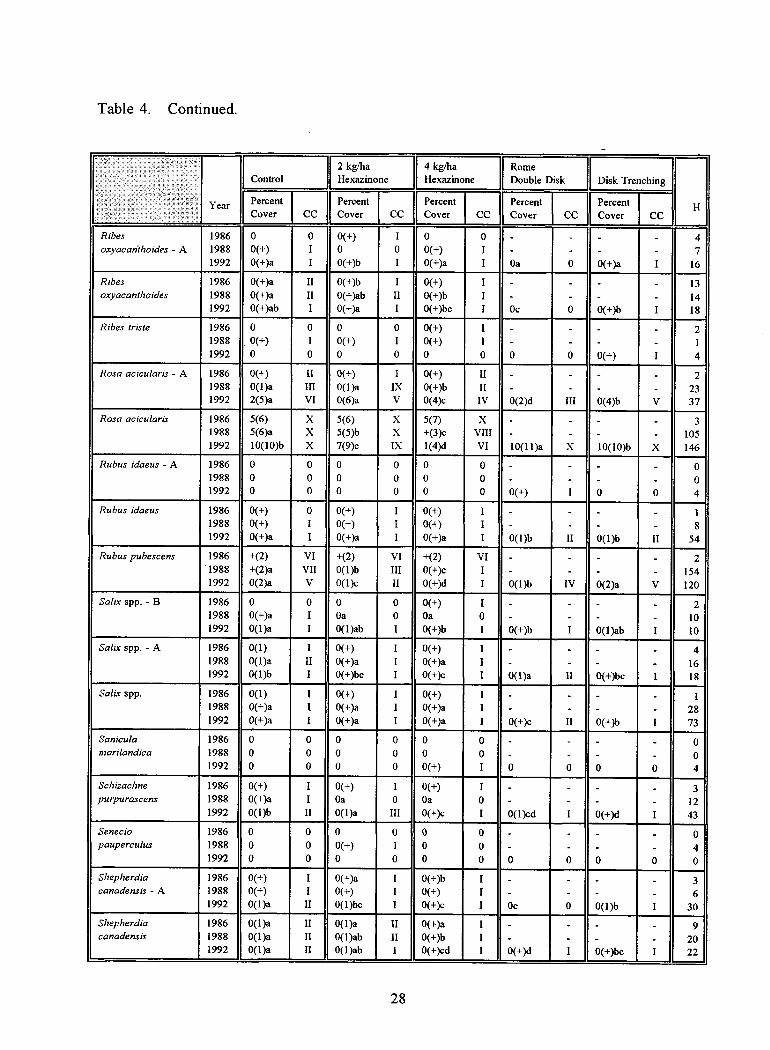
Table 4. Continued.
Year
Control2 kg/haHexazinone
4 kg/haHexazinone
RomeDouble Disk Disk Trenching
PercentCover CC
PercentCover CC
PercentCover CC
PercentCover CC
PercentCover CC
H
Ribes 1986 0 0 0(+) I 0 0 - - - - 4oxyacadthoides - A 1988 0(+) I 0 0 0(+) I - - - - 7
1992 0(+)a I 0(+)b I 0(+)a I Oa 0 0(+)a I 16
Ribes 1986 0(+)a II 0(+)b I 0(+) I - - - - 13oxyacanthoides 1988 0(+)a II 0(+)ab II 0(+)b I - - - - 14
1992 0(+)ab I 0(+)a I 0(+)bc I Oc 0 0(+)b I 18Ribes triste 1986 0 0 0 0 0(+) I - - - - 2
1988 0(+) I 0(+) I O(+) 1 - - - - 11992 0 0 0 0 0 0 0 0 0(+) I 4
Rosa acicularis - A 1986 0(+) II 0(+) I 0(+) II - - - - 21988 0(1)a HI 0(1)a IX 0(+)b H - - - - 231992 2(5)a VI 0(6)a V 0(4)c IV 0(2)d III 0(4)b V 37
Rosa acicularis 1986 5(6) X 5(6) X 5(7) X - - - - 31988 5(6)a X 5(5)b X +(3)c VIII - - - - 1051992 10(10)b X 7(9)c IX 1(4)d VI 10(11)a X 10(10)6 X 146
Rubus idaeus - A 1986 0 0 0 0 0 0 - - - - 01988 0 0 0 0 0 0 - - - - 01992 0 0 0 0 0 0 0(+) I 0 0 4
Rubus idaeus 1986 0(+) 0 0(+) I 0(+) I - - - - 11988 0(+) I 0(+) I 0(+) I - - - - 81992 0(+)a I 0(+)a I 0(+)a I 0(1)b II 0(1)b II 54
Rubus pubescens 1986 +(2) VI +(2) VI +(2) VI - - - - 21988 +(2)a VII 0(1)b III 0(+)c I - - - - 1541992 0(2)a V 0(1)c 11 0(+)d I 0(1)b IV 0(2)a V 120
Salix spp. - B 1986 0 0 0 0 0(+) I - - - - 21988 0(+)a I Oa 0 Oa 0 - - - - 101992 0(1)a I 0(1)ab 1 0(+)b I 0(+)b I 0(1)ab I 10
Salix spp. - A 1986 0(1) I 0(+) I 0(+) I - - - - 41988 0(1)a II 0(+)a I 0(+)a I - - - - 161992 0(1)b I 0(+)bc I 0(+)c I 0(1)a II 0(+)bc I 18
Salix spp. 1986 0(1) I 0(+) I 0(+) I - - - - 11988 0(+)a I 0(+)a I 0(+)a I - - - - 281992 0(+)a I 0(+)a I 0(+)a I 0(+)c II 0(+)b I 73
Sanicula 1986 0 0 0 0 0 0 - - - 0rnarilandica 1988 0 0 0 0 0 0 - - - - 0
1992 0 0 0 0 0(+) I 0 0 0 0 4
Schizachne 1986 0(+) I 0(+) I 0(+) I - - - - 3purpurascens 1988 0(+)a I Oa 0 Oa 0 - - - - 12
1992 0(1)b II 0(1)a III 0(+)c I 0(1)cd I 0(+)d I 43Senecio 1986 0 0 0 0 0 0 - - - - 0pauperculus 1988 0 0 0(+) I 0 0 - - - - 4
1992 0 0 0 0 0 0 0 0 0 0 0Shepherdia 1986 0(+) I 0(+)a I 0(+)b I - - - - 3canadensis - A 1988 0(+) I 0(+) I 0(+) I - - - - 6
1992 0(1)a II 0(1)bc I 0(+)c I Oc 0 0(1)b I 30Shepherdia 1986 0(1)a II 0(1)a II 0(+)a I - - - - 9canadensis 1988 0(1)a II 0(1)ab II 0(+)b I - - - - 20
1992 0(1)a II 0(1)ab I 0(+)cd I 0(+)d I 0(+)bc I 22
28
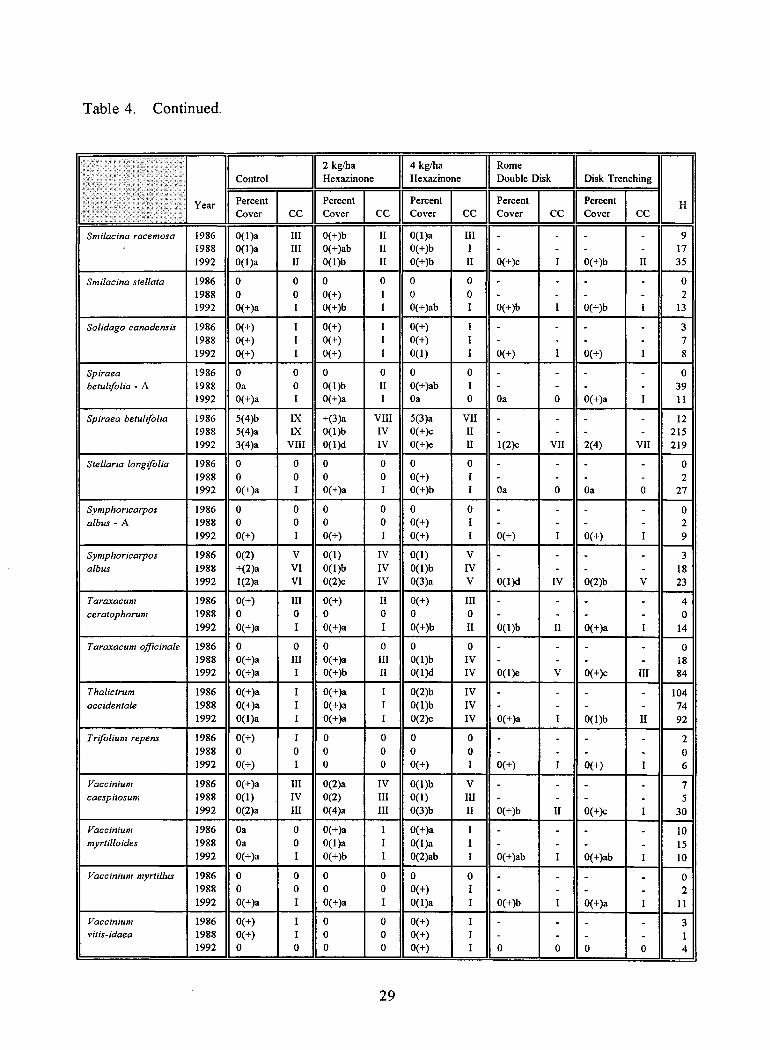
Table 4. Continued.
Year
Control2 kg/haHexazinone
4 kg/haHexazinone
RomeDouble Disk Disk Trenching
HPercentCover CC
PercentCover CC
PercentCover CC
PercentCover CC
PercentCover CC
Smilacina racemosa 1986 0(1)a III 0(+)b II 0(1)a III - - - - 9- 1988 0(1)a III 0(+)ab II 0(+)b I - - - - 17
1992 0(1)a II 0(1)6 II 0(+)b II 0(+)c I 0(+)b II 35
Smilacina stellata 1986 0 0 0 0 0 0 - - - - 01988 0 0 0(+) I 0 0 - - - - 21992 0(+)a I 0(+)b I 0(+)ab I 0(+)b I 0(+)b I 13
Solidago canadensis 1986 0(+) I 0(+) I 0(+) I - - - - 31988 0(+) I 0(+) I 0(+) I - - - - 71992 0(+) I 0(+) I 0(1) I 0(+) I 0(+) I 8
Spiraea 1986 0 0 0 0 0 0 - - - - 0betulifolia - A 1988 Oa 0 0(1)b II 0(+)ab I - - - - 39
1992 0(+)a I 0(+)a I Oa 0 Oa 0 0(+)a I 11
Spiraea betulifblia 1986 5(4)b LX +(3)a VIII 5(3)a VII - - - - 121988 5(4)a LX 0(1)b IV 0(+)c II - - - - 2151992 3(4)a VIII 0(1)d IV 0(+)e II 1(2)c VII 2(4) VII 219
Stellaria longifolia 1986 0 0 0 0 0 0 - - - - 01988 0 0 0 0 0(+) I - - - - 21992 0(+)a I 0(+)a I 0(+)b I Oa 0 Oa 0 27
Symphoricarpos 1986 0 0 0 0 0 0 - - - - 0albus - A 1988 0 0 0 0 0(+) I - - - - 2
1992 0(+) I 0(+) I 0(+) I 0(+) I 0(+) I 9
Symphoricarpos 1986 0(2) V 0(1) IV 0(1) V - - - - 3albus 1988 +(2)a VI 0(1)b IV 0(1)b IV - - - - 18
1992 1(2)a VI 0(2)c IV 0(3)a V 0(1)d IV 0(2)b V 23
Taraxacun2 1986 0(+) HI 0(+) II 0(+) III - - - - 4ceratophorum 1988 0 0 0 0 0 0 - - - - 0
1992 0(+)a I 0(+)a I 0(+)b II 0(1)b II 0(+)a I 14
Taraxacum officinale 1986 0 0 0 0 0 0 - - - - 01988 0(+)a III 0(+)a III 0(1)b IV - - - - 181992 0(+)a I 0(+)b II 0(1)d IV 0(1)e V 0(+)c III 84
Thalictrum 1986 0(+)a I 0(+)a I 0(2)b IV - - - - 104occidentale 1988 0(+)a I 0(+)a I 0(1)b IV - - - - 74
1992 0(1)a I 0(+)a I 0(2)c IV 0(+)a I 0(1)b II 92
Trifollum repens 1986 0(+) I 0 0 0 0 - - - - 21988 0 0 0 0 0 0 - - - - 01992 0(+) I 0 0 0(+) I 0(+) I 0(+) I 6
Vaccinium 1986 0(+)a III 0(2)a IV 0(1)b V - - - - 7caespitosum 1988 0(1) IV 0(2) III 0(1) III - - - - 5
1992 0(2)a III 0(4)a III 0(3)b II 0(+)b II 0(+)c I 30
Vaccinium 1986 Oa 0 0(+)a I 0(+)a I - - - - 10myrtilloides 1988 Oa 0 0(1)a I 0(1)a I - - - - 15
1992 0(+)a I 0(+)b I 0(2)ab I 0(+)ab I 0(+)ab I 10
Vaccinium myrtillus 1986 0 0 0 0 0 0 - - - - 01988 0 0 0 0 0(+) I - - - - 21992 0(+)a I 0(+)a I 0(1)a I 0(+)b I 0(+)a I 11
Vaccinium 1986 0(+) I 0 0 0(+) I - - - - 3vitis-idaea 1988 0(+) I 0 0 0(+) I - - - - 1
1992 0 0 0 0 0(+) I 0 0 0 0 4
29
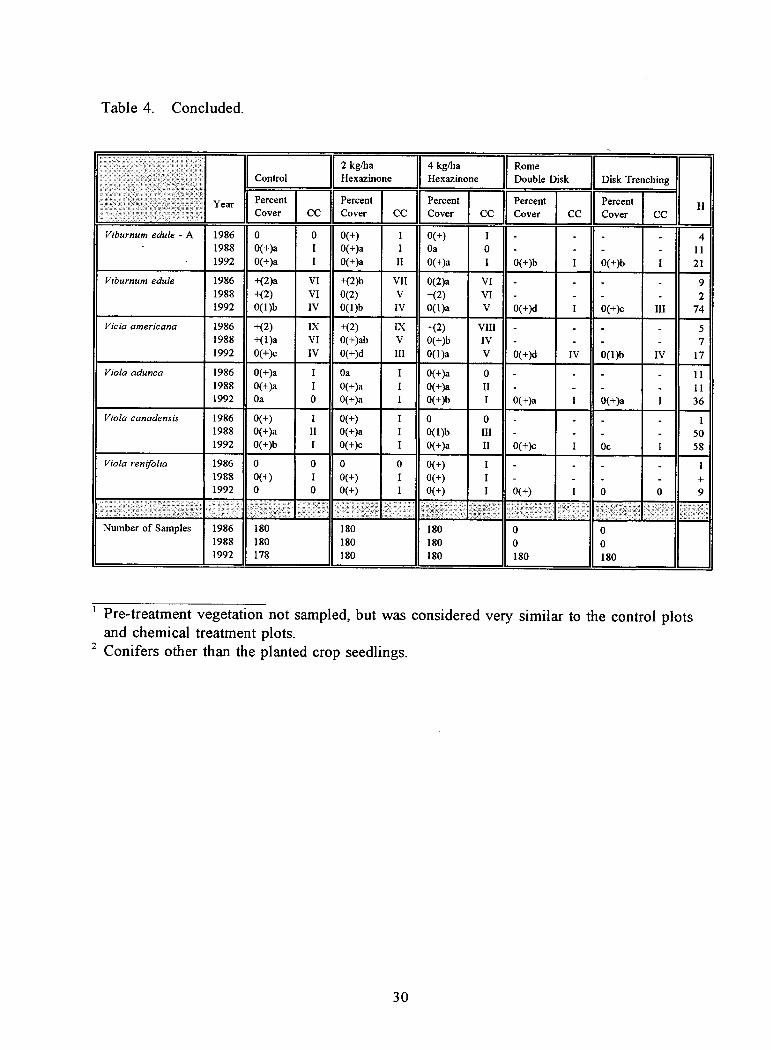
Table 4. Concluded.
Year
Control2 kg/baHexazinone
4 kg/baHexazinone
RomeDouble Disk Disk Trenching
PercentCover CC
PercentCover CC
PercentCover CC
PercentCover CC
PercentCover CC
H
Viburnum edule - A 1986 0 0 0(+) I 0(+) I - - - - 4- 1988 0(+)a I 0(+)a I Oa 0 - - - - 11
1992 0(+)a I 0(+)a II 0(+)a I 0(+)b I 0(+)b I 21
Viburnum edule 1986 +(2)a VI +(2)b VII 0(2)a VI - - - - 91988 +(2) VI 0(2) V +(2) VI - - - - 21992 0(1)b IV 0(1)b IV 0(1)a V 0(+)d I 0(+)c III 74
Vicia americana 1986 +(2) LX +(2) IX +(2) VIII - - - - 51988 +(1)a VI 0(+)ab V 0(+)b IV - - - - 71992 0(+)c IV 0(+)d III 0(1)a V 0(+)d IV 0(1)b IV 17
Viola adunca 1986 0(+)a I Oa I 0(+)a 0 - - - - 111988 0(+)a I 0(+)a I 0(+)a II - - - - 111992 Oa 0 0(+)a I 0(+)b I 0(+)a I 0(+)a I 36
Viola canadensis 1986 0(+) I 0(+) I 0 0 - - - - 11988 0(+)a II 0(+)a I 0(1)b III - - - - 501992 0(+)b I 0(+)c I 0(+)a II 0(+)c I Oc I 58
Viola renifblia 1986 0 0 0 0 0(+) I - - - - 11988 0(+) I 0(+) I 0(+) I - - - - +1992 0 0 0(+) I 0(+) I 0(+) I 0 0 9
Number of Samples 1986 180 180 180 0 0. 1988 180 180 180 0 0
1992 178 180 180 180 180
Pre-treatment vegetation not sampled, but was considered very similar to the control plotsand chemical treatment plots.
2 Conifers other than the planted crop seedlings.
30
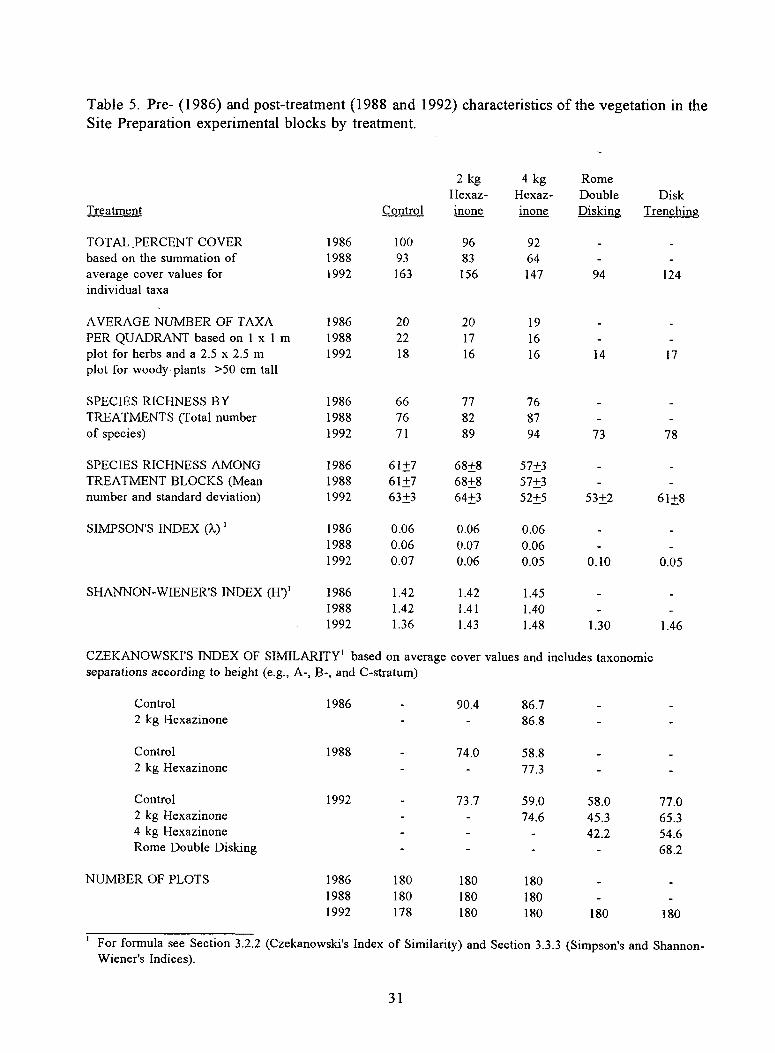
Table 5. Pre- (1986) and post-treatment (1988 and 1992) characteristics of the vegetation in theSite Preparation experimental blocks by treatment.
2 kgHexaz-
4 kgHexaz-
RomeDouble Disk
Treatment Control inone inone Disking Trenching
TOTAL _PERCENT COVER 1986 100 96 92 -based on the summation of 1988 93 83 64 - -average cover values forindividual taxa
1992 163 156 147 94 124
AVERAGE NUMBER OF TAXA 1986 20 20 19PER QUADRANT based on 1 x 1 m 1988 22 17 16 - -plot for herbs and a 2.5 x 2.5 mplot for woody plants >50 cm tall
1992 18 16 16 14 17
SPECIES RICHNESS BY 1986 66 77 76TREATMENTS (Total number 1988 76 82 87 -of species) 1992 71 89 94 73 78
SPECIES RICHNESS AMONG 1986 61+7 68+8 57+3 -TREATMENT BLOCKS (Mean 1988 61+7 68+8 57+3 -number and standard deviation) 1992 63+3 64+3 52+5 53+2 61+8
SIMPSON'S INDEX (2,) 1 1986 0.06 0.06 0.061988 0.06 0.07 0.061992 0.07 0.06 0.05 0.10 0.05
SHANNON-WIENER'S INDEX (H')' 1986 1.42 1.42 1.451988 1.42 1.41 1.401992 1.36 1.43 1.48 1.30 1.46
CZEKANOWSKI'S INDEX OF SIMILARITY' based on average cover values and includes taxonomicseparations according to height (e.g., A-, B-, and C-stratum)
Control 1986 90.4 86.72 kg Hexazinone 86.8
Control 1988 74.0 58.82 kg Hexazinone 77.3
Control 1992 73.7 59.0 58.0 77.02 kg Hexazinone - 74.6 45.3 65.34 kg Hexazinone - - 42.2 54.6Rome Double Disking - 68.2
NUMBER OF PLOTS 1986 180 180 1801988 180 180 180 -1992 178 180 180 180 180
For formula see Section 3.2.2 (Czekanowski's Index of Similarity) and Section 3.3.3 (Simpson's and Shannon-Wiener's Indices).
31
average of 19 to 20 species occurred within each sampled quadrant.
Among the three botanically surveyed treatment plots in 1986, statistically significant differences(P <0.05 level) in percent cover values were found in 30 taxa (includes species in different heightclasses). However, only four species had constancy values greater than 30 percent and asubstantial difference in median cover values. These species included Calamagrostis canadensiswith greater cover in the control plots, Corpus canadensis with lower cover in the 4 kg/hahexazinone treatment plot, and greater cover of Fragaria virginiana and lower cover of Spiraeabetulifolia in the 2 kg/ha hexazinone treatment plots. These differences ranged from a minoroccurrence (<0.55 percent) up to five percent cover (Table 4). A comparison of average percentcover values using Czekanowski's Index of Similarity revealed that an 86.7 to 90.4 percentsimilarity occurred among the three surveyed treatment plots (Table 5). Simpson's Index and theShannon-Wiener's Index values were similar among the three surveyed plots. In relative terms,these indices suggest that cover was distributed among a variety of species, but somewhatconcentrated within a subset of the total flora. Figure 3 suggests that in 1986, 90 percent of thetotal plant cover was concentrated in approximately 35 percent of the species, while 50 percentof the cover was concentrated in 10 percent of the flora. Perfect equatability in cover among allspecies would be represented by a straight line between the lower-left and upper-right corners ofthe diagram. Both control plots and the surveyed treatment plots had essentially the samecumulative cover curves as presented in Figure 3.
The compositional similarity, lack of substantial differences in individual species cover values,similarity in floristic characteristics, and similarity of woody stem densities suggests that thevegetation within the two surveyed treatment and control plots was quite similar in 1986.Therefore, it is assumed that the vegetation within the unsurveyed disk trenching and Romedouble disking treatment plots was probably similar to the surveyed vegetation. Photograph 1Ais an example of the pre-treatment vegetation within the Site Preparation blocks in 1986.
4.1.2 Post-treatment Vegetation
4.1.2.1 Control Plots
The general height of the Populus tremuloides canopy increased from approximately 90 cm in1986 to 190 and 350 cm by 1988 and 1992, respectively (Photographs 1B and 1C). Tree specieswithin the A- and B-stratum had a combined median cover of 35 percent (46 percent average).The total number of woody stems greater than 50 cm tall peaked in 1988 (73,448/ha) anddeclined to 54,129/ha by 1992. Most of the change in density occurred within the A-stratum(>50 to 150 cm). Populus tremuloides declined in density by 32,533 stems/ha, or 85 percentduring the 1988 to 1992 period. Amelanchier alnifolia also showed a 15 percent decrease indensity. However, the total length of woody stems continued to increase to a maximum of81,131 m/ha in 1992 (Table 3). Populus tremuloides remained the dominant woody speciesbased on the number of stems/ha, but showed a consistent decrease in its proportion of the totaldensity (i.e., 1986 - 85 percent, 1988 - 70 percent, and 1992 - 44 percent). Amelanchier alnifohafollowed by Rosa acicularis increased the most during the 1987 to 1992 period. Approximately
32
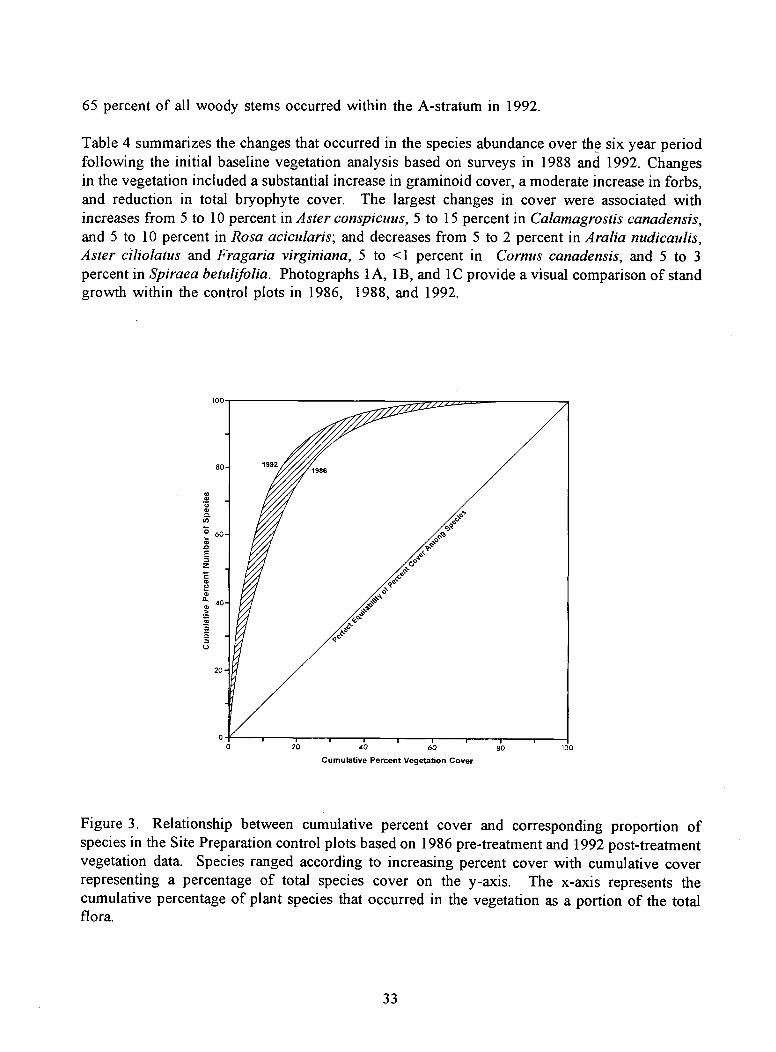
65 percent of all woody stems occurred within the A-stratum in 1992.
Table 4 summarizes the changes that occurred in the species abundance over the six year periodfollowing the initial baseline vegetation analysis based on surveys in 1988 and 1992. Changesin the vegetation included a substantial increase in graminoid cover, a moderate increase in forbs,and reduction in total bryophyte cover. The largest changes in cover were associated withincreases from 5 to 10 percent in Aster conspicuus, 5 to 15 percent in Calamagrostis canadensis,and 5 to 10 percent in Rosa acicularis; and decreases from 5 to 2 percent in Aralia nudicaulis,Aster ciliolatus and Fragaria virginiana, 5 to <1 percent in Cornus canadensis, and 5 to 3percent in Spiraea betulifolia. Photographs 1A, 1B, and 1C provide a visual comparison of standgrowth within the control plots in 1986, 1988, and 1992.
100
BO
U
60
40
aEa
20
20
40 60
80
100
Cumulative Percent Vegetation Cover
Figure 3. Relationship between cumulative percent cover and corresponding proportion ofspecies in the Site Preparation control plots based on 1986 pre-treatment and 1992 post-treatmentvegetation data. Species ranged according to increasing percent cover with cumulative coverrepresenting a percentage of total species cover on the y-axis. The x-axis represents thecumulative percentage of plant species that occurred in the vegetation as a portion of the totalflora.
33
The number of recorded species in the control plots was greater in the 1988 and 1992 vegetationsurveys than the 1986 assessments (Table 5). However, the total number of species was low inthe 1992 survey relative to the 1988 survey. This decline in species richness for the treatmentwas not a direct loss of five species, since 21 previously recorded taxa were not found and 16new taxa were identified in 1992. Twelve species of the 71 found in the 1992 survey hadconstancy values greater than 50 percent: Populus tremuloides, Rosa acicularis, Asterconspicuus, Calamagrostis canadensis, Epilobium angustifolium, Galium boreale, Spiraeabetulifolia, Aralia nudicaulis, Aster ciliolatus, Corms canadensis, Fragaria virginiana, andSymphOricarpos albus (Table 4). These species represented approximately 80 percent of the totalvegetation cover in 1992 (163 percent).
Relative to the 1986 vegetation survey, a greater degree of species dominance occurred in 1992as shown on Figure 3. The shift to the left in the 1992 cumulative cover curve and the resultinggap (hatched area) is interpreted as an increased concentration of plant cover within a smallerproportion of the flora as the vegetation aged. Approximately 90 percent of all cover wasconcentrated within 25 percent of the flora in 1992 compared with 35 percent in 1986. Simpson'sIndex and Shannon-Wiener's Index values were essentially the same between 1986 and 1992(Table 5).
In summary, this vegetation increased 250 cm in height, had a net increased woody stem densityof 2.5 percent, and had a 73 percent increase in the total woody stem length during the 1986 to1992 period.
4.1.2.2 2 kg/ha Hexazinone Treatment Plots
A regenerating deciduous forest stand with a partially closed canopy (25 percent) and a generalheight of 370 cm dominated the physiognomy of the 2 kg/ha hexazinone treatment plots in 1992(Photograph 2). In 1988, one year after treatment with hexazinone, the density (stems/ha) andlength (m/ha) of total woody plant stems had increased above pre-treatment levels, but declinedby 26 percent as of 1992 (Table 3). The largest declines in density occurred in Populustremuloides (26,255 stems or a 56 percent decrease), Amelanchier alnifolia, and Shepherdiacanadensis. Shrubs such as Rosa acicularis and Corylus cornuta increased in density to reducethe overall loss in density. Total stem densities in 1992 were 44,753 stems/ha, which represented70,123 m of woody stems per hectare. Excluding Populus tremuloides, the most common woodyplants in the 2 kg/ha hexazinone treatment plots were Rosa acicularis, Corylus cornuta, andAmelanchier alnifolia, respectively. Approximately 62 percent of all woody stems occurredwithin the A-stratum in 1992.
A shrub dominated A-stratum (>50 to 150 cm) and a mixed graminoid or forb stratum (<50 cm)occurred beneath the Populus tremuloides canopy. Forbs were the dominant growth-form in theherb stratum (Table 4). Treatment of the vegetation with 2 kg/ha of hexazinone initially reducedoverall plant cover by 14 percent, but it recovered to levels comparable to the control plots by1992 (Figure 4). This decrease appears to have been a general response by a variety of specieswhich included Fragaria virginiana (percent change -4 percent), Lathyrus ochroleucus (-4percent), Popuhrs tremuloides in the A-stratum (-3 percent), Calamagrostis canadensis (-2
34
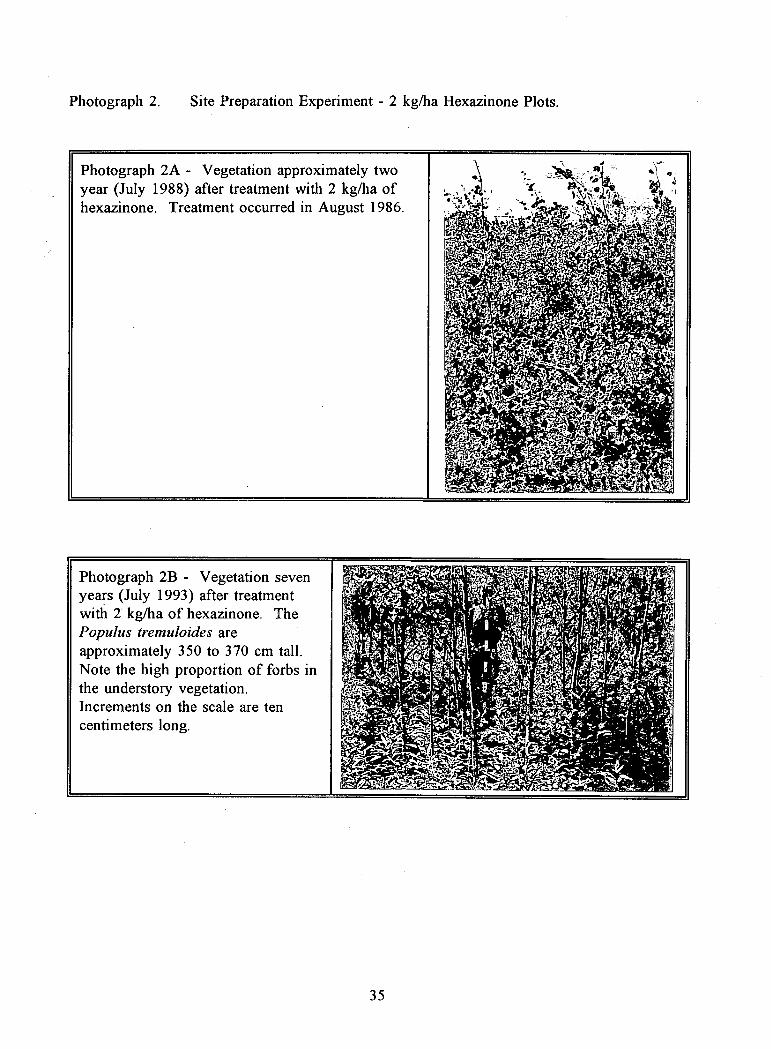
Photograph 2A - Vegetation approximately twoyear (July 1988) after treatment with 2 kg/ha ofhexazinone. Treatment occurred in August 1986.
Photograph 2B - Vegetation sevenyears (July 1993) after treatmentwith 2 kg/ha of hexazinone. ThePopulus tremuloides areapproximately 350 to 370 cm tall.Note the high proportion of forbs inthe understory vegetation.Increments on the scale are tencentimeters long.
Photograph 2. Site Preparation Experiment - 2 kg/ha Hexazinone Plots.
35
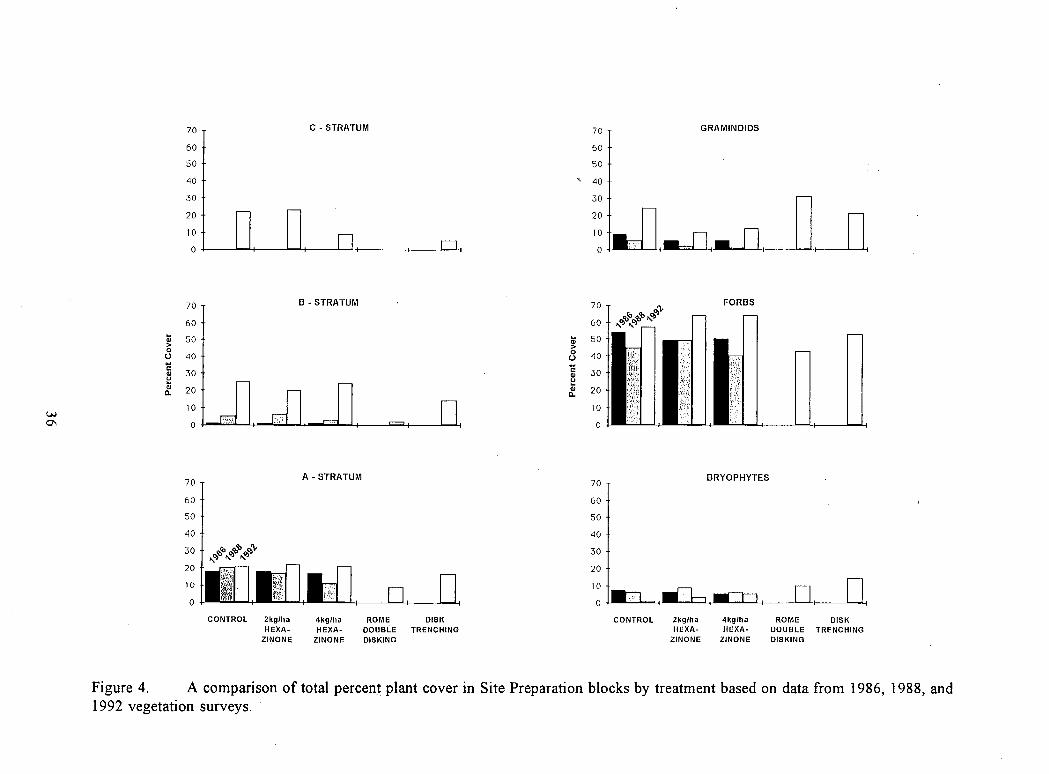
B - STRATUM
GRAMINOIDS
-- 14 II -4
70
Q,Q1b n°5 5160 ,,cr'r '
50
40
30
20
10
0
FORBS
70
60
50
40
30
20
10
0
70
60
50
40
30
20
10
0
70
60
:1; 500
40
a,
•
30
20
10
0
70A - STRATUM
70BRYOPHYTES
60 60
50 50
40 40
30 , , F)9 aq '
OP C01'C 01' 30
20 , 20.
CONTROL 2kglha 4kglha ROME DISK CONTROL 2kglha 4kg/ha ROME DISKHEXA- HEXA- DOUBLE TRENCHING HEXA- HEXA- DOUBLE TRENCHING
ZINONE ZINONE DISKING ZINONE ZINONE DISKING
10 ,weA ,
00 0
in
.
Figure 4. A comparison of total percent plant cover in Site Preparation blocks by treatment based on data from 1986, 1988, and1992 vegetation surveys.
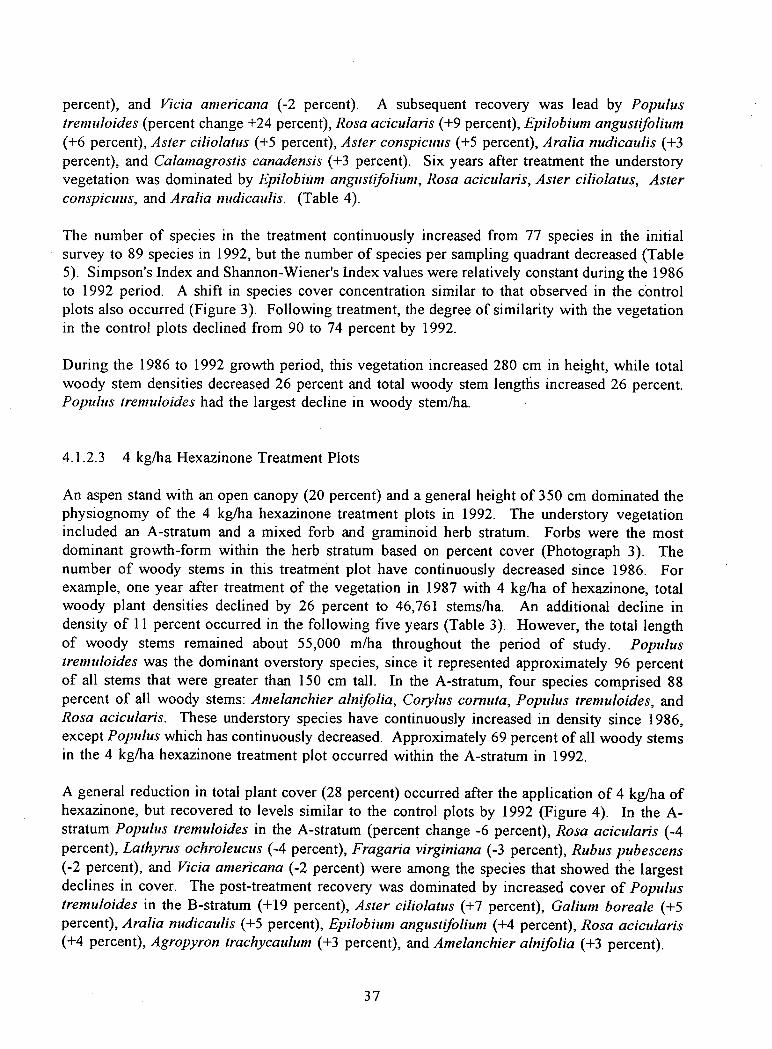
percent), and Vicia americana (-2 percent). A subsequent recovery was lead by Populustremuloides (percent change +24 percent), Rosa acicularis (+9 percent), Epilobium angustifolium(+6 percent), Aster ciliolatus (+5 percent), Aster conspicuus (+5 percent), Aralia nudicaulis (+3percent), and Calamagrostis canadensis (+3 percent). Six years after treatment the understoryvegetation was dominated by Epilobium angustifolium, Rosa acicularis, Aster ciliolatus, Asterconspicuus, and Aralia nudicaulis. (Table 4).
The number of species in the treatment continuously increased from 77 species in the initialsurvey to 89 species in 1992, but the number of species per sampling quadrant decreased (Table5). Simpson's Index and Shannon-Wiener's Index values were relatively constant during the 1986to 1992 period. A shift in species cover concentration similar to that observed in the controlplots also occurred (Figure 3). Following treatment, the degree of similarity with the vegetationin the control plots declined from 90 to 74 percent by 1992.
During the 1986 to 1992 growth period, this vegetation increased 280 cm in height, while totalwoody stem densities decreased 26 percent and total woody stem lengths increased 26 percent.Populus tremuloides had the largest decline in woody stem/ha.
4.1.2.3 4 kg/ha Hexazinone Treatment Plots
An aspen stand with an open canopy (20 percent) and a general height of 350 cm dominated thephysiognomy of the 4 kg/ha hexazinone treatment plots in 1992. The understory vegetationincluded an A-stratum and a mixed forb and graminoid herb stratum. Forbs were the mostdominant growth-form within the herb stratum based on percent cover (Photograph 3). Thenumber of woody stems in this treatment plot have continuously decreased since 1986. Forexample, one year after treatment of the vegetation in 1987 with 4 kg/ha of hexazinone, totalwoody plant densities declined by 26 percent to 46,761 stems/ha. An additional decline indensity of 11 percent occurred in the following five years (Table 3). However, the total lengthof woody stems remained about 55,000 m/ha throughout the period of study. Populustremuloides was the dominant overstory species, since it represented approximately 96 percentof all stems that were greater than 150 cm tall. In the A-stratum, four species comprised 88percent of all woody stems: Amelanchier alnifolia, Corylus cornuta, Populus tremuloides, andRosa acicularis. These understory species have continuously increased in density since 1986,except Populus which has continuously decreased. Approximately 69 percent of all woody stemsin the 4 kg/ha hexazinone treatment plot occurred within the A-stratum in 1992.
A general reduction in total plant cover (28 percent) occurred after the application of 4 kg/ha ofhexazinone, but recovered to levels similar to the control plots by 1992 (Figure 4). In the A-stratum Populus tremuloides in the A-stratum (percent change -6 percent), Rosa acicularis (-4percent), Lathyrus ochroleucus (-4 percent), Fragaria virginiana (-3 percent), Rub us pubescens(-2 percent), and Vicia americana (-2 percent) were among the species that showed the largestdeclines in cover. The post-treatment recovery was dominated by increased cover of Populustremuloides in the B-stratum (+19 percent), Aster ciliolatus (+7 percent), Galium boreale (+5percent), Aralia nudicaulis (+5 percent), Epilobium angustifolium (+4 percent), Rosa acicularis(+4 percent), Agropyron trachycaulum (+3 percent), and Amelanchier alnifolia (+3 percent).
37
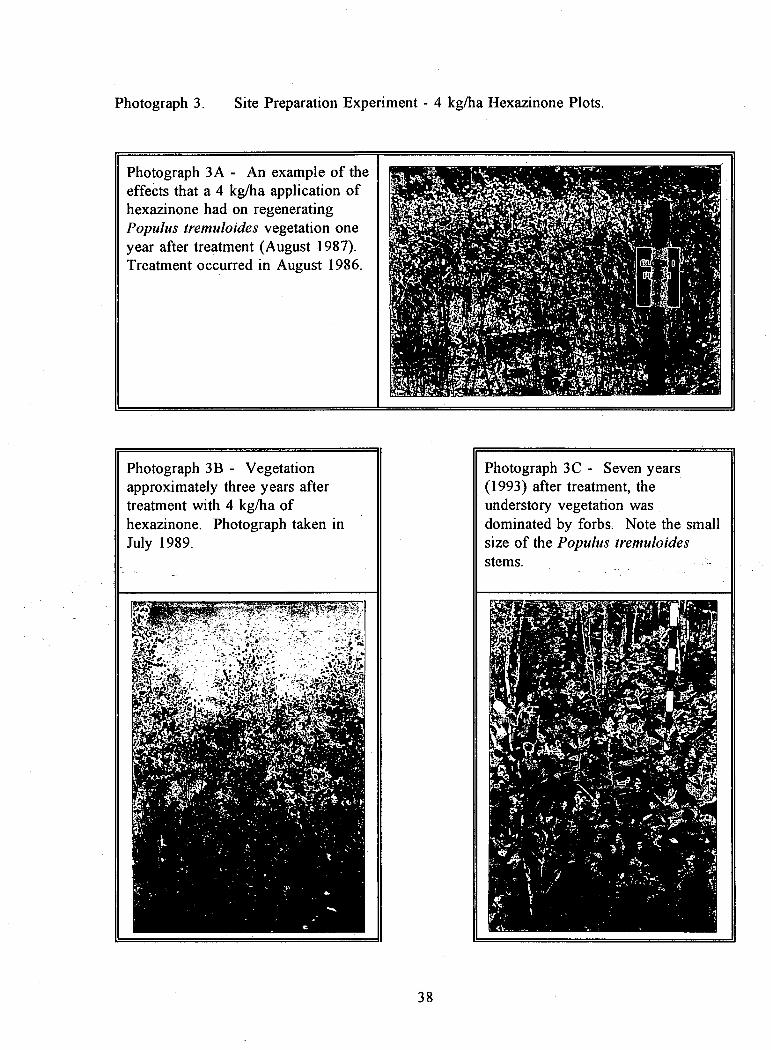
Photograph 3B - Vegetationapproximately three years aftertreatment with 4 kg/ha ofhexazinone. Photograph taken inJuly 1989.
Photograph 3C - Seven years(1993) after treatment, theunderstory vegetation wasdominated by forbs. Note the smallsize of the Populus tremuloidesstems.
Photograph 3. Site Preparation Experiment - 4 kg/ha Hexazinone Plots.
Photograph 3A - An example of theeffects that a 4 kg/ha application ofhexazinone had on regeneratingPopulus tremuloides vegetation oneyear after treatment (August 1987).Treatment occurred in August 1986.
38
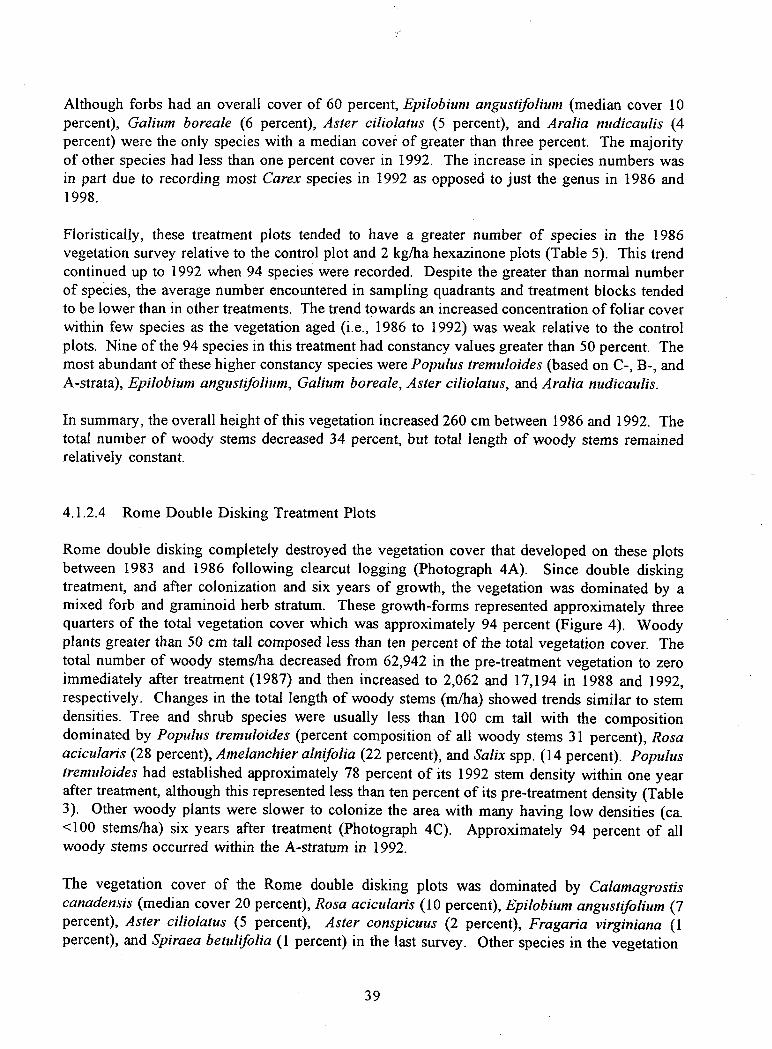
Although forbs had an overall cover of 60 percent, Epilobium: angustifolium (median cover 10percent), Gahurn boreale (6 percent), Aster ciliolatus (5 percent), and Aralia nudicaulis (4percent) were the only species with a median cover of greater than three percent. The majorityof other species had less than one percent cover in 1992. The increase in species numbers wasin part due to recording most Carex species in 1992 as opposed to just the genus in 1986 and1998.
Floristically, these treatment plots tended to have a greater number of species in the 1986vegetation survey relative to the control plot and 2 kg/ha hexazinone plots (Table 5). This trendcontinued up to 1992 when 94 species were recorded. Despite the greater than normal numberof species, the average number encountered in sampling quadrants and treatment blocks tendedto be lower than in other treatments. The trend towards an increased concentration of foliar coverwithin few species as the vegetation aged (i.e., 1986 to 1992) was weak relative to the controlplots. Nine of the 94 species in this treatment had constancy values greater than 50 percent. Themost abundant of these higher constancy species were Populus tremuloides (based on C-, B-, andA-strata), Epilobium angustifolium, Gahm boreale, Aster ciliolatus, and Aralia nudicaulis.
In summary, the overall height of this vegetation increased 260 cm between 1986 and 1992. Thetotal number of woody stems decreased 34 percent, but total length of woody stems remainedrelatively constant.
4.1.2.4 Rome Double Disking Treatment Plots
Rome double disking completely destroyed the vegetation cover that developed on these plotsbetween 1983 and 1986 following clearcut logging (Photograph 4A). Since double diskingtreatment, and after colonization and six years of growth, the vegetation was dominated by amixed forb and graminoid herb stratum. These growth-forms represented approximately threequarters of the total vegetation cover which was approximately 94 percent (Figure 4). Woodyplants greater than 50 cm tall composed less than ten percent of the total vegetation cover. Thetotal number of woody stems/ha decreased from 62,942 in the pre-treatment vegetation to zeroimmediately after treatment (1987) and then increased to 2,062 and 17,194 in 1988 and 1992,respectively. Changes in the total length of woody stems (m/ha) showed trends similar to stemdensities. Tree and shrub species were usually less than 100 cm tall with the compositiondominated by Populus tremuloides (percent composition of all woody stems 31 percent), Rosaacicularis (28 percent), Amelanchier alnifolia (22 percent), and Salix spp. (14 percent). Populustremuloides had established approximately 78 percent of its 1992 stem density within one yearafter treatment, although this represented less than ten percent of its pre-treatment density (Table3). Other woody plants were slower to colonize the area with many having low densities (ca.<100 stems/ha) six years after treatment (Photograph 4C). Approximately 94 percent of allwoody stems occurred within the A-stratum in 1992.
The vegetation cover of the Rome double disking plots was dominated by Calamagrostiscanadensis (median cover 20 percent), Rosa acicularis (10 percent), Epilobium angustifolium (7percent), Aster ciliolatus (5 percent), Aster conspicuus (2 percent), Fragaria virginiana (1percent), and Spiraea betulifolia (1 percent) in the last survey. Other species in the vegetation
39
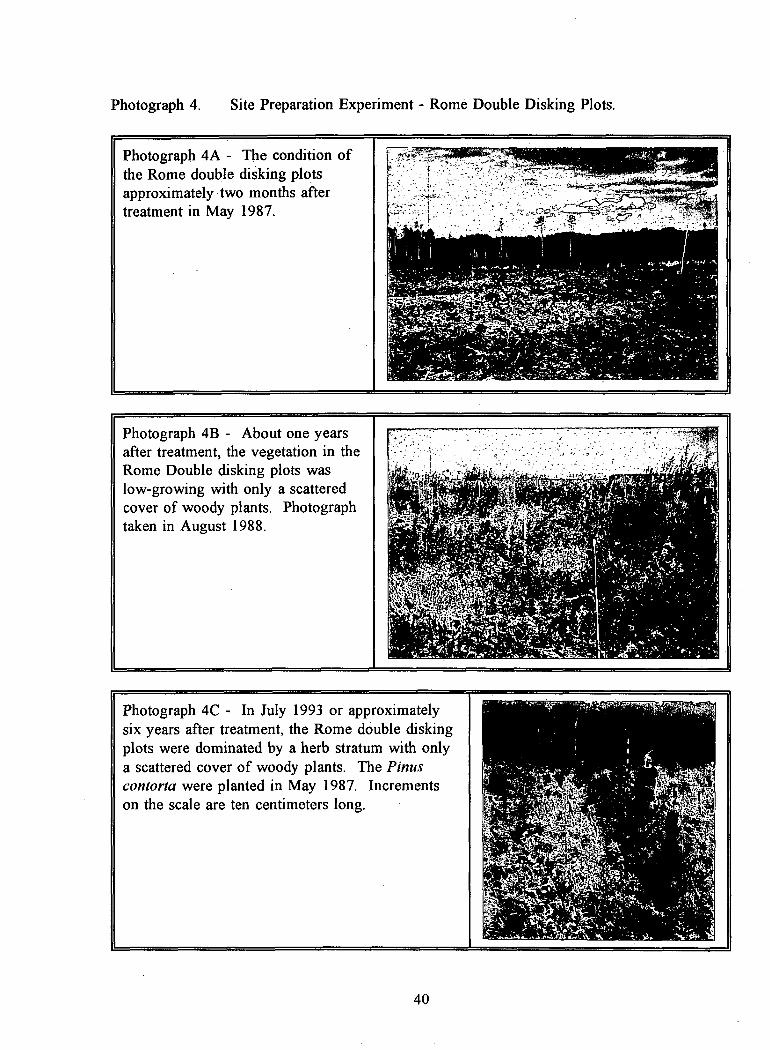
Photograph 4C - In July 1993 or approximatelysix years after treatment, the Rome double diskingplots were dominated by a herb stratum with onlya scattered cover of woody plants. The Pinuscontorts were planted in May 1987. Incrementson the scale are ten centimeters long.
Photograph 4A - The condition ofthe Rome double disking plotsapproximately two months aftertreatment in May 1987.
Photograph 4B - About one yearsafter treatment, the vegetation in theRome Double disking plots waslow-growing with only a scatteredcover of woody plants. Photographtaken in August 1988.
Photograph 4. Site Preparation Experiment - Rome Double Disking Plots.
40
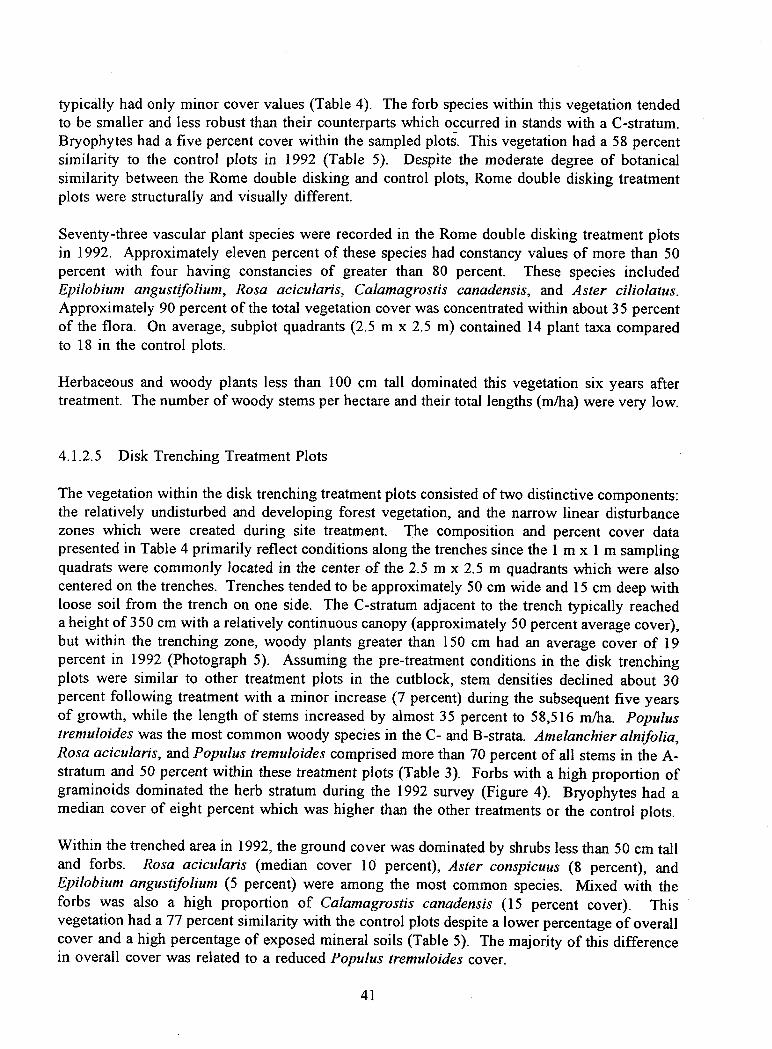
typically had only minor cover values (Table 4). The forb species within this vegetation tendedto be smaller and less robust than their counterparts which occurred in stands with a C-stratum.Bryophytes had a five percent cover within the sampled plots. This vegetation had a 58 percentsimilarity to the control plots in 1992 (Table 5). Despite the moderate degree of botanicalsimilarity between the Rome double disking and control plots, Rome double disking treatmentplots were structurally and visually different.
Seventy-three vascular plant species were recorded in the Rome double disking treatment plotsin 1992. Approximately eleven percent of these species had constancy values of more than 50percent with four having constancies of greater than 80 percent. These species includedEpilobium angustifolium, Rosa acicularis, Calamagrostis canadensis, and Aster ciliolatus.Approximately 90 percent of the total vegetation cover was concentrated within about 35 percentof the flora. On average, subplot quadrants (2.5 m x 2.5 m) contained 14 plant taxa comparedto 18 in the control plots.
Herbaceous and woody plants less than 100 cm tall dominated this vegetation six years aftertreatment. The number of woody stems per hectare and their total lengths (m/ha) were very low.
4.1.2.5 Disk Trenching Treatment Plots
The vegetation within the disk trenching treatment plots consisted of two distinctive components:the relatively undisturbed and developing forest vegetation, and the narrow linear disturbancezones which were created during site treatment. The composition and percent cover datapresented in Table 4 primarily reflect conditions along the trenches since the 1 m x 1 m samplingquadrats were commonly located in the center of the 2.5 m x 2.5 m quadrants which were alsocentered on the trenches. Trenches tended to be approximately 50 cm wide and 15 cm deep withloose soil from the trench on one side. The C-stratum adjacent to the trench typically reacheda height of 350 cm with a relatively continuous canopy (approximately 50 percent average cover),but within the trenching zone, woody plants greater than 150 cm had an average cover of 19percent in 1992 (Photograph 5). Assuming the pre-treatment conditions in the disk trenchingplots were similar to other treatment plots in the cutblock, stem densities declined about 30percent following treatment with a minor increase (7 percent) during the subsequent five yearsof growth, while the length of stems increased by almost 35 percent to 58,516 m/ha. Populustremuloides was the most common woody species in the C- and B-strata. Amelanchier alnifolia,Rosa acicularis, and Populus tremuloides comprised more than 70 percent of all stems in the A-stratum and 50 percent within these treatment plots (Table 3). Forbs with a high proportion ofgraminoids dominated the herb stratum during the 1992 survey (Figure 4). Bryophytes had amedian cover of eight percent which was higher than the other treatments or the control plots.
Within the trenched area in 1992, the ground cover was dominated by shrubs less than 50 cm talland forbs. Rosa acicularis (median cover 10 percent), Aster conspicuus (8 percent), andEpilobium angustifolium (5 percent) were among the most common species. Mixed with theforbs was also a high proportion of Calamagrostis canadensis (15 percent cover). Thisvegetation had a 77 percent similarity with the control plots despite a lower percentage of overallcover and a high percentage of exposed mineral soils (Table 5). The majority of this differencein overall cover was related to a reduced Populus tremuloides cover.
41
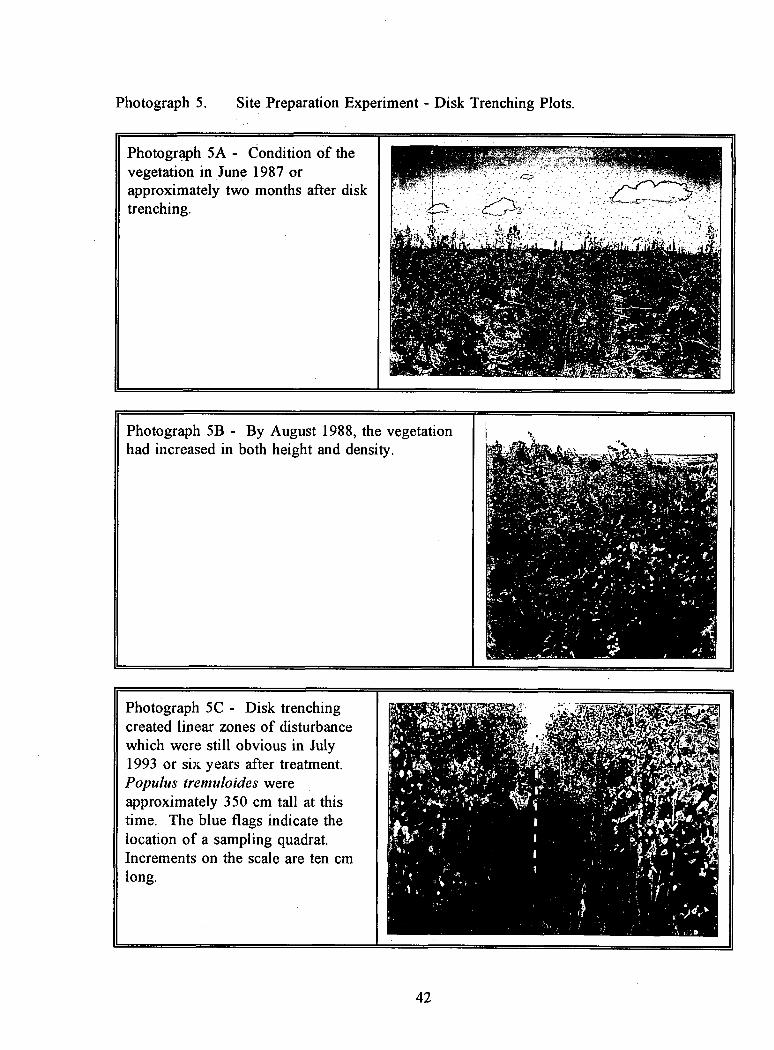
Photograph 5C - Disk trenchingcreated linear zones of disturbancewhich were still obvious in July1993 or six years after treatment.Populus tremuloides wereapproximately 350 cm tall at thistime. The blue flags indicate thelocation of a sampling quadrat.Increments on the scale are ten cmlong.
Photograph 5A - Condition of thevegetation in June 1987 orapproximately two months after disktrenching.
Photograph 5B - By August 1988, the vegetationhad increased in both height and density.
Photograph 5. Site Preparation Experiment - Disk Trenching Plots.
42
Seventy-eight vascular plant species were found in this treatment along the trenched areas duringthe 1992 vegetation survey. Ten of these species had constancy values greater than 50 percent:Calamagrostis canadensis, Rosa acicularis, Aster conspicuus, Populus tremuloides, Epilobiumangustifolium, Aster ciliolatus, Aralia nudicaulis, Galium boreale, Spiraea betulifolia, and Cornuscanadensis. Approximately 90 percent of the total vegetation cover (124 percent) wasconcentrated in 30 percent of the flora. The cumulative cover curve for this treatment wassimilar to the 1992 control plots (Figure 3). Simpson's Index was slightly higher and Shannon-Wiener's Index was slightly lower than the values associated with the control plots. The averagenumber of species per quadrant was 17 which was one species less than that found in the controlplots.
This vegetation increased 250 cm in height between 1986 and 1992. The total number of woodystems decreased by approximate 25 percent but the total length of woody stems increased onlysix percent.
4.1.3 Comparison of Treatments
One difficulty with assessing the impact of different site preparation methods on native vegetationwas separating the changes due to natural stand developmental processes from the effects of thetreatment. This in part was accomplished by directly comparing the species composition of eachtreatment with the control plots. In addition, this approach assumes that the initial vegetationamong all the treatment plots was essentially the same, which appears to be true with someexceptions (See Section 4.1.1). To determine where differences occurred among the treatments,Kruskal-Wallis tests were performed by plant growth-form and taxa. The results of these testsare given in Table 4.
The various site preparation treatments had an influence on all growth-form categories and 16taxa which included 13 species (Table 6). Treatment with 2 kg of hexazinone per hectare appearsto have had only a slight effect on the physiognomic and structural development of thevegetation, and little or no effect on total plant cover (Table 5). The density of woody stems oneyear after treatment (1988) was reduced by about 14 percent, and 17 percent in 1992 relative tothe control plots (Table 6). 2 The length of woody stems (m/ha) showed a similar pattern ofdecline. This treatment reduced the cover of the B-stratum (mostly Populus tremuloides);somewhat reduced the abundance of Populus tremuloides in the A-stratum, Rosa acicularis, andSymphoricarpos albus; and significantly reduced the abundance of Aster conspicuus and Fragariavirginiana. The abundance of Aralia nudicaulis, Aster ciliolatus, Cornus canadensis, Epilobiumangustifolium, Galium boreale, and Maianthemurn canadense was increased relative to the controlplots by 1992. The largest change was associated with Epilobium angustifolium which had anincreased cover of about 65 percent (a change in median cover from 6 percent to 10 percent) in1992 (Tables 4 and 6). Relatively large differences in the percent cover of Calamagrostis
2 Since most treatments had stem densities that were greater than the control plots, 1988 and1992 densities were adjusted to allow direct comparison of treatment and control plots.Adjustments were based on a ratio between 1986 control and treatment plot densities. Anaverage across all treatments was used for the 1986 disk trenching value.
43
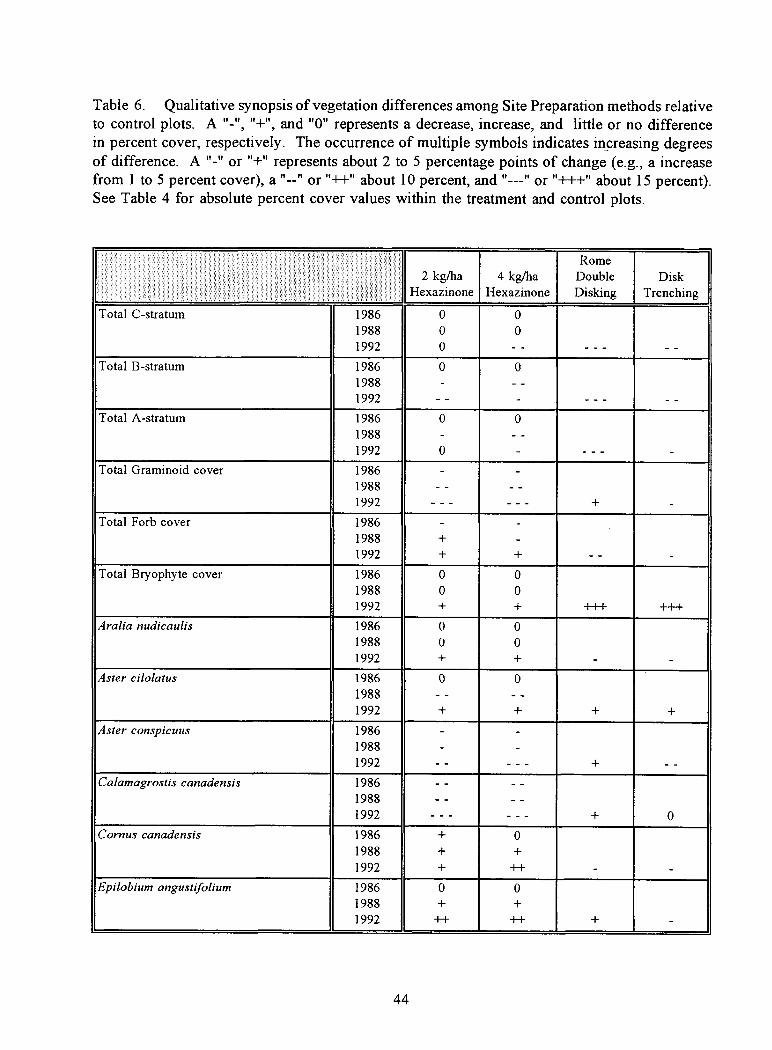
Table 6. Qualitative synopsis of vegetation differences among Site Preparation methods relativeto control plots. A " 2 , "+", and "0" represents a decrease, increase, and little or no differencein percent cover, respectively. The occurrence of multiple symbols indicates increasing degreesof difference. A " 2 or "+" represents about 2 to 5 percentage points of change (e.g., a increasefrom 1 to 5 percent cover), a "--" or "++" about 10 percent, and "---" or "+++" about 15 percent).See Table 4 for absolute percent cover values within the treatment and control plots.
2 kg/haHexazinone
4 kg/haHexazinone
RomeDoubleDisking
DiskTrenching
Total C-stratum 1986 0 01988 0 01992 0 -- --- - -
Total B-stratum 1986 0 01988 - - -1992 -- - --- - -
Total A-stratum 1986 0 01988 - - -1992 0 - - - - -
Total Graminoid cover 1986 - -1988 - - - -1992 --- --- + -
Total Forb cover 1986 - -1988 + -1992 + + - - -
Total Bryophyte cover 1986 0 01988 0 01992 + + +++ +-H-
Aralia nudicaulis 1986 0 01988 0 01992 + + - -
Aster cilolatus 1986 0 01988 - - - -1992 + + + +
Aster conspicuus 1986 - -1988 - -1992 -- --- + - -
Calamagrostis canadensis 1986 - - - -1988 - - - -1992 --- --- + 0
Cornus canadensis 1986 + 01988 + +1992 + ++ - -
Epilobium angustifolium 1986 0 01988 + +1992 ++ ++ + -
44
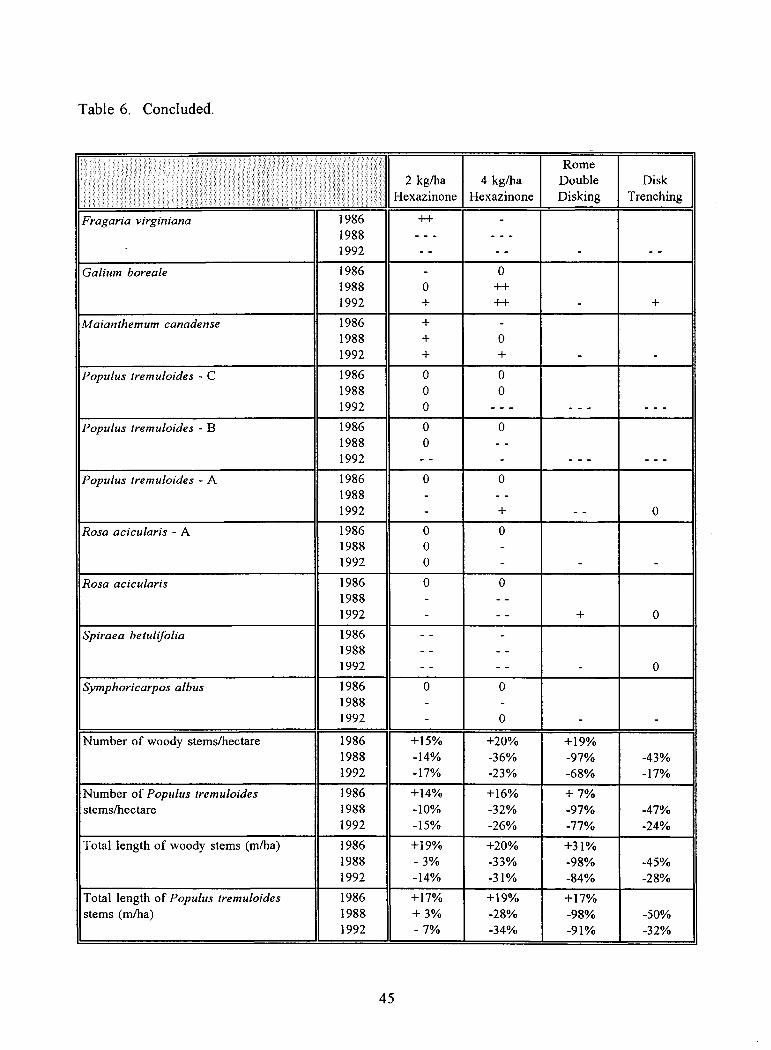
Table 6. Concluded.
2 kg/haHexazinone
4 kg/haHexazinone
RomeDoubleDisking
DiskTrenching
Fragaria virginiana 1986 ++ -
19881992
----- ---
-- - - -
Galium boreale 1986 - 01988 0 ++
1 992 + ++ - +
Maianthemum canadense 1986 + -1988 + 01992 + + - -
Populus tremuloides - C 1986 0 01988 0 01992 0 --- --- - - -
Populus tremuloides - B 1986 0 01988 0 - -1992 -- - --- - - -
Populus tremuloides - A 1986 0 01988 - - -1992 - + - - 0
Rosa acicularis - A 1986 0 01988 0 -1992 0 - - -
Rosa acicularis 1986 0 01988 - - -1992 - - - + 0
Spiraea betulifolia 1986 - - -1988 - - - -1992 - - - - - 0
Symphoricarpos albus 1986 0 01988 - -1992 - 0 - -
Number of woody stems/hectare 1986 +15% +20% +19%1988 -14% -36% -97% -43%1992 -17% -23% -68% -17%
Number of Populus tremuloides 1986 +14% +16% + 7%stems/hectare 1988 -10% -32% -97% -47%
1992 -15% -26% -77% -24%
Total length of woody stems (m/ha) 1986 +19% +20% +31%1988 - 3% -33% -98% -45%1992 -14% -31% -84% -28%
Total length of Populus tremuloides 1986 +17% +19% +17%stems (m/ha) 1988 + 3% -28% -98% -50%
1992 - 7% -34% -91% -32%
45
canadensis were also evident. The rate of species recruitment was greater (2.5x) within the 2kg/ha hexazinone plots in 1992 than the control plots (i.e., a net increase of 12 species asopposed to 5 species between 1986 and 1992).
Treatment with 4 kg of hexazinone per hectare reduced the overall cover of tree and shrubspecies in the C-, B-, and A-strata with the greatest impact on the C-stratum as of 1992 (Table6). Populus tremuloides was the most severely effected species. Most plants in the herb stratumresponded similarly in both hexazinone treatment plots, except Rosa acicularis and Spiraeabetulifolia which had greater cover reduction, and Cornus canadensis and Galium boreale whichshowed greater cover increases in the 4 kg/ha hexazinone treatment. The physiognomy of thevegetation continued to be within the realm of juvenile forest stands, but the C-stratum was moreopen and reduced in overall height compared to the control plots. Woody plants, mostly Populustremuloides, in the 150 to 300 cm height class (B-stratum) formed the dominant component ofthe overstory. Woody plant stem densities were 36 and 23 percent lower than the control plotsin 1988 and 1992, respectively (Table 3 and Figure 5). This treatment appears to have had onlya slight effect on overall plant cover relative to the controls. Species richness was greatest withinthe 4 kg/ha hexazinone plots relative to the control and other treatments in 1992, but its initialvalue was also high, although not higher than the 2 kg/ha hexazinone plot. The net increase inspecies richness was three to four times greater than in the control plots (i.e., net increase of 18versus 5 species between 1986 and 1992).
Rome double disking substantially reduced the overall cover of the C-, B-, and A-strata (mostlyPopulus tremuloides) and resulted in a significant reduction of forbs and an increase in graminoidcover as of 1992 (Photograph 4C). Within the herb layer, percent cover of Aralia nudicaulis,Aster conspicuus, Cornus canadensis, Fragaria virginiana, Galium boreale, Maianthemumcanadense, Spiraea betulifolia, and Symphoricarpos albus decreased, while that of Calamagrostiscanadensis, Epilobium angustifolium, Rosa acicularis and Aster ciliolatus increased. From aphysiognomic perspective, Rome double disking converted forest vegetation into a herbcommunity dominated by native species that are often associated with disturbed sites. Thevertical structure of the vegetation was reduced from at least four strata (i.e., C-, B- A- and herbstratum) to a single layer less than 100 cm tall. Total vegetation cover was also reduced froman expected 160 percent (control plot) to 94 percent. The reduced vascular plant cover allowedan increase in bryophytes that colonize bare ground. Total woody stem densities and total lengthper hectare were 32 and 16 percent, respectively, of the values found within the control plots in1992 (Figure 5). Woody plants occurred primarily in the lower portion of A-stratum and had amedian cover of five percent. The number of plant species in the Rome double disking plots wascomparable to the control plots (Table 5).
Disk trenching had its greatest impact immediately along the trench line where the nativevegetation was destroyed (Photograph 5C). Trenching significantly reduced the cover of the C-and B-strata (mostly Populus tremuloides); decreased the overall cover of the A-stratum,graminoid and forb layers; and resulted in a significantly greater cover of bryophytes than wasassociated with the control plots. Aralia nudicaulis, Aster conspicuus, Cornus canadensis,Epilobium angustifolium, Fragaria virginiana, Maianthemum canadense, and Symphoricarposalbus were among the forb species with reduced cover (Table 6). Most of these species probablyhad cover values comparable to the control plots outside of the trench area. The physiognomy
46
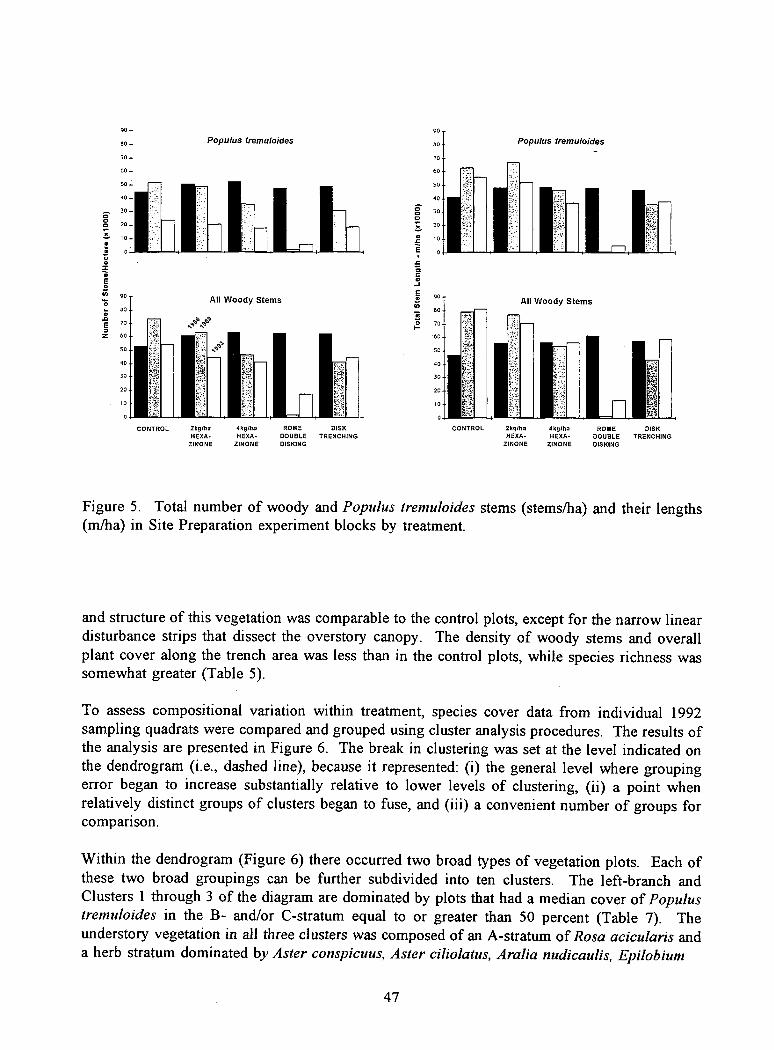
90
80
70
60
50
90
30
20
I 00
All Woody Stems
4kglhaHEXA-
ZINONE
ROME DISKDOUBLE TRENCHINGDISKING
CONTROL 2kg/ a 4kg/haHEXA- HEXA-
ZINONE ZINONE
2kg/haHEXA-
ZINONE
ROME DISKDOUBLE TRENCHINGDISKING
CONTROL
Populus tremuloides Populus tremuloides90 —
80
70
60
50
4 0
30
20
10
E
All Woody Stems
eebZ 60
50
30
20
10
(7) 90
0- 80
70
90
80
70
60
50
90
30OO
0U
0 20
Figure 5. Total number of woody and Populus tremuloides stems (stems/ha) and their lengths(m/ha) in Site Preparation experiment blocks by treatment.
and structure of this vegetation was comparable to the control plots, except for the narrow lineardisturbance strips that dissect the overstory canopy. The density of woody stems and overallplant cover along the trench area was less than in the control plots, while species richness wassomewhat greater (Table 5).
To assess compositional variation within treatment, species cover data from individual 1992sampling quadrats were compared and grouped using cluster analysis procedures. The results ofthe analysis are presented in Figure 6. The break in clustering was set at the level indicated onthe dendrogram (i.e., dashed line), because it represented: (i) the general level where groupingerror began to increase substantially relative to lower levels of clustering, (ii) a point whenrelatively distinct groups of clusters began to fuse, and (iii) a convenient number of groups forcomparison.
Within the dendrogram (Figure 6) there occurred two broad types of vegetation plots. Each ofthese two broad groupings can be further subdivided into ten clusters. The left-branch andClusters 1 through 3 of the diagram are dominated by plots that had a median cover of Populustremuloides in the B- and/or C-stratum equal to or greater than 50 percent (Table 7). Theunderstory vegetation in all three clusters was composed of an A-stratum of Rosa acicularis anda herb stratum dominated by Aster conspicuus, Aster ciliolatus, Aralia nudicaulis, Epilobium
47
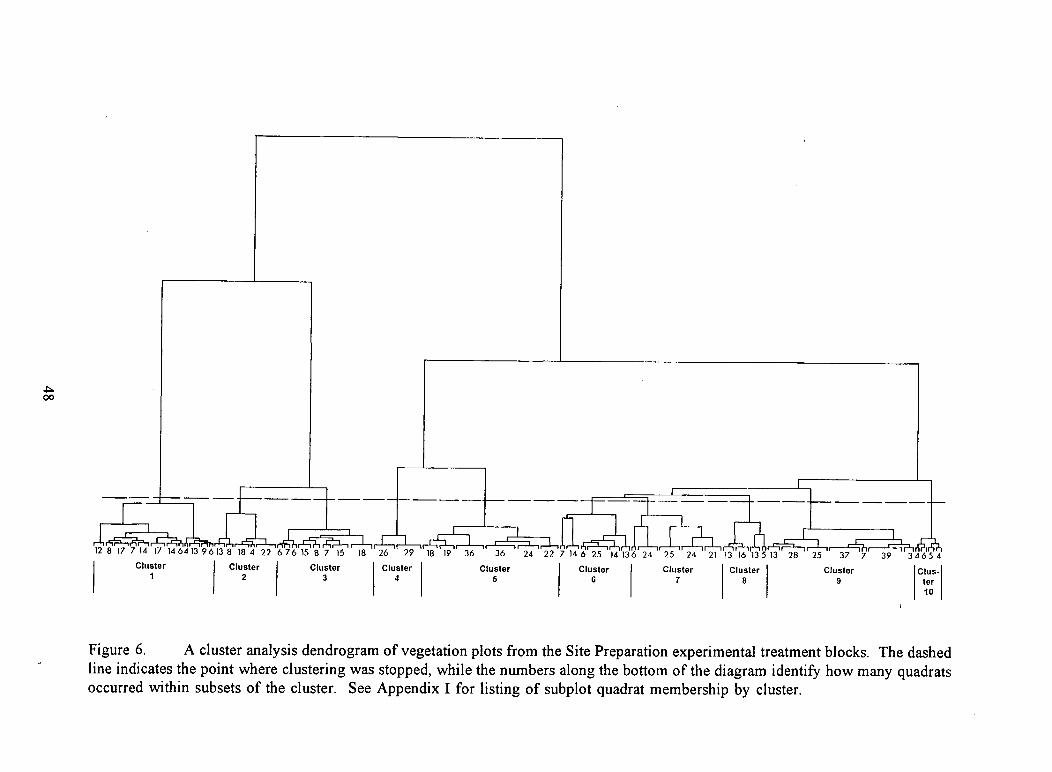
CA-Ahl,7 14 17 14 64 3 9 613 8 18 4 22Cluster Cluster
1 2
r-L-H-1—u---ir--11-1-1r)18 26 29 18 19 36 36 24 22 7 14 6 25 14 13 6 24
Cluster4
AF, rH----1--1,-1--, 6P11424 21 13 16 13 5 13 28 25 37 7 39 3 4 6 5 4
Cluster Cluster Clus-
8 9 ter10
12 8 17 6 7 6 15 8 7 15
Cluster3
425
Cluster5
Cluster6
Cluster7
Figure 6. A cluster analysis dendrogram of vegetation plots from the Site Preparation experimental treatment blocks. The dashedline indicates the point where clustering was stopped, while the numbers along the bottom of the diagram identify how many quadratsoccurred within subsets of the cluster. See Appendix I for listing of subplot quadrat membership by cluster.
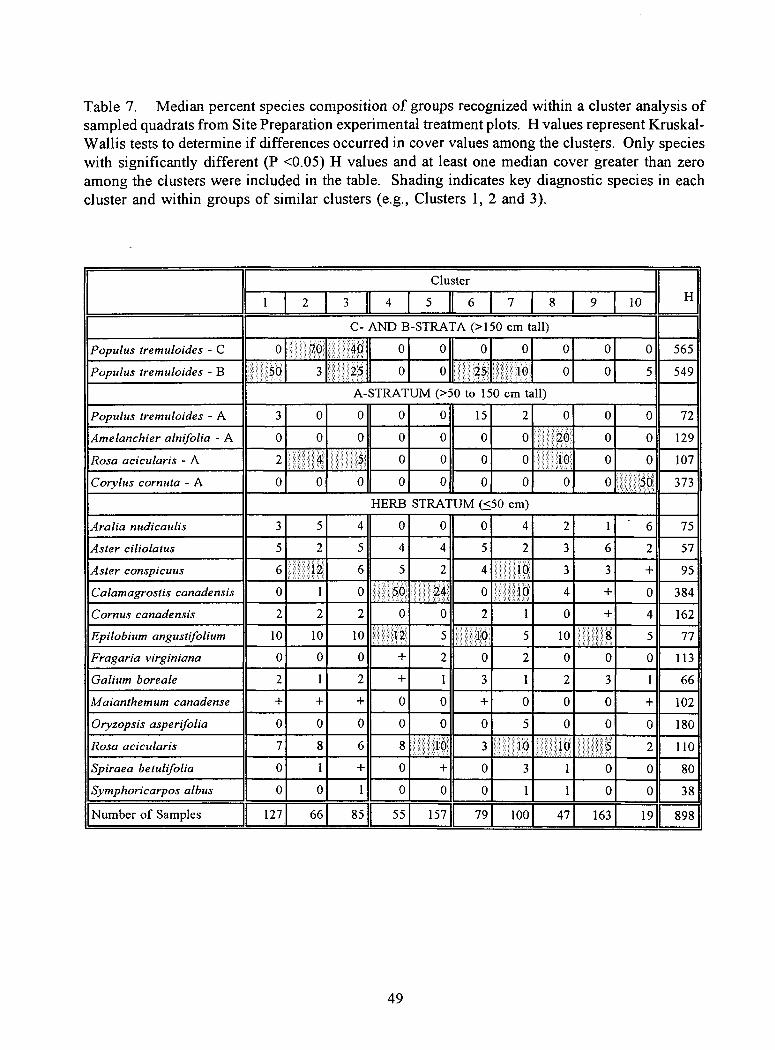
Table 7. Median percent species composition of groups recognized within a cluster analysis ofsampled quadrats from Site Preparation experimental treatment plots. H values represent Kruskal-Wallis tests to determine if differences occurred in cover values among the clusters. Only specieswith significantly different (P <0.05) H values and at least one median cover greater than zeroamong the clusters were included in the table. Shading indicates key diagnostic species in eachcluster and within groups of similar clusters (e.g., Clusters 1, 2 and 3).
ClusterH1 1 2 1 3 D 4 I 5 1[ 6 1 7 1 8 1 9 1 10
C- AND B-STRATA (>150 cm tall)
Populus tremuloides - C 0 70 40 0 0 0 0 0 0 0 565
Populus tremuloides - B 50 3 25 0 0 25 10 0 0 5 549
A-STRATUM (>50 to 150 cm tall)
Populus tremuloides - A 3 0 0 0 0 15 2 0 0 0 72
Amelanchier alnifolia - A 0 0 0 0 0 0 0 20 0 0 129
Rosa acicularis - A 2 4 5 0 0 0 0 10 0 0 107
Corylus cornuta - A 0 0 0 0 0 0 0 0 0 50 373
HERB STRATUM (<50 cm)
Aralia nudicaulis 3 5 4 0 0 0 4 2 1 . 6 75
Aster ciliolatus 5 2 5 4 4 5 2 3 6 2 57
Aster conspicuus 6 12 6 5 2 4 10 3 3 + 95
Calamagrostis canadensis 0 1 0 50 24 0 10 4 + 0 384
Corpus canadensis 2 2 2 0 0 2 1 0 + 4 162
Epilobium angustifolium 10 10 10 12 5 10 5 10 5 77
Fragaria virginiana 0 0 0 + 2 0 2 0 0 0 113
Gahm boreale 2 1 2 + 1 3 1 2 3 1 66
Maianthemum canadense + + + 0 0 + 0 0 0 + 102
Oryzopsis asperifolia 0 0 0 0 0 0 5 0 0 0 180
Rosa acicularis 7 8 6 8 10 3 10 10 2 110
Spiraea betulifolia 0 1 + 0 + 0 3 1 0 0 80
Symphoricarpos albus 0 0 1 0 0 0 1 1 0 0 38
Number of Samples 127 66 851 55 [ 157 79 100 47 163 19 8981
49
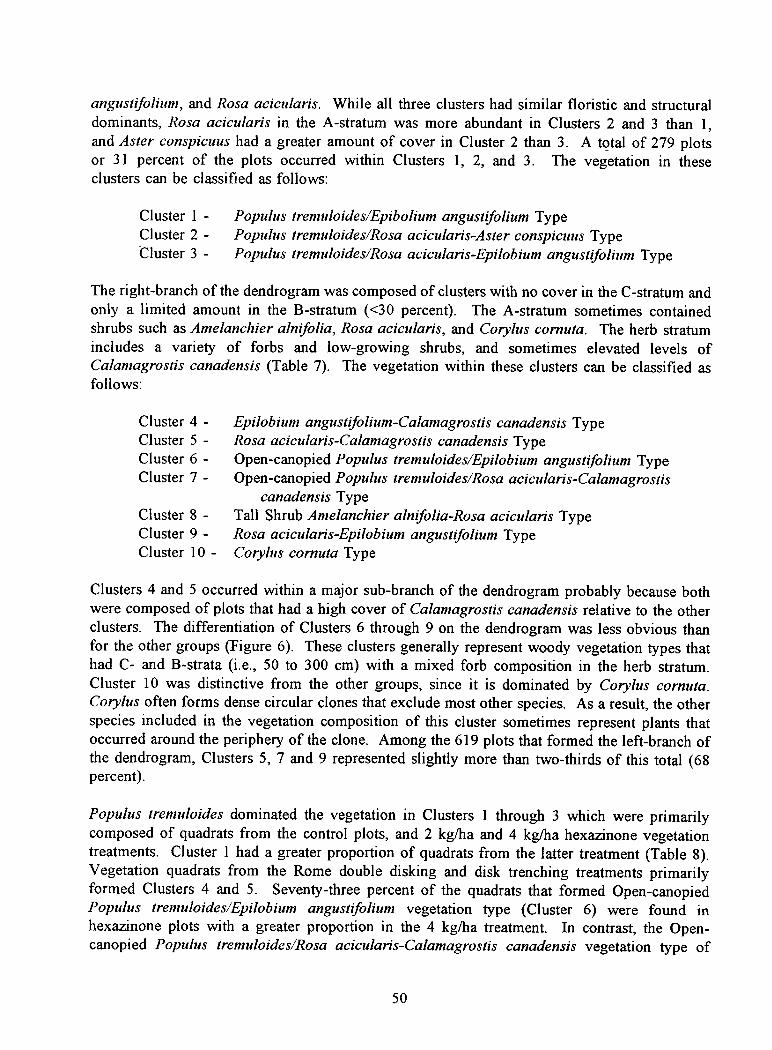
angustifolium, and Rosa acicularis. While all three clusters had similar floristic and structuraldominants, Rosa acicularis in the A-stratum was more abundant in Clusters 2 and 3 than 1,and Aster conspicuus had a greater amount of cover in Cluster 2 than 3. A total of 279 plotsor 31 percent of the plots occurred within Clusters 1, 2, and 3. The vegetation in theseclusters can be classified as follows:
Cluster 1 - Populus tremuloides/Epibollum angustifolium: TypeCluster 2 - Populus tremuloides/Rosa acicularis Aster conspicuus TypeCluster 3 - Populus tremuloides/Rosa acicularis-Epilobium angustifolium Type
The right-branch of the dendrogram was composed of clusters with no cover in the C-stratum andonly a limited amount in the B-stratum (<30 percent). The A-stratum sometimes containedshrubs such as Amelanchier alnifolia, Rosa acicularis, and Corylus cornuta. The herb stratumincludes a variety of forbs and low-growing shrubs, and sometimes elevated levels ofCalamagrostis canadensis (Table 7). The vegetation within these clusters can be classified asfollows:
Cluster 4 - Epilobium angustifolium-Calamagrostis canadensis TypeCluster 5 - Rosa acicularis-Calamagrostis canadensis TypeCluster 6 - Open-canopied Populus tremuloides/Epilobium angustifolium TypeCluster 7 - Open-canopied Populus tremuloides/Rosa acicularis-Calamagrostis
canadensis TypeCluster 8 - Tall Shrub Amelanchier alnifolia-Rosa acicularis TypeCluster 9 - Rosa acicularis-Epilobium angustifolium TypeCluster 10 - Corylus cornuta Type
Clusters 4 and 5 occurred within a major sub-branch of the dendrogram probably because bothwere composed of plots that had a high cover of Calamagrostis canadensis relative to the otherclusters. The differentiation of Clusters 6 through 9 on the dendrogram was less obvious thanfor the other groups (Figure 6). These clusters generally represent woody vegetation types thathad C- and B-strata (i.e., 50 to 300 cm) with a mixed forb composition in the herb stratum.Cluster 10 was distinctive from the other groups, since it is dominated by Corylus cornuta.Corylus often forms dense circular clones that exclude most other species. As a result, the otherspecies included in the vegetation composition of this cluster sometimes represent plants thatoccurred around the periphery of the clone. Among the 619 plots that formed the left-branch ofthe dendrogram, Clusters 5, 7 and 9 represented slightly more than two-thirds of this total (68percent).
Populus tremuloides dominated the vegetation in Clusters 1 through 3 which were primarilycomposed of quadrats from the control plots, and 2 kg/ha and 4 kg/ha hexazinone vegetationtreatments. Cluster 1 had a greater proportion of quadrats from the latter treatment (Table 8).Vegetation quadrats from the Rome double disking and disk trenching treatments primarilyformed Clusters 4 and 5. Seventy-three percent of the quadrats that formed Open-canopiedPopulus tremuloides/Epilobium angustifolium vegetation type (Cluster 6) were found inhexazinone plots with a greater proportion in the 4 kg/ha treatment. In contrast, the Open-canopied Populus tremuloides/Rosa acicularis-Calamagrostis canadensis vegetation type of
50
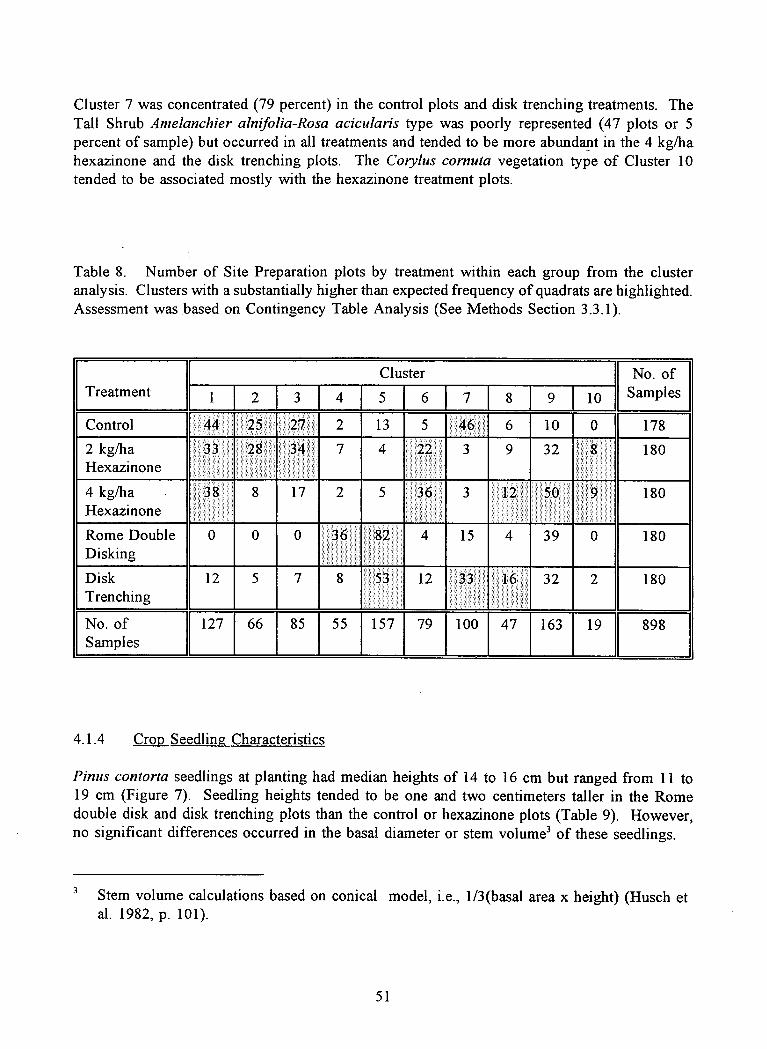
TreatmentCluster
1 2 3 4 5 6 7 9
Control 44 25 27 2 13 5 46 6 10
2 kg/haHexazinone
33 28 34 7 4 22 3 9 32
4 kg/haHexazinone
38 8 17 2 5 36 3 12 50
Rome DoubleDisking
0 0 0 36 82 4 15 4 39
DiskTrenching
12 5 7 8 53 12 33 16 32
No. ofSamples
127 66 85 55 157 79 100 47 163
No. of
10 Samples
178
0
2
19
180
180
180
180
898
Cluster 7 was concentrated (79 percent) in the control plots and disk trenching treatments. TheTall Shrub Arnelanchier alnifolia-Rosa acicularis type was poorly represented (47 plots or 5percent of sample) but occurred in all treatments and tended to be more abundant in the 4 kg/hahexazinone and the disk trenching plots. The Cotylus cornuta vegetation type of Cluster 10tended to be associated mostly with the hexazinone treatment plots.
Table 8. Number of Site Preparation plots by treatment within each group from the clusteranalysis. Clusters with a substantially higher than expected frequency of quadrats are highlighted.Assessment was based on Contingency Table Analysis (See Methods Section 3.3.1).
4.1.4 Crop Seedling Characteristics
Pinus contorta seedlings at planting had median heights of 14 to 16 cm but ranged from 11 to19 cm (Figure 7). Seedling heights tended to be one and two centimeters taller in the Romedouble disk and disk trenching plots than the control or hexazinone plots (Table 9). However,no significant differences occurred in the basal diameter or stem volume 3 of these seedlings.
3 Stem volume calculations based on conical model, i.e., 1/3(basal area x height) (Husch etal. 1982, p. 101).
51
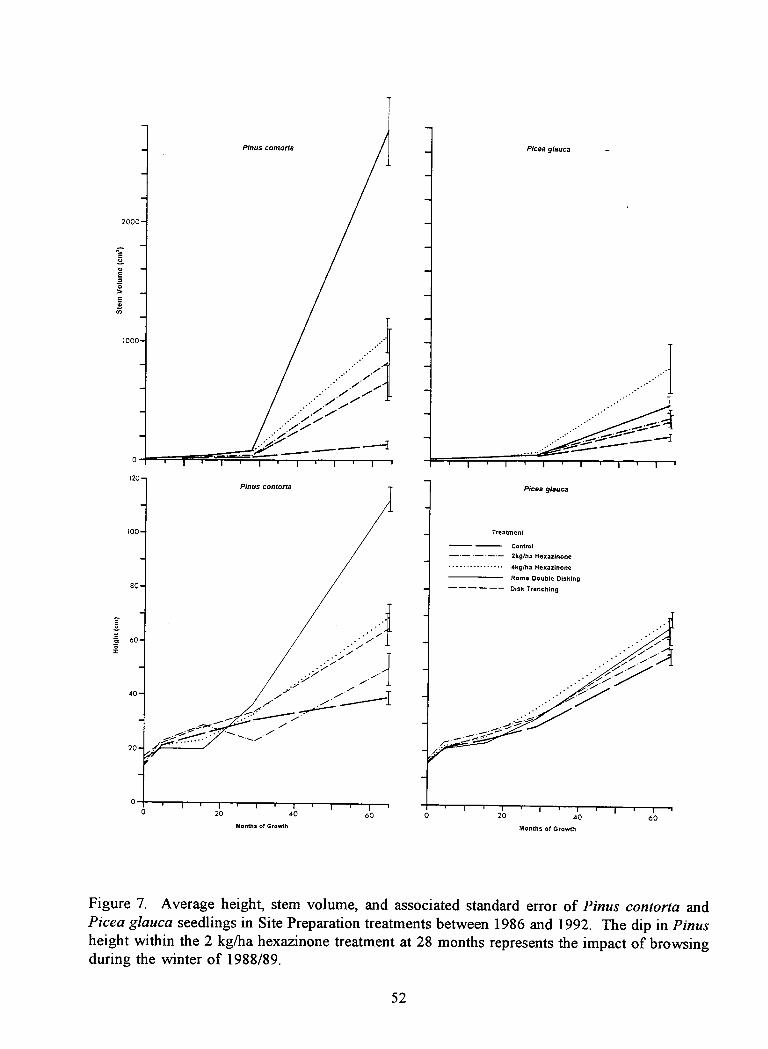
Pinus contorta Picea glauca
2000
E
EE0Ern
1000
.• •
0
Pinus contorta Picea glauca
Treatment
Control— 2kg/ha Hexaxinone
4kg/ha HexazinoneRome Double DiskingDisk Trenching
. ••
-
-
n-•"-
.0/
20 40
Months of GrowthMonths of Growth60
Figure 7. Average height, stem volume, and associated standard error of Pinus contorta andPicea glauca seedlings in Site Preparation treatments between 1986 and 1992. The dip in Pinusheight within the 2 kg/ha hexazinone treatment at 28 months represents the impact of browsingduring the winter of 1988/89.
52
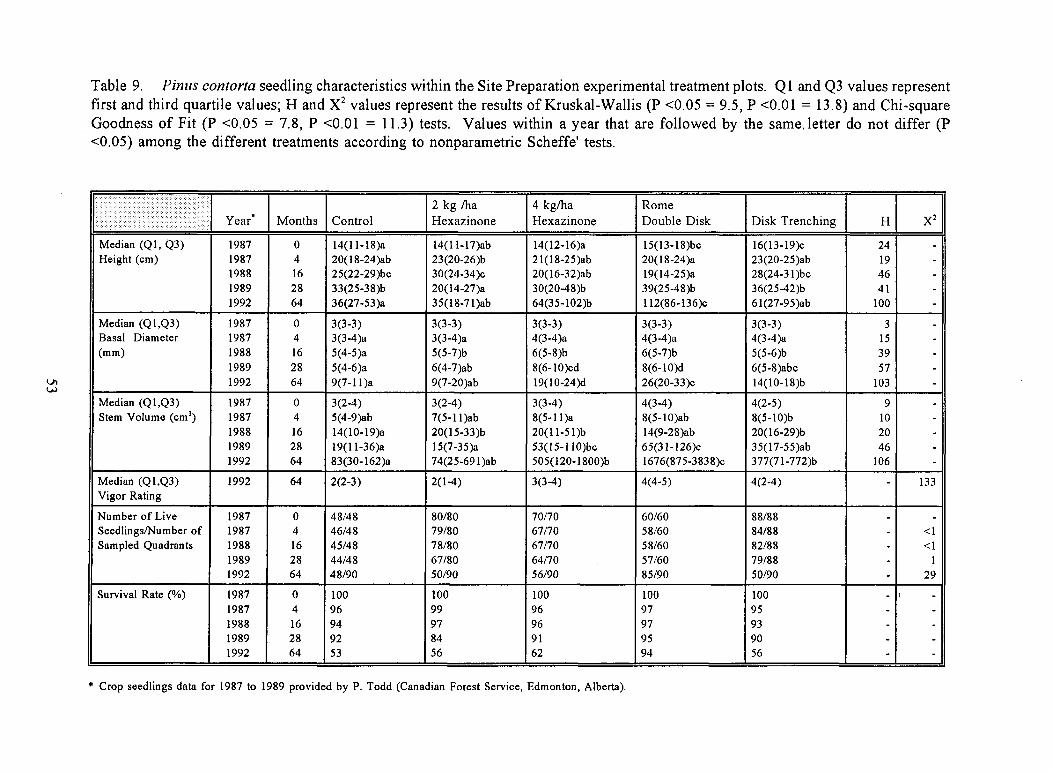
Table 9. Pinus contorta seedling characteristics within the Site Preparation experimental treatment plots. Q1 and Q3 values representfirst and third quartile values; H and X 2 values represent the results of Kruskal-Wallis (P <0.05 = 9.5, P <0.01 = 13.8) and Chi-squareGoodness of Fit (P <0.05 = 7.8, P <0.01 = 11.3) tests. Values within a year that are followed by the same, letter do not differ (P<0.05) among the different treatments according to nonparametric Scheffe' tests.
Year Months Control2 kg /haHexazinone
4 kg/haHexazinone
RomeDouble Disk Disk Trenching H X2
Median (Q1, Q3) 1987 0 14(11-18)a 14(11-17)ab 14(12-16)a 15(13-18)bc 16(13-19)c 24 -Height (cm) 1987 4 20(18-24)ab 23(20-26)b 21(18-25)ab 20(18-24)a 23(20-25)ab 19 -
1988 16 25(22-29)bc 30(24-34)c 20(16-32)ab 19(14-25)a 28(24-31)bc 46 -1989 28 33(25-38)b 20(14-27)a 30(20-48)b 39(25-48)b 36(25-42)b 41 -1992 64 36(27-53)a 35(18-71)ab 64(35-102)b 112(86-136)c 61(27-95)ab 100 -
Median (Q1,Q3) 1987 0 3(3-3) 3(3-3) 3(3-3) 3(3-3) 3(3-3) 3 -Basal Diameter 1987 4 3(3-4)a 3(3-4)a 4(3-4)a 4(3-4)a 4(3-4)a 15 -(mm) 1988 16 5(4-5)a 5(5-7)b 6(5-8)b 6(5-7)b 5(5-6)b 39 -
1989 28 5(4-6)a 6(4-7)ab 8(6-10)cd 8(6-10)d 6(5-8)abc 57 -1992 64 9(7-11)a 9(7-20)ab 19(10-24)d 26(20-33)c 14(10-18)b 103 -
Median (Q1,Q3) 1987 0 3(2-4) 3(2-4) 3(3-4) 4(3-4) 4(2-5) 9 -Stem Volume (cm 3) 1987 4 5(4-9)ab 7(5-11)ab 8(5-11)a 8(5-10)ab 8(5-10)b 10 -
1988 16 14(10-19)a 20(15-33)b 20(11-51)b 14(9-28)ab 20(16-29)b 20 -1989 28 19(11-36)a 15(7-35)a 53(15-110)bc 65(31-126)c 35(17-55)ab 46 -1992 64 83(30-162)a 74(25-691)ab 505(120-1800)b 1676(875-3838)c 377(71-772)6 106 -
Median (Q1,Q3) 1992 64 2(2-3) 2(1-4) 3(3-4) 4(4-5) 4(2-4) - 133Vigor Rating
Number of Live 1987 0 48/48 80/80 70/70 60/60 88/88 - -Seedlings/Number of 1987 4 46/48 79/80 67/70 58/60 84/88 - <1Sampled Quadrants 1988 16 45/48 78/80 67/70 58/60 82/88 - <1
1989 28 44/48 67/80 64/70 57/60 79/88 - 11992 64 48/90 50/90 56/90 85/90 50/90 - 29
Survival Rate (%) 1987 0 100 100 100 100 100 - i -1987 4 96 99 96 97 95 - -1988 16 94 97 96 97 93 - -1989 28 92 84 91 95 90 - -1992 64 53 56 62 94 56 - -
* Crop seedlings data for 1987 to 1989 provided by P. Todd (Canadian Forest Service, Edmonton, Alberta).
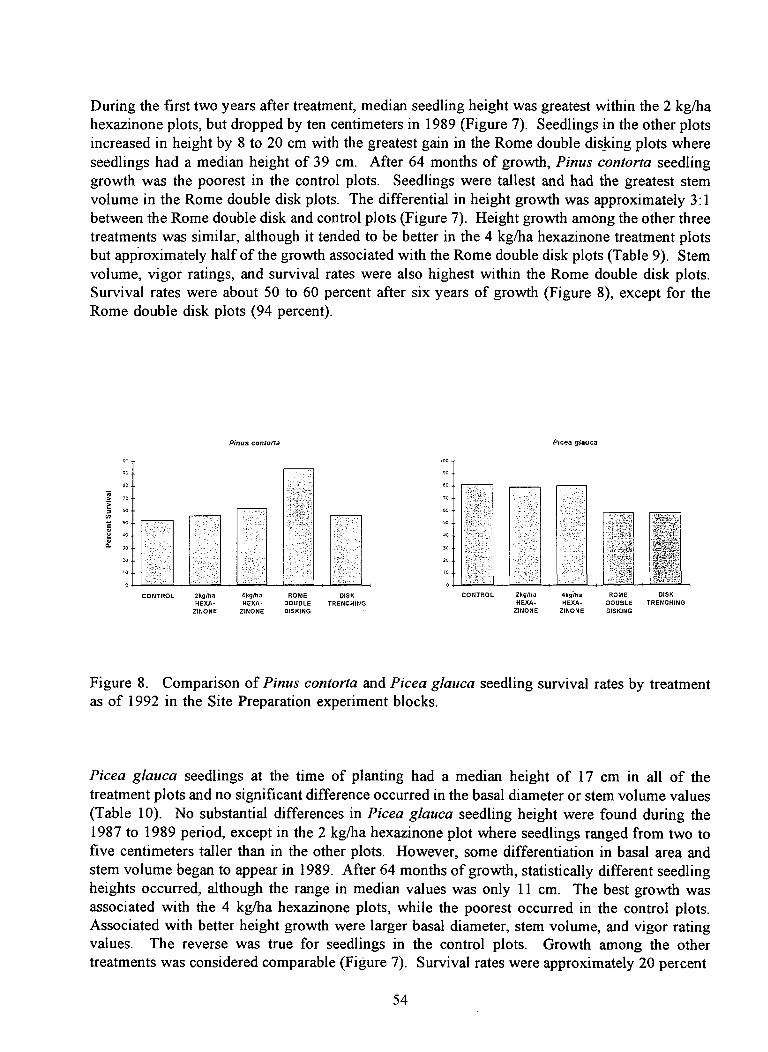
During the first two years after treatment, median seedling height was greatest within the 2 kg/hahexazinone plots, but dropped by ten centimeters in 1989 (Figure 7). Seedlings in the other plotsincreased in height by 8 to 20 cm with the greatest gain in the Rome double disking plots whereseedlings had a median height of 39 cm. After 64 months of growth, Pinus contorta seedlinggrowth was the poorest in the control plots. Seedlings were tallest and had the greatest stemvolume in the Rome double disk plots. The differential in height growth was approximately 3:1between the Rome double disk and control plots (Figure 7). Height growth among the other threetreatments was similar, although it tended to be better in the 4 kg/ha hexazinone treatment plotsbut app-roximately half of the growth associated with the Rome double disk plots (Table 9). Stemvolume, vigor ratings, and survival rates were also highest within the Rome double disk plots.Survival rates were about 50 to 60 percent after six years of growth (Figure 8), except for theRome double disk plots (94 percent).
Pinus contorts
Picea glauca
100 100
90 90
BO 00
70
60 50
da.50 50
30 50
20 20
10 10
0 0
CONTROL 24/ha 4kg/ha ROME DISK CONTROL 21,g/ha 4kg/ha ROME DISK
HEXA- HEXA- DOUBLE TRENCHING HEXA- HEXA- DOUBLE TRENCHING
ZINONE
ZINONE DISKING ZINONE ZINONE DISKING
Figure 8. Comparison of Pinus contorta and Picea glauca seedling survival rates by treatmentas of 1992 in the Site Preparation experiment blocks.
Picea glauca seedlings at the time of planting had a median height of 17 cm in all of thetreatment plots and no significant difference occurred in the basal diameter or stem volume values(Table 10). No substantial differences in Picea glauca seedling height were found during the1987 to 1989 period, except in the 2 kg/ha hexazinone plot where seedlings ranged from two tofive centimeters taller than in the other plots. However, some differentiation in basal area andstem volume began to appear in 1989. After 64 months of growth, statistically different seedlingheights occurred, although the range in median values was only 11 cm. The best growth wasassociated with the 4 kg/ha hexazinone plots, while the poorest occurred in the control plots.Associated with better height growth were larger basal diameter, stem volume, and vigor ratingvalues. The reverse was true for seedlings in the control plots. Growth among the othertreatments was considered comparable (Figure 7). Survival rates were approximately 20 percent
54
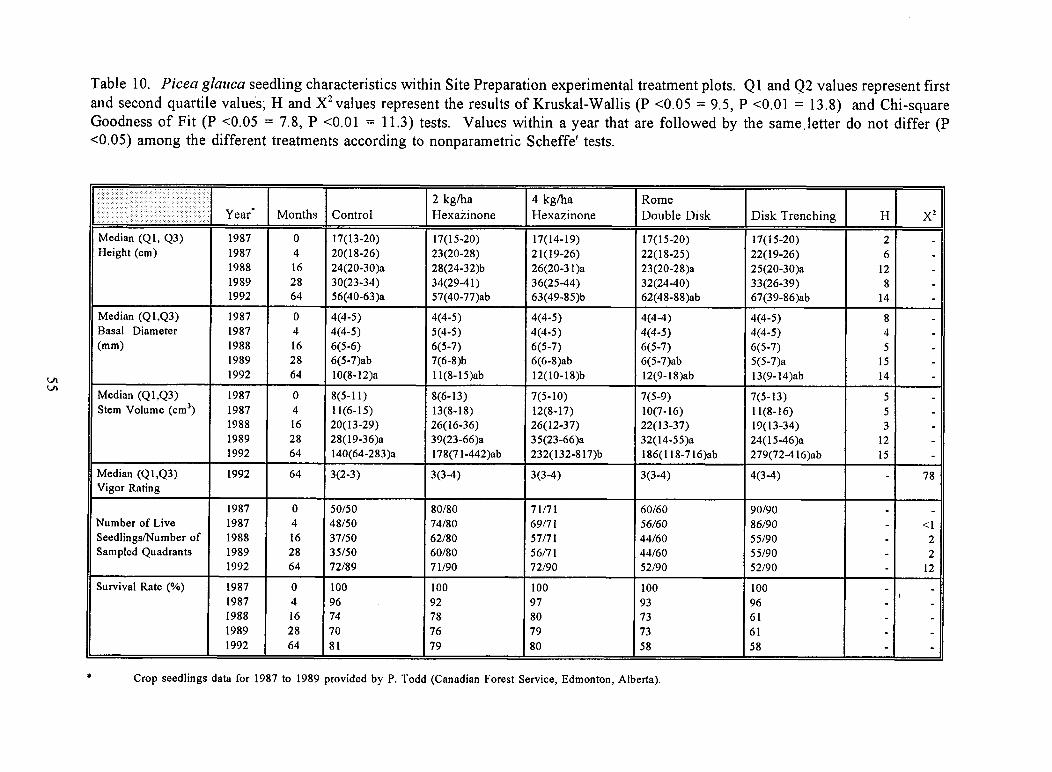
Table 10. Picea glauca seedling characteristics within Site Preparation experimental treatment plots. Q1 and Q2 values represent firstand second quartile values; H and X 2 values represent the results of Kruskal-Wallis (P <0.05 = 9.5, P <0.01 = 13.8) and Chi-squareGoodness of Fit (P <0.05 = 7.8, P <0.01 = 11.3) tests. Values within a year that are followed by the same,letter do not differ (P<0.05) among the different treatments according to nonparametric Scheffe' tests.
Year Months Control2 kg/haHexazinone
4 kg/haHexazinone
RomeDouble Disk Disk Trenching H X2
Median (Q1, Q3) 1987 0 17(13-20) 17(15-20) 17(14-19) 17(15-20) 17(15-20) 2 -Height (cm) 1987 4 20(18-26) 23(20-28) 21(19-26) 22(18-25) 22(19-26) 6 -
1988 16 24(20-30)a 28(24-32)b 26(20-31)a 23(20-28)a 25(20-30)a 12 -1989 28 30(23-34) 34(29-41) 36(25-44) 32(24-40) 33(26-39) 8 -1992 64 56(40-63)a 57(40-77)ab 63(49-85)b 62(48-88)ab 67(39-86)ab 14 -
Median (Q1,Q3) 1987 0 4(4-5) 4(4-5) 4(4-5) 4(4-4) 4(4-5) 8 -Basal Diameter 1987 4 4(4-5) 5(4-5) 4(4-5) 4(4-5) 4(4-5) 4 -(mm) 1988 16 6(5-6) 6(5-7) 6(5-7) 6(5-7) 6(5-7) 5 -
1989 28 6(5-7)ab 7(6-8)b 6(6-8)ab 6(5-7)ab 5(5-7)a 15 -1992 64 10(8-12)a 11(8-15)ab 12(10-18)b 12(9-18)ab 13(9-14)ab 14 -
Median (Q1,Q3) 1987 0 8(5-11) 8(6-13) 7(5-10) 7(5-9) 7(5-13) 5 -Stem Volume (cm 3) 1987 4 11(6-15) 13(8-18) 12(8-17) 10(7-16) 11(8-16) 5 -
1988 16 20(13-29) 26(16-36) 26(12-37) 22(13-37) 19(13-34) 3 -1989 28 28(19-36)a 39(23-66)a 35(23-66)a 32(14-55)a 24(15-46)a 12 -1992 64 140(64-283)a 178(71-442)ab 232(132-817)b 186(118-716)ab 279(72-416)ab 15 -
Median (Q1,Q3) 1992 64 3(2-3) 3(3-4) 3(3-4) 3(3-4) 4(3-4) - 78Vigor Rating
1987 0 50/50 80/80 71/71 60/60 90/90 - -Number of Live 1987 4 48/50 74/80 69/71 56/60 86/90 - <1Seedlings/Number of 1988 16 37/50 62/80 57/71 44/60 55/90 - 2Sampled Quadrants 1989 28 35/50 60/80 56/71 44/60 55/90 - 2
1992 64 72/89 71/90 72/90 52/90 52/90 - 12
Survival Rate (%) 1987 0 100 100 100 100 100 -1987 4 96 92 97 93 96 -
I --
1988 16 74 78 80 73 61 - -1989 28 70 76 79 73 61 - -1992 64 81 79 80 58 58 - -
Crop seedlings data for 1987 to 1989 provided by P. Todd (Canadian Forest Service, Edmonton, Alberta).
higher in the control and hexazinone plots than the Rome double disk and disk trenching plots(Figure 8). These differences were found to be statistically significant (P <0.01) based on a Chi-square Goodness of Fit test (Table 10).
An analysis of percent cover values resulted in the identification of five growth-forms and 26taxa which differed according to relative Pinus contorta seedling heights (Table 11). Decreasedvascular plant cover was associated with greater height growth, particularly in the C- and B-strata, while the reverse was true for bryophytes. Eleven vascular taxa showed a decrease incover within increased seedling height, five increased in abundance, and the remaining ten speciesdid not have a linear direction of change. Only Aster conspicuus, Populus tremuloides- C, andPopulus tremuloides - B were associated with substantial differences in percent cover with allbeing negatively correlated with Picea glauca height.
A similar comparison using Picea glauca resulted in the recognition of two growth-forms andten taxa that had different cover values when stratified according to relative seedling heightcategories (Table 12). Both growth-forms and four species showed a trend of decreasedabundance with increased seedling height, while Taraxacum ceratophorum was the only speciesto show an increase in abundance. The strongest trends of difference were associated with thetwo Populus tremuloides taxa which are also included in the overall cover of the C- and B-stratum growth-form categories.
4.2 Conifer Release Experiments
4.2.1 Post-treatment Vegetation
4.2.1.1 Control Plots
When the control plots were established in 1986, the vegetation ranged in height fromapproximately 110 to 190 cm tall (Photograph 6A). Populus tremuloides was the dominantwoody plant (i.e., 69 percent of all woody stems), although Rosa acicularis and Salix spp. werealso abundant in the lower portion of the A-stratum (Table 13). The height of the overstorycanopy increased to approximately 230 cm by 1988. In 1993, the vegetation within the controlplots was dominated by five metre tall Populus tremuloides with a median canopy cover ofapproximately 60 percent (Table 14 and Photograph 6B) and a collective cover of all species of194 percent (Table 15). The total number of woody stems per hectare in the control plots was51,903 in 1986. This total decreased at a rate of approximately 1.0 to 1.5 percent per year upto 1993. The largest decrease in total density was due to a 50 percent reduction in the densityof Populus tremuloides from 35,573 stem/ha in 1986 to 17,666 stem/ha in 1994. In contrast, thetotal amount of all woody stems increased from 58,394 m/ha in 1986 to 98,200 m/ha in 1993,or a net increase of 68 percent.
In 1993 an A-stratum dominated by Rosa acicularis with a median foliar cover of eight percentoccurred below the C-stratum. Although Rosa acicularis was the most abundant, Rosa and Salixspp. represented more than 60 percent of the total number of stems that occurred within the A-
56
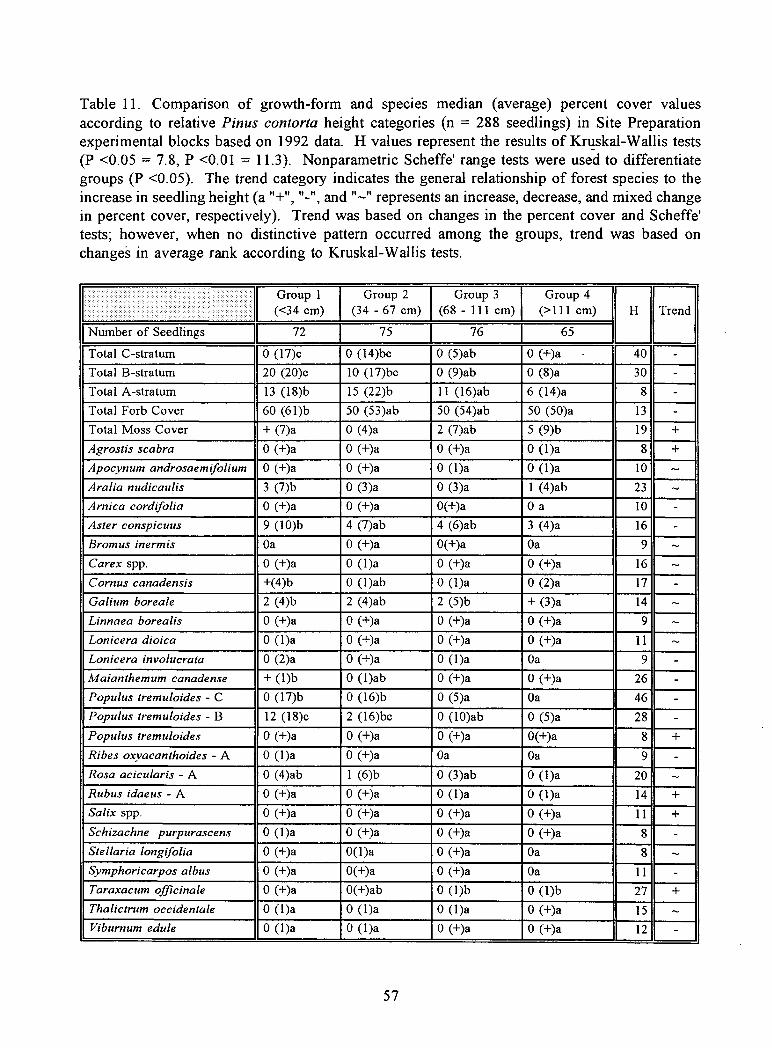
Table 11. Comparison of growth-form and species median (average) percent cover valuesaccording to relative Pinus contorta height categories (n = 288 seedlings) in Site Preparationexperimental blocks based on 1992 data. H values represent the results of Kruskal-Wallis tests(P <0.05 = 7.8, P <0.01 = 11.3). Nonparametric Scheffe' range tests were used to differentiategroups (P <0.05). The trend category indicates the general relationship of forest species to theincrease in seedling height (a "+", " 2 , and "--" represents an increase, decrease, and mixed changein percent cover, respectively). Trend was based on changes in the percent cover and Scheffe'tests; however, when no distinctive pattern occurred among the groups, trend was based onchanges in average rank according to Kruskal-Wallis tests.
Group 1(<34 cm)
Group 2(34 - 67 cm)
Group 3(68 - 111 cm)
Group 4(>111 cm) H Trend
Number of Seedlings 72 75 76 65
Total C-stratum 0 (17)c 0 (14)bc 0 (5)ab 0 (+)a • 40 -Total B-stratum 20 (20)c 10 (17)bc 0 (9)ab 0 (8)a 30 -Total A-stratum 13 (18)b 15 (22)b 11 (16)ab 6 (14)a 8 -Total Forb Cover 60 (61)b 50 (53)ab 50 (54)ab 50 (50)a 13 -Total Moss Cover + (7)a 0 (4)a 2 (7)ab 5 (9)b 19 +Agrostis scabra 0 (+)a 0 (+)a 0 (+)a 0 (1)a 8 +Apocynum androsaemifolium 0 (+)a 0 (+)a 0 (1)a 0 (1)a 10Aralia nudicaulis 3 (7)b 0 (3)a 0 (3)a 1 (4)ab 23 —
Arnica cordifolia 0 (+)a 0 (+)a 0(+)a 0 a 10 -
Aster conspicuus 9 (10)b 4 (7)ab 4 (6)ab 3 (4)a 16 -
Bromus inermis Oa 0 (+)a 0(+)a Oa 9Carex spp. 0 (+)a 0 (1)a 0 (+)a 0 (+)a 16 —
Cornus canadensis +(4)b 0 (1)ab 0 (1)a 0 (2)a 17 -
Galium boreale 2 (4)b 2 (4)ab 2 (5)b + (3)a 14 —
Linnaea borealis 0 (+)a 0 (+)a 0 (+)a 0 (+)a 9Lonicera dioica 0 (1)a 0 (+)a 0 (+)a 0 (+)a 11Lonicera involucrata 0 (2)a 0 (+)a 0 (1)a Oa 9 -Maianthemum canadense + (1)b 0 (1)ab 0 (+)a 0 (+)a 26 -Populus tremuloides - C 0 (17)b 0 (16)b 0 (5)a Oa 46 -Popullts tremuloides - B 12 (18)c 2 (16)bc 0 (10)ab 0 (5)a 28 -
Populus tremuloides 0 (+)a 0 (+)a 0 (+)a 0(+)a 8 +Ribes oxyacanthoides - A 0 (1)a 0 (+)a Oa Oa 9 -Rosa acicularis - A 0 (4)ab 1 (6)b 0 (3)ab 0 (1)a 20 —Rubus idaeus - A 0 (+)a 0 (+)a 0 (1)a 0 (1)a 14 +Salix spp. 0 (+)a 0 (+)a 0 (+)a 0 (+)a 11 +Schizachne purpurascens 0 (1)a 0 (+)a 0 (+)a 0 (+)a 8 -Stellaria longifolia 0 (+)a 0(1)a 0 (+)a Oa 8Symphoricarpos albus 0 (+)a 0(+)a 0 (+)a Oa 11 -Taraxacum officinale 0 (+)a 0(+)ab 0 (1)b 0 (1)b 27 +Thalictrum occidentale 0 (1)a 0 (1)a 0 (1)a 0 (+)a 15Viburnum edule 0 (1)a 0 (1)a 0 (+)a 0 (+)a 12 -
57
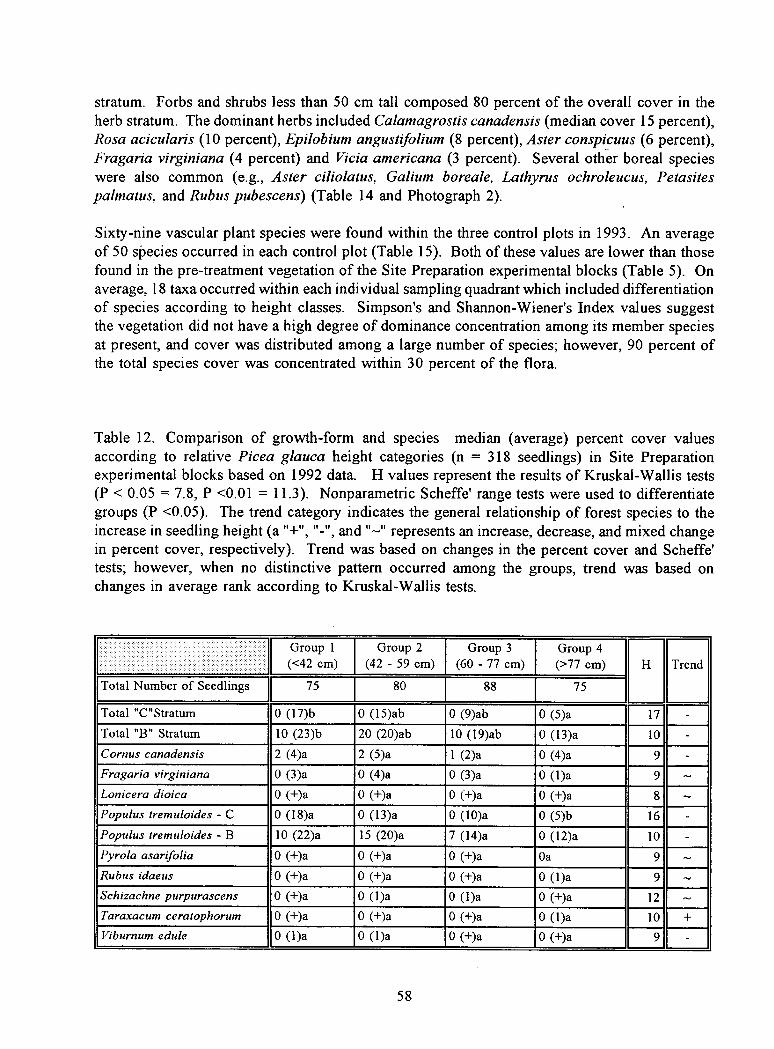
stratum. Forbs and shrubs less than 50 cm tall composed 80 percent of the overall cover in theherb stratum. The dominant herbs included Calarnagrostis canadensis (median cover 15 percent),Rosa acicularis (10 percent), Epilobium angustifolium (8 percent), Aster conspicuus (6 percent),Fragaria virginiana (4 percent) and Vicia americana (3 percent). Several other boreal specieswere also common (e.g., Aster ciliolatus, Galium boreale, Lathyrus ochroleucus, Petasitespalmatus, and Rubus pubescens) (Table 14 and Photograph 2).
Sixty-nine vascular plant species were found within the three control plots in 1993. An averageof 50 species occurred in each control plot (Table 15). Both of these values are lower than thosefound in the pre-treatment vegetation of the Site Preparation experimental blocks (Table 5). Onaverage, 18 taxa occurred within each individual sampling quadrant which included differentiationof species according to height classes. Simpson's and Shannon-Wiener's Index values suggestthe vegetation did not have a high degree of dominance concentration among its member speciesat present, and cover was distributed among a large number of species; however, 90 percent ofthe total species cover was concentrated within 30 percent of the flora.
Table 12. Comparison of growth-form and species median (average) percent cover valuesaccording to relative Picea glauca height categories (n = 318 seedlings) in Site Preparationexperimental blocks based on 1992 data. H values represent the results of Kruskal-Wallis tests(P < 0.05 = 7.8, P <0.01 = 11.3). Nonparametric Scheffe' range tests were used to differentiategroups (P <0.05). The trend category indicates the general relationship of forest species to theincrease in seedling height (a "+", "-", and "—" represents an increase, decrease, and mixed changein percent cover, respectively). Trend was based on changes in the percent cover and Scheffe'tests; however, when no distinctive pattern occurred among the groups, trend was based onchanges in average rank according to Kruskal-Wallis tests.
Group 1(<42 cm)
Group 2(42 - 59 cm)
Group 3(60 - 77 cm)
Group 4(>77 cm) H Trend
Total Number of Seedlings 75 80 88 75
Total "C"Stratum 0 (17)b 0 (15)ab 0 (9)ab 0 (5)a 17 -
Total "B" Stratum 10 (23)b 20 (20)ab 10 (19)ab 0 (13)a 10 -
Cornus canadensis 2 (4)a 2 (5)a 1 (2)a 0 (4)a 9 -Fragaria virginiana 0 (3)a 0 (4)a 0 (3)a 0 (1)a 9 —
Lonicera dioica 0 (+)a 0 (+)a 0 (+)a 0 (+)a 8 —Populus tremuloides - C 0 (18)a 0 (13)a 0 (10)a 0 (5)b 16 -
Populus tremuloides - B 10 (22)a 15 (20)a 7 (14)a 0 (12)a 10 -
Pyrola asarifolia 0 (+)a 0 (+)a 0 (+)a Oa 9Rubus idaeus 0 (+)a 0 (+)a 0 (+)a 0 (1)a 9Schizachne purpurascens 0 (+)a 0 (1)a 0 (1)a 0 (+)a 12 —Taraxacum ceratophorum 0 (+)a 0 (+)a 0 (+)a 0 (1)a 10 +Viburnum edule 0 (1)a 0 (1)a 0 (+)a 0 (+)a 9 -
58
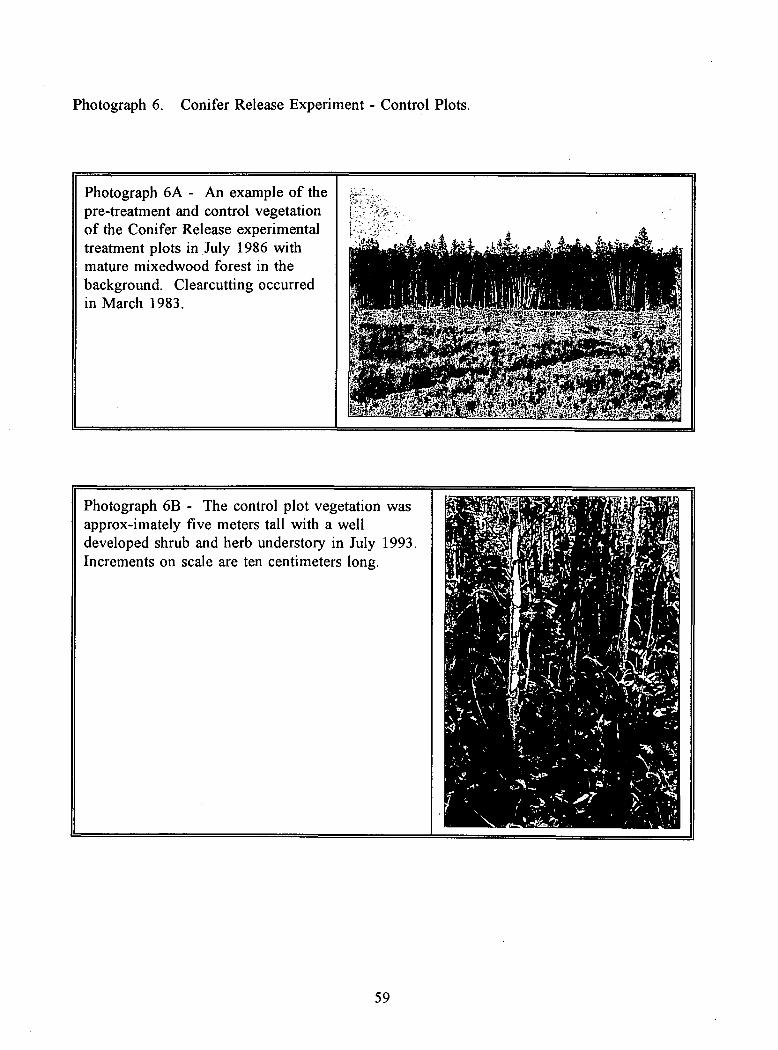
Photograph 6B - The control plot vegetation wasapprox-imately five meters tall with a welldeveloped shrub and herb understory in July 1993.Increments on scale are ten centimeters long.
Photograph 6A - An example of thepre-treatment and control vegetationof the Conifer Release experimentaltreatment plots in July 1986 withmature mixedwood forest in thebackground. Clearcutting occurredin March 1983.
Photograph 6. Conifer Release Experiment - Control Plots.
59
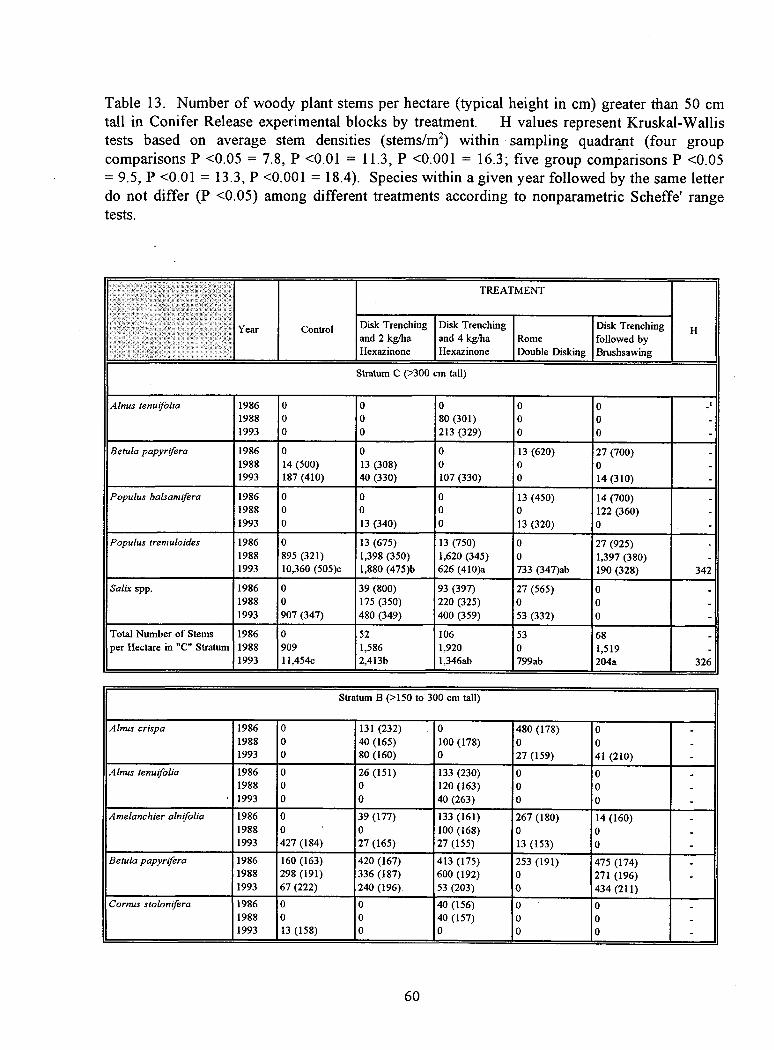
Table 13. Number of woody plant stems per hectare (typical height in cm) greater than 50 cmtall in Conifer Release experimental blocks by treatment. H values represent Kruskal-Wallistests based on average stem densities (stems/m 2) within sampling quadrant (four groupcomparisons P <0.05 = 7.8, P <0.01 = 11.3, P <0.001 = 16.3; five group comparisons P <0.05= 9.5, P <0.01 = 13.3, P <0.001 = 18.4). Species within a given year followed by the same letterdo not differ (P <0.05) among different treatments according to nonparametric Scheffe' rangetests.
Year Control
TREATMENT
HDisk Trenchingand 2 kg/haHexazinone
Disk Trenchingand 4 kg/haHexazinone
RomeDouble Disking
Disk Trenchingfollowed byBrushsawing
Stratum C (>300 cm tall)
Alnus tenuifi:tha 1986 0 0 0 0 0 _i1988 0 0 80 (301) 0 0 -1993 0 0 213 (329) 0 0 -
Betula papyrifera 1986 0 0 0 13 (620) 27 (700) -1988 14 (500) 13 (308) 0 0 0 -1993 187 (410) 40 (330) 107 (330) 0 14 (310) -
Populus balsanufera 1986 0 0 0 13 (450) 14 (700) -1988 0 0 0 0 122 (360) -1993 0 13 (340) 0 13 (320) 0 -
Populus tremuloides 1986 0 13 (675) 13 (750) 0 27 (925) -1988 895 (321) 1,398 (350) 1,620 (345) 0 1,397 (380) -1993 10,360 (505)c 1,880 (475)b 626 (410)a 733 (347)ab 190 (328) 342
Salix spp. 1986 0 39 (800) 93 (397) 27 (565) 0 -1988 0 175 (350) 220 (325) 0 0 -1993 907 (347) 480 (349) 400 (359) 53 (332) 0 -
Total Number of Stems 1986 0 52 106 53 68 -per Hectare in "C" Stratum 1988 909 1,586 1,920 0 1,519 -
1993 11,454c 2,413b 1,346ab 799ab 204a 326
Stratum B (>150 to 300 cm tall)
Alnus crispa 1986 0 131 (232) 0 480 (178) 0 -1988 0 40 (165) 100 (178) 0 0 -1993 0 80 (160) 0 27 (159) 41 (210) -
Alnus tenuifolia 1986 0 26 (151) 133 (230) 0 0 -1988 0 0 120 (163) 0 0 -1993 0 0 40 (263) 0 0 -
Amelanchier alnifolia 19861988
0.0
39 (177)0
133 (161)100 (168)
267 (180)0
14 (160)0
--
1993 427 (184) 27 (165) 27 (155) 13 (153) 0 -
Betula papyrifera 1986 160 (163) 420 (167) 413 (175) 253 (191) 475 (174) -1988 298 (191) 336 (187) 600 (192) 0 271 (196) -1993 67 (222) 240 (196) 53 (203) 0 434 (211)
Cornus stolonifira 1986 0 0 40 (156) 0 " 0 -1988 0 0 40 (157) 0 0 -1993 13 (158) 0 0 0 0 -
60
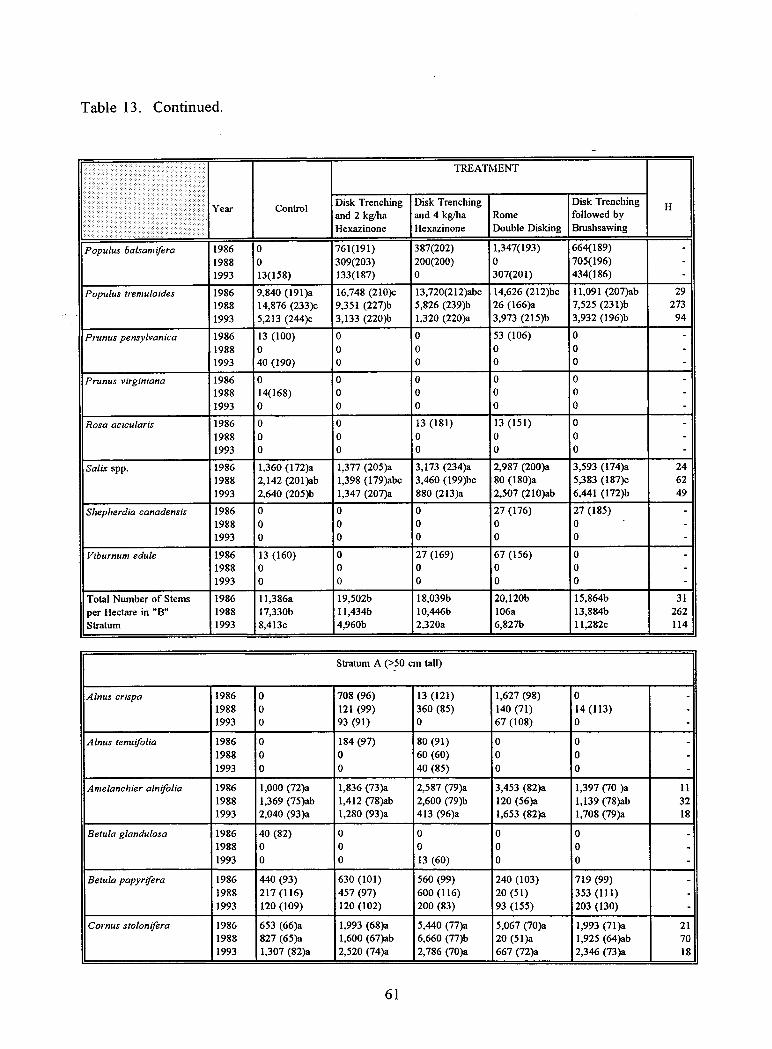
Table 13. Continued.
Year Control
TREATMENT
HDisk Trenchingand 2 kg/haHexazinone
Disk Trenchingand 4 kg/haHexazinone
RomeDouble Disking
Disk Trenchingfollowed byBrushsawing
Populus balsamifera 1986 0 761(191) 387(202) 1,347(193) 664(189) -1988 0 309(203) 200(200) 0 705(196) -1993 13(158) 133(187) 0 307(201) 434(186) -
Populus tremuloides 1986 9,840 (191)a 16,748 (210)c 13,720(212)abc 14,626 (212)bc 11,091 (207)ab 291988 14,876 (233)c 9,351 (227)b 5,826 (239)6 26 (166)a 7,525 (231)b 2731993 5,213 (244)c 3,133 (220)b 1,320 (220)a 3,973 (215)b 3,932 (196)b 94
Prunus pensylvanica 1986 13 (100) 0 0 53 (106) 0 -1988 0 0 0 0 0 -1993 40 (190) 0 0 0 0 -
Prunus virginiana 1986 0 0 0 0 0 -1988 14(168) 0 0 0 0 -1993 0 0 0 0 0 -
Rosa acicularis 1986 0 0 13 (181) 13 (151) 0 -1988 0 0 0 0 0 -1993 0 0 0 0 0 -
Salix spp. 1986 1,360 (172)a 1,377 (205)a 3,173 (234)a 2,987 (200)a 3,593 (174)a 241988 2,142 (201)ab 1,398 (179)abc 3,460 (199)bc 80 (180)a 5,383 (187)c 621993 2,640 (205)6 1,347 (207)a 880 (213)a 2,507 (210)ab 6,441 (172)b 49
Shepherdia canadensis 19861988
00
00
00
27 (176)0
27 (185)•0
--
1993 0 0 0 0 0 -
Viburnum edule 1986 13 (160) 0 27 (169) 67 (156) 0 -1988 0 0 0 0 0 -1993 0 0 0 0 0 -
Total Number of Stems 1986 11,386a 19,5026 18,039b 20,12013 15,86413 31per Hectare in "B" 1988 17,330b 11,434b 10,446b 106a 13,884b 262Stratum 1993 8,413c 4,96013 2,320a 6,8276 11,282c 114
Stratum A (>50 cm tall)
Alnus crispa 1986 0 708 (96) 13 (121) 1,627 (98) 0 -1988 0 121 (99) 360 (85) 140 (71) 14 (113) -1993 0 93 (91) 0 67 (108) 0 -
Alnus tenuifolia 1986 0 184 (97) 80 (91) 0 0 -1988 0 0 60 (60) 0 0 -1993 0 0 40 (85) 0 0 -
Amelanchier alnifolia 1986 1,000 (72)a 1,836 (73)a 2,587 (79)a 3,453 (82)a 1,397 (70 )a 111988 1,369 (75)ab 1,412 (78)ab 2,600 (79)b 120 (56)a 1,139 (78)ab 321993 2,040 (93)a 1,280 (93)a 413 (96)a 1,653 (82)a 1,708 (79)a 18
Betula glandulosa 1986 40 (82) 0 0 0 0 -1988 0 0 0 0 0 -1993 0 0 13 (60) 0 0 -
Betula papyrifera 1986 440 (93) 630 (101) 560 (99) 240 (103) 719 (99) -1988 217 (116) 457 (97) 600 (116) 20 (51) 353 (111) -1993 120 (109) 120 (102) 200 (83) 93 (155) 203 (130) -
Cornus stolonifera 1986 653 (66)a 1,993 (68)a 5,440 (77)a 5,067 (70)a 1,993 (71)a 211988 827 (65)a 1,600 (67)ab 6,660 (77)b 20 (51)a 1,925 (64)ab 701993 1,307 (82)a 2,520 (74)a 2,786 (70)a 667 (72)a 2,346 (73)a 18
61
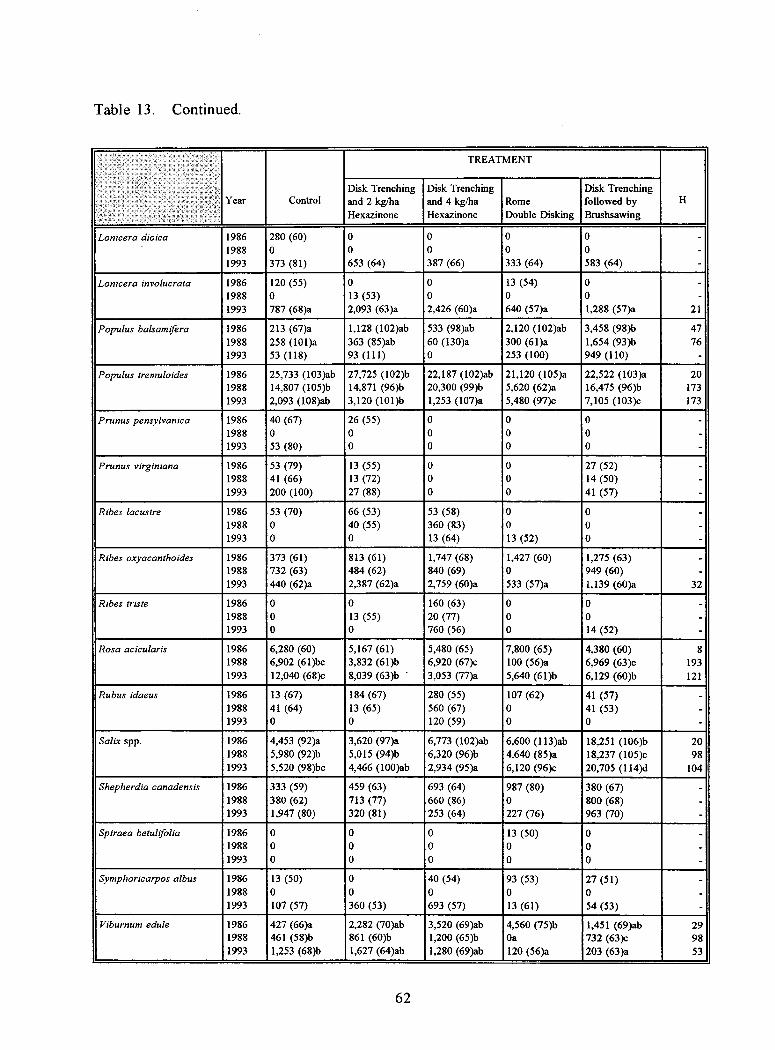
Table 13. Continued.
Year Control
TREATMENT
HDisk Trenchingand 2 kg/haHexazinone
Disk Trenchingand 4 kg/haHexazinone
RomeDouble Disking
Disk Trenchingfollowed byBrushsawing
Lonicera dioica 1986 280 (60) 0 0 0 0 -1988 0 0 0 0 0 -1993 373 (81) 653 (64) 387 (66) 333 (64) 583 (64) -
Lonicera involucrata 1986 120 (55) 0 0 13 (54) 0 -1988 0 13 (53) 0 0 0 -1993 787 (68)a 2,093 (63)a 2,426 (60)a 640 (57)a 1,288 (57)a 21
Populus balsamOra 1986 213 (67)a 1,128 (102)ab 533 (98)ab 2,120 (102)ab 3,458 (98)b 471988 258 (101)a 363 (85)ab 60 (130)a 300 (61)a 1,654 (93)b 761993 53 (118) 93 (111) 0 253 (100) 949 (110) -
Populus tremuloides 1986 25,733 (103)ab 27,725 (102)b 22,187 (102)ab 21,120 (105)a 22,522 (103)a 201988 14,807 (105)b 14,871 (96)b 20,300 (99)b 5,620 (62)a 16,475 (96)b 1731993 2,093 (108)ab 3,120 (101)6 1,253 (107)a 5,480 (97)c 7,105 (103)c 173
Prunus pensylvanica 1986 40 (67) 26 (55) 0 0 0 -1988 0 0 0 0 0 -1993 53 (80) 0 0 0 0 -
Prunus virginiana 1986 53 (79) 13 (55) 0 0 27 (52) -1988 41 (66) 13 (72) 0 0 14 (50) -1993 200 (100) 27 (88) 0 0 41 (57) -
Ribes lacustre 1986 53 (70) 66 (53) 53 (58) 0 0 -1988 0 40 (55) 360 (83) 0 0 -1993 0 0 13 (64) 13 (52) 0 -
Ribes oxyacanthoides 1986 373 (61) 813 (61) 1,747 (68) 1,427 (60) 1,275 (63) -1988 732 (63) 484 (62) 840 (69) 0 949 (60) -1993 440 (62)a 2,387 (62)a 2,759 (60)a 533 (57)a 1,139 (60)a 32
Ribes triste 1986 0 0 160 (63) 0 0 -1988 0 13 (55) 20 (77) 0 0 -1993 0 0 760 (56) 0 14 (52) -
Rosa acicularis 1986 6,280 (60) 5,167 (61) 5,480 (65) 7,800 (65) 4,380 (60) 81988 6,902 (61)bc 3,832 (61)b 6,920 (67)c 100 (56)a 6,969 (63)c 1931993 12,040 (68)c 8,039 (63)b - 3,053 (77)a 5,640 (61)b 6,129 (60)b 121
Rubus idaeus 1986 13 (67) 184 (67) 280 (55) 107 (62) 41 (57) -1988 41 (64) 13 (65) 560 (67) 0 41 (53) -1993 0 0 120 (59) 0 0 -
Sa/ix spp. 1986 4,453 (92)a 3,620 (97)a 6,773 (102)ab 6,600 (113)ab 18,251 (106)6 201988 5,980 (92)b 5,015 (94)b 6,320 (96)b 4,640 (85)a 18,237 (105)c 981993 5,520 (98)bc 4,466 (100)ab 2,934 (95)a 6,120 (96)c 20,705 (114)d 104
Shepherdia canadensis 1986 333 (59) 459 (63) 693 (64) 987 (80) 380 (67) -1988 380 (62) 713 (77) 660 (86) 0 800 (68) -1993 1,947 (80) 320 (81) 253 (64) 227 (76) 963 (70) -
Spiraea betulifolia 1986 0 0 0 13 (50) 0 -1988 0 0 0 0 0 -1993 0 0 0 0 0 -
Symphoricarpos albus 1986 13 (50) 0 40 (54) 93 (53) 27 (51) -1988 0 0 0 0 0 -1993 107 (57) 360 (53) 693 (57) 13 (61) 54 (53) -
Viburnum edule 1986 427 (66)a 2,282 (70)ab 3,520 (69)ab 4,560 (75)b 1,451 (69)ab 291988 461 (58)b 861 (60)b 1,200 (65)b Oa 732 (63)c 981993 1,253 (68)b 1,627 (64)ab 1,280 (69)ab 120 (56)a 203 (63)a 53
62
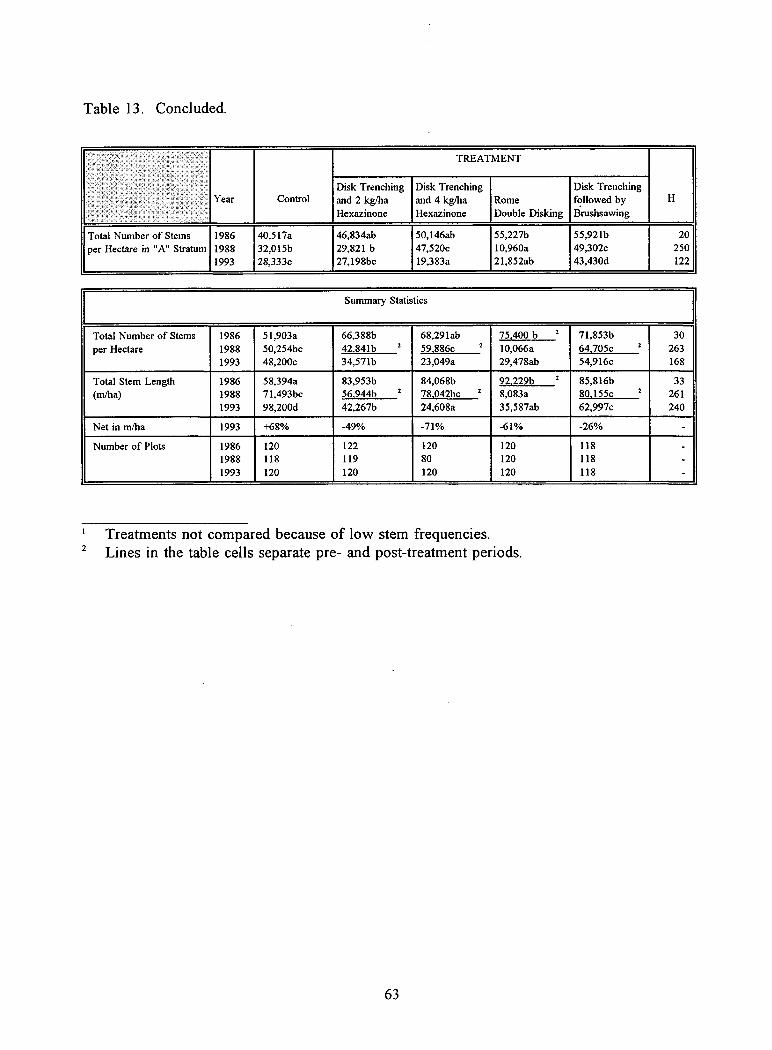
Table 13. Concluded.
TREATMENT
Disk Trenching Disk Trenching Disk TrenchingYear Control and 2 kg/ha and 4 kg/ha Rome followed by H
Hexazinone Hexazinone Double Disking Brushsawing
Total Number of Stems 1986 40,517a 46,834ab 50,146ab 55,227b 55,921b 20per Hectare in "A" Stratum 1988 32,015b 29,821 b 47,520c 10,960a 49,302c 250
1993 28,333c 27,198bc 19,383a 21,852ab 43,430d 122
Summary Statistics
Total Number of Stems 1986 51,903a 66,38813 68,291ab 75,400 b 2 71,85313 30per Hectare 1988 50,254bc 42,841b 2 59,886c 2 10,066a 64,705c 2 263
1993 48,200c 34,571b 23,049a 29,478ab 54,916c 168
Total Stem Length 1986 58,394a 83,953b 84,06813 92,229b 2 85,816b 33(m/ha) 1988 71,493bc 56,94413 2 78 042bc 2 8,083a 80,155c 2 261
1993 98,200d 42,26713 24,608a 35,587ab 62,997c 240
Net in m/ha 1993 +68% -49% -71% -61% -26% -
Number of Plots 1986 120 122 120 120 118 -1988 118 119 80 120 118 -1993 120 120 120 120 118 -
Treatments not compared because of low stem frequencies.2 Lines in the table cells separate pre- and post-treatment periods.
63
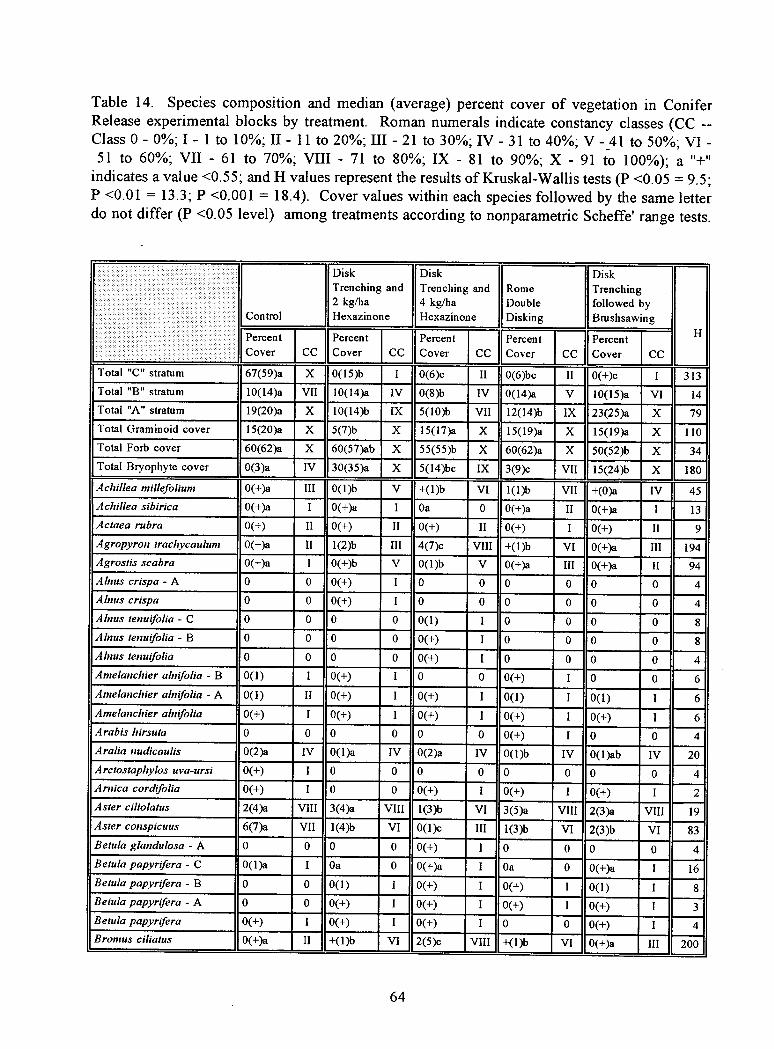
Table 14. Species composition and median (average) percent cover of vegetation in ConiferRelease experimental blocks by treatment. Roman numerals indicate constancy classes (CC --Class 0 - 0%; I - 1 to 10%; II - 11 to 20%; III - 21 to 30%; IV - 31 to 40%; V - 41 to 50%; VI -51 to 60%; VII - 61 to 70%; VIII - 71 to 80%; IX - 81 to 90%; X - 91 to 100%); a "+"
indicates a value <0.55; and H values represent the results of Kruskal-Wallis tests (P <0.05 = 9.5;P <0.01 = 13.3; P <0.001 = 18.4). Cover values within each species followed by the same letterdo not differ (P <0.05 level) among treatments according to nonparametric Scheffe' range tests.
Control
DiskTrenching and2 kg/haHexazinone
DiskTrenching and4 kg/haHexazinone
RomeDoubleDisking
DiskTrenchingfollowed byBrushsawing
PercentCover CC
PercentCover CC
PercentCover CC
PercentCover CC
PercentCover CC
H
Total "C" stratum 67(59)a X 0(15)b I 0(6)c II 0(6)bc II 0(+)c I 313Total "B" stratum 10(14)a VII 10(14)a IV 0(8)b IV 0(14)a V 10(15)a VI 14Total "A" stratum 19(20)a X 10(14)b IX 5(10)b VII 12(14)b IX 23(25)a X 79Total Graminoid cover 15(20)a X 5(7)b X 15(17)a X 15(19)a X 15(19)a X 110Total Forb cover 60(62)a X 60(57)ab X 55(55)b X 60(62)a X 50(52)b X 34Total Bryophyte cover 0(3)a IV 30(35)a X 5(14)bc IX 3(9)c VII 15(24)b X 180Achillea millefolium 0(+)a III 0(1)b V +(1)b VI 1(1)b VII +(0)a IV 45Achillea sibirica 0(+)a I 0(+)a I Oa 0 0(+)a II 0(+)a I 13Actaea rubra 0(+) II 0(+) II 0(+) II 0(+) I 0(+) II 9Agropyron trachycaulum 0(+)a II 1(2)b III 4(7)c VIII +(1)b VI 0(+)a III 194Agrostis scabra 0(+)a I 0(+)b V 0(1)b V 0(+)a III 0(+)a II 94Alnus crispa - A 0 0 0(+) I 0 0 0 0 0 0 4Abuts crispa 0 0 0(+) I 0 0 0 0 0 0 4Alnus tenuifolia - C 0 0 0 0 0(1) I 0 0 0 0 8Alms tenuifolia - B 0 0 0 0 0(+) I 0 0 0 0 8Alnus tenuifolia 0 0 0 0 0(+) I 0 0 0 0 4Amelanchier alnifolia - B 0(1) 1 0(+) I 0 0 0(+) I 0 0 6Amelanchier alnifolia - A 0(1) II 0(+) I 0(+) I 0(1) I 0(1) I 6Amelanchier alnifolia 0(+) I 0(+) I 0(+) I 0(+) I 0(+) I 6Arabis hirsuta 0 0 0 0 0 0 0(+) I 0 0 4Aralia nudicaulis 0(2)a IV 0(1)a IV 0(2)a IV 0(1)6 IV 0(1)ab IV 20Arctostaphylos uva-ursi 0(+) I 0 0 0 0 0 0 0 0 4Arnica cordifolia 0(+) I 0 0 0(+) I 0(+) I 0(+) I 2Aster ciliolatus 2(4)a VIII 3(4)a VIII 1(3)b VI 3(5)a VIII 2(3)a VIII 19Aster conspicuus 6(7)a VII 1(4)b VI 0(1)c III 1(3)b VI 2(3)b VI 83Betula glandulosa - A 0 0 0 0 0(+) I 0 0 0 0 4Betula papyrifera - C 0(1)a I Oa 0 0(+)a I Oa 0 0(+)a I 16Betula papyrifera - B 0 0 0(1) 1 0(+) I 0(+) I 0(1) I 8Betula papyrifera - A 0 0 0(+) I 0(+) I 0(+) I 0(+) I 3Betula papyrifera 0(+) I 0(+) I 0(+) I 0 0 0(+) I 4Bromus ciliatus 0(+)a II +(1)b VI 2(5)c VIII +(1)b VI 0(+)a III 200
64
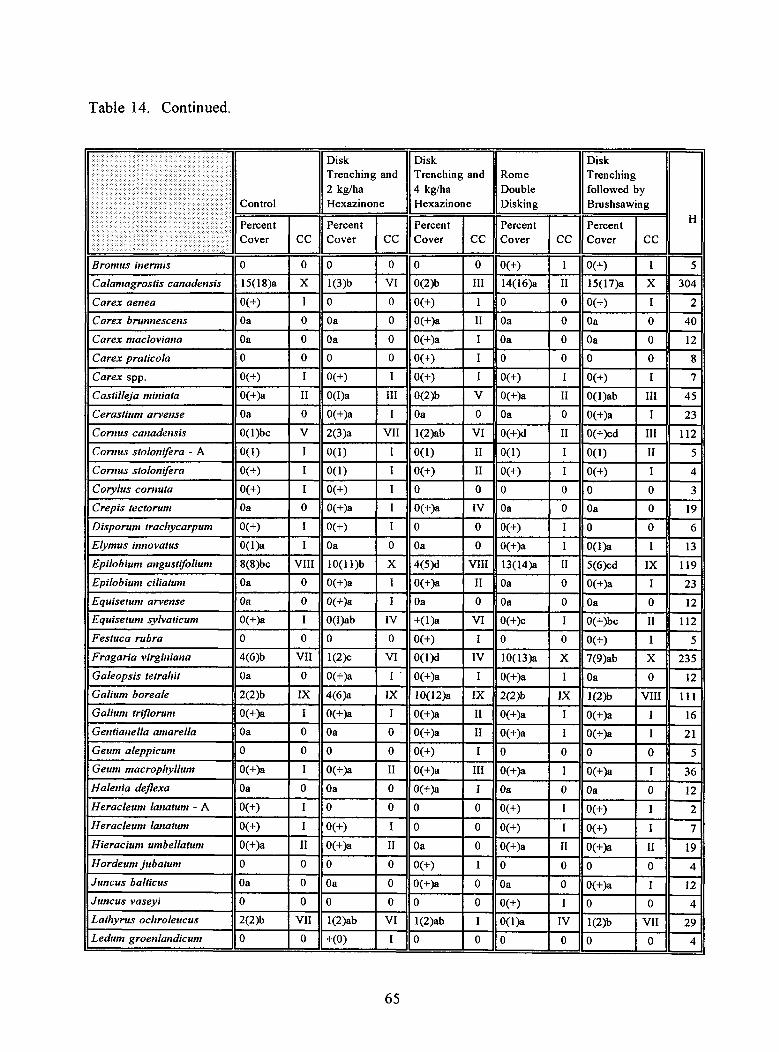
Table 14. Continued.
Control
DiskTrenching and2 kg/haHexazinone
DiskTrenching and4 kg/haHexazinone
RomeDoubleDisking
DiskTrenchingfollowed byBrushsawing
PercentCover CC
PercentCover CC
PercentCover CC
PercentCover CC
PercentCover
H
CC
Bromus inermis 0 0 0 0 0 0 0(+) I 0(+) I 5Calamagrostis canadensis 15(18)a X 1(3)b VI 0(2)b III 14(16)a II 15(17)a X 304
Carex aenea 0(+) I 0 0 0(+) I 0 0 0(+) I 2Carex brunnescens Oa 0 Oa 0 0(+)a II Oa 0 Oa 0 40Carex macloviana Oa 0 Oa 0 0(+)a I Oa 0 Oa 0 12Carex praticola 0 0 0 0 0(+) I 0 0 0 0 8Carex spp. 0(+) I 0(+) I 0(+) I 0(+) I 0(+) I 7
Castilleja miniata 0(+)a II 0(1)a III 0(2)b V 0(+)a II 0(1)ab III 45Cerastium arvense Oa 0 0(+)a I Oa 0 Oa 0 0(+)a I 23Corpus canadensis 0(1)bc V 2(3)a VII 1(2)ab VI 0(+)d II 0(+)cd III 112Corpus stolonifera - A 0(1) I 0(1) I 0(1) II 0(1) I 0(1) II 5Corpus stolonifera 0(+) I 0(1) I 0(+) II 0(+) I 0(+) I 4Corylus comuta 0(+) I 0(+) I 0 0 0 0 0 0 3Crepis tectorum Oa 0 0(+)a I 0(+)a IV Oa 0 Oa 0 19Disporun: tracitycarpum 0(+) I 0(+) I 0 0 0(+) I 0 0 6Elymus innovatus 0(1)a I Oa 0 Oa 0 0(+)a I 0(1)a 1 13Epdobium angustifolium 8(8)bc VIII 10(11)6 X 4(5)d VIII 13(14)a II 5(6)cd IX 119Epilobium ciliatum Oa 0 0(+)a I 0(+)a II Oa 0 0(+)a I 23Equisetum arvense Oa 0 0(+)a I Oa 0 Oa 0 Oa 0 12Equisetum sylvaticum 0(+)a I 0(I)ab IV +(1)a VI 0(+)c I 0(+)bc II 112Festuca rubra 0 0 0 0 0(+) I 0 0 0(+) I 5Fragaria virginiana 4(6)b VII 1(2)c VI 0(1)d IV 10(13)a X 7(9)ab X 235Galeopsis tetrahit Oa 0 0(+)a I - 0(+)a I 0(+)a I Oa 0 12Galiun: boreale 2(2)b IX 4(6)a IX 10(12)a IX 2(2)b IX 1(2)6 VIII 111Gcdium triflorum 0(+)a I 0(+)a I 0(+)a II 0(+)a I 0(+)a I 16Gentianella amarella Oa 0 Oa 0 0(+)a II 0(+)a I 0(+)a I 21Geun: aleppicun: 0 0 0 0 0(+) I 0 0 0 0 5Geun: macrophyllum 0(+)a I 0(+)a II 0(+)a III 0(+)a I 0(+)a I 36Halenia deflexa Oa 0 Oa 0 0(+)a I Oa 0 Oa 0 12Heracleun: lanatum - A 0(+) I 0 0 0 0 0(+) I 0(+) I 2Heracleum lanatum 0(+) I 0(+) I 0 0 0(+) I 0(+) I 7Hieraciun: umbellatun: 0(+)a II 0(+)a II Oa 0 0(+)a II 0(+)a II 19Hordeum jubatum 0 0 0 0 0(+) I 0 0 0 0 4Juncus balticus Oa 0 Oa 0 0(+)a 0 Oa 0 0(+)a I 12Juncus vaseyi 0 0 0 0 0 0 0(+) I 0 0 4Lathyrus ochroleucus 2(2)b VII 1(2)ab VI 1(2)ab I 0(1)a IV 1(2)b VII 29Ledurn groerdandicum 0 0 +(0) I 0 0 0 0 0 0 4
65

Table 14. Continued.
Control
DiskTrenching and2 kg/haHexazinone
DiskTrenching and4 kg/haHexazinone
RomeDoubleDisking
DiskTrenchingfollowed byBrushsawmg
PercentCover CC
PercentCover CC
PercentCover CC
PercentCover CC
PercentCover
H
CC
Linnaea borealis 0(1)a IV 0(+)ab II 0(+)b I 0(+)b I 0(1)ab II 70
Lonicera dioica - A 0(+) I 0(+) I 0(+) I 0(+) I 0(+) I 2
Lonicera dioica 0(1) II 0(+) I 0(+) H 0(+) I 0(+) II 5
Lonicera involucrata - A 0(+)a I 0(1)a I 0(1)a II 0(+)a I 0(+)a I 14
Lonicera involucrata 0(2) II 0(2) I 0(1) II 0(1) II 0(2) II 6
Maianthemunt canadense 0(+)ab III 0(1)a IV 0(1)abc III 0(+)c I 0(+)bc II 52Melilotus officinalis 0 0 0 0 0(+) I 0 0 0 0 8
Mertensia paniculata 1(3)a VII 1(2)ab VI 0(1)a IV 1(2)ab VI 1(2)a VII 29
Mitella nuda 0(+) I 0(+) I 0(+) I 0(+) I 0(4-) I 5
Moehringia lateriflora Oa 0 0(+)a I 0(1)a II Oa 0 Oa 0 68
Oryzopsis asperifolia 0(+)a I Oa 0 Oa 0 0(+)a I 0(4-)a I 11Petasites palmatus 2(4)a VII 2(4)a VII 0(1)b III 4(4)a VIII 1(3)a VI 80
Petasites vitifolius 0(+)a I Oa 0 0(+)a I Oa 0 0(+)a I 20
Phleum pratense Oa 0 0(+)a I 0(+)a I 0(+)a I 0(+)a I 13Poa palustris 0(+)a I 0(+)a II 0(1)a II 0(+)a I 0(+)a I 34
Populus balsamifera - C 0 0 0(+) I 0 0 0(+) I 0 0 8Populus balsantifera - B 0(+)a I 0(+)a I Oa 0 0(1)a I 0(1)a I 13
Populus balsantifera - A Oa 0 0(+)a I Oa 0 0(+)a I 0(1)a II 31
Populus balsamifera 0(4-) I 0(+) I 0 0 0 0 0(+) I 6
Populus tremuloides - C 60(56)a X 0(12)b IV 0(4)c II 0(4)c II 0(+)c I 323
Populus tremuloides - B 0(9)a V 0(9)a V 0(3)b II 0(8)ab IV 0(7)ab IV 27
Populus trenzuloides - A 0(2)a III 0(3)ab IV - 0(2)a III 0(5)bc V 5(9)c VII 71
Populus trenzuloides 0(+)a I 0(+)a II 0(+)a I 0(+)a I 0(1)a III 30Potentilla norvegica Oa 0 0(+)a I 0(+)a II 0(+)a I 0(+)a I 29Prunus pensylvanica - B 0(4-) I 0 0 0 0 0 0 0 0 8
Prunus pensylvanica - A 0(+) I 0 0 0 0 0 0 0 0 4Prunus virginiana - B 0(+) I 0 0 0 0 0 0 0 0 4
Prunus virginiana - A 0(+) I 0 0 0 0 0 0 0(+) I 5
Prunus virginiana 0 0 0(+) I 0 0 0 0 0(+) I 3
Pyrola asanfolia 0(+)a II 0(+)a II 0(+)a I 0(+)a I 0(+)a I 24Ribes lacustre - A Oa 0 Oa 0 Oa 0 0(+)a I Oa 0 4Ribes lacusire 0 0 0(+) I 0 0 0(+) I 0 0 5Ribes oxyacanthoides - A 0(+)a II 0(+)a I 0(1)a II 0(+)a I 0(+)a I 10Ribes oxyacantlioides 0(+) I 0(1) III 0(1) III 0(1) II 0(1) III 8Ribes triste - A 0 0 0 0 0(+) I 0 0 0 0 8Rosa acicularis - A 8(10)a VI 0(3)b V 0(1)b III 0(2)b IV 0(2)b IV 99
Rosa acicularis 10(11)a X 8(9)a IX 1(3)b VII 8(8)a X 7(8)a X 106
66
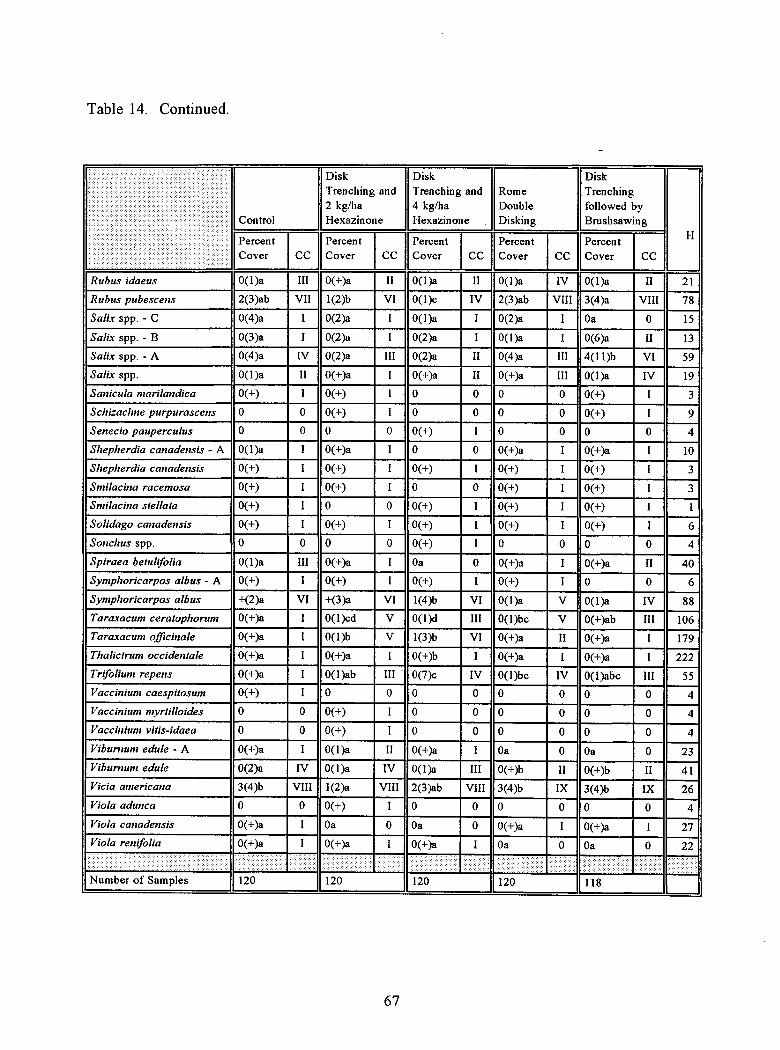
Table 14. Continued.
Control
DiskTrenching and2 kg/haHexazinone
DiskTrenching and4 kg/haHexazinone
RomeDoubleDisking
DiskTrenchingfollowed byBruslisawing
PercentCover CC
PercentCover CC
PercentCover CC
PercentCover CC
PercentCover CC
H
Rubus idaeus 0(1)a III 0(+)a II 0(1)a II 0(1)a IV 0(1)a II 21Rubus pubescens 2(3)ab VII 1(2)b VI 0(1)c IV 2(3)ab VIII 3(4)a VIII 78Salix spp. - C 0(4)a I 0(2)a I 0(1)a I 0(2)a I Oa 0 15Salix spp. - B 0(3)a I 0(2)a I 0(2)a I 0(1)a I 0(6)a II 13Salix spp. - A 0(4)a IV 0(2)a III 0(2)a II 0(4)a III 4(11)b VI 59Salix spp. 0(1)a II 0(+)a I 0(+)a II 0(+)a III 0(1)a IV 19Sanicula marilandica 0(+) I 0(+) I 0 0 0 0 0(+) I 3Schizachne purpurascens 0 0 0(+) I 0 0 0 0 0(+) I 9Senecio pauperculus 0 0 0 0 0(+) I 0 0 0 0 4Shepherdia canadensis - A 0(1)a I 0(+)a I 0 0 0(+)a I 0(+)a I 10Shepherdia canadensis 0(+) I 0(+) I 0(+) I 0(+) I 0(+) I 3Smilacina racemosa 0(+) I 0(+) I 0 0 0(+) I 0(+) I 3Smilacina stellata 0(+) I 0 0 0(+) I 0(+) I 0(+) 1 1Solidago canadensis 0(+) I 0(+) I 0(+) I 0(+) I 0(+) I 6Sonchus spp. 0 0 0 0 0(+) I 0 0 0 0 4Spiraea betulifolia 0(1)a HI 0(+)a I Oa 0 0(+)a I 0(+)a II 40Symphoricarpos albus - A 0(+) I 0(+) I 0(+) I 0(+) I 0 0 6Symphoricarpos albus +(2)a VI +(3)a VI 1(4)b VI 0(1)a V 0(1)a IV 88Taraxacum ceratophorun: 0(+)a I 0(1)cd V 0(1)d III 0(1)bc V 0(+)ab III 106Taraxacum officinale 0(+)a I 0(1)b V 1(3)b VI 0(+)a H 0(+)a I 179Thalictrum occidentale 0(+)a I 0(+)a I 0(+)b I 0(+)a I 0(+)a I 222Trifoliun: repens 0(+)a I 0(1)ab III - 0(7)c IV 0(1)bc IV 0(1)abc III 55Vaccinium caespitosum 0(+) I 0 0 0 0 0 0 0 0 4Vaccinium n:yrtilloides 0 0 0(+) I 0 0 0 0 0 0 4Vaccinium vitis-idaea 0 0 0(+) I 0 0 0 0 0 0 4Viburnum edule - A 0(+)a I 0(1)a II 0(+)a I Oa 0 Oa 0 23Viburnum edule 0(2)a IV 0(1)a IV 0(1)a III 0(+)b II 0(+)b II 41Vicia americana 3(4)b VIII 1(2)a VIII 2(3)ab VIII 3(4)b IX 3(4)b IX 26Viola adunca 0 0 0(+) I 0 0 0 0 0 0 4Viola canadensis 0(+)a I Oa 0 Oa 0 0(+)a I 0(+)a I 27Viola renifolia 0(+)a I 0(+)a I 0(+)a I Oa 0 Oa 0 22
Number of Samples 120 120 120 120 118
67
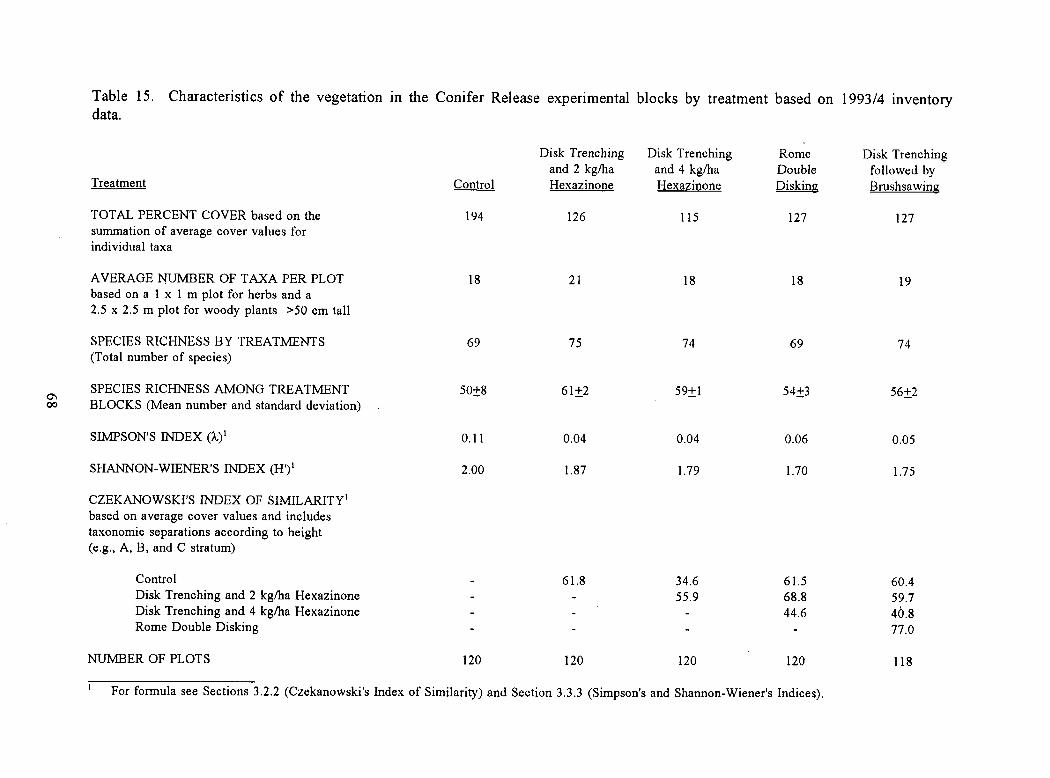
Table 15. Characteristics of the vegetation in the Conifer Release experimental blocks by treatment based on 1993/4 inventorydata.
Disk Trenching Disk Trenching Rome Disk Trenchingand 2 kg/ha and 4 kg/ha Double followed by
Treatment Control Hexazinone Hexazinone Disking Brushsawing
TOTAL PERCENT COVER based on thesummation of average cover values forindividual taxa
194 126 115 127 127
AVERAGE NUMBER OF TAXA PER PLOTbased on a 1 x 1 m plot for herbs and a
18 21 18 18 19
2.5 x 2.5 m plot for woody plants >50 cm tall
SPECIES RICHNESS BY TREATMENTS 69 75 74 69 74(Total number of species)
SPECIES RICHNESS AMONG TREATMENT 50+8 61+2 59+1 54+3 56+2BLOCKS (Mean number and standard deviation)
SIMPSON'S INDEX (k)' 0.11 0.04 0.04 0.06 0.05
SHANNON-WIENER'S INDEX (H')' 2.00 1.87 1.79 1.70 1.75
CZEKANOWSKI'S INDEX OF SIMILARITY'based on average cover values and includestaxonomic separations according to height(e.g., A, B, and C stratum)
Control 61.8 34.6 61.5 60.4Disk Trenching and 2 kg/ha Hexazinone 55.9 68.8 59.7Disk Trenching and 4 kg/ha Hexazinone 44.6 46.8Rome Double Disking 77.0
NUMBER OF PLOTS 120 120 120 120 118
For formula see Sections 3.2.2 (Czekanowski's Index of Similarity) and Section 3.3.3 (Simpson's and Shannon-Wiener's Indices).

Only stem density data were collected at the time of plot establishment due to a lack ofresources. Therefore, botanical changes that may have occurred within or between control andtreatment plots prior to 1993 cannot be evaluated. In general, the vegetation was similar to theSite Preparation experiment blocks.
In summary, the control plot vegetation was dominated by five meter tall Populus tremuloidestrees with an A-stratum composed of Rosa acicularis. The understory vegetation was composedof a mixture of herbs and low-growing shrubs.
4.2.1.2 Disk Trenching and 2 kg/ha Hexazinone Plots
This plot was initially disk trenched in May 1987 and then treated with 2 kg/ha of hexazinoneapproximately two years later in May 1989. The vegetation was dominated by a B- and open-canopied C-stratum in 1993 (Photograph 7B). Populus tremuloides was most common in the B-stratum (150 to 300 cm) with a density of 3,133 stem/ha, but an additional 1,880 stems reacheda typical height of 475 cm. Overall plant cover within both the B- and C-strata was ten percent(Table 14).
Of the 27,198 stems/ha that occurred within the A-stratum, Rosa acicularis, Salix spp, andPopulus tremuloides composed the majority (i.e., 57 percent). In 1986, 66,388 woody plantstems greater than 50 cm tall occurred in this treatment plot. Density decreased by 35 percentwithin three years and decreased by an additional 13 percent by 1993 following the applicationof 2 kg/ha of hexazinone for a net density of 34,571 stems/ha in 1993. The pattern and degreeof change was similar for the total length of woody stems in the treatment. The largest lossesin stem numbers following chemical treatment occurred in Populus tremuloides in the B- and A-strata (i.e., 17,969 stems/ha), while large increases occurred in the A-stratum among shrubs suchas Lonicera involucrata (increased from 13 to 2,093 stems/ha between 1988 and 1993 or 161xincrease), Ribes oxyacanthoides (5x), Rosa acicularis (2x), and Viburnum edule (2x) (Table 13).
Forbs and shrubs less than 50 cm tall dominated the herb stratum with 92 percent of its overallcover (Table 14). Epilobium angustifolium (median cover 10 percent), Rosa acicularis (8percent), Gahm boreale (4 percent), and Aster ciliolatus (3 percent) were among the mostcommon species. In addition, approximately 30 percent of the ground surface was covered withbryophytes. Total species cover was 126 percent with the majority of cover represented by plantsless than 150 cm tall.
A total of 75 vascular plant species were found within this treatment in 1993, but only 61 speciesoccurred in each of the three replicate treatment plots. An average of 21 taxa were normallyencountered in individual quadrants. Percent cover was relatively evenly distributed among thespecies that occurred in the vegetation based on Simpson's and Shannon-Wiener's Index values(Table 15). A comparison of plant taxa cover values suggests that approximately 90 percent ofthe total vegetation cover was concentrated within 40 percent of the flora.
In 1993, this vegetation was composed of a 150 to 300 cm tall very open-growing Populustremuloides stand with a well developed herb stratum.
69
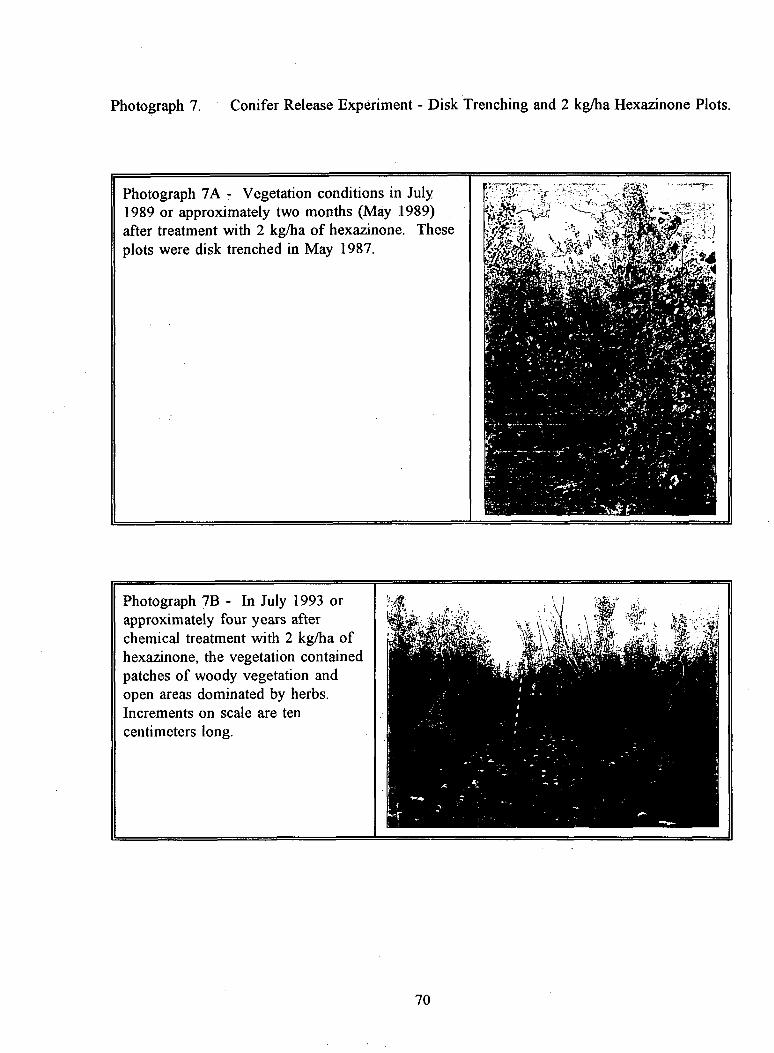
Photograph 7. Conifer Release Experiment - Disk Trenching and 2 kg/ha Hexazinone Plots.
Photograph 7A - •Vegetation conditions in July1989 or approximately two months (May 1989)after treatment with 2 kg/ha of hexazinone. Theseplots were disk trenched in May 1987.
Photograph 7B - In July 1993 orapproximately four years afterchemical treatment with 2 kg/ha ofhexazinone, the vegetation containedpatches of woody vegetation andopen areas dominated by herbs.Increments on scale are tencentimeters long.
70
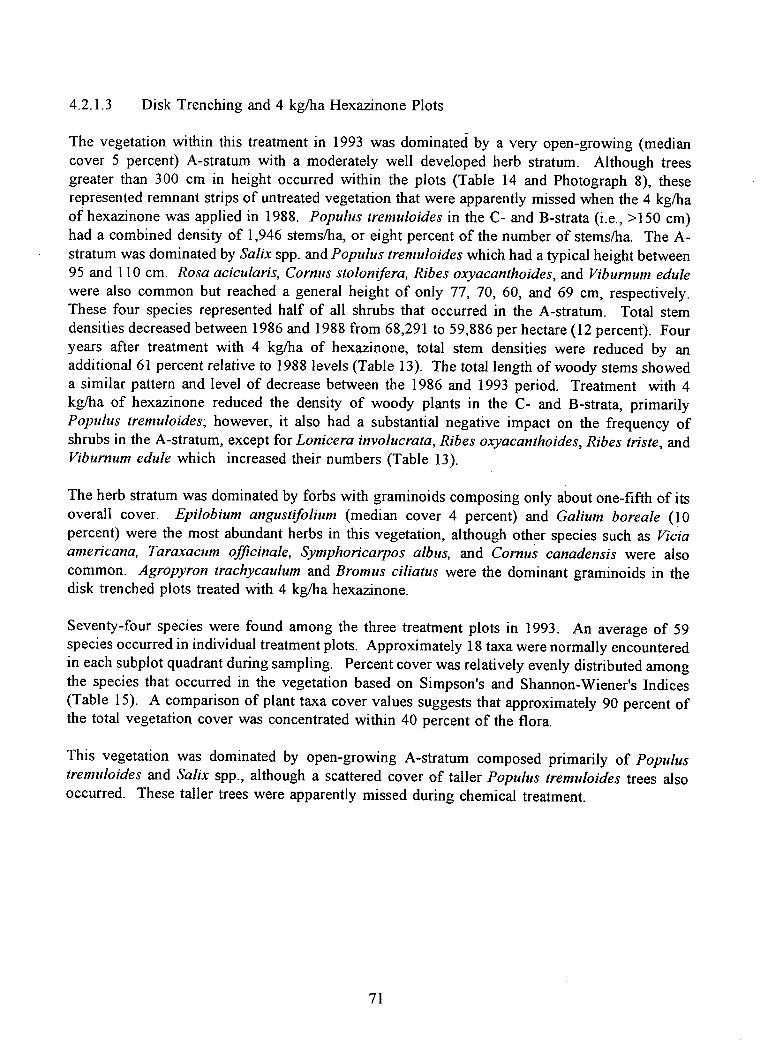
4.2.1.3 Disk Trenching and 4 kg/ha Hexazinone Plots
The vegetation within this treatment in 1993 was dominated by a very open-growing (mediancover 5 percent) A-stratum with a moderately well developed herb stratum. Although treesgreater than 300 cm in height occurred within the plots (Table 14 and Photograph 8), theserepresented remnant strips of untreated vegetation that were apparently missed when the 4 kg/haof hexazinone was applied in 1988. Populus tremuloides in the C- and B-strata (i.e., >150 cm)had a combined density of 1,946 stems/ha, or eight percent of the number of stems/ha. The A-stratum was dominated by Salix spp. and Populus tremuloides which had a typical height between95 and 110 cm. Rosa acicularis, Cornus stolonifera, Ribes oxyacanthoides, and Viburnum edulewere also common but reached a general height of only 77, 70, 60, and 69 cm, respectively.These four species represented half of all shrubs that occurred in the A-stratum. Total stemdensities decreased between 1986 and 1988 from 68,291 to 59,886 per hectare (12 percent). Fouryears after treatment with 4 kg/ha of hexazinone, total stem densities were reduced by anadditional 61 percent relative to 1988 levels (Table 13). The total length of woody stems showeda similar pattern and level of decrease between the 1986 and 1993 period. Treatment with 4kg/ha of hexazinone reduced the density of woody plants in the C- and B-strata, primarilyPopulus tremuloides; however, it also had a substantial negative impact on the frequency ofshrubs in the A-stratum, except for Lonicera involucrata, Ribes oxyacanthoides, Ribes triste, andViburnum edule which increased their numbers (Table 13).
The herb stratum was dominated by forbs with graminoids composing only about one-fifth of itsoverall cover. Epilobium angustifolium (median cover 4 percent) and Galium boreale (10percent) were the most abundant herbs in this vegetation, although other species such as Viciaamericana, Taraxacum officinale, Symphoricarpos albus, and Cornus canadensis were alsocommon. Agropyron trachycaulum and Bromus ciliatus were the dominant graminoids in thedisk trenched plots treated with 4 kg/ha hexazinone.
Seventy-four species were found among the three treatment plots in 1993. An average of 59species occurred in individual treatment plots. Approximately 18 taxa were normally encounteredin each subplot quadrant during sampling. Percent cover was relatively evenly distributed amongthe species that occurred in the vegetation based on Simpson's and Shannon-Wiener's Indices(Table 15). A comparison of plant taxa cover values suggests that approximately 90 percent ofthe total vegetation cover was concentrated within 40 percent of the flora.
This vegetation was dominated by open-growing A-stratum composed primarily of Populustremuloides and Salix spp., although a scattered cover of taller Populus tremuloides trees alsooccurred. These taller trees were apparently missed during chemical treatment.
71
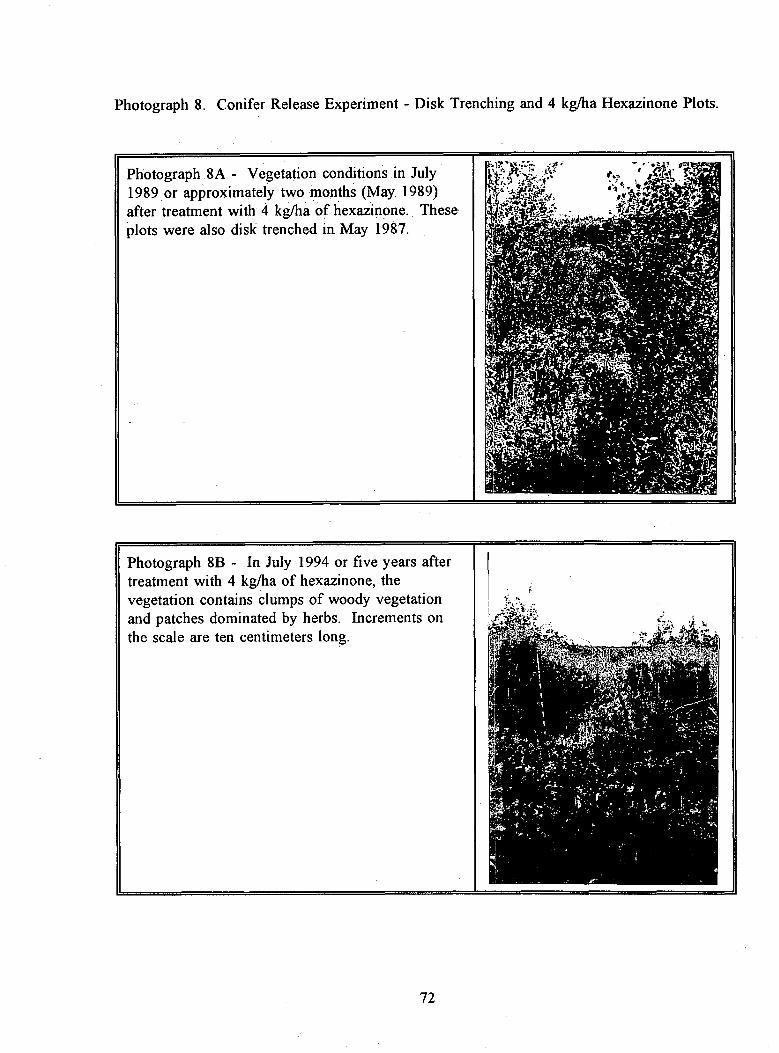
Photograph 8B - In July 1994 or five years aftertreatment with 4 kg/ha of hexazinone, thevegetation contains clumps of woody vegetationand patches dominated by herbs. Increments onthe scale are ten centimeters long.
Photograph .8A - Vegetation conditions in July1989 or approximately two months (May 1989)after treatment with 4 kg/ha of hexazinone. Theseplots were also disk trenched in May 1987.
Photograph 8. Conifer Release Experiment - Disk Trenching and 4 kg/ha Hexazinone Plots.
72
4.2.1.4 Rome Double Disking Plots
The vegetation within the Rome double disking plots in 1993 or six years after treatmentconsisted of open-growing B-stratum dominated by shrubs with a moderately well developed herbstratum (Photograph 9). Populus tremuloides and Salix spp. with a combined density of 6,480stem/ha composed approximately 95 percent of the woody plants found in the B-stratum of thisvegetation (Table 13), but this represents a foliar cover of only 10 to 15 percent. The A-stratumwas dominated by Salix spp. (6,120 stems/ha), Rosa acicularis (5,640 stems/ha), and Populustremuloides (5,480 stems/ha). Rome double disking destroyed most of the woody plant stemsthat occurred in these treatment plots. One year after disking, however, approximately 11,080woody stems occurred per hectare with 29,478 per hectare after six years of growth (Figure 9).This latter value represented less than 40 percent of the total density that occurred in these plotsprior to treatment. Similar reduction was evident in the total length of woody stems (Table 13and Figure 9). The majority of woody stems were Populus tremuloides.
The herb stratum was dominated by Calamagrostis canadensis (median cover 14 percent),Epilobium angustifolium (13 percent), Fragaria virginiana (10 percent), Rosa acicularis (8percent), Petasites palmatus (4 percent), Vicia americana (3 percent), and Aster ciliolatus (3percent). The two most abundant of these species had constancy values of less than 20 percent,which suggests their distribution was patchy but of high cover where they occurred. Totalspecies cover within this treatment was approximately 127 percent (Table 15).
Sixty-nine species were found in the three replicate plots that formed this treatment in 1993. Anaverage of 54 species occurred in individual treatment plots. During sampling approximately 18taxa were normally encountered in each subplot quadrant. Percent cover was relatively evenlydistributed among the species that occurred in the vegetation based on Simpson's and Shannon-Wiener's Index values (Table 15). A comparison of plant taxa cover values suggests thatapproximately 90 percent of the total vegetation cover was concentrated within 30 percent of theflora.
In 1993, the vegetation in this treatment consisted of an open-growing B stratum dominated bya combination of Populus tremuloides and Salix spp. The herb stratum was composed of amixture of graminoids, forbs, and low-growing shrubs.
4.2.1.5 Disk Trenching Followed by Brushsawing Plots
The vegetation on these treatment plots consisted of an open-growing B-stratum with amoderately well developed herb stratum (Photograph 10). The B-stratum was primarily formedby Salix spp. and secondarily by Populus tremuloides which composed approximately 92 percentof all the woody stems (Table 13). The A-stratum was dominated by the same species, althoughthey represented only two-thirds of the total number of stems. Rosa acicularis was also a notablespecies in this stratum with 6,129 stem/ha. Shrubs within the A-stratum had an overall cover ofapproximately 23 percent and a constancy of more than 90 percent. Approximately 10 percentshrub cover occurred in the B-stratum but its frequency of occurrence was only 50 to 60 percent.In 1986, 71,853 woody stems occurred per hectare in this treatment. This density decreased by
73

Photograph 9. Conifer Release Experiment - Rome Double Disking Plots.
Photograph 9A - Approximatelyone year after Rome double diskingin May 1987, the plant cover in thistreatment plot was limited with ahigh proportion of exposed soil.This photograph was taken in July1988.
Photograph 9B - In July 1993 orapproximately six years after Romedouble disking, the vegetation in thistreatment plot consisted of scatteredwoody plants with a moderately welldeveloped herb stratum . The Pinuscontorta were planted in May 1987.Increments on the scale are tencentimeters long.
74
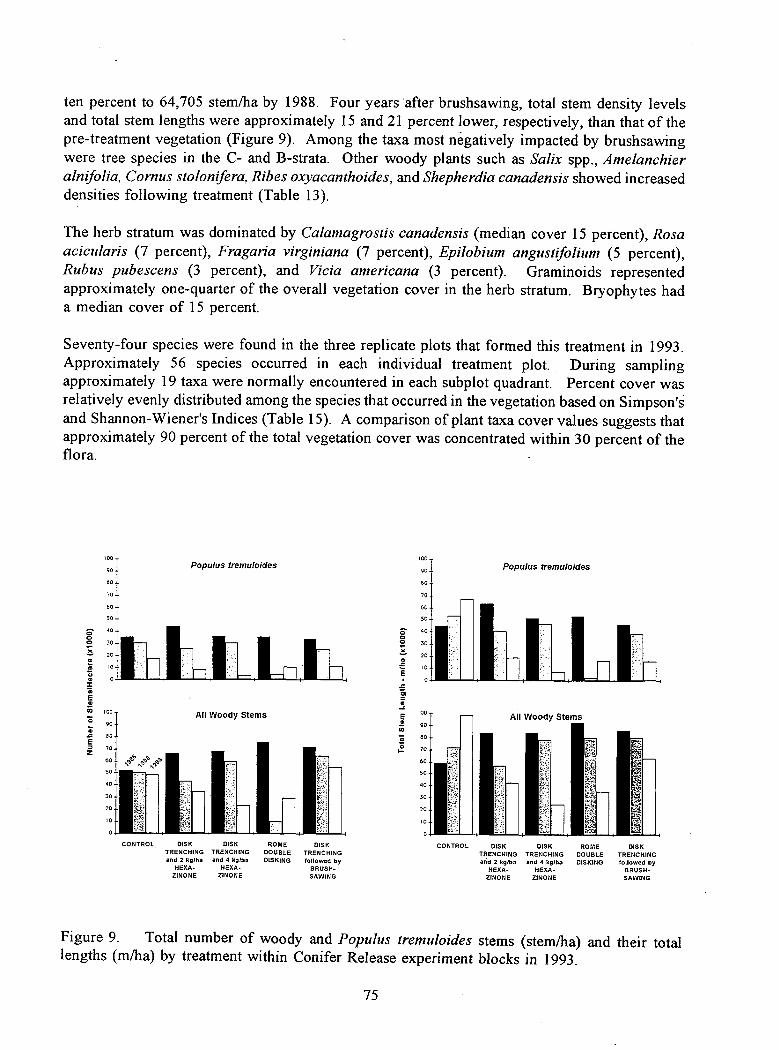
100
90
80
70
60
50
Populus tremuloides
O0 30
20
X
E100
90
80
O
•
70
60 scp`'
50
All Woody Stems
4.30
20
10
0
CONTROL DISK •TRENCHINGfollowed by
BRUSH-SAWING
DISK DISKTRENCHING TRENCHINGand 2 kg/ha and 4 kg/ha
HEXA- HEXA-ZINONE ZINONE
ROMEDOUBLEDISKING
100
90
80
70
60
50
90
30
20
10 -0
All Woody Stems
Populus tremuloides
100
90
80
70
60
50
90
30
20
10
0
ten percent to 64,705 stem/ha by 1988. Four years after brushsawing, total stem density levelsand total stem lengths were approximately 15 and 21 percent lower, respectively, than that of thepre-treatment vegetation (Figure 9). Among the taxa most negatively impacted by brushsawingwere tree species in the C- and B-strata. Other woody plants such as Salix spp., Amelanchieralnifolia, Cornus stolonifera, Ribes oxyacanthoides, and Shepherdia canadensis showed increaseddensities following treatment (Table 13).
The herb stratum was dominated by Calamagrostis canadensis (median cover 15 percent), Rosaacicularis (7 percent), Fragaria virginiana (7 percent), Epilobium angustifolium (5 percent),Rubus pubescens (3 percent), and Vicia americana (3 percent). Graminoids representedapproximately one-quarter of the overall vegetation cover in the herb stratum. Bryophytes hada median cover of 15 percent.
Seventy-four species were found in the three replicate plots that formed this treatment in 1993.Approximately 56 species occurred in each individual treatment plot. During samplingapproximately 19 taxa were normally encountered in each subplot quadrant. Percent cover wasrelatively evenly distributed among the species that occurred in the vegetation based on Simpson'sand Shannon-Wiener's Indices (Table 15). A comparison of plant taxa cover values suggests thatapproximately 90 percent of the total vegetation cover was concentrated within 30 percent of theflora.
CONTROL ,DISK DISK ROME DISKTRENCHING TRENCHING DOUBLE TRENCHINGand 2 kg/ha and 4 kg/ha DISKING followed by
HEXA- HEXA- BRUSH-ZINONE ZINONE SAWING
Figure 9. Total number of woody and Populus tremuloides stems (stem/ha) and their totallengths (m/ha) by treatment within Conifer Release experiment blocks in 1993.
75
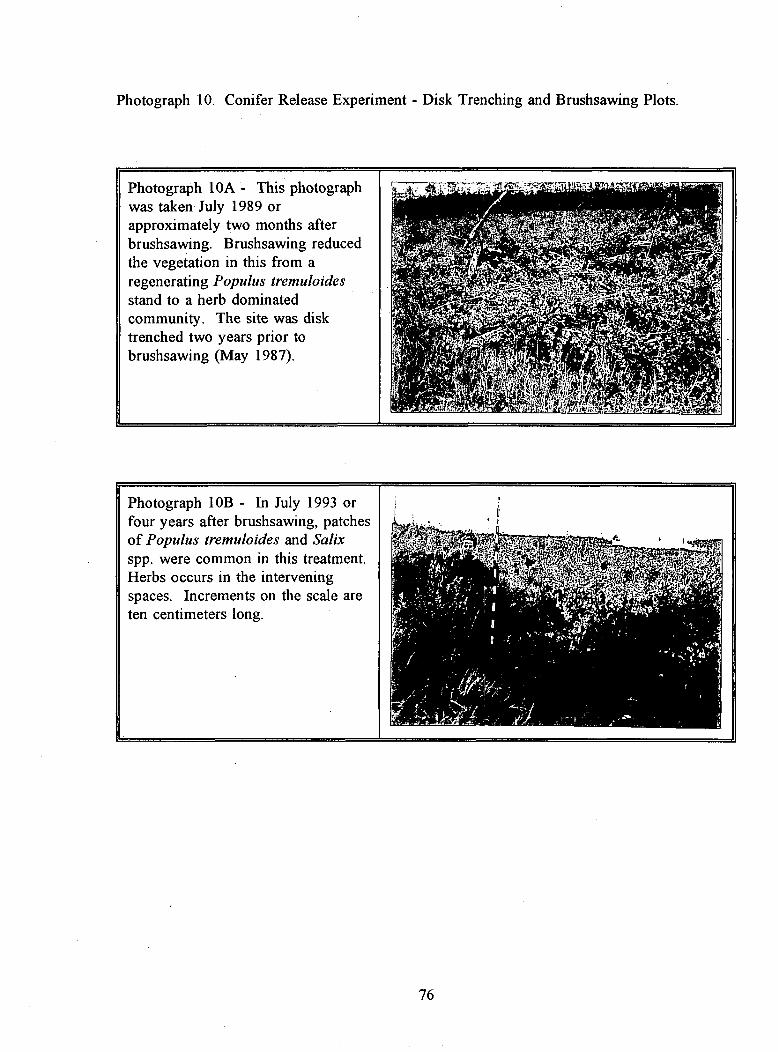
Photograph 10. Conifer Release Experiment - Disk Trenching and Brushsawing Plots.
Photograph 10A - This photographwas taken July 1989 orapproximately two months afterbrushsawing. Brushsawing reducedthe vegetation in this from aregenerating Populus tremuloidesstand to a herb dominatedcommunity. The site was disktrenched two years prior tobrushsawing (May 1987).
Photograph 10B - In July 1993 orfour years after brushsawing, patchesof Populus tremuloides and Salixspp. were common in this treatment.Herbs occurs in the interveningspaces. Increments on the scale areten centimeters long.
76
This vegetation was dominated by an open-growing stand of Salix spp. and Populus tremuloideswith a height usually less than 300 cm. Graminoids and forbs dominated the herb stratum.
4.2.2 Comparison of Treatments
A comparison of median species cover values with those found in the control plots suggests thatchemical and mechanical treatments had an effect on six growth-forms and 21 species (Table 16).All treatment methods reduced the overall cover of the C-stratum and woody stem densities. Thewoody species most significantly impacted was Populus tremuloides. In all treatments, the C-stratum was reduced from an average cover of 59 percent in the control plots to 15 percent orless (Table 14). Rome double disking was the more effective treatment for reducing andmaintaining low levels of Populus tremuloides cover, when the two years difference in treatmenttimes is taken into consideration (e.g., disking in 1987 and brushsawing or chemical treatmentin 1989). The use of 4 kg/ha of hexazinone eliminated more B-stratum cover than a 2 kg/ha doseof hexazinone or mechanical treatment (Table 16). The species associated with this reductionwere probably Populus tremuloides and Salix spp. based on stem numbers, although they werenot specifically recognized in Table 16. All treatments except the brushsawing had a moderatereduction in the amount of foliar cover in the A-stratum. Increases occurred in bryophyte coverwithin the 4 kg/ha hexazinone and brushsawing treatments, and to a lesser extent in the Romedouble disking plot.
Within the hexazinone treatment plots, several understory species had decreased cover valuesrelative to the control vegetation. In addition, a trend of decreased cover occurred with increasedhexazinone dosage levels (Table 16). The most severely impacted herb species wasCalamagrostis canadensis which was reduced from a median cover value of 15 percent to lessthan 2 percent. Rosa acicularis was also substantially reduced in cover in the 4 kg/ha hexazinonetreatment plots. Several species in the hexazinone treatment plots had increased cover levelsrelative to the control vegetation: Achillea millefolium, Agropyron trachycaulum, Bromus ciliatus,Corpus canadensis, Galium boreale, Symphoricarpos albus, and Taraxacurn officinale. Many ofthese species are often associated with disturbance sites and/or open-canopied forest stands.Despite the impacts of Rome double disking and brushsawing on the structure of the native plantcommunity, the effects of these treatments on the herbaceous vegetation were less severe thanchemical treatment (Table 16). Czekanowski's Index of Similarity indicates that the 4 kg/hahexazinone plots had the least amount of compositional similarity among the tested treatment andcontrol plots (Table 15).
The results of a cluster analysis based on 598 quadrats from the Conifer Release treatment blocksare presented in Figure 10. Three broad groupings of quadrats were identified within thedendrogram:
Closed-canopied (juvenile) forest quadrats (Cluster 1)Open-canopied (juvenile) forest and tall shrub quadrats (Clusters 2, 3, 4, 5, and 6)
C. Herb-dominated quadrats (Clusters 7, 8, and 9)
77
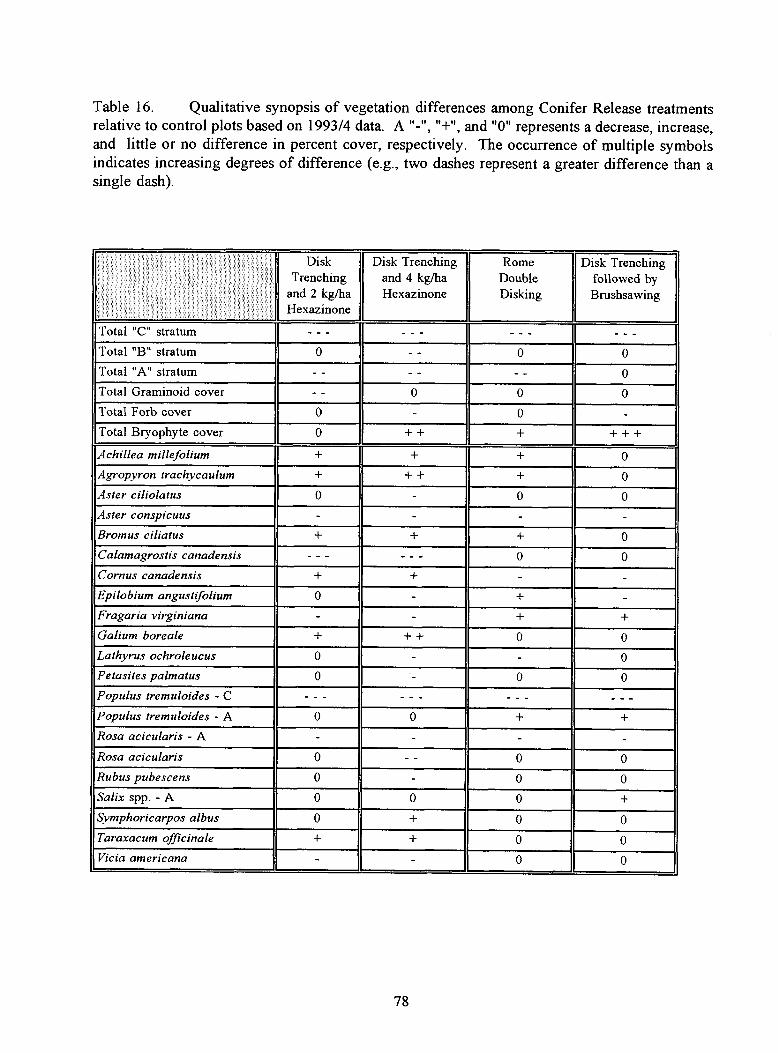
Table 16. Qualitative synopsis of vegetation differences among Conifer Release treatmentsrelative to control plots based on 1993/4 data. A "-", "+", and "0" represents a decrease, increase,and little or no difference in percent cover, respectively. The occurrence of multiple symbolsindicates increasing degrees of difference (e.g., two dashes represent a greater difference than asingle dash).
DiskTrenching
and 2 kg/haHexazinone
Disk Trenchingand 4 kg/haHexazinone
RomeDoubleDisking
Disk Trenchingfollowed byBrushsawing
Total "C" stratum --- --- --- -- - -
Total "B" stratum 0 - - 0 0Total "A" stratum - - - - - - 0Total Graminoid cover - - 0 0 0Total Forb cover 0 - 0 -Total Bryophyte cover 0 + + + + + +
Achillea millefolium + + + 0Agropyron trachycaulum + + + + 0Aster ciliolatus 0 - 0 0Aster conspicuus - - - -
Bromus ciliatus + + + 0Calamagrostis canadensis - - - - - - 0 0Cornus canadensis + + - -
Epilobium angustifolium 0 - + -
Fragaria virginiana - - + +
Galium boreale + + + 0 0Lathyrus ochroleucus 0 - - 0Petasites palmatus 0 0 0Populus tremuloides - C - - - - - - - - - - - -
Populus tremuloides - A 0 0 + +Rosa acicularis - A - - - -
Rosa acicularis 0 - - 0 0Rubus pubescens 0 - 0 0Salix spp. - A 0 0 0 +Symphoricarpos albus 0 + 0 0Taraxacum officinale + + 0 0Vicia americana - - 0 0
78
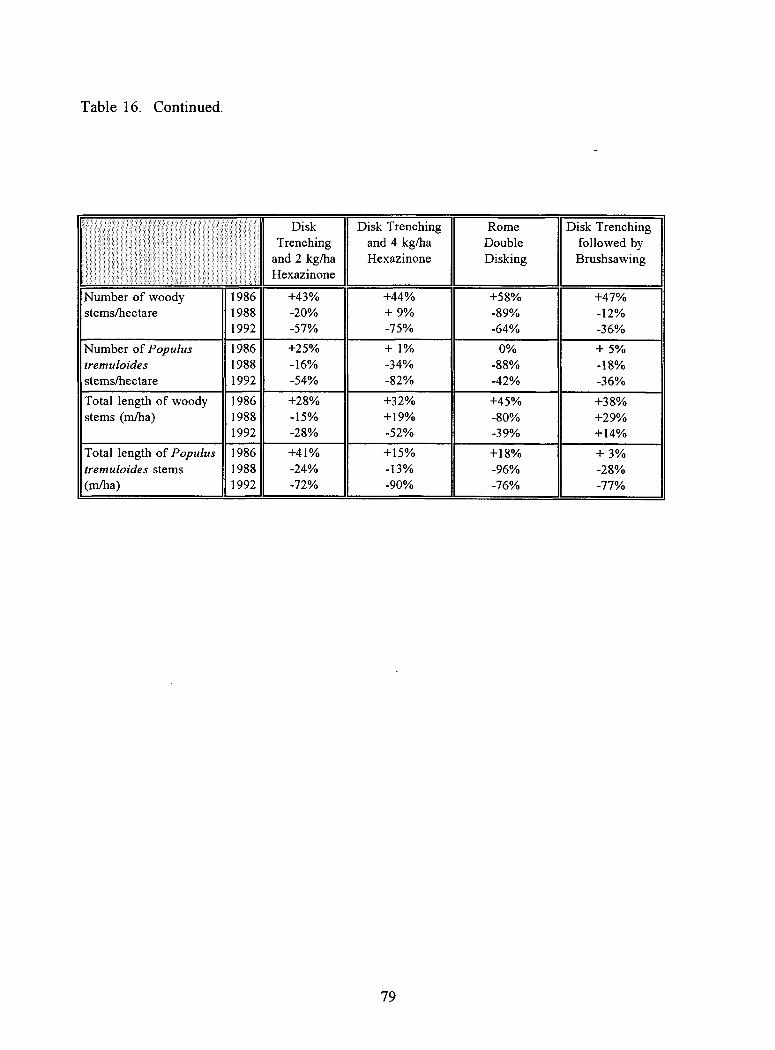
Table 16. Continued.
DiskTrenching
and 2 kg/haHexazinone
Disk Trenchingand 4 kg/haHexazinone
RomeDoubleDisking
Disk Trenchingfollowed byBrushsawing
Number of woody 1986 +43% +44% +58% +47%stems/hectare 1988 -20% + 9% -89% -12%
1992 -57% -75% -64% -36%
Number of Populus 1986 +25% + 1% 0% + 5%tremuloides 1988 -16% -34% -88% -18%stems/hectare 1992 -54% -82% -42% -36%
Total length of woody 1986 +28% +32% +45% +38%stems (m/ha) 1988 -15% +19% -80% +29%
1992 -28% -52% -39% +14%
Total length of Populus 1986 +41% +15% +18% + 3%tremuloides stems 1988 -24% -13% -96% -28%(m/ha) 1992 -72% -90% -76% -77%
79
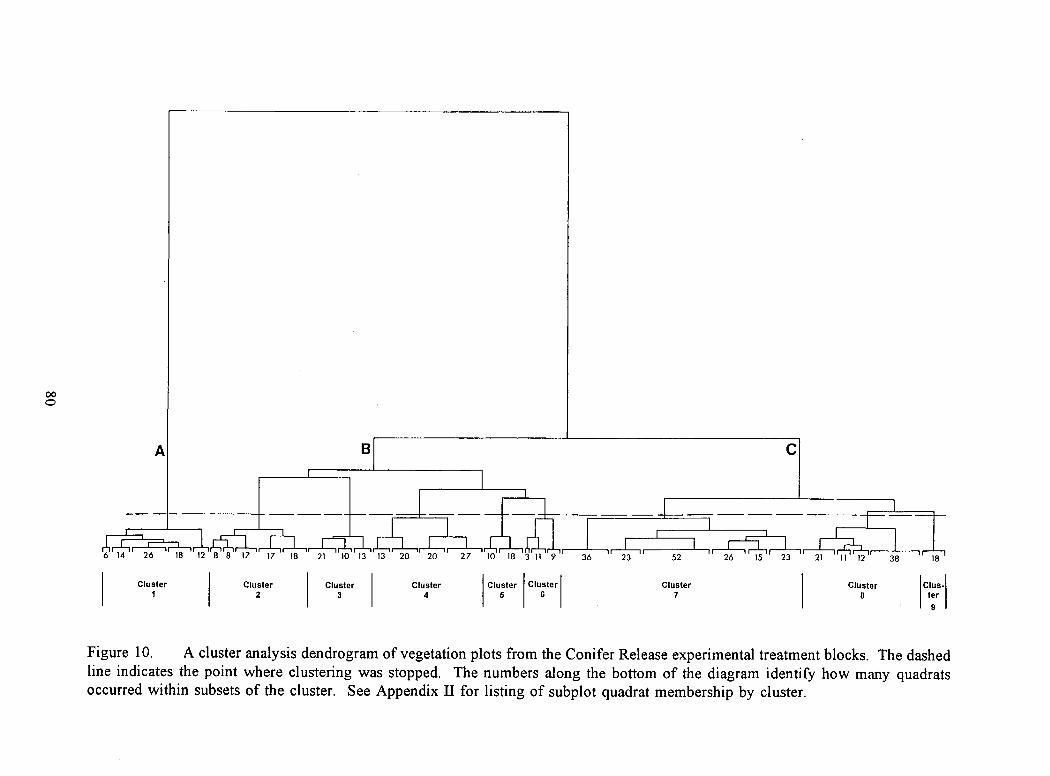
26 15 23 21 11 12 38
Cluster8
ril r--1 1---11-1-114 26 18 12 8 8 17 17 18
1
ri—u—l---D—u 1-1-1121 10 13 13 20 20 27 10 18 3 11 9--1 1 36 1 23
1
52 LI
Cluster1
Cluster2
Cluster3
Cluster4
Cluster5
Cluster6
Cluster7
18
Clus-ter9
I
I
Figure 10. A cluster analysis dendrogram of vegetation plots from the Conifer Release experimental treatment blocks. The dashedline indicates the point where clustering was stopped. The numbers along the bottom of the diagram identify how many quadratsoccurred within subsets of the cluster. See Appendix H for listing of subplot quadrat membership by cluster.
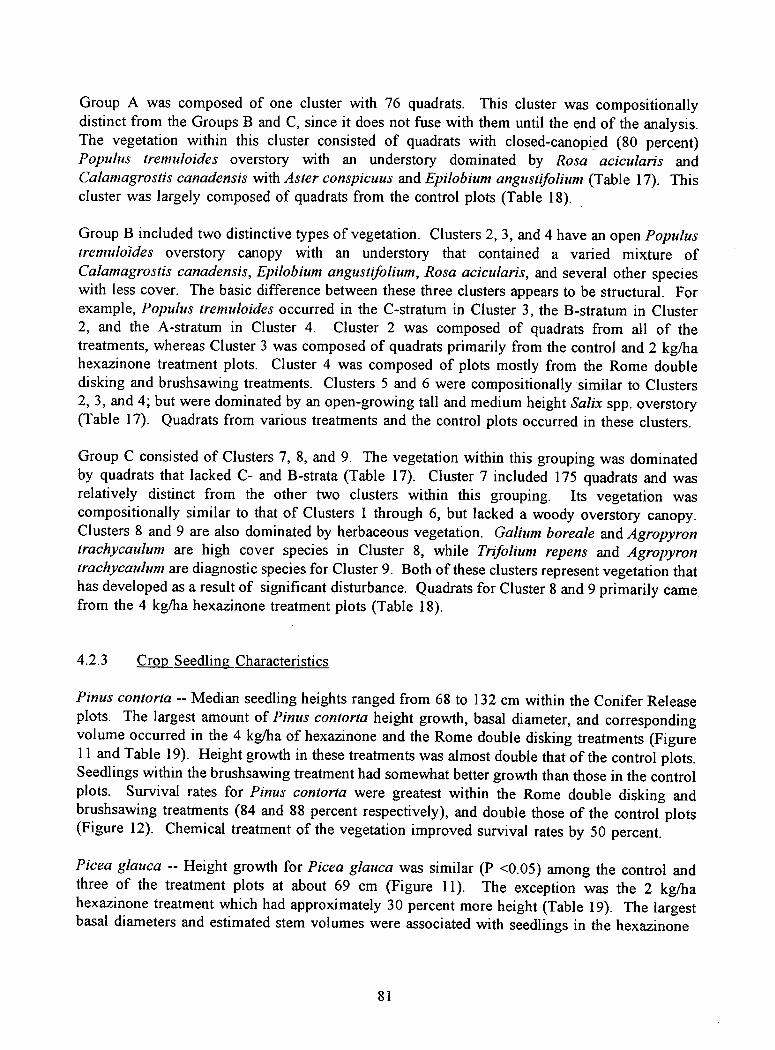
Group A was composed of one cluster with 76 quadrats. This cluster was compositionallydistinct from the Groups B and C, since it does not fuse with them until the end of the analysis.The vegetation within this cluster consisted of quadrats with closed-canopied (80 percent)Populus tremuloides overstory with an understory dominated by Rosa acicularis andCalamagrostis canadensis with Aster conspicuus and Epilobium angustifolium (Table 17). Thiscluster was largely composed of quadrats from the control plots (Table 18).
Group B included two distinctive types of vegetation. Clusters 2, 3, and 4 have an open Populustremuloides overstory canopy with an understory that contained a varied mixture ofCalamagrostis canadensis, Epilobium angustifohum, Rosa acicularis, and several other specieswith less cover. The basic difference between these three clusters appears to be structural. Forexample, Populus tremuloides occurred in the C-stratum in Cluster 3, the B-stratum in Cluster2, and the A-stratum in Cluster 4. Cluster 2 was composed of quadrats from all of thetreatments, whereas Cluster 3 was composed of quadrats primarily from the control and 2 kg/hahexazinone treatment plots. Cluster 4 was composed of plots mostly from the Rome doubledisking and brushsawing treatments. Clusters 5 and 6 were compositionally similar to Clusters2, 3, and 4; but were dominated by an open-growing tall and medium height Salix spp. overstory(Table 17). Quadrats from various treatments and the control plots occurred in these clusters.
Group C consisted of Clusters 7, 8, and 9. The vegetation within this grouping was dominatedby quadrats that lacked C- and B-strata (Table 17). Cluster 7 included 175 quadrats and wasrelatively distinct from the other two clusters within this grouping. Its vegetation wascompositionally similar to that of Clusters 1 through 6, but lacked a woody overstory canopy.Clusters 8 and 9 are also dominated by herbaceous vegetation. Gahm boreale and Agropyrontrachycaulum are high cover species in Cluster 8, while Trifolium repens and Agropyrontrachycaulum are diagnostic species for Cluster 9. Both of these clusters represent vegetation thathas developed as a result of significant disturbance. Quadrats for Cluster 8 and 9 primarily camefrom the 4 kg/ha hexazinone treatment plots (Table 18).
4.2.3 Crop Seedling Characteristics
Pinus contorta -- Median seedling heights ranged from 68 to 132 cm within the Conifer Releaseplots. The largest amount of Pinus contorta height growth, basal diameter, and correspondingvolume occurred in the 4 kg/ha of hexazinone and the Rome double disking treatments (Figure11 and Table 19). Height growth in these treatments was almost double that of the control plots.Seedlings within the brushsawing treatment had somewhat better growth than those in the controlplots. Survival rates for Pinus contorta were greatest within the Rome double disking andbrushsawing treatments (84 and 88 percent respectively), and double those of the control plots(Figure 12). Chemical treatment of the vegetation improved survival rates by 50 percent.
Picea glauca -- Height growth for Picea glauca was similar (P <0.05) among the control andthree of the treatment plots at about 69 cm (Figure 11). The exception was the 2 kg/hahexazinone treatment which had approximately 30 percent more height (Table 19). The largestbasal diameters and estimated stem volumes were associated with seedlings in the hexazinone
81
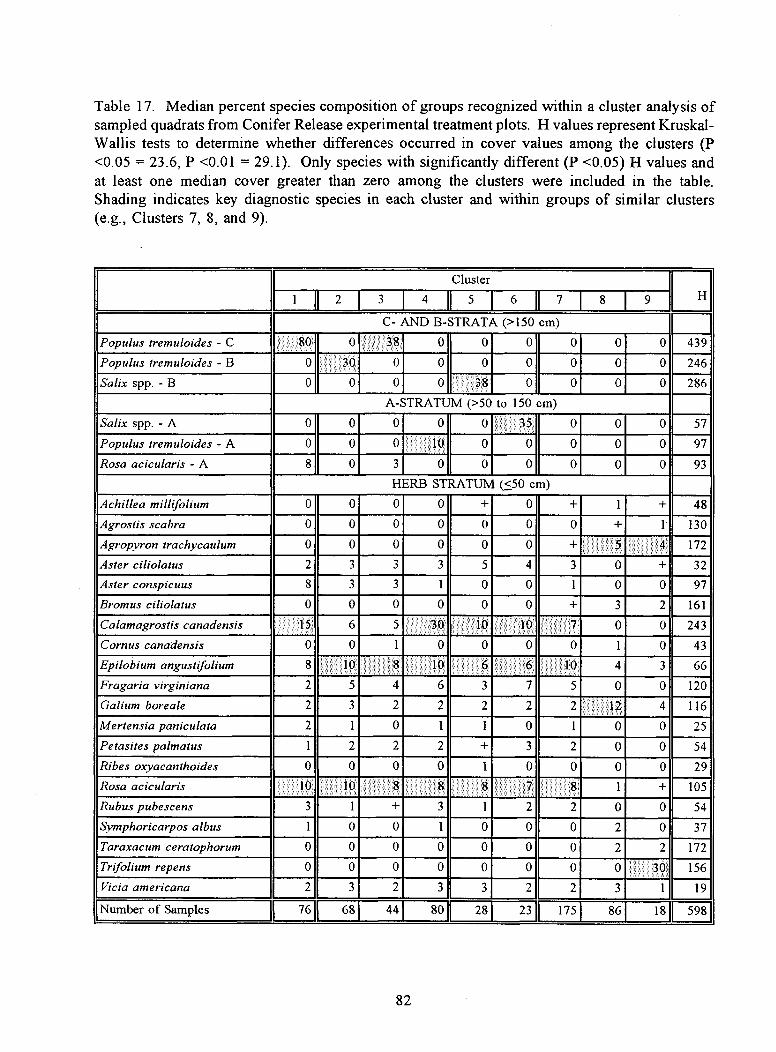
Table 17. Median percent species composition of groups recognized within a cluster analysis ofsampled quadrats from Conifer Release experimental treatment plots. H values represent Kruskal-Wallis tests to determine whether differences occurred in cover values among the clusters (P<0.05 = 23.6, P <0.01 = 29.1). Only species with significantly different (P <0.05) H values andat least one median cover greater than zero among the clusters were included in the table.Shading indicates key diagnostic species in each cluster and within groups of similar clusters(e.g., Clusters 7, 8, and 9).
ClusterH1 11 2 1 3 1 4 11 5 1 6 11 7 1 8 1 9
C- AND B-STRATA (>150 cm)
Populus tremuloides - C 80 0 38 0 0 0 0 0 0 439Populus tremuloides - B 30 0 0 0 0 0 0 0 246Salix spp. - B 0 0 0 0 38 0 0 0 2860
A-STRATUM (>50 to 150 cm)Salix spp. - A 0 0 0 0 0 35 0 0 0 57Populus tremuloides - A 0 0 0 10 0 0 0 0 0 97Rosa acicularis - A 8 0 3 0 0 0 0 0 0 93
HERB STRATUM (<50 cm)Achillea millifolium 0 0 0 0 + 0 + 1 + 48Agrostis scabra 0 0 0 0 0 0 0 + I' 130Agropyron trachycaulum 0 0 0 0 0 0 + 5 4. 172Aster ciliolatus 2 3 3 3 5 4 3 0 + 32Aster conspicuus 8 3 3 1 0 0 1 0 0 97Bromus ciliolatus 0 0 0 0 0 0 + 3 2 161Calamagrostis canadensis 15 6 5 30 10 10 7 0 0 243Corpus canadensis 0 0 1 0 0 0 0 1 0 43Epilobium angustifolium 8 10 10 10 4 3 66Fragaria virginiana 2 5 4 6 3 7 5 0 0 120Galium boreale 2 3 2 2 2 2 2 12 4 116Mertensia paniculata 2 1 0 1 1 0 1 0 0 25Petasites palmatus 1 2 2 2 + 3 2 0 0 54Ribes oxyacanthoides 0 0 0 0 1 0 0 0 0 29Rosa acicularis 10 10 1 + 105Rubus pubescens 3 1 + 3 1 2 2 0 0 54Symphoricarpos albus 1 0 0 1 0 0 0 2 0 37Taraxacum ceratophorum 0 0 0 0 0 0 0 2 2 172Trifolium repens 0 0 0 0 0 0 0 0 30 156Vicia americana 2 3 2 3 3 2 2 3 1 19
Number of Samples 76 I 68 44 801 28 231 1751 86 18 598
82
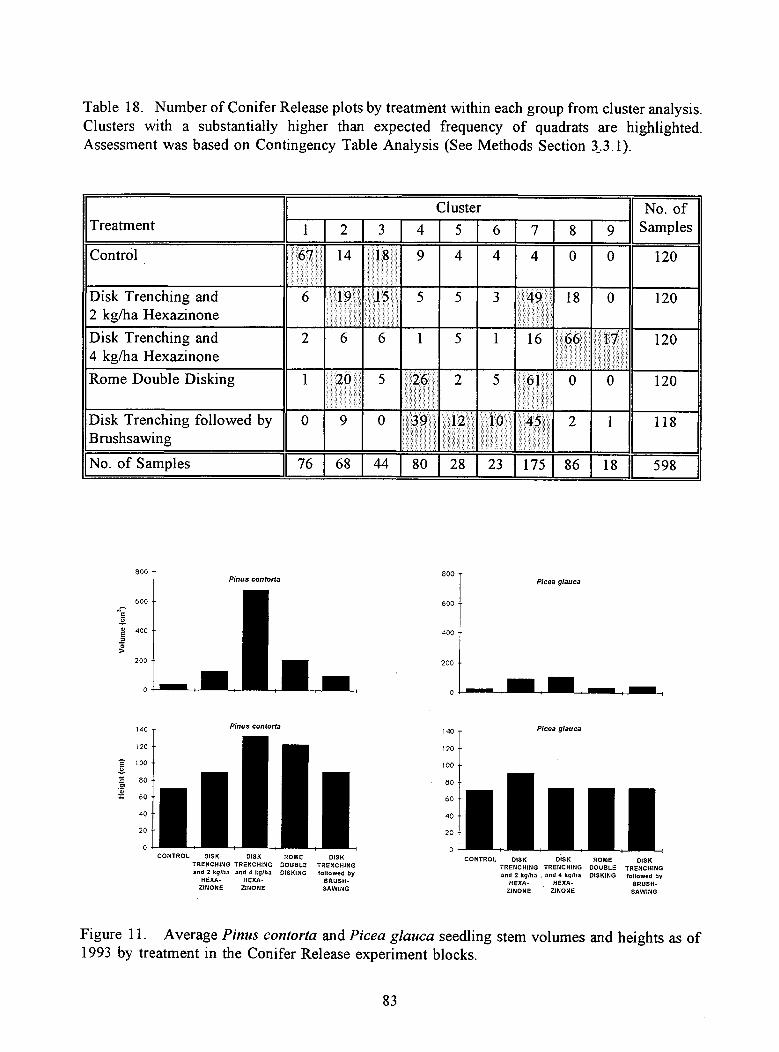
Table 18. Number of Conifer Release plots by treatment within each group from cluster analysis.Clusters with a substantially higher than expected frequency of quadrats are highlighted.Assessment was based on Contingency Table Analysis (See Methods Section 3.3.1).
TreatmentCluster No. of
1 2 3 4 5 6 7 8 9 Samples
Control 67 14 18 9 4 4 4 0 0 120
Disk Trenching and2 kg/ha Hexazinone
6 19 15 5 5 3 49 18 0 120
Disk Trenching and4 kg/ha Hexazinone
2 6 6 1 5 1 16 66 17 120
Rome Double Disking 1 20 5 26 2 5 61 0 0 120
Disk Trenching followed byBrushsawing
0 9 0 39 12 10 45 2 1 118
No. of Samples 76 68 44 80 28 23 175 86 18 598
800Pinus contorts mi
600
400
200
0
800 - Picea glauca
E
600
400
200
0
140 Pinus contorta140
120
100
Picea glauca
120
100
80
7;= 60
4 0
20
0
80
60
40
20
0CONTROL DISK DISK ROME DISK
TRENCHING TRENCHING DOUBLE TRENCHING
and 2 kg/ha and 4 kg/ha DISKING followed byHEXA- HEXA- BRUSH-
ZINONE ZINONE SAWING
CONTROL DISK DISK ROME DISKTRENCHING TRENCHING DOUBLE TRENCHINGand 2 kg/ha . and 4 kg/ha DISKING followed by
HEXA- HEXA- BRUSH-ZINONE ZINONE SAWING
Figure 11. Average Pinus conorta and Picea glauca seedling stem volumes and heights as of1993 by treatment in the Conifer Release experiment blocks.
83
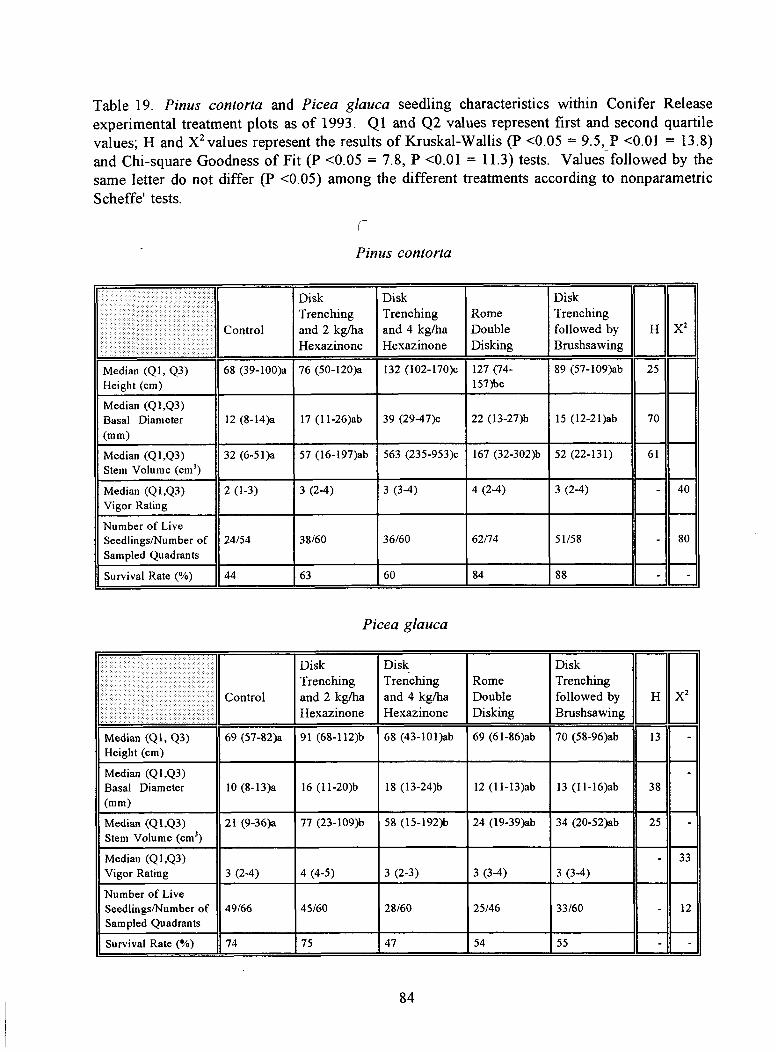
Table 19. Pinus contorta and Picea glauca seedling characteristics within Conifer Releaseexperimental treatment plots as of 1993. Q1 and Q2 values represent first and second quartilevalues; H and X 2 values represent the results of Kruskal-Wallis (P <0.05 = 9.5, P <0.01 = 13.8)and Chi-square Goodness of Fit (P <0.05 = 7.8, P <0.01 = 11.3) tests. Values followed by thesame letter do not differ (P <0.05) among the different treatments according to nonparametricScheffe' tests.
I-
Pinus contorta
Control
DiskTrenchingand 2 kg/haHexazinone
DiskTrenchingand 4 kg/haHexazinone
RomeDoubleDisking
DiskTrenchingfollowed byBrushsawing
H X2
Median (Q1, Q3) 68 (39-100)a 76 (50-120)a 132 (102-170)c 127 (74- 89 (57-109)ab 25Height (cm) 157)bc
Median (Q1,Q3)Basal Diameter(mm)
12 (8-14)a 17 (11-26)ab 39 (29-47)c 22 (13-27)b 15 (12-21)ab 70
Median (Q1,Q3) 32 (6-51)a 57 (16-197)ab 563 (235-953)c 167 (32-302)b 52 (22-131) 61Stem Volume (cm3)
Median (Q1,Q3) 2 (1-3) 3 (2-4) 3 (3-4) 4 (2-4) 3 (2-4) - 40Vigor Rating
Number of LiveSeedlings/Number of 24/54 38/60 36/60 62/74 51/58 - 80Sampled Quadrants
Survival Rate (%) 44 63 60 84 88 . - -
Picea glauca
Control
DiskTrenchingand 2 kg/haHexazinone
DiskTrenchingand 4 kg/haHexazinone
RomeDoubleDisking
DiskTrenchingfollowed byBrushsawing
H X2
Median (Q1, Q3)Height (cm)
69 (57-82)a 91 (68-112)b 68 (43-101)ab 69 (61-86)ab 70 (58-96)ab 13 -
Median (Q1,Q3)Basal Diameter(mm)
10 (8-13)a 16 (11-20)b 18 (13-24)6 12 (11-13)ab 13 (11-16)ab 38-
Median (Q1,Q3)Stem Volume (cm3)
21 (9-36)a 77 (23-109)b 58 (15-192)b 24 (19-39)ab 34 (20-52)ab 25 -
Median (Q1,Q3)Vigor Rating 3 (2-4) 4 (4-5) 3 (2-3) 3 (3-4) 3 (3-4)
- 33
Number of LiveSeedlings/Number ofSampled Quadrants
49/66 45/60 28/60 25/46 33/60 - 12
Survival Rate (%) 74 75 47 54 55 - -
84

Pinus contorta
treatment plots. Vigor appeared to be greatest within the 2 kg/ha hexazinone treatment whichalso had a survival rate of 75 percent. Only the control vegetation had a similar level of survival(Figure 12), while the treatments were substantially lower (i.e., 45 to 55 percent).
An analysis of cover values according to relative seedling height growth categories indicated thatsignificant (P <0.05) differences were present in the Conifer Release data. For example, anegative relationship appears to exist between Pinus contorta growth and the amount of coverassociated with the C-stratum (Populus tremuloides), Aster conspicuus, Calamagrostis canadensis,Lonicei-a involucrata, and Mertensia paniculata (Table 20). The latter two species have relativelylow cover values compared to the other species. A positive association was found for twospecies: Agrostis scabra and Trifolium repens. Fewer associations were found when Piceaglauca was analyzed. Calamagrostis canadensis and Petasites palmatus abundance wasnegatively associated with growth, while Bromus ciliatus cover increased with increasing Piceaglauca growth rates (Table 20).
100
90
60
70
60
50
20
10
0
100
90
60
70
60
50
40
JO
20
0
0
Picea glauca
CONTROL DISK DISK ROME
DISK CONTROL DISK DISK ROME
DISKTRENCHING TRENCHING DOUBLE TRENCHING
TRENCHING TRENCHING DOUBLE
TRENCHING
and 2 kg/ha and 4 kg/ha DISKING followed by and 2 kglha and 4 kglha DISKING followed byHEXA- HEXA- BRUSH- HEXA- • HEXA- BRUSH-
ZINONE ZINONE SAWING ZINONE ZINONE SAWING
Figure 12. Comparison of Pinus contorta and Picea glauca survival rates as of 1993 bytreatment in the Conifer Release experimental blocks.
85
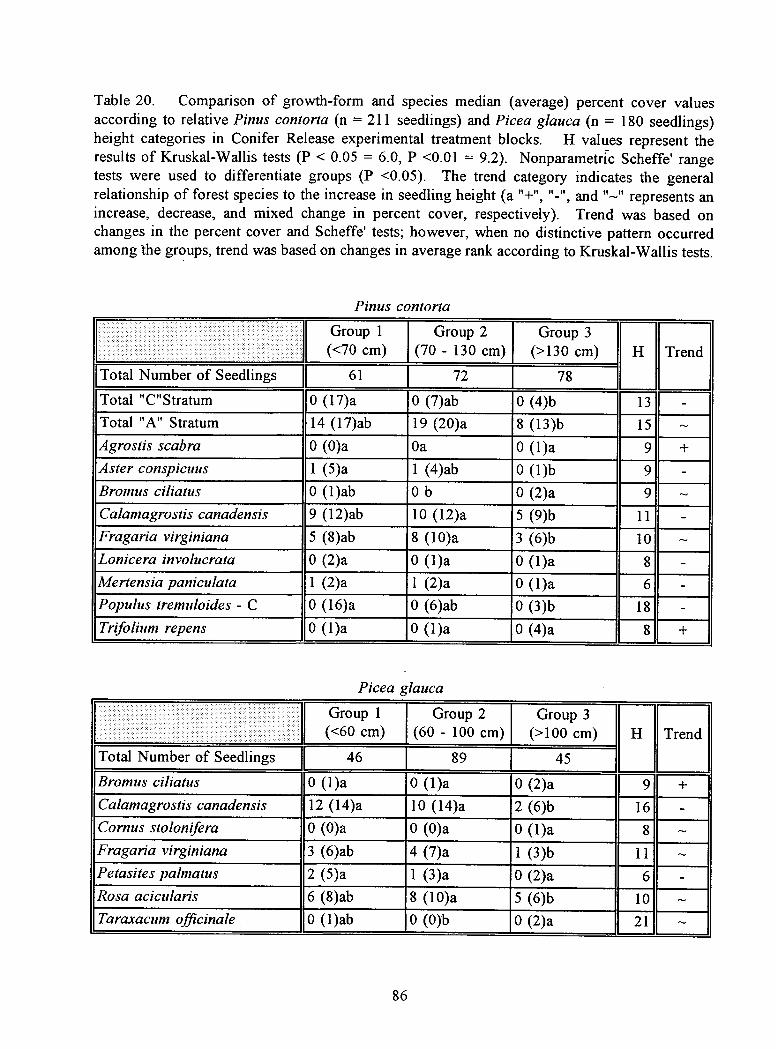
Table 20. Comparison of growth-form and species median (average) percent cover valuesaccording to relative Pinus contorta (n = 211 seedlings) and Picea glauca (n = 180 seedlings)height categories in Conifer Release experimental treatment blocks. H values represent theresults of Kruskal-Wallis tests (P < 0.05 = 6.0, P <0.01 = 9.2). Nonparametric Scheffe' rangetests were used to differentiate groups (P <0.05). The trend category indicates the generalrelationship of forest species to the increase in seedling height (a "+", "-", and "—" represents anincrease, decrease, and mixed change in percent cover, respectively). Trend was based onchanges in the percent cover and Scheffe' tests; however, when no distinctive pattern occurredamong the groups, trend was based on changes in average rank according to Kruskal-Wallis tests.
Pinus contorta
Group 1(<70 cm)
Group 2(70 - 130 cm)
Group 3(>130 cm) H Trend
Total Number of Seedlings II 61 72 78
Total "C"Stratum 0 (17)a 0 (7)ab 0 (4)b 13 -Total "A" Stratum 14 (17)ab 19 (20)a 8 (13)b 15Agrostis scabra 0 (0)a Oa 0 (1)a 9 +Aster conspicuus 1 (5)a 1 (4)ab 0 (1)b 9 -Bromus ciliatus 0 (1)ab 0 b 0 (2)a 9Calamagrostis canadensis 9 (12)ab 10 (12)a 5 (9)b 11 -Fragaria virginiana 5 (8)ab 8 (10)a 3 (6)b 10Lonicera involucrata 0 (2)a 0 (1)a 0 (1)a 8 -Mertensia paniculata 1 (2)a 1 (2)a 0 (1)a 6 -Poplins tremuloides - C 0 (16)a 0 (6)ab 0 (3)b 18 -Tnfolium repens 0 (1)a 0 (1)a 0 (4)a 8 +
Picea glauca
Group 1(<60 cm)
Group 2(60 - 100 cm)
Group 3(>100 cm) H Trend
Total Number of Seedlings I 46 89 45
Bromus ciliatus 0 (1)a 0 (1)a 0 (2)a 9 +Calamagrostis canadensis 12 (14)a 10 (14)a 2 (6)b 16 -Cornus stolonifera 0 (0)a 0 (0)a 0 (1)a 8Fragaria virginiana 3 (6)ab 4 (7)a 1 (3)b 11 —Petasites palmatus 2 (5)a 1 (3)a 0 (2)a 6 -Rosa acicularis 6 (8)ab 8 (10)a 5 (6)b 10 —Taraxacum officinale 0 (1)ab 0 (0)b 0 (2)a 21
86
5.0 A PRELIMINARY ANALYSIS OF COMPETITION VARIABLES
The following sections contain results of analyses of selected variables used in the assessmentof competition between coniferous crop seedlings and native vegetation. The objectives of theseanalyses were:
To test selected competition variables and indices to determine which was best- related to the growth of Pinus contorta and Picea glauca seedlings.
To assess how the competition variables differed in different Site Preparation andConifer Release treatments.
3. To determine which variables were the best indicators of crop seedling growth.
The competition variables included the height and basal diameters of the nearest and tallestPopulus tremuloides; and nearest woody shrub greater than 50 cm tall within 180 cm of the cropseedlings as well as the distance between their stem bases. Several competition indices for Pinuscontorta were calculated based on previous analyses by Navratil and MacIsaac (1993). 4 Becausethis study was not specifically designed for the calculation of these indices, it was necessary tomodify the formulas in some cases to accommodate the available data (Table 21). These indiceswere applied to both Pinus contorta and Picea glauca, except Re1HT2 which was applied onlyto Picea glauca seedlings.
Other variables were added to these analyses such as percent cover of various growth-forms (e.g.,total C-stratum cover) and selected species that showed a significant (P <0.05) difference inabundance according to crop seedling height classes based on previously summarized analyses(See Tables 11, 12, and 20).
In addition to the summarization of competition variable values and calculation of indices, simpleand multiple regression models were developed to predict crop seedling height based on thevarious competition variables (e.g., distance to nearest Populus tremuloides), species cover, andstem density data; and the Competition Indices, excluding Re1HT2 which had seedling height asa formula variable (Table 21). It was assumed that the amount of seedling growth was at leastin part influenced by the degree of competition experienced by the seedling. However, this andrelated analyses were abandoned because most variables or combination of variables producedcorrelation coefficients which were not statistically significant (P <0.05) or did not account fora large percent of the variance with the exception of selected Competition Indices. Many of theCompetition Indices when used as independent variables in the simple and multiple regressionsproduced significant models with moderate to strong correlations (i.e., r = 0.60 to 0.87 or 36 to76 percent variance explanation). However, all the calculated Competition Indices except CI-3used the basal diameter of the crop seedling as a denominator in the formula and basal diameteris strongly correlated with seedling height (e.g., r = +0.87 for Pinus contorta ).
4 Indices suggested by Stan Navratil, Canadian Forest Service, Northern Forest Centre,Edmonton, Alberta.
87

Table 21. Formulae for calculating Competition Indices (CI) as applied to Site Preparation andConifer Release experimental block data.
CI - 1 (tallest P. tremuloides)' = Tallest Populus tremuloides - Conifer seedling heightTallest Populus tremuloides stem to Conifer seedling stem distance
CI - 1 (nearest P. tremuloides)' = Nearest Populus tremuloides - Conifer seedling height Nearest Populus tremuloides stem to Conifer seedling stem distance
CI - 3 (P. tremuloides - C)' = Percent Cover of Populus tremuloides(Distance to Nearest Populus tremuloides)2
CI - 3 (P. tremuloides - B)' = Percent Cover of Populus tremuloides(Distance to Nearest Populus tremuloides)2
CI - 4' =
CI - 5' =
CI - 6' =
ReIHTV =
Nearest Populus tremuloides basal diameter/Conifer basal diameterPopulus tremuloides stem to Conifer seedling stem distance
Nearest Populus tremuloides basal diameter Conifer seedling basal diameter
Tallest Populus tremuloides basal diameterConifer seedling basal diameter
Conifer seedling height Height of tallest Populus tremuloides
' Data adapted to formula developed by Navratil and MacIsaac (1993).2 Index suggested by Dan MacIsaac, Canadian Forest Service, Northern Forest Centre,
Edmonton, Alberta.
5.1 Site Preparation Experiment Blocks
5.1.1 Pinus contorta Crop Seedlings
A comparison of the competition and other related variables by treatment identified severalstatistically significant (P <0.05) differences within the Site Preparation experimental block data(Table 22). In many cases, the greatest distances between a tree or a shrub and the Pinuscontorta seedlings, the fewest and least amount of woody stems, and the smallest tree basaldiameter were associated with the Rome double disking treatment, while the reverse occurred inthe control and disk trenching treatments and sometimes the 2 kg/ha hexazinone treatment plots.
88
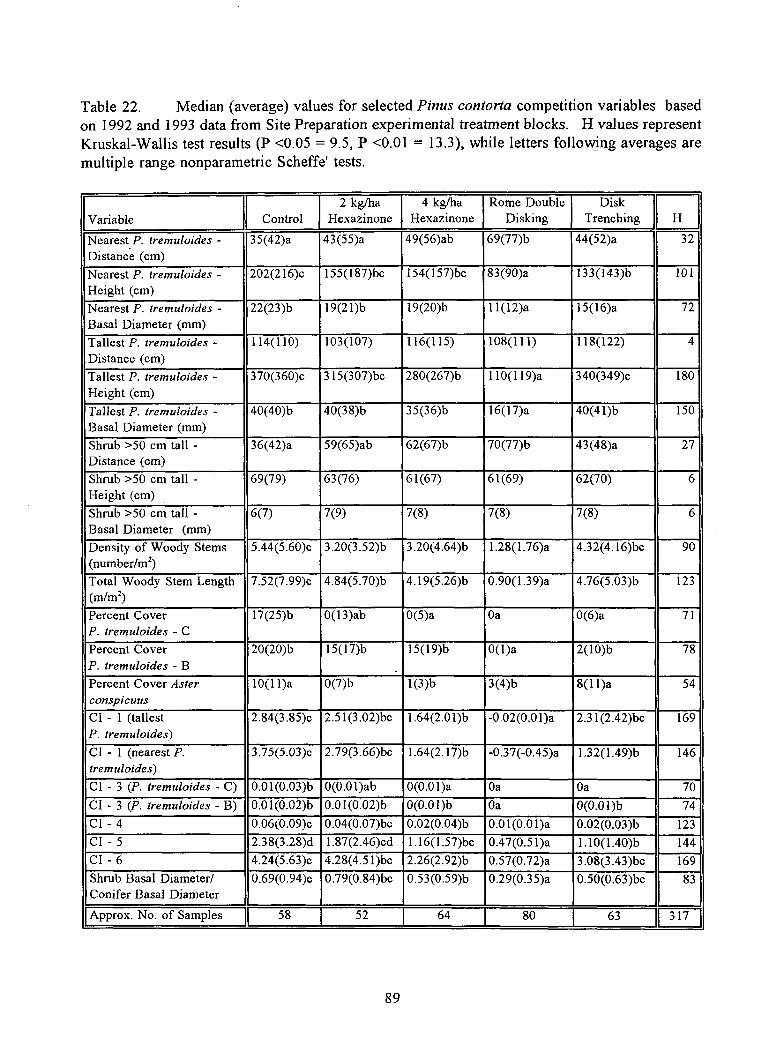
Table 22. Median (average) values for selected Pinus contorta competition variables basedon 1992 and 1993 data from Site Preparation experimental treatment blocks. H values representKruskal-Wallis test results (P <0.05 = 9.5, P <0.01 = 13.3), while letters following averages aremultiple range nonparametric Scheffe' tests.
Variable Control2 kg/ha
Hexazinone4 kg/ha
HexazinoneRome Double
DiskingDisk
Trenching , H
Nearest P. tremuloides -Distance (cm)
35(42)a 43(55)a 49(56)ab 69(77)b 44(52)a 32
Nearest P. tremuloides -Height (cm)
202(216)c 155(187)bc 154(157)bc 83(90)a 133(143)b 101
Nearest P. tremuloides -Basal Diameter (mm)
22(23)b 19(21)b 19(20)b 11(12)a 15(16)a 72
Tallest P. tremuloides -Distance (cm)
114(110) 103(107) 116(115) 108(111) 118(122) 4
Tallest P. tremuloides -Height (cm)
370(360)c 315(307)bc 280(267)b 110(119)a 340(349)c 180
Tallest P. tremuloides -Basal Diameter (mm)
40(40)b 40(38)b 35(36)b 16(17)a 40(41)b 150
Shrub >50 cm tall -Distance (cm)
36(42)a 59(65)ab 62(67)b 70(77)b 43(48)a 27
Shrub >50 cm tall -Height (cm)
69(79) 63(76) 61(67) 61(69) 62(70) 6
Shrub >50 cm tall -Basal Diameter (mm)
6(7) 7(9) 7(8) 7(8) 7(8) 6
Density of Woody Stems(number/m2)
5.44(5.60)c 3.20(3.52)b 3.20(4.64)b 1.28(1.76)a 4.32(4.16)bc 90
Total Woody Stem Length(m/m2)
7.52(7.99)c 4.84(5.70)b 4.19(5.26)b 0.90(1.39)a 4.76(5.03)b 123
Percent CoverP. tremuloides - C
17(25)b 0(13)ab 0(5)a Oa 0(6)a 71
Percent CoverP. tremuloides - B
20(20)b 15(17)b 15(19)b 0(1)a 2(10)b 78
Percent Cover Asterconspicuus
10(11)a 0(7)b 1(3)b 3(4)b 8(11)a 54
CI - 1 (tallestP. tremuloides)
2.84(3.85)c 2.51(3.02)bc 1.64(2.01)b -0.02(0.01)a 2.31(2.42)bc 169
CI - 1 (nearest P.tremuloides)
3.75(5.03)c 2.79(3.66)bc I.64(2.17)b -0.37(-0.45)a 1.32(1.49)b 146
CI - 3 (P. tremuloides - C) 0.01(0.03)b 0(0.01)ab 0(0.01)a Oa Oa 70CI - 3 (P. tremuloides - B) 0.01(0.02)b 0.01(0.02)b 0(0.01)b Oa 0(0.01)b 74CI - 4 0.06(0.09)c 0.04(0.07)bc 0.02(0.04)b 0.01(0.01)a 0.02(0.03)b 123CI - 5 2.38(3.28)d 1.87(2.46)cd 1.16(1.57)bc 0.47(0.51)a 1.10(1.40)b 144CI - 6 4.24(5.63)c 4.28(4.51)bc 2.26(2.92)b 0.57(0.72)a 3.08(3.43)bc 169Shrub Basal Diameter/Conifer Basal Diameter
0.69(0.94)c 0.79(0.84)bc 0.53(0.59)b 0.29(0.35)a 0.50(0.63)bc 83
'Approx. No. of Samples 11 58 52 64 80 63 11 317 1
89
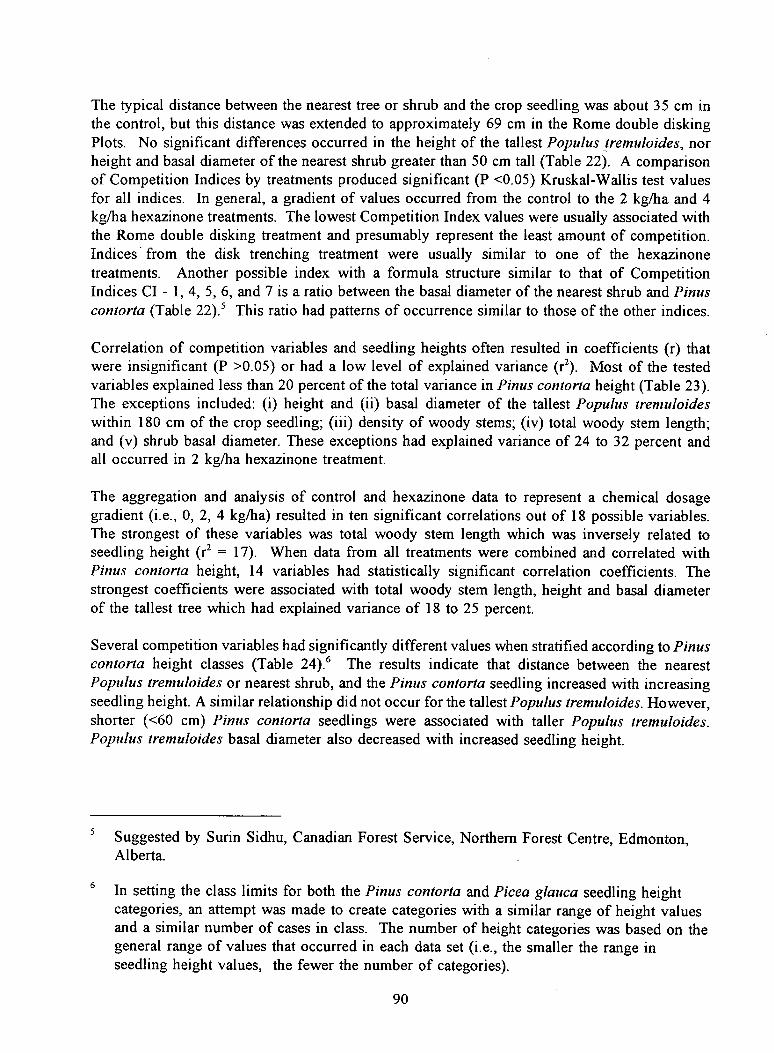
The typical distance between the nearest tree or shrub and the crop seedling was about 35 cm inthe control, but this distance was extended to approximately 69 cm in the Rome double diskingPlots. No significant differences occurred in the height of the tallest Populus tremuloides, norheight and basal diameter of the nearest shrub greater than 50 cm tall (Table 22). A comparisonof Competition Indices by treatments produced significant (P <0.05) Kruskal-Wallis test valuesfor all indices. In general, a gradient of values occurred from the control to the 2 kg/ha and 4kg/ha hexazinone treatments. The lowest Competition Index values were usually associated withthe Rome double disking treatment and presumably represent the least amount of competition.Indices from the disk trenching treatment were usually similar to one of the hexazinonetreatments. Another possible index with a formula structure similar to that of CompetitionIndices CI - 1, 4, 5, 6, and 7 is a ratio between the basal diameter of the nearest shrub and Pinuscontorta (Table 22). 5 This ratio had patterns of occurrence similar to those of the other indices.
Correlation of competition variables and seedling heights often resulted in coefficients (r) thatwere insignificant (P >0.05) or had a low level of explained variance (r 2). Most of the testedvariables explained less than 20 percent of the total variance in Pinus contorta height (Table 23).The exceptions included: (i) height and (ii) basal diameter of the tallest Populus tremuloideswithin 180 cm of the crop seedling; (iii) density of woody stems; (iv) total woody stem length;and (v) shrub basal diameter. These exceptions had explained variance of 24 to 32 percent andall occurred in 2 kg/ha hexazinone treatment.
The aggregation and analysis of control and hexazinone data to represent a chemical dosagegradient (i.e., 0, 2, 4 kg/ha) resulted in ten significant correlations out of 18 possible variables.The strongest of these variables was total woody stem length which was inversely related toseedling height (r 2 = 17). When data from all treatments were combined and correlated withPinus contorta height, 14 variables had statistically significant correlation coefficients. Thestrongest coefficients were associated with total woody stem length, height and basal diameterof the tallest tree which had explained variance of 18 to 25 percent.
Several competition variables had significantly different values when stratified according to Pinuscontorta height classes (Table 24).6 The results indicate that distance between the nearestPopulus tremuloides or nearest shrub, and the Pinus contorta seedling increased with increasingseedling height. A similar relationship did not occur for the tallest Populus tremuloides. However,shorter (<60 cm) Pinus contorta seedlings were associated with taller Populus tremuloides.Populus tremuloides basal diameter also decreased with increased seedling height.
Suggested by Surin Sidhu, Canadian Forest Service, Northern Forest Centre, Edmonton,Alberta.
6 In setting the class limits for both the Pinus contorta and Picea glauca seedling heightcategories, an attempt was made to create categories with a similar range of height valuesand a similar number of cases in class. The number of height categories was based on thegeneral range of values that occurred in each data set (i.e., the smaller the range inseedling height values, the fewer the number of categories).
90
Table 23. Summary of correlation coefficients of selected variables against Pinus contortaheights based on 1992 and 1993 data from Site Preparation experimental treatment blocks. A"*" and "*" indicates a coefficient that is significant at P <0.05 or P <0.01, respectively.
Variable Control
2 kg/haHexa-zinone
4 kg/haHexa-zinone
RomeDoubleDisking
DiskTrench-
ing
Control,2 and 4kg/haHexa-zinone
AllTreat-ments
Nearest P. tremuloides - Distance (cm) +0.03 +0.34* +0.14 +0.09 +0.17 +0.21** +0.30**
Nearest P. tremuloides - Height (cm) -0.03 -0.27* -0.13 +0.11 +0.09 -0.21** -0.34**Nearest P. tremuloides - Basal Diameter(mm)
-0.01 -0.18 -0.09 +0.17 +0.08 -0.13 -0.25**
Tallest P. tremuloides - Distance (cm) -0.07 +0.25 +0.08 +0.20 +0.10 +0.11 +0.10Tallest P. tremuloides - Height (cm) -0.02 -0.52** -0.23 +0.31* -0.15 -0.37** -0.50**
Tallest P. tremuloides - Basal Diameter(mm)
-0.05 -0.49** -0.24 +0.15 -0.15 -0.32** -0.48**
Shrub >50 cm tall - Distance (cm) +0.01 +0.19 +0.01 +0.15 +0.13 +0.12 +0.22**Shrub >50 cm tall - Height (cm) +0.11 +0.14 +0.08 +0.15 +0.01 +0.04 +0.01Shrub >50 cm tall - Basal Diameter(mm)
+0.06 +0.41** +0.26* +0.20 +0.06 +0.25** +0.16**
Density of Woody Stems (number/m2) -0.08 -0.56** -0.11 +0.09 -0.26 -0.22** -0.35**Total Woody Stem Length (m/m 2) -0.26 -0.57** -0.24 +0.24* -0.38** -0.41** -0.42**Percent Cover P. tremuloides - C +0.17 -0.38** -0.17 0.00 +0.18 -0.23** -0.25**Percent Cover P. tremuloides - B -0.06 -0.24 +0.01 +0.31** -0.03 -0.08 -0.25**Percent Cover Aster conspicuus -0.26 -0.27 +0.25 -0.15 -0.03 -0.21** -0.21**CI - 3 (P. tremuloides - C) +0.12 -0.29 -0.17 0 +0.09 -0.11 M.17**CI - 3 (P. tremuloides - B) -0.01 -0.15 -0.01 +0.29* -0.03 -0.08 -0.22**Approximate Number of Samples 58 52 64 80 63 174 317
91
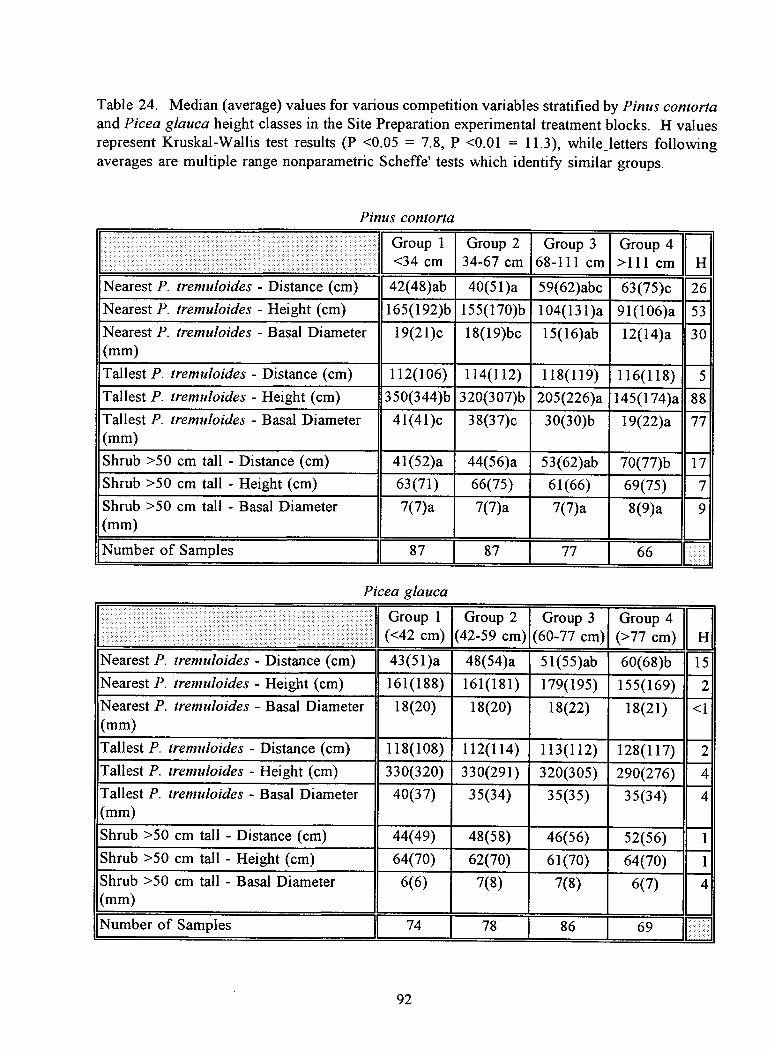
Table 24. Median (average) values for various competition variables stratified by Pinus contortaand Picea glauca height classes in the Site Preparation experimental treatment blocks. H valuesrepresent Kruskal-Wallis test results (P <0.05 = 7.8, P <0.01 = 11.3), while_letters followingaverages are multiple range nonparametric Scheffe' tests which identify similar groups.
Pinus contorta
Group 1<34 cm
Group 234-67 cm
Group 368-111 cm
Group 4>111 cm H
Nearest P. tremuloides - Distance (cm) 42(48)ab 40(51)a 59(62)abc 63(75)c 26Nearest P. tremuloides - Height (cm) 165(192)b 155(170)b 104(131)a 91(106)a 53Nearest P. tremuloides - Basal Diameter(mm)
19(21)c 18(19)bc 15(16)ab 12(14)a 30
Tallest P. tremuloides - Distance (cm) 112(106) 114(112) 1.18(119) 116(118) 5Tallest P. tremuloides - Height (cm) 350(344)b 320(307)b 205(226)a 145(174)a 88Tallest P. tremuloides - Basal Diameter(mm)
41(41)c 38(37)c 30(30)b 19(22)a 77
Shrub >50 cm tall - Distance (cm) 41(52)a 44(56)a 53(62)ab 70(77)b 17Shrub >50 cm tall - Height (cm) 63(71) 66(75) 61(66) 69(75) 7Shrub >50 cm tall - Basal Diameter(mm)
7(7)a 7(7)a 7(7)a 8(9)a 9
Number of Samples I 87 87 77 66
Picea glauca
Group 1(<42 cm)
Group 2(42-59 cm)
Group 3(60-77 cm)
Group 4(>77 cm) H
Nearest P. tremuloides - Distance (cm) 43(51)a 48(54)a 51(55)ab 60(68)b 15Nearest P. tremuloides - Height (cm) 161(188) 161(181) 179(195) 155(169) 2Nearest P. tremuloides - Basal Diameter(mm)
18(20) 18(20) 18(22) 18(21) <1
Tallest P. tremuloides - Distance (cm) 118(108) 112(114) 113(112) 128(117) 2Tallest P. tremuloides - Height (cm) 330(320) 330(291) 320(305) 290(276) 4Tallest P. tremuloides - Basal Diameter(mm)
40(37) 35(34) 35(35) 35(34) 4
Shrub >50 cm tall - Distance (cm) 44(49) 48(58) 46(56) 52(56) 1Shrub >50 cm tall - Height (cm) 64(70) 62(70) 61(70) 64(70) 1Shrub >50 cm tall - Basal Diameter(mm)
6(6) 7(8) 7(8) 6(7) 4
!Number of Samples0 74
78 86 69
92

Rosa acicularis (frequency 44 percent) and Amelanchier alnifolia (frequency 28 percent) werethe most commonly encountered woody shrubs greater than 50 cm tall and within 180 cm ofmeasured Pinus contorta seedlings. The most significant deviations from this general patternoccurred in the Rome double disk treatment where the frequency of Amelanchier alnifoliaequalled Rosa acicularis, and in the disk trenching treatment where Rosa acicularis frequencyreached 60 percent.
5.1.2 Picea glauca Crop Seedlings
Significant differences occurred in various variables such as the competition parameters, shrubheight, density and length of woody stems, and percent cover with respect to Picea glaucaheights in the Site Preparation treatment plots. In general, the control, disk trenching, 2 kg/haand sometimes 4 kg/ha hexazinone treatments had similar Populus tremuloides heights and basaldiameters. These same variables were smallest in the Rome double disking plots (Table 25).Within the control plots, the typical nearest Populus tremuloides was approximately 40 cm fromthe crop seedling and had a height of 212 cm. The height of the nearest Populus tremuloides inthe control and related treatments was typically twice that of its equivalent in the Rome doubledisking plots, while the distance between the nearest Populus tremuloides and the crop seedlingswas 20 to 30 percent greater in the Rome double disking treatment. The distances to the nearestshrub and Populus tremuloides were similar in the control plots, but shrubs were approximately20 percent closer than Populus tremuloides in the Rome double disking treatment (Table 25).The Competition Indices showed a pattern of response similar to other measured variables withthe control and Rome double disking plots at opposite ends of each scale, and a gradient ofchange with increased dosage of hexazinone.
Few of the competition variables, density measures, or cover values were significantly correlatedwith Picea glauca heights within the treatment plots, and the coefficients that were significanttended to be weak with explained variances of less than 15 percent (Table 26). When alltreatments were combined for analysis, the overall level of explained variance was usually lessthan five percent for any particular variable. A similar response was also obtained when thecontrol and hexazinone treatments were combined as a dosage gradient, although correlationcoefficients tended to be greater. The strongest correlations with Picea glauca heights wereassociated with distance to the nearest Populus tremuloides and its percent cover in the B-stratum. In general, Picea glauca height increased as Populus tremuloides cover and theabundance of woody stems decreased, and the distance of these trees increased from the seedling.
A significant difference in competition variables according to Picea glauca height classesoccurred only with respect to the distance between the nearest tree and the crop seedlings (Table24). Seedling height increased with increasing distance from the nearest tree.
Rosa acicularis and Amelanchier alnifolia were the most commonly encountered woody shrubsgreater than 50 cm tall and within 180 cm of measured Picea glauca seedlings. In mosttreatments the Rosa acicularis (frequency 43 percent) was encountered approximately 2 to 2.5times more frequently than Amelanchier alnifolia, except in the control plots where Amelanchieralnifolia (41 percent) was more frequent than Rosa acicularis (32 percent).
93
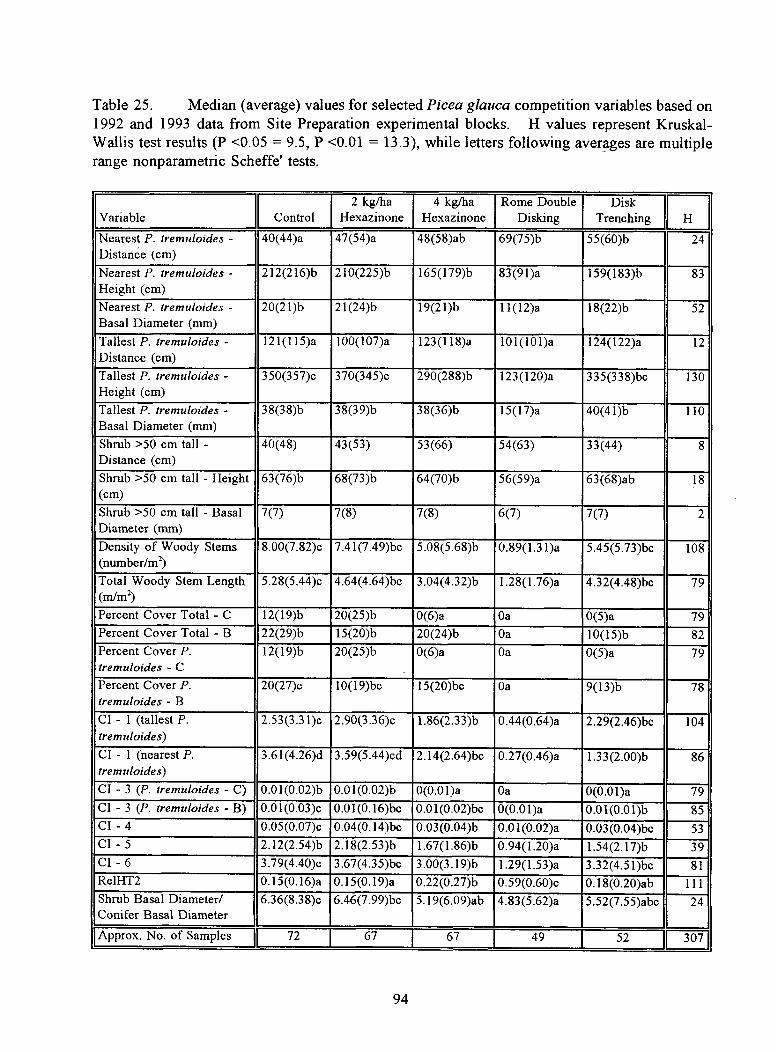
Table 25. Median (average) values for selected Picea glauca competition variables based on1992 and 1993 data from Site Preparation experimental blocks. H values represent Kruskal-Wallis test results (P <0.05 = 9.5, P <0.01 = 13.3), while letters following averages are multiplerange nonparametric Scheffe' tests.
Variable Control2 kg/ha
Hexazinone4 kg/ha
HexazinoneRome Double
DiskingDisk
Trenching 1-1
Nearest P. tremuloides -DistanCe (cm)
40(44)a 47(54)a 48(58)ab 69(75)b 55(60)b 24
Nearest P. tremuloides -Height (cm)
212(216)b 210(225)b I65(179)b 83(91)a 159(183)b 83
Nearest P. tremuloides -Basal Diameter (mm)
20(21)b 21(24)b 19(21)b 11(12)a 18(22)b 52
Tallest P. tremuloides -Distance (cm)
121(115)a 100(107)a 123(118)a 101(101)a 124(122)a 12
Tallest P. tremuloides -Height (cm)
350(357)c 370(345)c 290(288)b 123(120)a 335(338)bc 130
Tallest P. tremuloides -Basal Diameter (mm)
38(38)b 38(39)b 38(36)b 15(17)a 40(41)b 110
Shrub >50 cm tall -Distance (cm)
40(48) 43(53) 53(66) 54(63) 33(44) 8
Shrub >50 cm tall - Height(cm)
63(76)b 68(73)b 64(70)b 56(59)a 63(68)ab 18
Shrub >50 cm tall - BasalDiameter (mm)
7(7) 7(8) 7(8) 6(7) 7(7) 2
Density of Woody Stems(number/m2)
8.00(7.82)c 7.41(7.49)bc 5.08(5.68)b 0.89(1.31)a 5.45(5.73)bc 108
Total Woody Stem Length(m/m2)
5.28(5.44)c 4.64(4.64)bc 3.04(4.32)b 1.28(1.76)a 4.32(4.48)bc 79
Percent Cover Total - C 12(19)b 20(25)b 0(6)a Oa 0(5)a 79Percent Cover Total - B 22(29)b 15(20)b 20(24)b Oa 10(15)b 82Percent Cover P.tremuloides - C
12(19)b 20(25)b 0(6)a Oa 0(5)a 79
Percent Cover P.tremuloides - B
20(27)c 10(19)bc 15(20)bc Oa 9(13)b 78
CI - 1 (tallest P.tremuloides)
2.53(3.31)c 2.90(3.36)c 1.86(2.33)b 0.44(0.64)a 2.29(2.46)bc 104
CI - 1 (nearest P.tremuloides)
3.61(4.26)d 3.59(5.44)cd 2.14(2.64)bc 0.27(0.46)a 1.33(2.00)b 86
CI - 3 (P. tremuloides - C) 0.01(0.02)b 0.01(0.02)b 0(0.01)a Oa 0(0.01)a 79CI - 3 (P. tremuloides - B) 0.01(0.03)c 0.01(0.16)bc 0.01(0.02)bc 0(0.01)a 0.01(0.01)b 85CI - 4 0.05(0.07)c 0.04(0.14)bc 0.03(0.04)b 0.01(0.02)a 0.03(0.04)bc 53CI - 5 2.12(2.54)b 2.18(2.53)b 1.67(1.86)b 0.94(1.20)a 1.54(2.17)b 39CI - 6 3.79(4.40)c 3.67(4.35)bc 3.00(3.19)b 1.29(1.53)a 3.32(4.51)bc 81Re1HT2 0.15(0.16)a 0.15(0.19)a 0.22(0.27)b 0.59(0.60)c 0.18(0.20)ab 111Shrub Basal Diameter/Conifer Basal Diameter
6.36(8.38)c 6.46(7.99)bc 5.19(6.09)ab 4.83(5.62)a 5.52(7.55)abc 24
'Approx. No. of Samples11 72
67 67 4952 11 3071
94
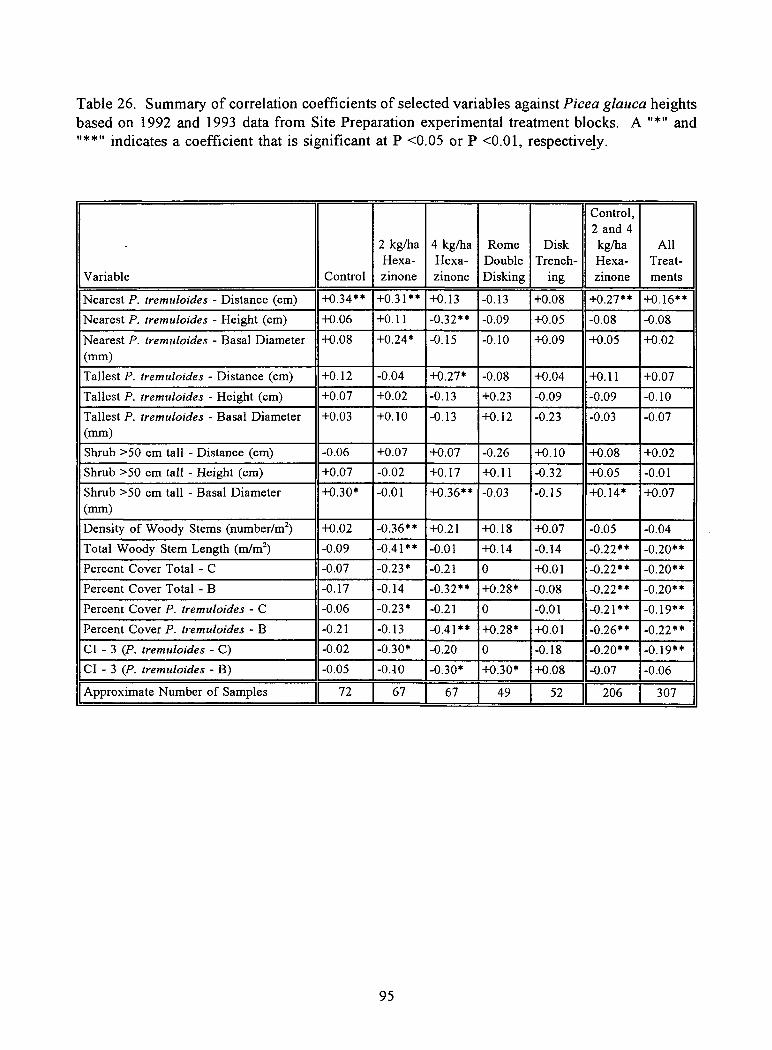
Table 26. Summary of correlation coefficients of selected variables against Picea glauca heightsbased on 1992 and 1993 data from Site Preparation experimental treatment blocks. A "*" and"*" indicates a coefficient that is significant at P <0.05 or P <0.01, respectively.
Variable Control
2 kg/haHexa-zinone
4 kg/haHexa-zinone
RomeDoubleDisking
DiskTrench-
ing
Control,2 and 4kg/haHexa-zinone
AllTreat-ments
Nearest P. tremuloides - Distance (cm) +0.34** +0.31** +0.13 -0.13 +0.08 +0.27** +0.16**
Nearest P. tremuloides - Height (cm) +0.06 +0.11 -0.32** -0.09 +0.05 -0.08 -0.08
Nearest P. tremuloides - Basal Diameter(mm)
+0.08 +0.24* -0.15 -0.10 +0.09 +0.05 +0.02
Tallest P. tremuloides - Distance (cm) +0.12 -0.04 +0.27* -0.08 +0.04 +0.11 +0.07
Tallest P. tremuloides - Height (cm) +0.07 +0.02 -0.13 +0.23 -0.09 -0.09 -0.10
Tallest P. tremuloides - Basal Diameter(mm)
+0.03 +0.10 -0.13 +0.12 -0.23 -0.03 -0.07
Shrub >50 cm tall - Distance (cm) -0.06 +0.07 +0.07 -0.26 +0.10 +0.08 +0.02
Shrub >50 cm tall - Height (cm) +0.07 -0.02 +0.17 +0.11 -0.32 +0.05 -0.01
Shrub >50 cm tall - Basal Diameter(mm)
+0.30* -0.01 +0.36** -0.03 -0.15 +0.14* +0.07
Density of Woody Stems (number/m 2) +0.02 -0.36** +0.21 +0.18 +0.07 -0.05 -0.04
Total Woody Stem Length (mini') -0.09 -0.41** -0.01 +0.14 -0.14 -0.22** -0.20**
Percent Cover Total - C -0.07 -0.23* -0.21 0 +0.01 -0.22** -0.20**
Percent Cover Total - B -0.17 -0.14 -0.32** +0.28* -0.08 -0.22** -0.20**
Percent Cover P. tremuloides - C -0.06 -0.23* -0.21 0 -0.01 -0.21** -0.19**
Percent Cover P. tremuloides - B -0.21 -0.13 -0.41** +0.28* +0.01 -0.26** -0.22**
CI - 3 (P. tremuloides - C) -0.02 -0.30* -0.20 0 -0.18 -0.20** -0.19**
CI - 3 (P. tremuloides - B) -0.05 -0.10 -0.30* +0.30* +0.08 -0.07 -0.06
Approximate Number of Samples 72 67 67 49 52 206 307
95
5.2 Conifer Release Experiment Blocks
5.2.1 Pinus contorta Crop Seedlings
No significant differences in the distance between the crop seedling and the nearest Populustremuloides occurred among the treatment and control plots in the Conifer Release experiments.Trees in the control plots, however, were taller and had a larger basal diameter (Table 27). Thedistance to the tallest Populus tremuloides within 180 cm of the crop seedling was generallyshortest in the control and Rome double disking plots. Height and basal diameters for the tallesttree were often 25 to 60 percent larger in the control plots than in the treatments. The 2 kg/hahexazinone treatment ranked second to the control plots for the size of these variables. Thedistance between the crop seedling and the nearest shrub tended to be greatest in the 4 kg/hahexazinone and Rome double disking treatments, but no significant differences occurred in heightor basal diameter between the two plots. Stem densities and length of woody stems were highestin the control and brushsawed treatments at about five stems/m 2 and seven m/m2, respectively(Table 27). Among the assessed cover values, all tested species except Lonicera involucatashowed a significant difference between the treatment and control plots. Total C and Populustremuloides - C cover were greatest in the control plots. The amount of cover in the B-stratumwas similar among the plots, except within the 4 kg/ha hexazinone treatment which had a mediancover value of two percent compared with 8 to 13 percent in the other treatments. Asterconspicuus had a similar pattern of cover but with much lower values. Calamagrostis canadensishad the least amount of cover in the hexazinone plots (Table 27). The Competition Indices wereconsistently larger in the control than the treatment plots. The smallest values were associatedwith the 4 kg/ha hexazinone treatment, but sometimes also included the Rome double disking andbrushsawing treatments.
Few of the tested variables were significantly correlated with Pinus contorta seedling height. Ofthe 12 significant coefficients, nine were overstory canopy height or cover variables (Table 28).These variables also included the three strongest coefficients which were negatively associatedwith seedling height (r = -0.52). Half of all significant correlation coefficients occurred in the4 kg/ha hexazinone treatment plot, which also included the strongest correlations. Within thehexazinone dosage series (i.e., control or 0 kg/ha, 2 kg/ha and 4 kg/ha), half the tested variableswere negatively and significantly correlated with Pinus contorta seedling height. Among themost strongly correlated variables were total C-stratum cover, Height of the tallest Populustremuloides, density and length of woody stems. A similar pattern of correlation occurred whenall five plots were combined into a single data set, but no correlation coefficients were greaterthan 0.28.
Only two variables were significantly different among the three Pinus contorta height groups(Table 29). In general, seedling height tended to increase with increasing distance from thenearest Populus tremuloides and with decreasing height of the trees.
Rosa acicularis (frequency 51 percent) and Salix spp. (29 percent) were the two most commonshrubs within 180 cm of measured Pinus contorta seedlings in the Conifer Release experimentaltreatment plots. In the 2 kg/ha hexazinone treatment plots, the frequency of Rosa acicularistended to higher than the general average (71 percent).
96
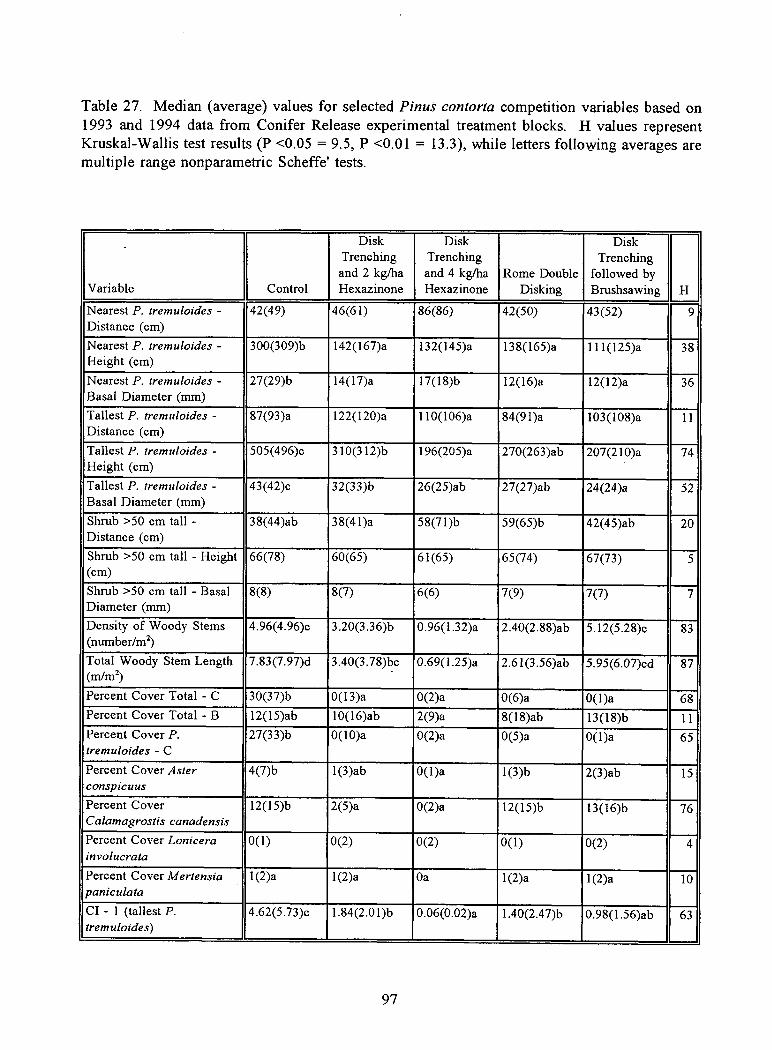
Table 27. Median (average) values for selected Pinus contorta competition variables based on1993 and 1994 data from Conifer Release experimental treatment blocks. H values representKruskal-Wallis test results (P <0.05 = 9.5, P <0.01 = 13.3), while letters following averages aremultiple range nonparametric Scheffe' tests.
Variable Control
DiskTrenchingand 2 kg/haHexazinone
DiskTrenchingand 4 kg/haHexazinone
Rome DoubleDisking
DiskTrenching
followed byBrushsawing H
Nearest P. tremuloides -Distance (cm)
42(49) 46(61) 86(86) 42(50) 43(52) 9
Nearest P. tremuloides -Height (cm)
300(309)b 142(167)a 132(145)a 138(165)a 111(125)a 38
Nearest P. tremuloides -Basal Diameter (mm)
27(29)b 14(17)a 17(18)b 12(16)a 12(12)a 36
Tallest P. tremuloides -Distance (cm)
87(93)a 122(120)a 110(106)a 84(91)a 103(108)a 11
Tallest P. tremuloides -Height (cm)
505(496)c 310(312)b 196(205)a 270(263)ab 207(210)a 74
Tallest P. tremuloides -Basal Diameter (mm)
43(42)c 32(33)b 26(25)ab 27(27)ab 24(24)a 52
Shrub >50 cm tall -Distance (cm)
38(44)ab 38(41)a 58(71)b 59(65)b 42(45)ab 20
Shrub >50 cm tall - Height(cm)
66(78) 60(65) 61(65) 65(74) 67(73) 5
Shrub >50 cm tall - BasalDiameter (mm)
8(8) 8(7) 6(6) 7(9) 7(7) 7
Density of Woody Stems(number/m2)
4.96(4.96)c 3.20(3.36)b 0.96(1.32)a 2.40(2.88)ab 5.12(5.28)c 83
Total Woody Stem Length(m/m2)
7.83(7.97)d 3.40(3.78)bc 0.69(1.25)a 2.61(3.56)ab 5.95(6.07)cd 87
Percent Cover Total - C 30(37)b 0(13)a 0(2)a 0(6)a 0(1)a 68Percent Cover Total - B 12(15)ab 10(16)ab 2(9)a 8(18)ab 13(18)b 11Percent Cover P.tremuloides - C
27(33)b 0(10)a 0(2)a 0(5)a 0(1)a 65
Percent Cover Asterconspicuus
4(7)b 1(3)ab 0(1)a 1(3)b 2(3)ab 15
Percent CoverCalamagrostis canadensis
12(15)b 2(5)a 0(2)a 12(15)b 13(16)b 76
Percent Cover Lonicerainvolucrata
0(1) 0(2) 0(2) 0(1) 0(2) 4
Percent Cover Mertensiapaniculata
1(2)a 1(2)a Oa 1(2)a 1(2)a 10
CI - 1 (tallest P.tremuloides)
4.62(5.73)c 1.84(2.01)b 0.06(0.02)a 1.40(2.47)b 0.98(1.56)ab 63
97
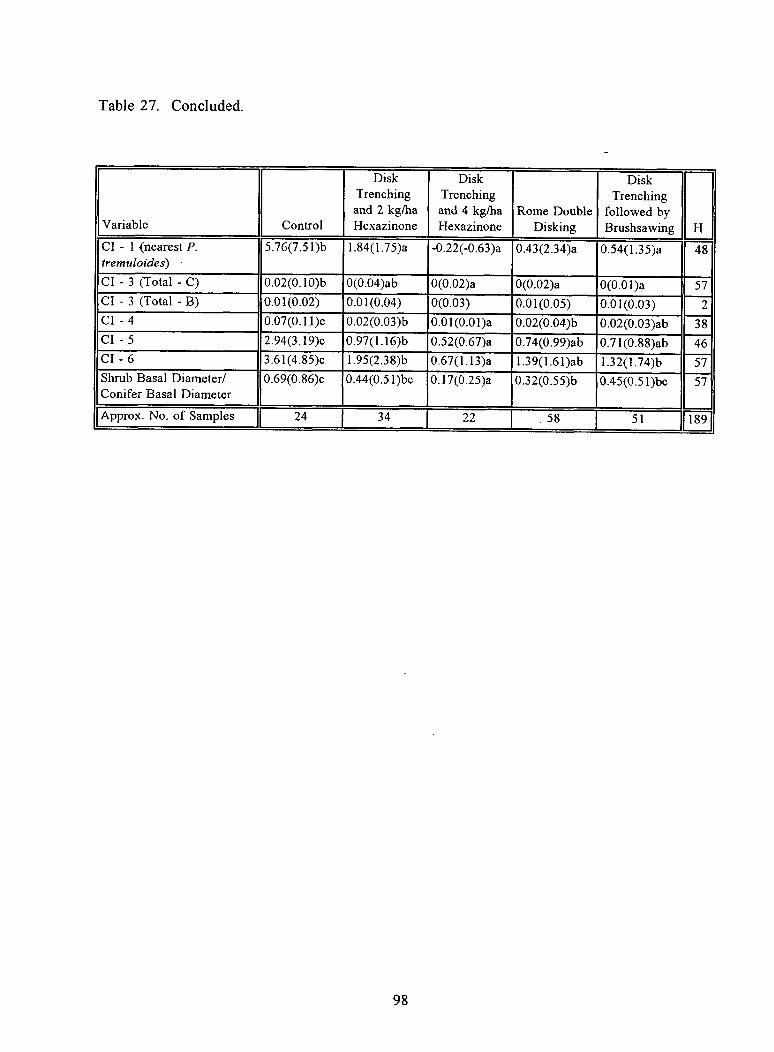
Table 27. Concluded.
Variable Control
DiskTrenchingand 2 kg/haHexazinone
DiskTrenchingand 4 kg/haHexazinone
Rome DoubleDisking
DiskTrenching
followed byBrushsawing H
CI - 1 (nearest P.tremuloides)
5.76(7.51)b 1.84(1.75)a -0.22(-0.63)a 0.43(2.34)a 0.54(1.35)a 48
CI - 3 (Total - C) 0.02(0.10)b 0(0.04)ab 0(0.02)a 0(0.02)a 0(0.01)a 57CI - 3 (Total - B) 0.01(0.02) 0.01(0.04) 0(0.03) 0.01(0.05) 0.01(0.03) 2CI - 4 0.07(0.11)c 0.02(0.03)b 0.01(0.01)a 0.02(0.04)b 0.02(0.03)ab 38CI - 5 2.94(3.19)c 0.97(1.16)b 0.52(0.67)a 0.74(0.99)ab 0.71(0.88)ab 46CI - 6 3.61(4.85)c 1.95(2.38)b 0.67(1.13)a 1.39(1.61)ab 1.32(1.74)b 57Shrub Basal Diameter/Conifer Basal Diameter
0.69(0.86)c 0.44(0.51)bc 0.17(0.25)a 0.32(0.55)b 0.45(0.51)bc 57
lApprox. No. of Samples II 24 34 22 58 51 111891
98
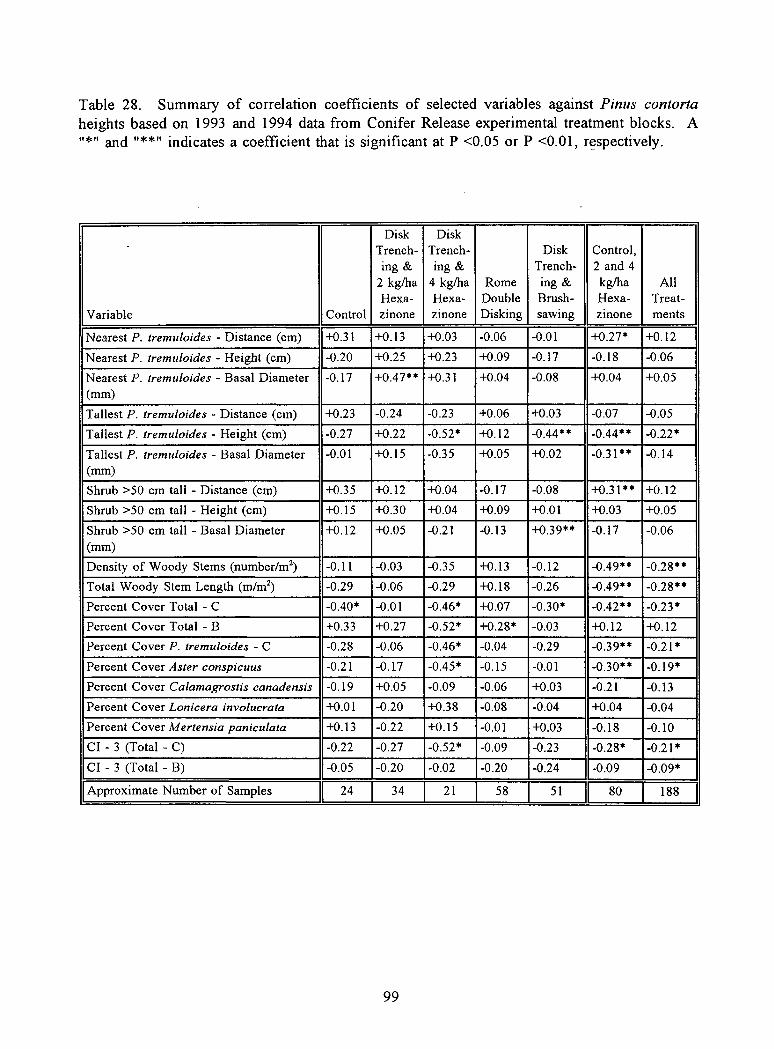
Table 28. Summary of correlation coefficients of selected variables against Pinus contortaheights based on 1993 and 1994 data from Conifer Release experimental treatment blocks. A"*" and "**" indicates a coefficient that is significant at P <0.05 or P <0.01, respectively.
Variable Control
DiskTrench-ing &
2 kg/haHexa-zinone
DiskTrench-ing &
4 kg/haHexa-zinone
RomeDoubleDisking
DiskTrench-ing &Brush-sawing
Control,2 and 4kg/haHexa-zinone
AllTreat-ments
Nearest P. tremuloides - Distance (cm) +0.31 +0.13 +0.03 -0.06 -0.01 +0.27* +0.12
Nearest P. tremuloides - Height (cm) -0.20 +0.25 +0.23 +0.09 -0.17 -0.18 -0.06
Nearest P. tremuloides - Basal Diameter(mm)
-0.17 +0.47** +0.31 +0.04 -0.08 +0.04 +0.05
Tallest P. tremuloides - Distance (cm) +0.23 -0.24 -0.23 +0.06 +0.03 -0.07 -0.05
Tallest P. tremuloides - Height (cm) -0.27 +0.22 -0.52* +0.12 -0.44** -0.44** -0.22*
Tallest P. tremuloides - Basal Diameter(mm)
-0.01 +0.15 -0.35 +0.05 +0.02 -0.31** -0.14
Shrub >50 cm tall - Distance (cm) +0.35 +0.12 +0.04 -0.17 -0.08 +0.31** +0.12
Shrub >50 cm tall - Height (cm) +0.15 +0.30 +0.04 +0.09 +0.01 +0.03 +0.05
Shrub >50 cm tall - Basal Diameter(mm)
+0.12 +0.05 -0.21 -0.13 +0.39** -0.17 -0.06
Density of Woody Stems (number/m 2) -0.11 -0.03 -0.35 +0.13 -0.12 -0.49** -0.28**
Total Woody Stem Length (m/m 2) -0.29 -0.06 -0.29 +0.18 -0.26 -0.49** -0.28**
Percent Cover Total - C -0.40* -0.01 -0.46* +0.07 -0.30* -0.42** -0.23*
Percent Cover Total - B +0.33 +0.27 -0.52* +0.28* -0.03 +0.12 +0.12
Percent Cover P. tremuloides - C -0.28 -0.06 -0.46* -0.04 -0.29 -0.39** -0.21*
Percent Cover Aster conspicuus -0.21 -0.17 -0.45* -0.15 -0.01 -0.30** -0.19*
Percent Cover Calamagrostis canadensis -0.19 +0.05 -0.09 -0.06 +0.03 -0.21 -0.13
Percent Cover Lonicera involucrata +0.01 -0.20 +0.38 -0.08 -0.04 +0.04 -0.04
Percent Cover Mertensia paniculata +0.13 -0.22 +0.15 -0.01 +0.03 -0.18 -0.10
CI - 3 (Total - C) -0.22 -0.27 -0.52* -0.09 -0.23 -0.28* -0.21*
CI - 3 (Total - B) -0.05 -0.20 -0.02 -0.20 -0.24 -0.09 -0.09*
I Approximate Number of SamplesII 24
34 21 58 51 II 80 188
99
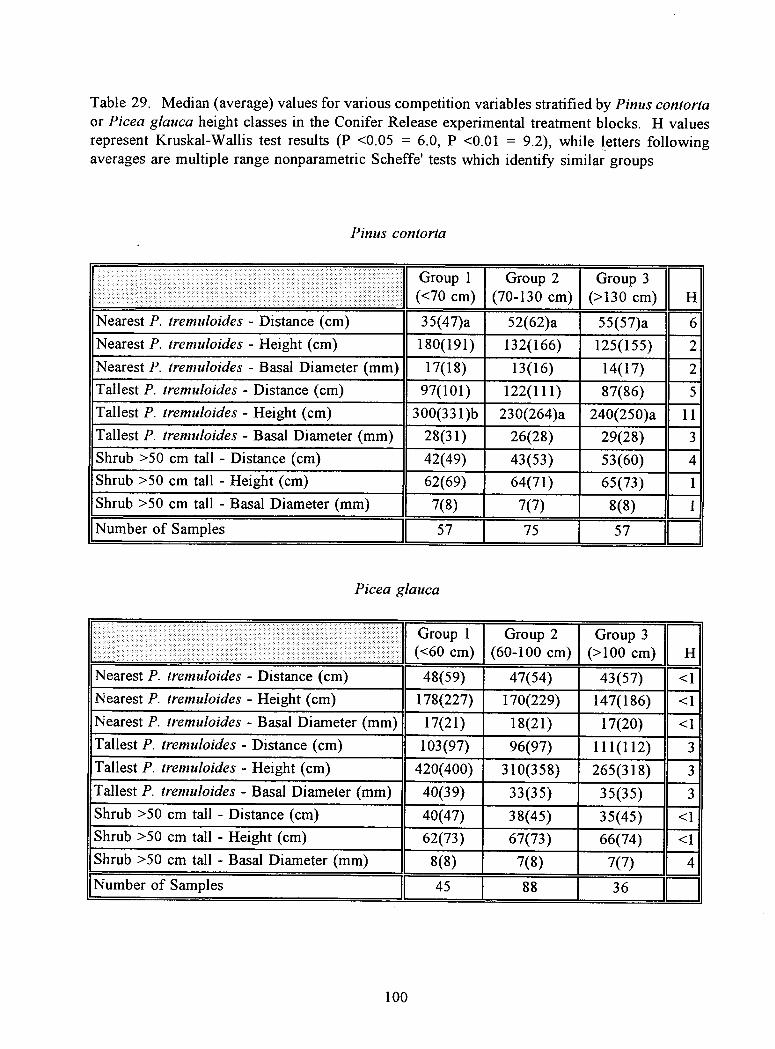
Table 29. Median (average) values for various competition variables stratified by Pinus contortaor Picea glauca height classes in the Conifer Release experimental treatment blocks. H valuesrepresent Kruskal-Wallis test results (P <0.05 = 6.0, P <0.01 = 9.2), while letters followingaverages are multiple range nonparametric Scheffe' tests which identify similar groups
Pinus contorta
Group 1(<70 cm)
Group 2(70-130 cm)
Group 3(>130 cm) H
Nearest P. tremuloides - Distance (cm) 35(47)a 52(62)a 55(57)a 6Nearest P. tremuloides - Height (cm) 180(191) 132(166) 125(155) 2Nearest P. tremuloides - Basal Diameter (mm) 17(18) 13(16) 14(17) 2Tallest P. tremuloides - Distance (cm) 97(101) 122(111) 87(86) 5Tallest P. tremuloides - Height (cm) 300(331)b 230(264)a 240(250)a 11Tallest P. tremuloides - Basal Diameter (mm) 28(31) 26(28) 29(28) 3Shrub >50 cm tall - Distance (cm) 42(49) 43(53) 53(60) 4Shrub >50 cm tall - Height (cm) 62(69) 64(71) 65(73) 1Shrub >50 cm tall - Basal Diameter (mm) 7(8) 7(7) 8(8) 1
Number of Samples 57 75 57 11
Picea glauca
Group 1 (<60 cm)
Group 2(60-100 cm)
Group 3(>100 cm) H
Nearest P. tremuloides - Distance (cm) 48(59) 47(54) 43(57) <1Nearest P. tremuloides - Height (cm) 178(227) 170(229) 147(186) <1Nearest P. tremuloides - Basal Diameter (mm) 17(21) 18(21) 17(20) <1Tallest P. tremuloides - Distance (cm) 103(97) 96(97) 111(112) 3Tallest P. tremuloides - Height (cm) 420(400) 310(358) 265(318) 3Tallest P. tremuloides - Basal Diameter (mm) 40(39) 33(35) 35(35) 3Shrub >50 cm tall - Distance (cm) 40(47) 38(45) 35(45) <1Shrub >50 cm tall - Height (cm) 62(73) 67(73) 66(74) <1Shrub >50 cm tall - Basal Diameter (mm) 8(8) 7(8) 7(7) 4
'Number of Samples [ 45 88 36 II
100
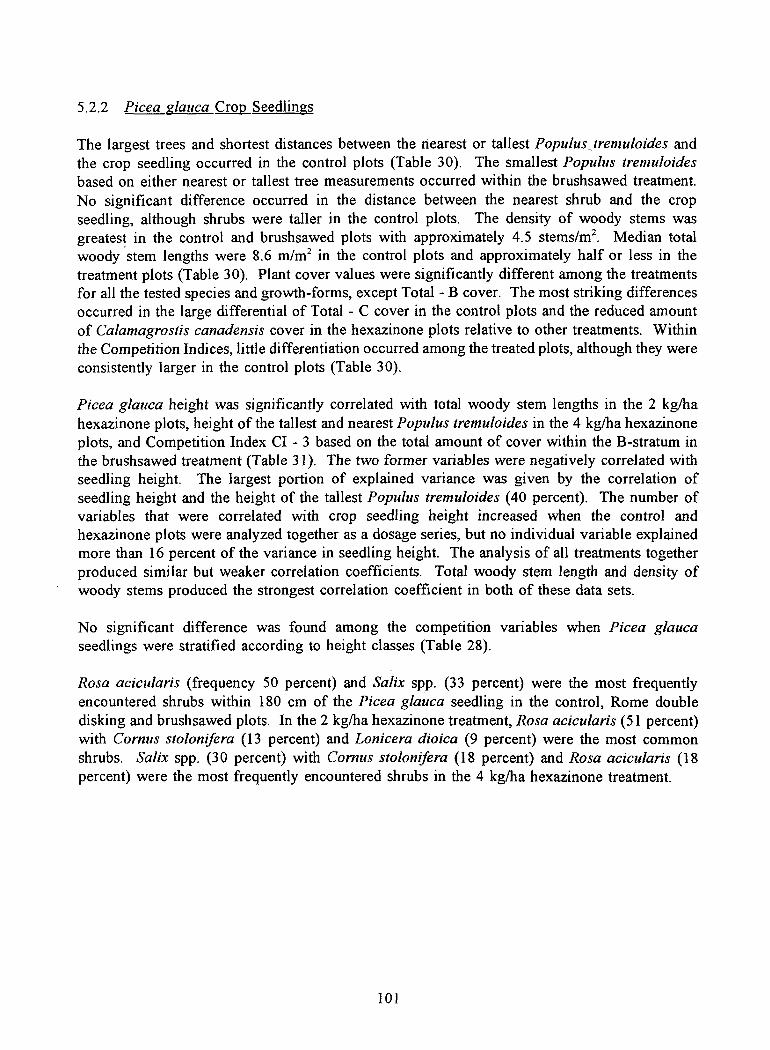
5.2.2 Picea glauca Crop Seedlings
The largest trees and shortest distances between the nearest or tallest Populus _tremuloides andthe crop seedling occurred in the control plots (Table 30). The smallest Populus tremuloidesbased on either nearest or tallest tree measurements occurred within the brushsawed treatment.No significant difference occurred in the distance between the nearest shrub and the cropseedling, although shrubs were taller in the control plots. The density of woody stems wasgreatest in the control and brushsawed plots with approximately 4.5 stems/m 2 . Median totalwoody stem lengths were 8.6 m/m 2 in the control plots and approximately half or less in thetreatment plots (Table 30). Plant cover values were significantly different among the treatmentsfor all the tested species and growth-forms, except Total - B cover. The most striking differencesoccurred in the large differential of Total - C cover in the control plots and the reduced amountof Calamagrostis canadensis cover in the hexazinone plots relative to other treatments. Withinthe Competition Indices, little differentiation occurred among the treated plots, although they wereconsistently larger in the control plots (Table 30).
Picea glauca height was significantly correlated with total woody stem lengths in the 2 kg/hahexazinone plots, height of the tallest and nearest Populus tremuloides in the 4 kg/ha hexazinoneplots, and Competition Index CI - 3 based on the total amount of cover within the B-stratum inthe brushsawed treatment (Table 31). The two former variables were negatively correlated withseedling height. The largest portion of explained variance was given by the correlation ofseedling height and the height of the tallest Populus tremuloides (40 percent). The number ofvariables that were correlated with crop seedling height increased when the control andhexazinone plots were analyzed together as a dosage series, but no individual variable explainedmore than 16 percent of the variance in seedling height. The analysis of all treatments togetherproduced similar but weaker correlation coefficients. Total woody stem length and density ofwoody stems produced the strongest correlation coefficient in both of these data sets.
No significant difference was found among the competition variables when Picea glaucaseedlings were stratified according to height classes (Table 28).
Rosa acicularis (frequency 50 percent) and Salix spp. (33 percent) were the most frequentlyencountered shrubs within 180 cm of the Picea glauca seedling in the control, Rome doubledisking and brushsawed plots. In the 2 kg/ha hexazinone treatment, Rosa acicularis (51 percent)with Cornus stolonifera (13 percent) and Lonicera dioica (9 percent) were the most commonshrubs. Salix spp. (30 percent) with Cornus stolonifera (18 percent) and Rosa acicularis (18percent) were the most frequently encountered shrubs in the 4 kg/ha hexazinone treatment.
101
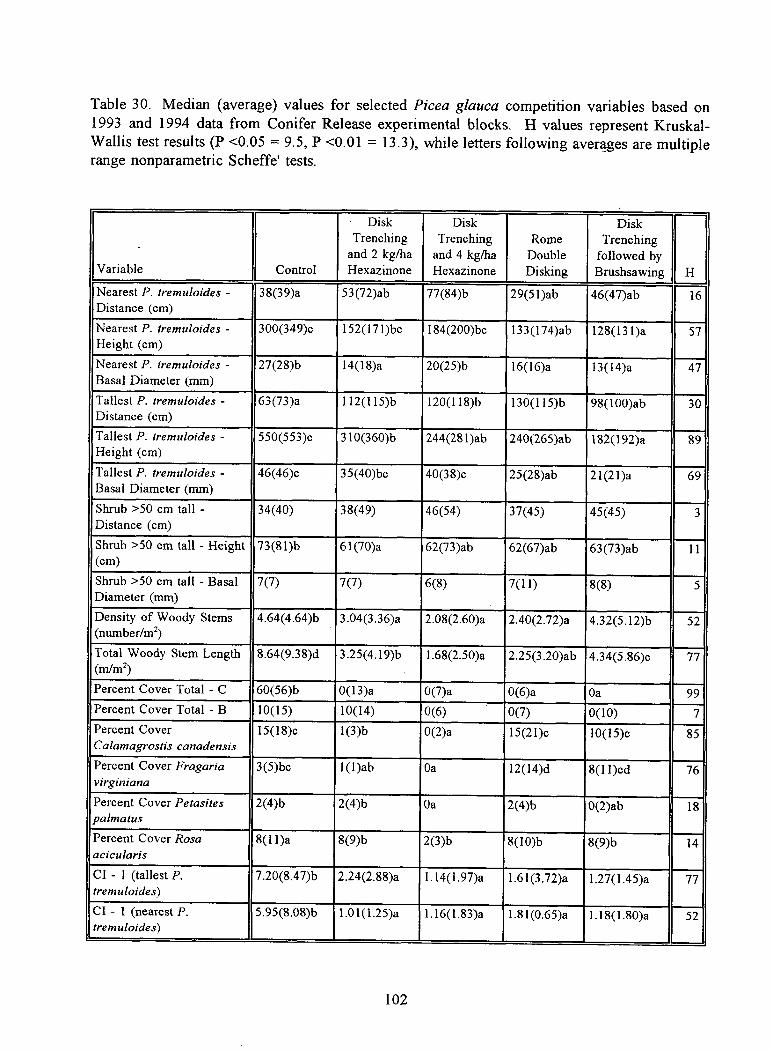
Table 30. Median (average) values for selected Picea glauca competition variables based on1993 and 1994 data from Conifer Release experimental blocks. H values represent Kruskal-Wallis test results (P <0.05 = 9.5, P <0.01 = 13.3), while letters following averages are multiplerange nonparametric Scheffe' tests.
Variable Control
DiskTrenching
and 2 kg/haHexazinone
DiskTrenching
and 4 kg/haHexazinone
RomeDoubleDisking
DiskTrenching
followed byBrushsawing H
Nearest P. tremuloides -Distance (cm)
38(39)a 53(72)ab 77(84)b 29(51)ab 46(47)ab 16
Nearest P. tremuloides -Height (cm)
300(349)c 152(171)bc 184(200)bc 133(174)ab 128(131)a 57
Nearest P. tremuloides -Basal Diameter (mm)
27(28)b 14(18)a 20(25)b 16(16)a 13(14)a 47
Tallest P. tremuloides -Distance (cm)
63(73)a 112(115)b 120(118)b 130(115)b 98(100)ab 30
Tallest P. tremuloides -Height (cm)
550(553)c 310(360)b 244(281)ab 240(265)ab 182(192)a 89
Tallest P. tremuloides -Basal Diameter (mm)
46(46)c 35(40)bc 40(38)c 25(28)ab 21(21)a 69
Shrub >50 cm tall -Distance (cm)
34(40) 38(49) 46(54) 37(45) 45(45) 3
Shrub >50 cm tall - Height(cm)
73(81)b 61(70)a 62(73)ab 62(67)ab 63(73)ab 11
Shrub >50 cm tall - BasalDiameter (mm)
7(7) 7(7) 6(8) 7(11) 8(8) 5
Density of Woody Stems(number/m2)
4.64(4.64)b 3.04(3.36)a 2.08(2.60)a 2.40(2.72)a 4.32(5.12)b 52
Total Woody Stem Length(m/m2)
8.64(9.38)d 3.25(4.19)b 1.68(2.50)a 2.25(3.20)ab 4.34(5.86)c 77
Percent Cover Total - C 60(56)b 0(13)a 0(7)a 0(6)a Oa 99Percent Cover Total - B 10(15) 10(14) 0(6) 0(7) 0(10) 7Percent CoverCalamagrostis canadensis
15(18)c 1(3)b 0(2)a 15(21)c 10(15)c 85
Percent Cover Fragariavirginiana
3(5)bc 1(1)ab Oa 12(14)d 8(I 1)cd 76
Percent Cover Petasitespalmatus
2(4)b 2(4)b Oa 2(4)b 0(2)ab 18
Percent Cover Rosaacicularis
8(11)a 8(9)b 2(3)b 8(10)b 8(9)b 14
CI - 1 (tallest P.tremuloides)
7.20(8.47)b 2.24(2.88)a 1.14(1.97)a 1.61(3.72)a 1.27(1.45)a 77
CI - 1 (nearest P.tremuloides)
5.95(8.08)b 1.01(1.25)a 1.16(1.83)a 1.81(0.65)a 1.18(1.80)a 52
102
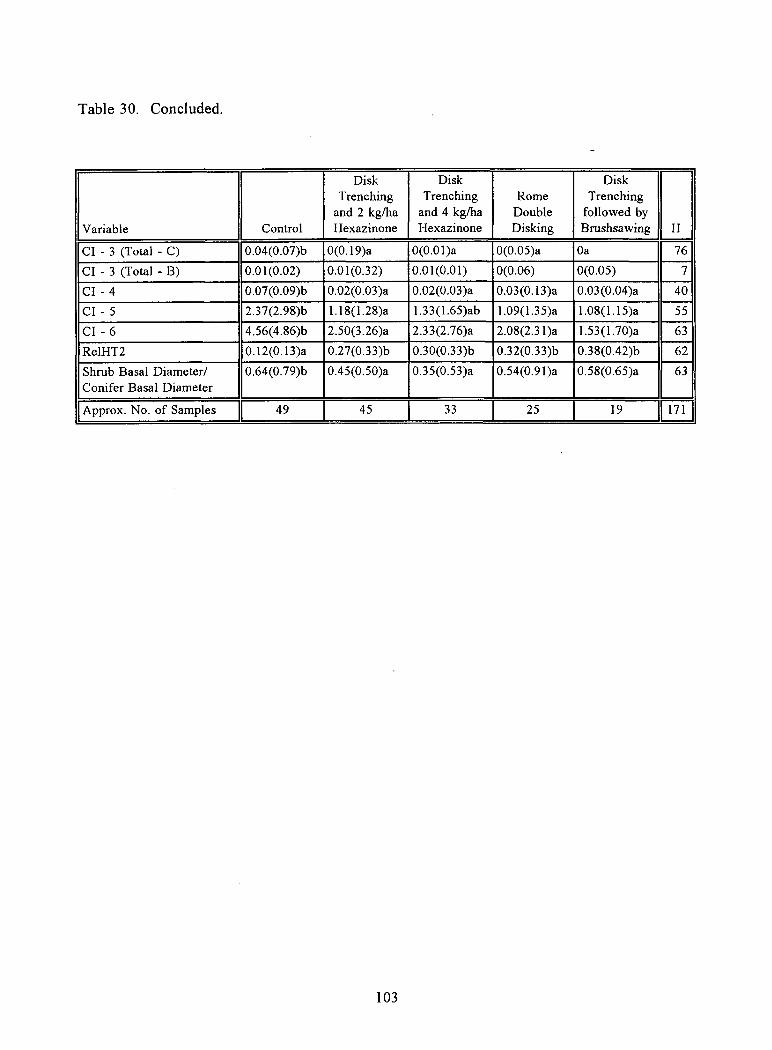
Table 30. Concluded.
Variable Control
DiskTrenching
and 2 kg/haHexazinone
DiskTrenching
and 4 kg/haHexazinone
RomeDoubleDisking
DiskTrenching
followed byBrushsawing H
CI - 3 (Total - C) 0.04(0.07)b 0(0.19)a 0(0.01)a 0(0.05)a Oa 76
CI - 3 (Total - B) 0.01(0.02) 0.01(0.32) 0.01(0.01) 0(0.06) 0(0.05) 7
CI - 4 0.07(0.09)b 0.02(0.03)a 0.02(0.03)a 0.03(0.13)a 0.03(0.04)a 40
CI - 5 2.37(2.98)b 1.18(1.28)a 1.33(1.65)ab 1.09(I.35)a 1.08(1.15)a 55
CI - 6 4.56(4.86)b 2.50(3.26)a 2.33(2.76)a 2.08(2.31)a 1.53(1.70)a 63
ReIHT2 0.12(0.13)a 0.27(0.33)b 0.30(0.33)b 0.32(0.33)b 0.38(0.42)b 62
Shrub Basal Diameter/Conifer Basal Diameter
0.64(0.79)b 0.45(0.50)a 0.35(0.53)a 0.54(0.91)a 0.58(0.65)a 63
Approx. No. of Samples 49 45 33 25 19 171
103
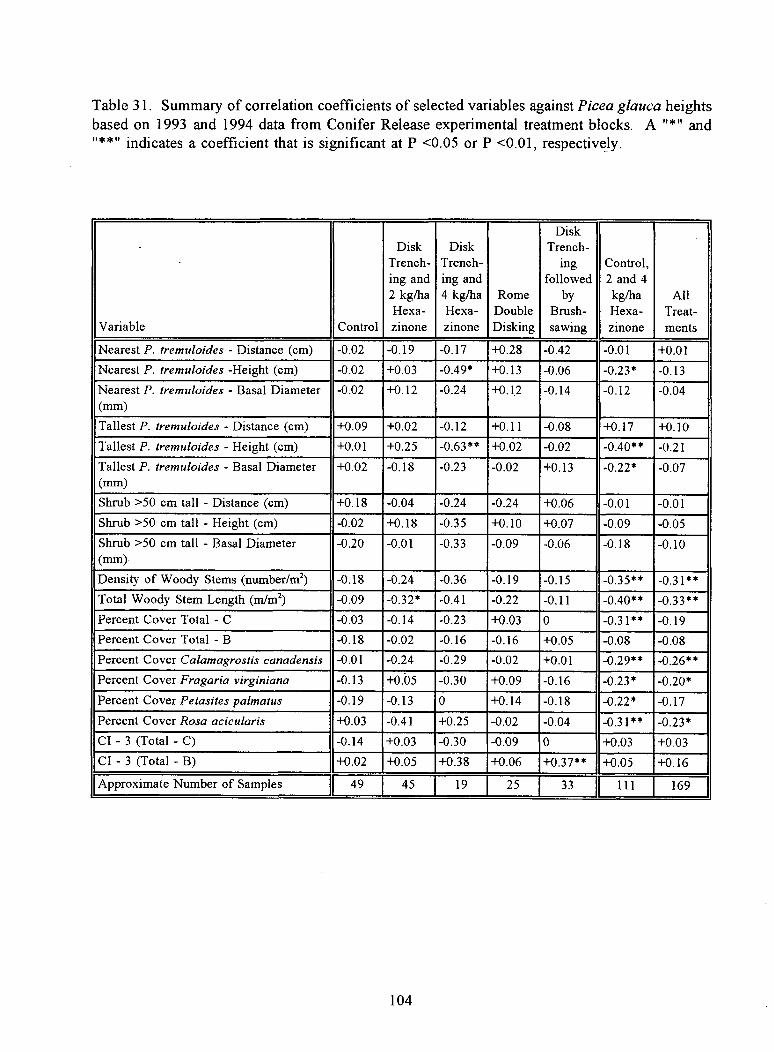
Table 31. Summary of correlation coefficients of selected variables against Picea glauca heightsbased on 1993 and 1994 data from Conifer Release experimental treatment blocks. A "*" and"*" indicates a coefficient that is significant at P <0.05 or P <0.01, respectively.
Variable Control
DiskTrench-ing and2 kg/haHexa-zinone
DiskTrench-ing and4 kg/haHexa-zinone
RomeDoubleDisking
DiskTrench-
ingfollowed
byBrush-sawing
Control,2 and 4kg/haHexa-zinone
AllTreat-ments
Nearest P. tremuloides - Distance (cm) -0.02 -0.19 -0.17 +0.28 -0.42 -0.01 +0.01
Nearest P. tremuloides -Height (cm) -0.02 +0.03 -0.49* +0.13 -0.06 -0.23* -0.13
Nearest P. tremuloides - Basal Diameter(mm)
-0.02 +0.12 -0.24 +0.12 -0.14 -0.12 -0.04
Tallest P. tremuloides - Distance (cm) +0.09 +0.02 -0.12 +0.11 -0.08 +0.17 +0.10
Tallest P. tremuloides - Height (cm) +0.01 +0.25 -0.63** +0.02 -0.02 -0.40** -0.21
Tallest P. tremuloides - Basal Diameter(mm)
+0.02 -0.18 -0.23 -0.02 +0.13 -0.22* -0.07
Shrub >50 cm tall - Distance (cm) +0.18 -0.04 -0.24 -0.24 +0.06 -0.01 -0.01
Shrub >50 cm tall - Height (cm) -0.02 +0.18 -0.35 +0.10 +0.07 -0.09 -0.05
Shrub >50 cm tall - Basal Diameter(mm)
-0.20 -0.01 -0.33 -0.09 -0.06 -0.18 -0.10
Density of Woody Stems (number/m2) -0.18 -0.24 -0.36 -0.19 -0.15 -0.35** -0.31**
Total Woody Stem Length (m/m 2) -0.09 -0.32* -0.41 -0.22 -0.11 -0.40** M.33**
Percent Cover Total - C -0.03 -0.14 -0.23 +0.03 0 M.31** -0.19Percent Cover Total - B -0.18 -0.02 -0.16 -0.16 +0.05 -0.08 -0.08
Percent Cover Calamagrostis canadensis -0.01 -0.24 -0.29 -0.02 +0.01 M.29** -0.26**
Percent Cover Fragaria virginiana -0.13 +0.05 -0.30 +0.09 -0.16 M.23* -0.20*
Percent Cover Petasites palmatus -0.19 -0.13 0 +0.14 -0.18 M.22* -0.17
Percent Cover Rosa acicularis +0.03 -0.41 +0.25 -0.02 -0.04 M.31** M.23*
CI - 3 (Total - C) -0.14 +0.03 -0.30 -0.09 0 +0.03 +0.03CI - 3 (Total - B) +0.02 +0.05 +0.38 +0.06 +0.37** +0.05 +0.16
I Approximate Number of Samples II 49
45 19 25 33 II 111 169 I
104

6.0 SUMMARY AND INTERPRETATIONS
The objectives of this study were to: 1) evaluate the early effects of various mechanical andchemical site treatment methods on the botanical composition, structure, and development ofmixedwood forest vegetation after six to seven years of growth on two separate experimentalsites; 2) assess the relative success of these treatments on lodgepole pine and white spruceseedling survival and growth; and 3) interpret the potential long-term ecological implications ofthe tested site preparation and conifer release techniques on native mixedwood forests. Thefollowing conclusions and interpretations were drawn from the data and the previous analyses.
6.1 Site Preparation Experiments
The initial botanical conditions within the three established experimental blocks were verysimilar based on the floristic composition, general plant community composition andstructure, and number of woody stems per hectare. Variations did occur among thetreatments (e.g., greater abundance of Calamagrostis canadensis in the control plots (median5 percent) than in the hexazinone plots (median less than one percent)), but in most casescompositional variations were considered within the limits of acceptability for field basedexperiments.
Vegetation development in the control plots generally followed a pattern of increasingheight, vertical stratification, overall plant cover, and floristic diversity as the stands agedduring the last seven years (1986-1992) of growth following clearcutting in 1983. Thecontrol plot vegetation was dominated by a 350 cm tall overstory (median 12 percent cover)and a B-stratum (>150 cm tall) composed of Populus tremuloides (combined median cover35 percent) with a combined density of 18,328 stems/ha in 1992. The understory vegetationwas dominated by medium height stratum composed of a mixture of shrubs, forbs, andgraminoids: Rosa acicularis (median 12 percent cover), Calamagrostis canadensis (15percent), Epilobium angustifolium (6 percent), Aster conspicuus (5 percent), Aralianudicaulis (2 percent), Aster ciliolatus (2 percent), and Fragaria virginiana (2 percent)(Table 4).
Approximately 52,789 woody stems per hectare occurred in the control plots at the time oftheir establishment in 1986. Density increased 39 percent to 73,448 stems/ha by 1988, butdeclined to 54,129 stem by 1992, which represents a 2.5 percent net gain over the initialestablishment level. While the net number of stems per hectare increased only slightlyduring the seven year period of study, the total length of woody stems increased 73 percentto a total of 81,131 m/ha. Slightly less than half of this change was attributed to a netincrease in Populus tremuloides stem lengths with Amelanchier alnifolia and Rosaacicularis contributing similar amounts.
4. All site preparation methods had at least some impact on the vegetation during the first sixyears of stand development after treatment. The relative impact of these treatments onnative vegetation was ranked in the following order: Rome double disking > 4 kg/hahexazinone > 2 kg/ha hexazinone — disk trenching > control. These changes includedmodifications of the physiognomy, general composition, and the length of all woody plant
105
stems in the vegetation.
Rome double disking converted what would have been a juvenile forest to mediumheight (<150 cm tall) mixed shrub and herb plant community. In 1992, the vegetationin this treatment was dominated by Calamagrostis canadensis (median cover 20percent), Rosa acicularis (10 percent), and Epilobium angustifolium (7 percent). It isunlikely that vegetation equivalent to the control plots will develop within the rotationage of the site due to the severity of the treatment. Furthermore, the development ofconifer dominated vegetation will further inhibit the development of deciduousdominated mixedwood stands due to changes in litter composition and relatedecological conditions.
The application of 4 kg/ha of hexazinone resulted in a ten percent reduction in overallplant cover; a general increase in floristic diversity; a 34 percent reduction in thenumber of stems per hectare, primarily due to the loss of Populus tremuloides stems;a net loss of 73 percent in the amount of woody stems; a large increase in the numberof Corylus cornuta stems; a substantial reduction in the total amount of C-stratum(average 22 versus 9 percent), Calamagrostis canadensis (19 versus 2 percent), andAster conspicuus (11 versus 4 percent) cover; and substantial increases in Epilobiumangustifolium (average 8 versus 12 percent) and Galium boreale (2 versus 9 percent)cover relative to the control plots. The recorded increase in floristic richness may bereal or the result of greater species differentiation in the later vegetation surveys,particularly within the genus Carex. Development of this vegetation over the next 50to 70 years should result in an open-canopied (<60 percent cover) Populus tremuloidesforest community with a greater abundance of shrubs than the control plots. Thisgreater abundance of shrub may develop due to the increased amount of solarradiation that reaches the lower levels of the vegetation. The increased openness ofthe forest canopy may enhance crop tree growth rates after their height exceeds theB-stratum.
The application of 2 kg/ha of hexazinone had less effect on the vegetation than 4kg/ha. In general, the 2 kg/ha dosage appears to have had only about one-third theoverall impact of 4 kg/ha based on recorded changes in total plant cover, number andtotal length of woody stems per hectare. The 2 kg/ha application resulted in anequivalent reduction in total Calamagrostis canadensis cover, increased Epilobiumangustifolium cover, and a substantial increase in the number of Cotylus cornutastems per hectare as compared to the 4 kg/ha hexazinone treatment. The vegetationin this treatment should develop into a plant community similar to the control plotsin the future (10 to 30 years).
The impact of disk trenching on the native vegetation was primarily along thetrenching lines; otherwise the structure and general composition of the vegetation aftersix years of growth was similar to the control vegetation. The reduction in overallplant cover relative to the control plots was approximately equal to the amount of areaaffected by trenching. It is anticipated that the visual and structural effects created bytrenching will decrease as the vegetation matures, and increases in height, and the
106
density of Populus tremuloides trees decreases. This treatment may result inaccelerated secondary succession by Picea glauca.
In 1992, the number of plant species was greatest in the hexazinone plots: Although theseplots had a greater number of species in 1986 relative to the control plots, the gain inspecies was also greater (12 and 18 species versus 5 species, respectively). The largest netgain was in the 4 kg/ha hexazinone treatment. This increase in species richness is probablydue to reduced homogeneity of the vegetation which created a greater diversity of niches.However, when individual treatments plots are considered separately (n=3 blocks) ratherthan as a group (n=1 type of treatment), species richness was greatest within the control,4 kg/ha hexazinone, and disk trenching plots. These inconsistencies suggest that one of thetreatment blocks was probably floristically more diverse.
Simpson's Index (X) suggests that a high degree of diversity with respect to cover occursamong species in the control plots. No major differences were found in Simpson's Indexof dominance between 1986 and 1992 or among the treatment plots, except the Romedouble disking treatment which had a slightly greater A, value. This greater value suggestsa slightly higher degree of species dominance among few species than in the othertreatments. Shannon-Wiener's Index (H') values among species increased in the controlplots between 1986 and 1992, but remained relatively constant or decreased slightly in thetreatment plots. The largest reduction in the evenness in cover among species occurred inRome double disking treatments. However, these differences in diversity within the Romedouble disking treatment are conservative relative to the drastic modifications that occurredin vegetation physiognomy, structure, species composition, and overall reduction of plantcover.
Pinus contorta growth to 1992 was best (median 112 cm; mean 113 cm, standard error fivecm) in the Rome double disking plots where median heights were approximately double thesecond best treatments (i.e., disk trenching and 4 kg/ha hexazinone) after six years ofgrowth. Stem volumes were typically 3.3 to 4.4 times greater in the Rome double diskingplots. Survival rates were also substantially higher (94 percent) in the Rome double diskingplots relative to the other treatments or the control plots (e.g., 55 percent). This improvedgrowth and level of survival was probably due to the elimination of most competingvegetation and an increase in the relative portion of resources available for conifer seedlinggrowth. Relative to the control plots, the other treatments resulted in somewhat betterheight growth, but only slightly better survival rates (e.g., 53 percent versus 56 to 62percent). Rome double disking appears to be the most effective treatment for promotingPinus contorta growth based on stem height, stem volume, and survival rates.
7. Picea glauca height growth was best in the 4 kg/ha hexazinone treatment plots, while nosignificant statistical difference occurred in seedling height among the other treatments.However, relative to the control plots growth among all the treatments was small (e.g.,median 56 cm versus 57 to 67 cm). Survival rates were similar in the control andhexazinone treatments (80 percent). The reduced levels of survival for Picea glauca wereprobably poorer (58 percent) in the Rome double disking treatment due to increased solarradiation exposure which increased transpiration demands and decreased soil moistureavailability due to increased ground surface evaporation. The reason for poor survival in
107
the disk trenching treatment was not obvious (possibly herbivory), but the survivingseedlings tended to have higher than normal vigor ratings. Among the tested sitepreparation methods, no treatment appears to be as effective for promoting Picea glaucagrowth as the application of 4 kg/ha of hexazinone based on a combination of total stemheight, stem volume, and survival rates.
Based on 1991 forest regeneration standards (Alberta Forest Service 1993, pp. 11-12), onlythe Rome double disking plots would be considered stocked under the mixedwood standardand very close to meeting the criteria for the conifer standard, if Pinus contorta had beenthe only conifer planted in the treatments (Table 31). However, poor conifer stocking levelsin the other treatments tended to be better than in the control plots. If Picea glauca hadbeen the only conifer species planted, only the 2 kg/ha and 4 kg/ha hexazinone plots wouldbe considered adequately stocked, although the control and disk trenching plots were closeto adequate (Table 32). If three of the conditionally acceptable (>40 cm tall) Picea glaucaseedlings in the control plots had been taller (e.g., five centimeters), the plot would havequalified as adequately stocked according to the mixedwood criteria. Aside from Romedouble disking, all treatments had tree stocking rates between 85 and 100 percent.
Among the tested competition variables, height and basal diameter of the tallest Populustremuloides, and total woody stem length provided the strongest and most consistentcorrelation coefficients for predicting Pinus contorta seedling height. Percent cover ofoverstory components (e.g., Total B, Total C, Populus tremuloides - C, CI - 3) and totalwoody stem length were the better parameters for predicting Picea glauca seedling height.It is anticipated that the relationship between seedling height and these competitionvariables will change with time. For example, the competitive impact of understoryvegetation on coniferous seedlings is probably most severe during the early stages ofestablishment, but once the seedling exceeds the general height of this vegetation otherfactors such as percent cover of B-stratum or the tree canopy may be more importantinfluences. Once the seedling exceeds the height of the understory vegetation theircompetitive roles probably start to be reversed.
Total woody stem length per hectare is a potentially useful variable for assessingcompetition between conifer crop seedling and competing vegetation. Considering totalwoody stem length is an indicator of the demand on available nutrients, moisture, and lightresources, reducing its volume probably allows a greater allocation to coniferous seedlingswhich would tend to promote greater height growth and increased stem volume. Therefore,it is as important to control the abundance of woody shrubs as well as Populus tremuloidesduring the early stages of forest regeneration following clearcutting.
In general, correlations of competition variables and seedling heights tended to be strongerfor Pinus contorta than Picea glauca.
10. Statistically significant differences (P <0.01) occurred among all of the calculatedCompetition Index values. In most cases, smallest values and presumably the least amountof competitor - conifer seedling interaction was associated with Rome double diskingtreatment plots. The largest values were usually associated with the control plots. Values
108
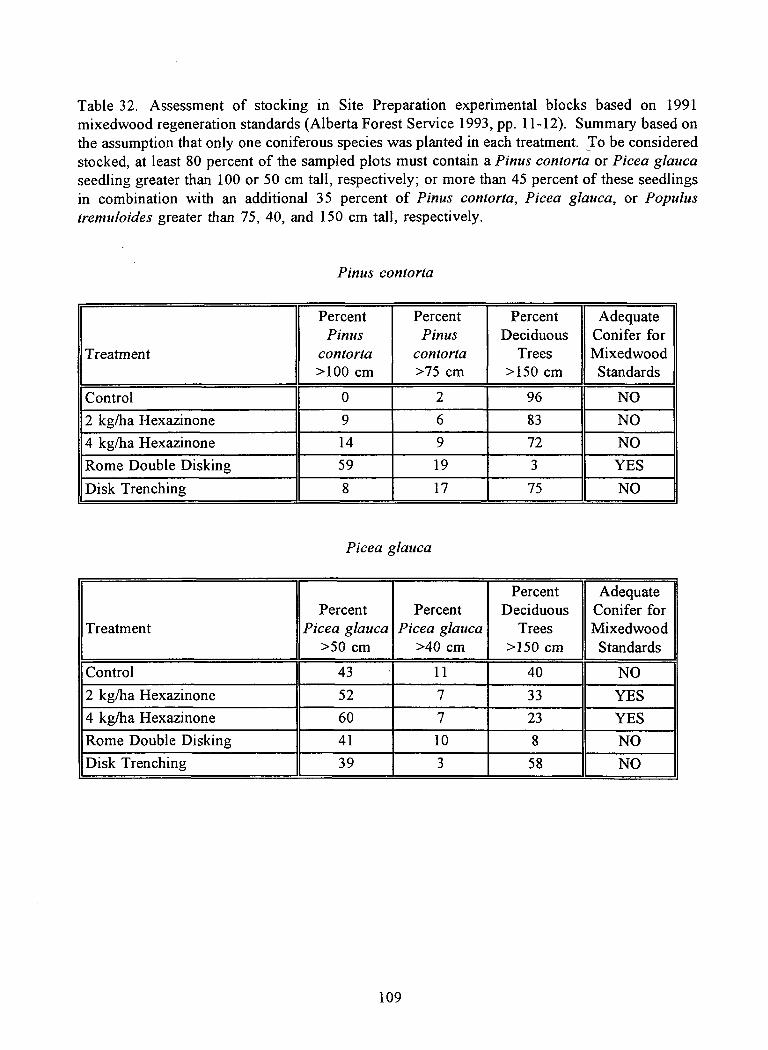
Table 32. Assessment of stocking in Site Preparation experimental blocks based on 1991mixedwood regeneration standards (Alberta Forest Service 1993, pp. 11-12). Summary based onthe assumption that only one coniferous species was planted in each treatment. To be consideredstocked, at least 80 percent of the sampled plots must contain a Pinus contorta or Picea glaucaseedling greater than 100 or 50 cm tall, respectively; or more than 45 percent of these seedlingsin combination with an additional 35 percent of Pinus contorta, Picea glauca, or Populustremuloides greater than 75, 40, and 150 cm tall, respectively.
Pinus contorta
Treatment
PercentPinus
contorta>100 cm
PercentPinus
contorta>75 cm
PercentDeciduous
Trees>150 cm
AdequateConifer forMixedwoodStandards
Control 0 2 96 NO
2 kg/ha Hexazinone 9 6 83 NO
4 kg/ha Hexazinone 14 9 72 NO
Rome Double Disking 59 19 3 YES
Disk Trenching 8 17 75 NO
Picea glauca
TreatmentPercent
Picea glauca>50 cm
PercentPicea glauca
>40 cm
PercentDeciduous
Trees>150 cm
AdequateConifer forMixedwoodStandards
Control 43 - 11 40 NO2 kg/ha Hexazinone 52 7 33 YES4 kg/ha Hexazinone 60 7 23 YESRome Double Disking 41 10 8 NODisk Trenching 39 3 58 NO
109
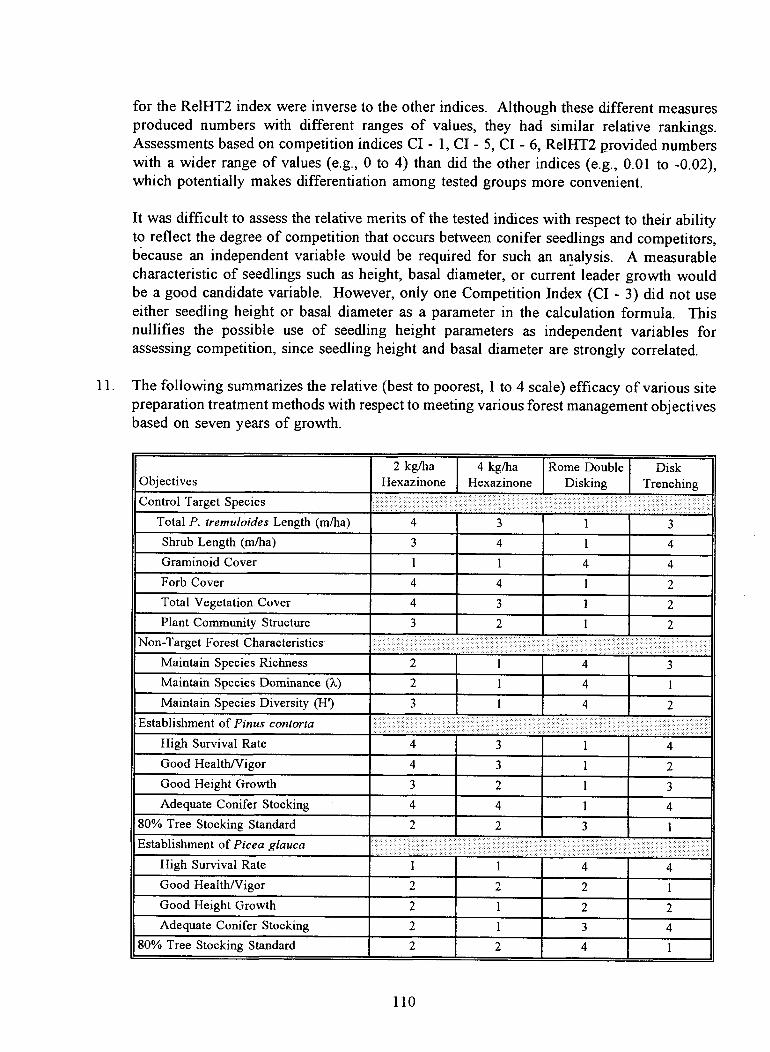
for the Re1HT2 index were inverse to the other indices. Although these different measuresproduced numbers with different ranges of values, they had similar relative rankings.Assessments based on competition indices CI - 1, CI - 5, CI - 6, Re1HT2 provided numberswith a wider range of values (e.g., 0 to 4) than did the other indices (e.g., 0.01 to -0.02),which potentially makes differentiation among tested groups more convenient.
It was difficult to assess the relative merits of the tested indices with respect to their abilityto reflect the degree of competition that occurs between conifer seedlings and competitors,because an independent variable would be required for such an analysis. A measurablecharacteristic of seedlings such as height, basal diameter, or current leader growth wouldbe a good candidate variable. However, only one Competition Index (CI - 3) did not useeither seedling height or basal diameter as a parameter in the calculation formula. Thisnullifies the possible use of seedling height parameters as independent variables forassessing competition, since seedling height and basal diameter are strongly correlated.
11. The following summarizes the relative (best to poorest, 1 to 4 scale) efficacy of various sitepreparation treatment methods with respect to meeting various forest management objectivesbased on seven years of growth.
Objectives2 kg/ha
Hexazinone4 kg/ha
HexazinoneRome Double
DiskingDisk
TrenchingControl Target Species
Total P. tremuloides Length (m/ha) 4 3 1 3Shrub Length (m/ha) 3 4 1 4Graminoid Cover 1 1 4 4Forb Cover 4 4 1 2Total Vegetation Cover 4 3 1 2Plant Community Structure 3 2 1 2
Non-Target Forest Characteristics
Maintain Species Richness 2 1 4 3Maintain Species Dominance (X) 2 1 4 1Maintain Species Diversity (F1') 3 1 4 2
Establishment of Pinus contorta
High Survival Rate 4 3 1 4Good Health/Vigor 4 3 1 2Good Height Growth 3 2 1 3Adequate Conifer Stocking 4 4 1 4
80% Tree Stocking Standard 2 2 3 1Establishment of Picea glauca
High Survival Rate 1 1 4 4Good Health/Vigor 2 2 2 1Good Height Growth 2 1 2 2Adequate Conifer Stocking 2 1 3 4
80% Tree Stocking Standard 2 2 4 1
110
Of these methods, the Rome double disking treatment was the more effective method forcontrolling a variety of different plant growth-forms, but had a severe impact on theecological characteristics of the vegetation. Rome double disking was better for promotingPinus contorta, while 4 kg/ha of hexazinone was more favorable for Picea glauca duringthe early stages of seedling growth following clearcutting.
6.2 Conifer Release Experiments
In 1993, the control plots within the Conifer Release experimental blocks were dominatedby a five meter tall Populus tremuloides stand (median 67 percent cover) with an understorycomposed of Calamagrostis canadensis (15 percent), Rosa acicularis (8 percent), Epilobiumangustifohum (8 percent), Aster conspicuus (6 percent), Fragaria virginiana (4 percent),Vicia americana (3 percent), Aster ciliolatus (2 percent),Galium boreale (2 percent),Lathyrus ochroleucus (2 percent), Petasites palmatus (2 percent), and Rub us pubescens (2percent). Shrub densities within the control plots totalled 48,200 stems/ha. Populustremuloides composed approximately one-third of these stems, while Rosa acicularisrepresented approximately one-quarter of the total.
At the time of establishment, the control plots contained approximately 51,903 stems perhectare (ca. 190 cm tall), while individual treatment plots contained pre-treatment densitiesthat ranged from 66,388 to 75,400 woody stems per hectare. These densities werestatistically (P <0.05) higher than those in the control plot. Between 1986 and 1993, thenumber of woody stems in the control plots declined by seven percent, while the totalvolume of woody stems increased by 68 percent.
14. All the treatments or combination of treatment methods in the Conifer Release experimentalblocks had a significant impact on vegetation. The majority of this impact occurred duringand after the application of the final phase of treatment. Approximately five years haselapsed since these treatments were applied, except Rome double disking which was carriedout the summer after plot establishment in 1987. The relative severity of these impacts onthe native vegetation was ranked as follows: Rome double disking > disk trenching and4 kg/ha hexazinone > disk trenching and brushsawing > disk trenching = 2 kg/hahexazinone > control. These changes included modification of the physiognomy, generalcomposition, and the length of all woody plant stems in the vegetation.
14a. Rome double disking destroyed all the native vegetation that regenerated afterclearcutting in 1983, and converted the plots to a medium height, open-growing tallshrub community with a mixed herb and shrub stratum. Rosa acicularis (mediancover 7 percent), Populus tremuloides (5 percent), and Salix spp. (4 percent) were theprincipal woody plants, while Calamagrostis canadensis (14 percent) and Epilobiumangustifolium (13 percent) were the dominant herb species. Woody stem densitieswere probably only one-quarter (17,000 stem/ha) their pre-treatment levels four yearsafter disking which was the lowest density among the four tested methods. It isunlikely that vegetation equivalent to the control plots will develop within the rotationage of the site due to the severity of the treatment. Furthermore, the development of
111
conifer dominated vegetation will further inhibit the development of deciduousdominated mixedwood stands due to changes in litter composition and relatedecological conditions.
The application of 4 kg/ha of hexazinone destroyed much of the woody vegetationthat occurred in this treatment plot. Many of the trees that still occurred in the plotappeared to have been missed during application of the herbicides, since they occurredin linear strips. Where treated the developing vegetation was reduced to a mediumheight, mixed shrub and herb plant community dominated primarily by Rosaacicularis, Cornus stolonifera, Salix spp., Epilobium angustifolium (4 percent), Galiumboreale (10 percent), Agropyron trachycaulum (4 percent), and Bromus ciliatus (2percent). Calamagrostis canadensis, a common species in the control plots, appearsto have been substantially reduced (15 percent versus zero percent median cover) inabundance as a result of the hexazinone application. This treatment reduced the totalnumber of woody stems per hectare by 66 percent and the total volume of stems by71 percent as of 1993. It is expected that this vegetation will require several decadesto develop a semi-mature forest stand, and will probably not develop vegetationequivalent to the control plots within the logging rotational age of the site. Inaddition, the more rapid development of conifers in the vegetation may direct thesuccession away from a deciduous dominated forest towards an open-canopied Pinuscontorta-Populus tremuloides stand with a rich understory of shrubs. The increasedopenness of the forest canopy may enhance crop tree growth rates after their heightexceeds the tall shrub stratum.
Brushsawing converted a potentially closed-canopied juvenile forest stand into anopen-canopied tall shrub (>150 cm tall) community dominated by Salix spp. and toa lesser extent Populus tremuloides. The understory vegetation is presently dominatedby Rosa acicularis (7 percent) and Calamagrostis canadensis (15 percent). Four yearsafter brushsawing, the density and volume of woody stems was approximately 15 and21 percent less than its 1988 pre-treatment levels. This treatment appears to have agreater impact on the structure of the vegetation than its floristic composition. It ispossible that given sufficient time (40 to 70 years), vegetation similar to the controlplots may redevelop, although successionally retarded and with a greater than normalproportion of conifers in the overstory.
14d. The application of 2 kg/ha of hexazinone reduced the density of the overstoryvegetation (e.g., 13,000 to 7,300 stem/ha) resulting in an open-canopied Populustremuloides stand. Opening of the canopy probably enhanced the growth of shrubssuch as Salix spp. and the development of Populus tremuloides suckers that occurredin the understory. Application of hexazinone also substantially reduced the abundanceof Calamagrostis canadensis (15 percent versus one percent) but allowed theexpansion of species such as Achillea millefolium, Agropyron trachycaulum, Bromusciliatus, Galium boreale, and Taraxacum officinale. Between 1989 (the date ofhexazinone application) and 1993, a 20 and 26 percent reduction in the total numberand length of woody stems per hectare occurred, respectively. The vegetation in thistreatment will probably develop into a semi-closed canopied mixedwood stand with
112
a higher than normal amount of conifers. The more open overstory will probablyallow a greater proportion of tall shrubs to develop in the understory. Once openingsin the canopy have been filled by trees and tall shrubs, many of the species associatedwith disturbed sites (e.g., Achillea millefolium and Taraxacum officinale) will declinein abundance as native species increase their cover. It may require between 10 and40 years for this vegetation to reach a state of ecological stability.
In 1993 or approximately five and six years after treatment, species richness was greaterin the hexazinone and brushsawed plots. Simpson's Index (X) values suggest a higherdegree of diversity within the treatments than the control plots with respect to cover.Simpson's values were also similar to those calculated for Site Preparation treatments.These various botanical indices suggest that chemical and mechanical treatments in theConifer Release experiments produced vegetation which was somewhat floristically richerand more diverse with a lower degree of dominance than the control plots.
Pinus contorta growth was best (median approximately 130 cm height) in the 4 kg/hahexazinone and Rome double disking treatments. This overall height was almost doublethat found in the control plots after six years of growth. However, survival rates weregreatest in the Rome double disking and brushsawing treatments (approximately 85 percent),less in the hexazinone plots (approximately 60 percent), and poorest in the control (44percent) plots. The improved growth and level of survival relative to the control plots wasprobably due to the elimination of most competing vegetation and increase of the relativeportion of resources available for conifer seedling growth. In general, the. greater thereduction in competing vegetation the better the growth. Rome double disking appears topromote the best growth, stem volume, and survival among the tested methods.
Picea glauca height growth was best in the 2 kg/ha hexazinone treatment plot (median 91cm), but only slightly better than the other treatments (approximately 69 cm). The poorestgrowth was associated with the control plots (69 cm). The highest survival rates (75percent) occurred in the control and 2 kg/ha hexazinone plots compared with 45 to 55percent in the other treatments. The poorer_survival rates in the 4 kg/ha hexazinone, Romedouble disking, and brushsawing treatments may be due to increased exposure of theseedlings to solar radiation. Based on a combination of height growth, stem volume, andsurvival rates, the 2 kg/ha hexazinone application appears be the more favorable treatmentfor promoting Picea glauca development during the early stages of growth.
Based on 1991 mixedwood forest regeneration standards (Alberta Forest Service 1993, pp.11-12), if Pinus contorta had been the only conifer planted in the treatments (Table 33),only the Rome double disking plots would be considered stocked. However, poor stockinglevels in the other treatments tended to be better than in the control plots. If Picea glaucahad been the only conifer species planted, the control and 2 kg/ha hexazinone plots wouldbe considered adequately stocked, although the brushsawed plots were close (Table 33). Thebrushsawed plots would have been classified as stocked if a few more conditionallyacceptable Picea glauca seedlings or Populus tremuloides saplings had been present in thesurveyed plots. The 4 kg/ha hexazinone plots with Pinus contorta did not have an 80percent stocking of either conifer seedlings or deciduous saplings, while only the controland 2 kg/ha hexazinone plots with Picea glauca were similarly stocked.
113
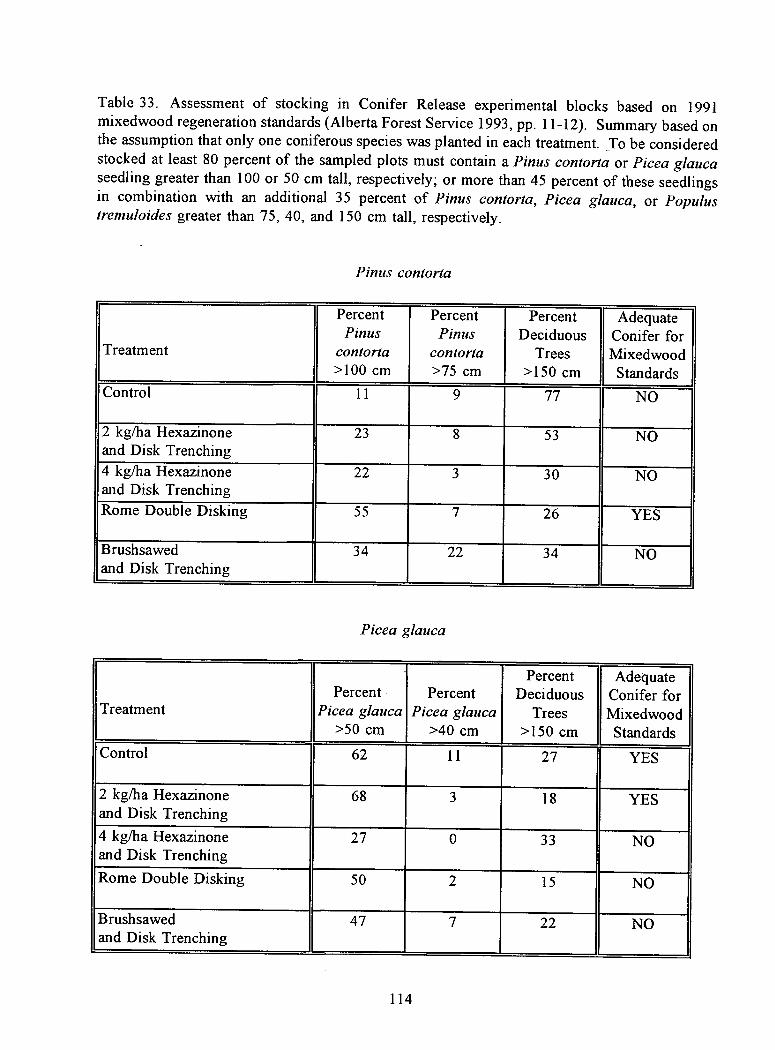
Table 33. Assessment of stocking in Conifer Release experimental blocks based on 1991mixedwood regeneration standards (Alberta Forest Service 1993, pp. 11-12). Summary based onthe assumption that only one coniferous species was planted in each treatment. To be consideredstocked at least 80 percent of the sampled plots must contain a Pinus contorta or Picea glaucaseedling greater than 100 or 50 cm tall, respectively; or more than 45 percent of these seedlingsin combination with an additional 35 percent of Pinus contorta, Picea glauca, or Populustremuloides greater than 75, 40, and 150 cm tall, respectively.
Pinus contorta
Treatment
PercentPinus
contorta>100 cm
PercentPinus
contorta>75 cm
PercentDeciduous
Trees>150 cm
AdequateConifer forMixedwoodStandards
Control 11 9 77 NO
2 kg/ha Hexazinoneand Disk Trenching
23 8 53 NO
4 kg/ha Hexazinoneand Disk Trenching
22 3 30 NO
Rome Double Disking 55 7 26 YES
Brushsawedand Disk Trenching
34 22 34 NO
Picea glauca
TreatmentPercent
Picea glauca>50 cm
PercentPicea glauca
>40 cm
PercentDeciduous
Trees>150 cm
AdequateConifer forMixedwoodStandards
Control 62 11 27 YES
2 kg/ha Hexazinoneand Disk Trenching
68 3 18 YES
4 kg/ha Hexazinoneand Disk Trenching
27 0 33 NO
Rome Double Disking 50 2 15 NO
Brushsawedand Disk Trenching
47 7 22 NO
114
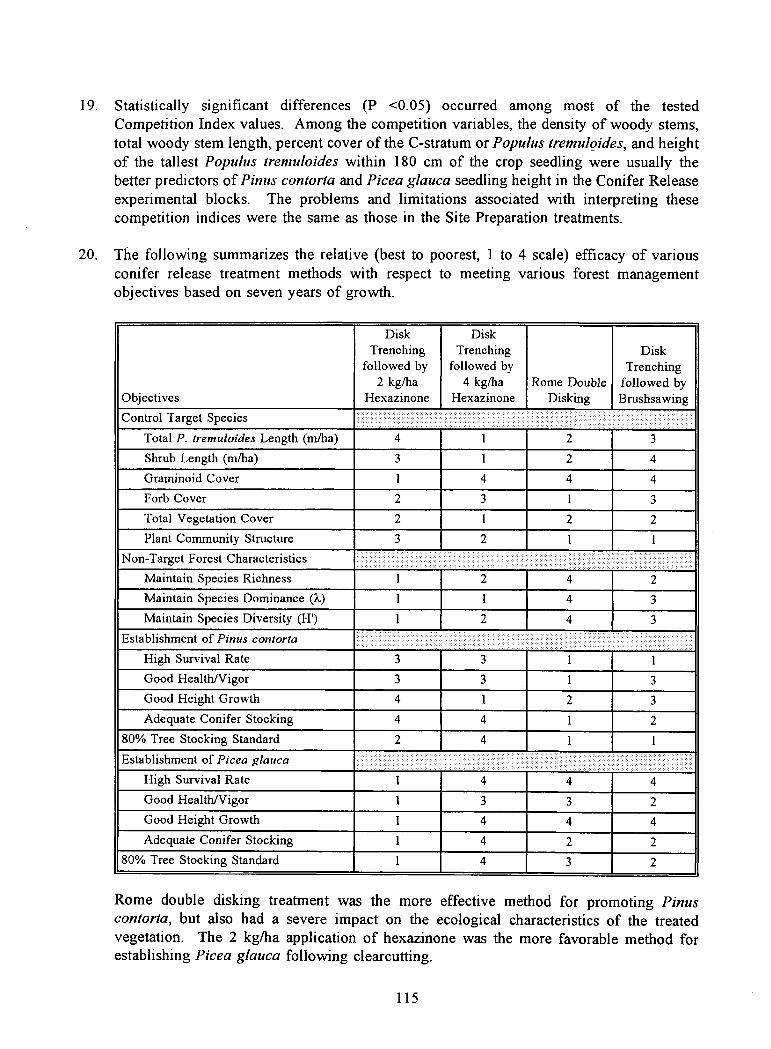
Statistically significant differences (P <0.05) occurred among most of the testedCompetition Index values. Among the competition variables, the density of woody stems,total woody stem length, percent cover of the C-stratum or Populus tremuloides, and heightof the tallest Populus tremuloides within 180 cm of the crop seedling were usually thebetter predictors of Pinus contorta and Picea glauca seedling height in the Conifer Releaseexperimental blocks. The problems and limitations associated with interpreting thesecompetition indices were the same as those in the Site Preparation treatments.
The following summarizes the relative (best to poorest, 1 to 4 scale) efficacy of variousconifer release treatment methods with respect to meeting various forest managementobjectives based on seven years of growth.
Objectives
DiskTrenching
followed by2 kg/ha
Hexazinone
DiskTrenching
followed by4 kg/ha
HexazinoneRome Double
Disking
DiskTrenching
followed byBrushsawing
Control Target Species
Total P. tremuloides Length (m/ha) 4 1 2 3
Shrub Length (m/ha) 3 1 2 4
Graminoid Cover 1 4 4 4
Forb Cover 2 3 1 3
Total Vegetation Cover 2 1 2 2
Plant Community Structure 3 2 1 1
Non-Target Forest Characteristics
Maintain Species Richness 1 2 4 2Maintain Species Dominance (k) 1 1 4 3
Maintain Species Diversity (H') 1 2 4 3
Establishment of Pinus contorta
High Survival Rate 3 3 1 1Good Health/Vigor 3 3 1 3Good Height Growth 4 1 2 3Adequate Conifer Stocking 4 4 1 2
80% Tree Stocking Standard 2 4 1 1
Establishment of Picea glauca
High Survival Rate 1 4 4 4Good Health/Vigor 1 3 3 2Good Height Growth 1 4 4 4Adequate Conifer Stocking 1 4 2 2
80% Tree Stocking Standard 1 4 3 2
Rome double disking treatment was the more effective method for promoting Pinuscontorta, but also had a severe impact on the ecological characteristics of the treatedvegetation. The 2 kg/ha application of hexazinone was the more favorable method forestablishing Picea glauca following clearcutting.
115
7.0 RECOMMENDATIONS
A primary objective of this project when it was initiated in 1986 was to "evaluate the impact ofPRONONE 10G (hexazinone) and other vegetation management methods on vegetation changesin structure, composition, and dynamics of vegetation" and (Sidhu and Feng 1991, p. 171). Todate, the effects of these treatments have been analyzed for only a small portion of the rotationallife span of these forest stands (e.g., 7 of 80 years or more). What the long-term biological andecological implications are for the treated vegetation can only be speculated, since subtleecological changes could have significant influence on plant community development. If thelong-term effects of the tested site preparation and conifer release methods are to be documented,it will be necessary to continue this study. The following are recommendations for continuingthis baseline research.
Assess vegetation composition, cover, and woody stem densities during the summer of 2002.The time between detailed sampling has been doubling since initiation of the project in 1986.Therefore, it would be appropriate to conduct another vegetation survey in 10 years Toaccommodate the permanent plot layout and anticipated growth of the coniferous seedings,it may be necessary to redesign the sampling format since the coniferous seedlings may growto occupy a large proportion of the 2.5 x 2.5 m quadrants used for sampling. Sampling ofindividual quadrants in this situation could result in unrepresentative data, if the purpose ofthe analysis was to evaluate vegetation development and track changes in biodiversity. It issuggested that the center post of each plot should be used as the plot center to minimize theinfluence of the conifers.
Long-term monitoring projects are relatively rare in forest or ecological research. Thisparticular study, if continued, could provide first-hand documentation on the development ofmixedwood forests following clearcutting. Most studies of this type are based on anexamination of several forest stands with different ages. The primary difficulties with thisapproach are the assurance that site conditions and the initial vegetation on all sites areidentical, and all sites have had the same development history (e.g., wildlife, pest, fireimpacts, etc.).
Assess conifer seedling development in 1997/8 (five years after last sampling) and again in2002/3 using the same seedlings that were measured in 1992.
3. Rome double disking appears to be a very effective treatment for minimizing nativevegetation and Pinus contorta seedling competition, but the use of this technique has a severeimpact on the native vegetation. This impact may be sufficient enough that the vegetationis unable to recover within the forestry rotation life span of the site. Use of this techniqueon a very limited basis over a large area could increase habitat diversity in areas dominatedby deciduous forest, but its widespread use could have a significant impact on environmentalconditions in the boreal forest. Therefore, it is recommended that additional research beinitiated on the environmental impact of Rome double disking. This work should evaluatethe long-term implications for wildlife and hydrology. Similar assessments should also beapplied to the use of high dosages of hexazinone as a conifer ,release technique, since thistreatment also drastically alters the native vegetation, probably beyond its ability to recover
116

within the rotation age of the site.
4. It is important that the two study sites (Site Preparation and Conifer Release) be maintainedin an undisturbed condition if this study is to continue. Maintenance of their integrity willrequire restricting access (e.g., all-terrain vehicles) and not allowing surface disturbances (e.g.,seismic lines). Such disturbances already occur within some of the study treatments. Inaddition, some maintenance work on the plot center posts and number tags, and re-establishment of treatment plot designation markers would be helpful to facilitate therelotation of plots in the future.
ACKNOWLEDGEMENTS
The authors thank Peter Todd (Canadian Forest Service) who provided the 1987 to 1989 cropseedling data; Laurie Lywek (Canadian Forest Service) who prepared computer data files for theyears 1986 and 1988; Tania Phillips and Roberta Yakamichuk who assisted with field datacollection (1992 and 1993); Dorothy Fabijan (University of Alberta) who identified Carexspecies; Jennifer Thompson who assisted with data compilation and preparation of this report;Rick Barlow (GeoSystems) who ran the cluster analyses; and Janet Warkentin (I.D. Group Inc.)who edited the final draft report.
This study was funded under the Canada-Alberta Partnership Agreement in Forestry.
117
REFERENCES
Anonymous. 1986. BrainPower, Inc., Calabasas, California.
Anonymous. 1980-1994. Monthly records. Environment Canada, Atmospheric EnvironmentService, Downsview, Ontario.
Anonymous. 1992a. Alberta Forestry, Lands and Wildlife annual report 1991-1992. AlbertaEnvironmental Protection, Edmonton, Alberta.
Anonymous. 1992b. SYSTAT for Windows, version 5 edition. Systat Inc., Evanston, Illinois.
Anonymous. 1993. Alberta regeneration survey manual. Alberta Environmental Protection,Edmonton, Alberta. Publication Number Ref. 70.
Beckingham, J.D. 1994. Field guide to the ecosystems of northern Alberta. Prepared forAlberta Environmental Protection by Geographic Dynamics Corporation, Edmonton,Alberta.
Bella, I.E.; Yang, R.C. 1991. Should we thin young aspen stands? Pages 135-139 in S.Navratil and P.B., Chapman, editors. Aspen management for the 21st century. ForestryCanada, Northwest Region and Poplar Council of Canada, Edmonton, Alberta
Corns, I.G.W.; Annas, R.M. 1986. Field guide to forest ecosystems of west-central Alberta.Canadian Forestry Service, Northern Forestry Centre, Edmonton, Alberta.
Feng, J.C.; Feng, C.C.; Sidhu, S.S. 1989a. Determine of hexazinone residue and its release froma granular formulation under forest conditions. Canadian Journal of Forest Research,19:378-381.
Feng, J.C.; Sidhu, S.S.; Feng, C.C.; Servant, V. 1989b. Hexazinone residues and dissipation insoil leachates. Journal of Environmental Science and Health B24: 131-143.
Greig-Smith, P. 1964. Quantitative plant ecology, second edition. Butterworths, London.
Husch, B.; Miller, C.I.; Beers, T.W. 1982. Forest mensuration, third edition. John Wiley &Sons, New York, New York.
Magurran, A.E. 1988. Ecological diversity and its measurement. Princeton University Press,Princeton, New Jersey.
Miller, R.G. Jr. 1966. Simultaneous statistical inferences, second edition. Springer-Verlag, NewYork, New York.
Moss, E.H. 1983. Flora of Alberta, second edition, revised by J.G. Packer. University ofToronto Press, Toronto, Ontario.
118
Navratil, S.; MacIsaac, D.A. 1993. Competition index for juvenile mixed stands of lodgepolepine and aspen in west-central Alberta. Forestry Canada, Northwest Region, NorthernForest Centre, Edmonton, Alberta. Forest Management Note 57.
Penner, D. 1990. Small mammals in hexazinone treated clearcut in mixedwood boreal forestsin north-central Alberta: a final report. Prepared for Forestry Canada, Alberta Fish andWildlife, and Wildlife Toxicology Fund by Penner and Associates Ltd., Sherwood Park,Alberta.
Pettapiece, W.W. 1986. Physiographic subdivision of Alberta. Agriculture Canada, AlbertaInstitute of Pedology, Edmonton, Alberta.
Sidhu, S.S. 1994. Foliar nutrient status in three borael species for three years followinghexazinone application. Communications in Soil Science and Plant Analysis, 25:2997-3007.
Sidhu, S.S.; Feng, J.C. 1991. Environmental impacts of vegetation management by mechanicaland chemical (hexazinone) methods including residue chemistry. Forestry Canada andAlberta Forest Service. Canada/Alberta Forest Resource Development Agreement. Project1412-97.
Sidhu, S.S.; Feng, J.C. 1993. Hexazinone and its metabolites in boreal forest vegetation. WeedScience, 41:281-287.
Sidhu, S.S.; Feng, J.C.; Maynard, D.G. 1993. A five-year scenario of vegetation managementin a mixedwood cutover in Alberta. Pages 94-119 in International Conference on ForestVegetation Management. Proceedings April 27 - May 1, 1992, Auburn, Alabama. AuburnUniversity, Alabama. Auburn University School of Forestry Report 1993:1.
Simpson, E.H. 1949. Measurement of diversity. Nature, 163:688.
Sokal, R.R.; Rohlf, F.J. 1981. Biometry. W.H. Freeman and Company, New York, New York.
Strong, W.L. 1992. Ecoregions and ecodistricts of Alberta. Alberta Forestry, Lands andWildlife, Edmonton, Alberta. Publication Number T/244.
Todd, P.; Brace, L. 1987. Grande Prairie forest vegetation management study: Establishmentreport. Canadian Forest Service, Northern Forestry Centre, Edmonton, Alberta.
Twardy, A.G.; Dowgray, J.V. 1985. Soil survey of two cutblock test areas and detailed analysisof blocks within the test area. Prepared for Canada/Alberta Forest Research DevelopmentProject by Pedology Consultants, Edmonton, Alberta.
Whittaker, R.H. 1975. Communities and ecosystems, second edition. MacMillan PublishingCompany, Inc., New York, New York.
Wetherill, G.B. 1981. Intermediate statistical methods. Chapman & Hall, London.
119
Zoltai, S.C.; Strong, W.L, compilers. 1989. Ecoclimatic regions of Canada. EnvironmentCanada, Canadian Wildlife Service, Canada Committee Ecological Land Classification,Ecoregions Working Group, Ottawa, Ontario. Ecological Land Classification Series,Number 23.
120
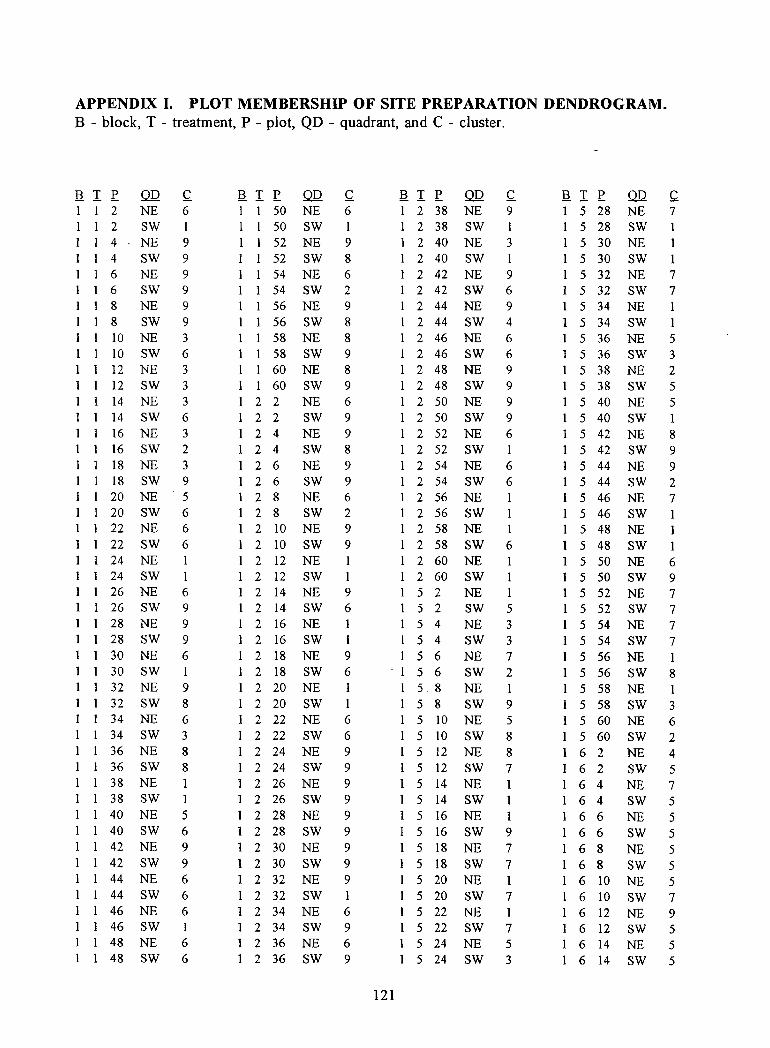
APPENDIX I. PLOT MEMBERSHIP OF SITE PREPARATION DENDROGRAM. B - block, T - treatment, P - plot, QD - quadrant, and C - cluster.
Ii I r ® ~ Ii I r ® ~ Ii I r ® ~ Ii I r ® ~ 2 NE 6 50 NE 6 2 38 NE 9 5 28 NE 7 2 SW 1 50 SW 2 38 SW 1 5 28 SW 4 NE 9 52 NE 9 2 40 NE 3 5 30 NE 4 SW 9 1 52 SW 8 2 40 SW 1 5 30 SW
1 6 NE 9 54 NE 6 I 2 42 NE 9 5 32 NE 7 1 6 SW 9 54 SW 2 1 2 42 SW 6 5 32 SW 7
8 NE 9 56 NE 9 2 44 NE 9 5 34 NE 1 8 SW 9 56 SW 8 2 44 SW 4 5 34 SW
IIIONE 3 58 NE 8 1 2 46 NE 6 5 36 NE 5 10 SW 6 58 SW 9 2 46 SW 6 5 36 SW 3 12 NE 3 60 NE 8 2 48 NE 9 5 38 NE 2
1 1 12 SW 3 1 60 SW 9 2 48 SW 9 5 38 SW 5 1 14 NE 3 2 2 NE 6 2 50 NE 9 5 40 NE 5 1 14 SW 6 2 2 SW 9 2 50 SW 9 5 40 SW
16 NE 3 2 4 NE 9 2 52 NE 6 5 42 NE 8 16 SW 2 2 4 SW 8 2 52 SW 5 42 SW 9 18 NE 3 2 6 NE 9 2 54 NE 6 5 44 NE 9
1 1 18 SW 9 2 6 SW 9 2 54 SW 6 5 44 SW 2 1 1 20 NE 5 2 8 NE 6 2 56 NE 5 46 NE 7 1 1 20 SW 6 2 8 SW 2 2 56 SW 5 46 SW 1
22 NE 6 2 10 NE 9 2 58 NE 1 5 48 NE 22 SW 6 2 10 SW 9 2 58 SW 6 5 48 SW 24 NE 2 12 NE 2 60 NE 5 50 NE 6
1 1 24 SW 2 12 SW 2 60 SW 5 50 SW 9 1 1 26 NE 6 2 14 NE 9 5 2 NE 5 52 NE 7 1 1 26 SW 9 1 2 14 SW 6 5 2 SW 5 5 52 SW 7
1 28 NE 9 2 16 NE 1 5 4 NE 3 5 54 NE 7 28 SW 9 2 16 SW 1 5 4 SW 3 5 54 SW 7 30 NE 6 2 18 NE 9 5 6 NE 7 5 56 NE 30 SW 1 2 18 SW 6 - 1 5 6 SW 2 5 56 SW 8 32 NE 9 2 20 NE 5 8 NE 5 58 NE 1 32 SW 8 2 20 SW 5 8 SW 9 5 58 SW 3
1 34 NE 6 2 22 NE 6 5 10 NE 5 5 60 NE 6 34 SW 3 2 22 SW 6 5 10 SW 8 5 60 SW 2 36 NE 8 2 24 NE 9 5 12 NE 8 6 2 NE 4
1 36 SW 8 2 24 SW 9 5 12 SW 7 6 2 SW 5 1 38 NE 2 26 NE 9 5 14 NE 6 4 NE 7
38 SW 1 2 26 SW 9 5 14 SW 6 4 SW 5 40 NE 5 2 28 NE 9 5 16 NE 6 6 NE 5 40 SW 6 2 28 SW 9 5 16 SW 9 6 6 SW 5 42 NE 9 2 30 NE 9 5 18 NE 7 6 8 NE 5 42 SW 9 2 30 SW 9 5 18 SW 7 6 8 SW 5 44 NE 6 2 32 NE 9 5 20 NE 1 6 10 NE 5 44 SW 6 2 32 SW 5 20 SW 7 6 10 SW 7 46 NE 6 2 34 NE 6 5 22 NE 1 6 12 NE 9 46 SW 2 34 SW 9 5 22 SW 7 6 12 SW 5
1 48 NE 6 2 36 NE 6 5 24 NE 5 6 14 NE 5 1 1 48 SW 6 2 36 SW 9 5 24 SW 3 6 14 SW 5
121
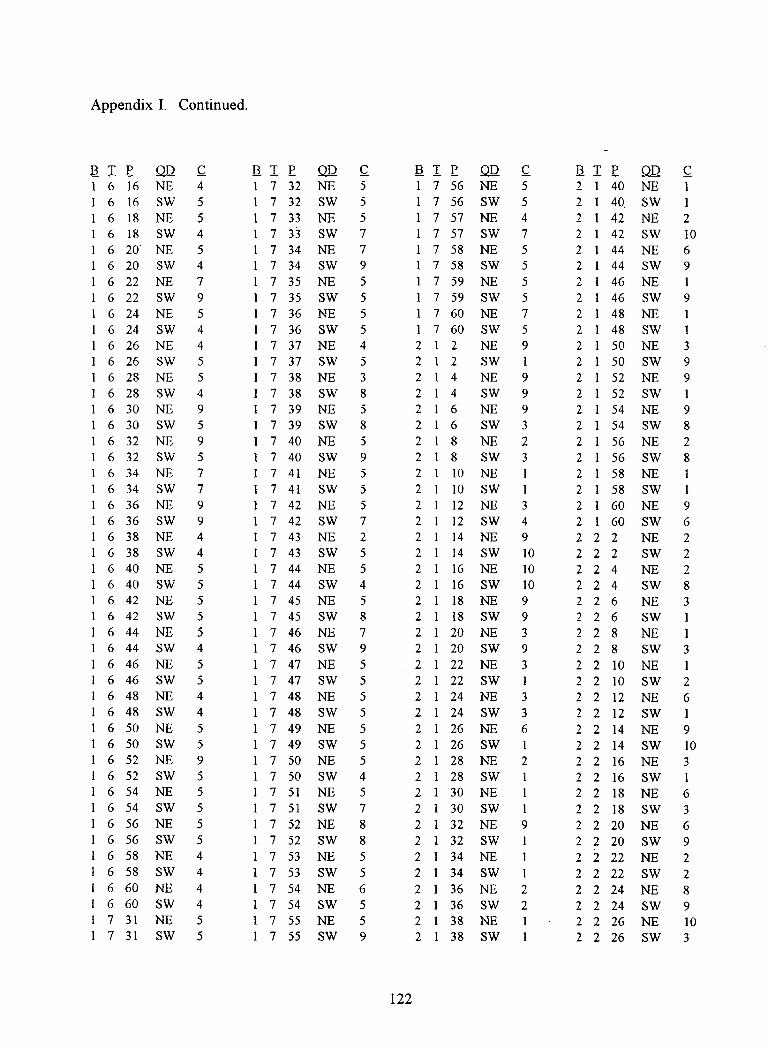
Appendix I. Continued.
11 I E ® ~ 11 I E ® ~ 6 16 NE 4 7 32 NE 5 6 16 SW 5 7 32 SW 5
6 18 NE 5 7 33 NE 5 1 6 18 SW 4 7 33 SW 7 1 6 20' NE 5 7 34 NE 7
6 20 SW 4 7 34 SW 9
6 22 NE 7 7 35 NE 5 6 22 SW 9 7 35 SW 5 6 24 NE 5 7 36 NE 5 6 24 SW 4 7 36 SW 5 6 26 NE 4 7 37 NE 4 6 26 SW 5 7 37 SW 5
1 6 28 NE 5 7 38 NE 3 6 28 SW 4 7 38 SW 8 6 30 NE 9 7 39 NE 5 6 30 SW 5 7 39 SW 8
6 32 NE 9 7 40 NE 5 1 6 32 SW 5 7 40 SW 9
6 34 NE 7 7 41 NE 5 6 34 SW 7 7 41 SW 5 6 36 NE 9 7 42 NE 5 6 36 SW 9 7 42 SW 7 6 38 NE 4 7 43 NE 2 6 38 SW 4 7 43 SW 5 6 40 NE 5 7 44 NE 5 6 40 SW 5 7 44 SW 4
1 6 42 NE 5 7 45 NE 5 6 42 SW 5 7 45 SW 8 644 NE 5 7 46 NE 7 6 44 SW 4 7 46 SW 9 6 46 NE 5 7 47 NE 5 6 46 SW 5 7 47 SW 5 6 48 NE 4 7 48 NE 5 6 48 SW 4 7 48 SW 5 6 50 NE 5 7 49 NE 5 6 50 SW 5 7 49 SW 5 6 52 NE 9 7 50 NE 5 6 52 SW 5 7 50 SW 4 6 54 NE 5 7 51 NE 5 6 54 SW 5 7 51 SW 7 6 56 NE 5 7 52 NE 8 6 56 SW 5 7 52 SW 8 6 58 NE 4 7 53 NE 5 6 58 SW 4 7 53 SW 5 6 60 NE 4 7 54 NE 6 6 60 SW 4 7 54 SW 5 7 31 NE 5 7 55 NE 5 7 31 SW 5 7 55 SW 9
122
11 I E ® ~ 7 56 NE 5 7 56 SW 5 7 57 NE 4 7 57 SW 7 7 58 NE 5 7 58 SW 5 7 59 NE 5 7 59 SW 5 7 60 NE 7 7 60 SW 5
2 2 NE 9 2 2 SW 1 2 4 NE 9 2 4 SW 9 2 6 NE 9 2 6 SW 3 2 8 NE 2 2 8 SW 3
2 10 NE 2 10 SW 2 12 NE 3 2 12 SW 4 2 14 NE 9 2 14 SW 10 2 16 NE 10 2 16 SW 10 2 18 NE 9 2 18 SW 9 2 20 NE 3 2 20 SW 9 2 22 NE 3 2 22 SW 2 24 NE 3 2 24 SW 3 2 26 NE 6 2 2 2 2 2 2 2 2 2 2 2 2 2
26 SW 1 28 NE 2 28 SW 30 NE 30 SW 1 32 NE 9 32 SW 34 NE 34 SW 1
36 NE 2 36 SW 2 38 NE 38 SW
aIE ® ~ 2 40 NE 2 40. SW 2 42 NE 2 2 42 SW 2 44 NE 2 44 SW 2 46 NE 2 46 SW 2 48 NE 2 48 SW 2 50 NE 2 50 SW 2 52 NE 2 52 SW 2 54 NE 2 54 SW 2 56 NE 2 56 SW 2 58 NE 2 58 SW 2 60 NE 2 60 222 222 224 224
226 226 228
SW NE SW NE SW NE SW NE
2 2 8 SW 2 2 10 NE 2 2 10 SW 2 2 12 NE 2 2 12 SW 2 2 14 NE
10 6 9
9
3 9 9
1 9
8 2 8
9
6 2 2 2 8 3 1 1 3
2 6 1
9 2 2 14 SW 10 2 2 16 NE 3 2 2 16 SW 2 2 18 NE 6
2 2 18 SW 3 2 2 20 NE 6
2 2 20 SW 9 2 2 22 NE 2 2 2 22 SW 2 2 2 24 NE 8 2 2 24 SW 9 2 2 26 NE 10 2 2 26 SW 3
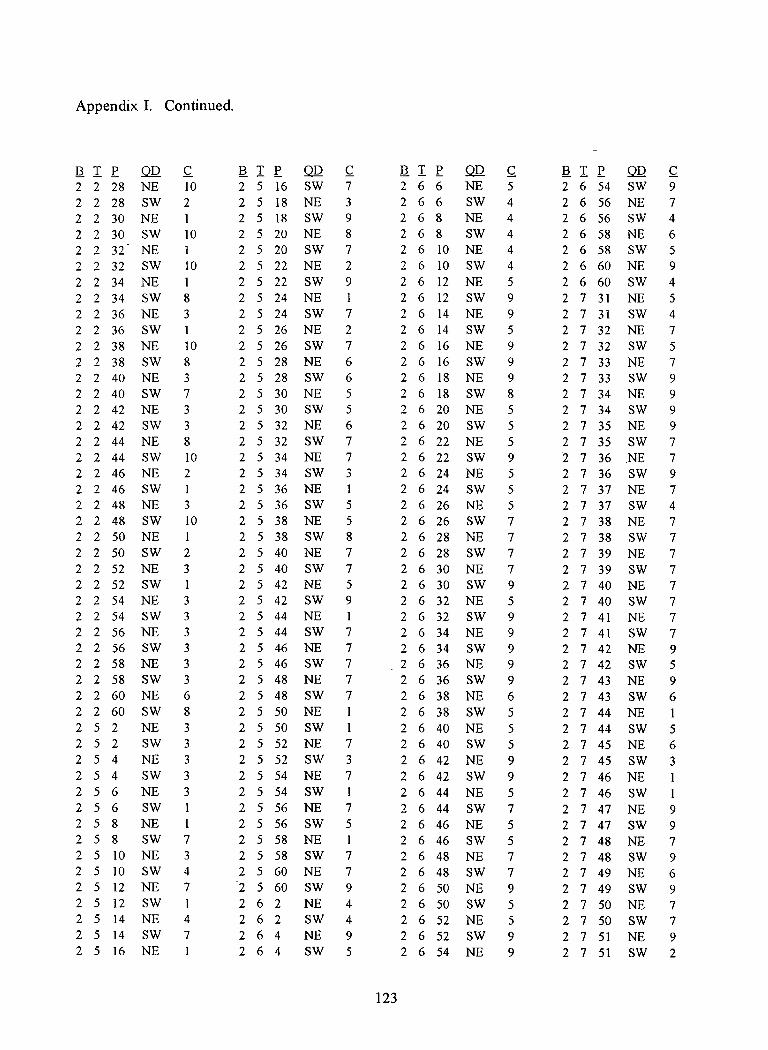
Appendix I. Continued.
aIr QQ Q aIr QQ Q aIr QQ Q a I r @ Q 2 2 28 NE 10 2 5 16 SW 7 2 6 6 NE 5 2 6 54 SW 9
2 2 28 SW 2 2 5 18 NE 3 2 6 6 SW 4 2 6 56 NE 7 2 2 30 NE 1 2 5 18 SW 9 2 6 8 NE 4 2 6 56 SW 4 2 2 30 SW 10 2 5 20 NE 8 2 6 8 SW 4 2 6 58 NE 6 2 2 32 NE 1 2 5 20 SW 7 2610 NE 4 2 6 58 SW 5 2 2 32 SW 10 2 5 22 NE 2 2 6 10 SW 4 2 6 60 NE 9
2 2 34 NE 1 2 5 22 SW 9 2 6 12 NE 5 2 6 60 SW 4 2 2 34 SW 8 2 5 24 NE 2 6 12 SW 9 2 7 31 NE 5 2 2 36 NE 3 2 5 24 SW 7 2 6 14 NE 9 2 7 31 SW 4 2 2 36 SW 1 2 5 26 NE 2 2 6 14 SW 5 2 7 32 NE 7 2 2 38 NE 10 2 5 26 SW 7 2 6 16 NE 9 2 7 32 SW 5 2 2 38 SW 8 2 5 28 NE 6 2 6 16 SW 9 2 7 33 NE 7 2 2 40 NE 3 2 5 28 SW 6 2 6 18 NE 9 2 7 33 SW 9 2 2 40 SW 7 2 5 30 NE 5 2 6 18 SW 8 2 7 34 NE 9 2 2 42 NE 3 2 5 30 SW 5 2 6 20 NE 5 2 7 34 SW 9 2 2 42 SW 3 2 5 32 NE 6 2 6 20 SW 5 2 7 35 NE 9 2 2 44 NE 8 2 5 32 SW 7 2 6 22 NE 5 2 7 35 SW 7 2 2 44 SW 10 2 5 34 NE 7 2 6 22 SW 9 2 7 36 NE 7 2 2 46 NE 2 2 5 34 SW 3 2 6 24 NE 5 2 7 36 SW 9 2 2 46 SW 1 2 5 36 NE 2 6 24 SW 5 2 7 37 NE 7 2 2 48 NE 3 2 5 36 SW 5 2 6 26 NE 5 2 7 37 SW 4 2 2 48 SW 10 2 5 38 NE 5 2 6 26 SW 7 2 7 38 NE 7 2 2 50 NE 2 5 38 SW 8 2 6 28 NE 7 2 7 38 SW 7 2 2 50 SW 2 2 5 40 NE 7 2 6 28 SW 7 2 7 39 NE 7 2 2 52 NE 3 2 5 40 SW 7 2 6 30 NE 7 2 7 39 SW 7 2 2 52 SW 1 2 5 42 NE 5 2 6 30 SW 9 2 7 40 NE 7 2 2 54 NE 3 2 5 42 SW 9 2 6 32 NE 5 2 7 40 SW 7 2 2 54 SW 3 2 5 44 NE 1 2 6 32 SW 9 2 7 41 NE 7 2 2 56 NE 3 2 5 44 SW 7 2 6 34 NE 9 2 7 41 SW 7 2 2 56 SW 3 2546 NE 7 2 6 34 SW 9 2 7 42 NE 9 2 2 58 NE 3 2 5 46 SW 7 2 6 36 NE 9 2 7 42 SW 5 2 2 58 SW 3 2 5 48 NE 7 2 6 36 SW 9 2 7 43 NE 9 2260 NE 6 2 5 48 SW 7 2 6 38 NE 6 2 7 43 SW 6 2 2 60 SW 8 2 5 50 NE 2 6 38 SW 5 2 7 44 NE 1 2 5 2 NE 3 2 5 50 SW 2 6 40 NE 5 2 7 44 SW 5 2 5 2 SW 3 2 5 52 NE 7 2 6 40 SW 5 2 7 45 NE 6 2 5 4 NE 3 2 5 52 SW 3 2 6 42 NE 9 2 7 45 SW 3 2 5 4 SW 3 2 5 54 NE 7 2 6 42 SW 9 2 7 46 NE 2 5 6 NE 3 2 5 54 SW 1 2 6 44 NE 5 2 7 46 SW 1 2 5 6 SW 2 5 56 NE 7 2 6 44 SW 7 2 7 47 NE 9 2 5 8 NE 2 5 56 SW 5 2 6 46 NE 5 2 7 47 SW 9 2 5 8 SW 7 2 5 58 NE 2 6 46 SW 5 2 7 48 NE 7 2510 NE 3 2 5 58 SW 7 2 6 48 NE 7 2 7 48 SW 9 2 5 10 SW 4 2 5 60 NE 7 2 6 48 SW 7 2 7 49 NE 6 2 5 12 NE 7 '2 5 60 SW 9 2 6 50 NE 9 2 7 49 SW 9 2 5 12 SW 262 NE 4 2 6 50 SW 5 2 7 50 NE 7 2 5 14 NE 4 2 6 2 SW 4 2 6 52 NE 5 2 7 50 SW 7 2 5 14 SW 7 2 6 4 NE 9 2 6 52 SW 9 2 7 51 NE 9 2 5 16 NE 2 6 4 SW 5 2 6 54 NE 9 2 7 51 SW 2
123
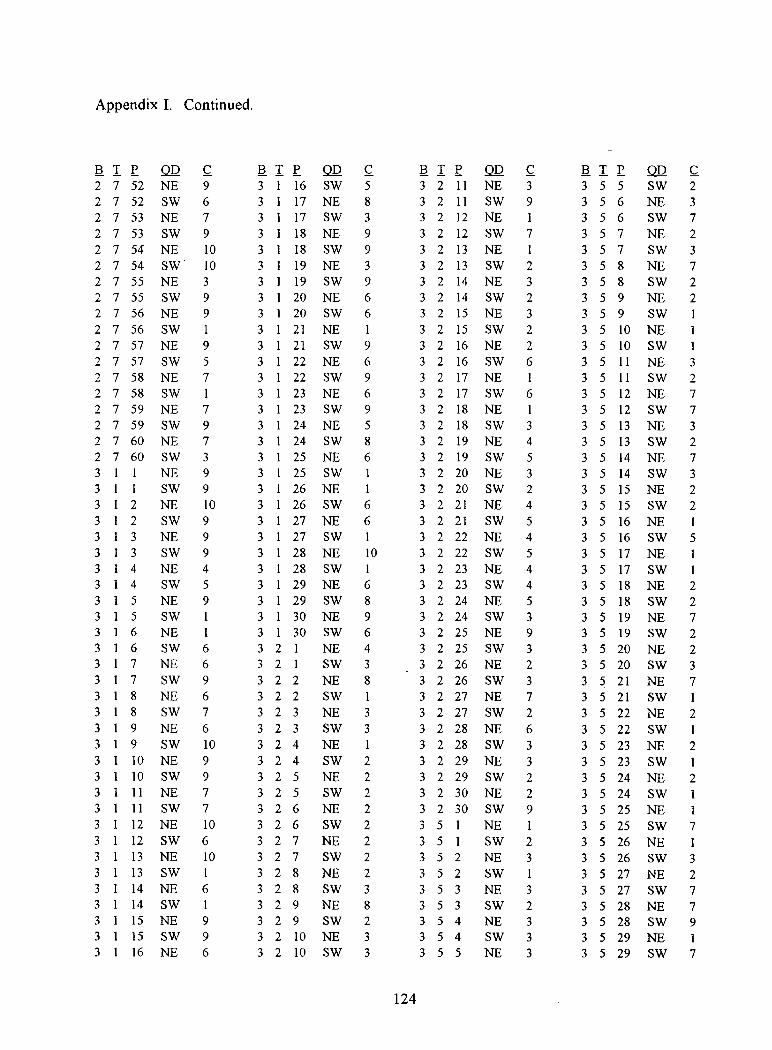
Appendix I. Continued.
RIE QI2 ~ 2 7 52 NE 9 2 7 52 SW 6 2 7 53 NE 7 2 7 53 SW 9 2 7 54 NE 10 2 7 54 SW· 10 2 7 55 NE 3 2 7 55 SW 9 2 7 56 NE 9
2 7 56 SW 1 2 7 57 NE 9 2 7 57 SW 5 2 7 58 NE 7 2 7 58 SW 1
2 7 59 NE 7 2 7 59 SW 9 2 7 60 NE 7 2 7 60 SW 3 3 NE 9 3 3 3
SW 9 2 NE 10 2 SW 9
3 3 3 3 3 1 4 3 1 4 3 5 3 5 3 6 3 6 3 7 3 7 3 8 3 8
NE SW NE SW NE SW NE SW NE SW NE SW
9
9 4 5 9
1 6 6 9
6 7
3 3 3 3 3 3 3 3
9 NE 6 9 SW 10 10 NE 9
10 SW 9 11 NE 7 11 SW 7
12 NE 10 12 SW 6
3 1 13 NE 3 13 SW 3 14 NE 3 1 14 SW 3 15 NE 3 15 SW 3 16 NE
10 1 6
9 9
6
RIE QI2 3 16 SW 3 17 NE 3 17 SW 3 18 NE 3 18 SW 3 19 NE 3 19 SW 3 20 NE
~ 5 8 3 9 9 3 9 6
3 3 3 3 3 3 3 3 3 3 3 3 3 3
20 SW 6 21 NE 21 SW 9
22 NE 6
22 SW 9 23 NE 6 23 SW 9 24 NE 5 24 SW 8 25 NE 6 25 SW 26 NE 1 26 SW 6 27 NE 6
3 27 SW 3 28 NE 3 28 SW 3 29 NE 3 29 SW 3 30 NE 3 30 SW 3 2 NE 3 2 1 SW 322 NE 3 2 2 SW 3 2 3 NE
10 1 6 8 9 6 4 3 8 1 3
323 324 324 325 325
SW 3 NE 1 SW 2 NE 2 SW 2
3 2 6 NE 2 3 2 6 SW 2 327 NE 2 327 328
328
SW NE SW
2 2 3
329 NE 8 3 2 9 SW 2 3210 NE 3 3 2 10 SW 3
124
RIE QI2 3211 NE 3 2 11 SW 3 2 12 NE 3 2 12 SW 3 2 13 NE 3 2 13 SW 3 2 14 NE 3 2 14 SW
~ 3 9
7 1 2 3 2
3 2 15 NE 3 3 2 15 SW 2 3 2 16 NE 2 3 2 16 SW 6 3 2 17 NE 3 2 17 SW 6 3 2 18 NE 1
3 2 18 SW 3 3 2 19 NE 4 3 2 19 SW 5 3 2 20 NE 3 3 2 20 SW 2 3 2 21 NE 4 3 2 21 SW 5 3 2 22 NE 4 3 2 22 SW 5 3 2 23 NE 4 3 2 23 SW 4 3 2 24 NE 5 3 2 24 SW 3 3 2 25 NE 9 3 2 25 SW 3 3 2 26 NE 2 3 2 26 SW 3 3 2 27 NE 7 3 2 27 SW 2 3 2 28 NE 6 3 2 28 SW 3
3 2 29 NE 3 3 2 29 SW 2 3 2 30 NE 2 3 2 30 SW 9 3 5 NE 3 5 SW 2 352 352 353 353 3 5 4 3 5 4 3 5 5
NE SW NE
3
3 SW 2 NE 3 SW 3 NE 3
R I E 355 356 356 357 357 358 358 359
QI2 SW NE SW NE SW NE SW NE
3 5 9 SW 3 5 10 NE 3 5 10 SW
~ 2
3 7 2 3 7 2 2
3511 NE 3 3 5 11 SW 2 3 5 12 NE 7 3 5 12 SW 7 3 5 13 NE 3 3 5 13 SW 2 3 5 14 NE 7 3 5 14 SW 3 3 5 15 NE 2 3 5 15 SW 2 3 5 16 NE 3 5 16 SW 3 5 17 NE 3 5 17 SW 3 5 18 NE 3 5 18 SW 3 5 19 NE 3 5 19 SW 3 5 20 NE 3 5 20 SW 3 5 21 NE 3 5 21 SW 3 5 22 NE 3 5 22 SW
5
2 2 7 2 2 3 7
2
3 5 23 NE 2 3 5 23 SW 3 5 24 NE 2 3 5 24 SW 3 5 25 NE 1 3 5 25 SW 7 3 5 26 NE 1 3 5 26 SW 3 5 27 NE 3 5 27 SW 3 5 28 NE 3 5 28 SW 3 5 29 NE 3 5 29 SW
3 2 7 7 9 1 7
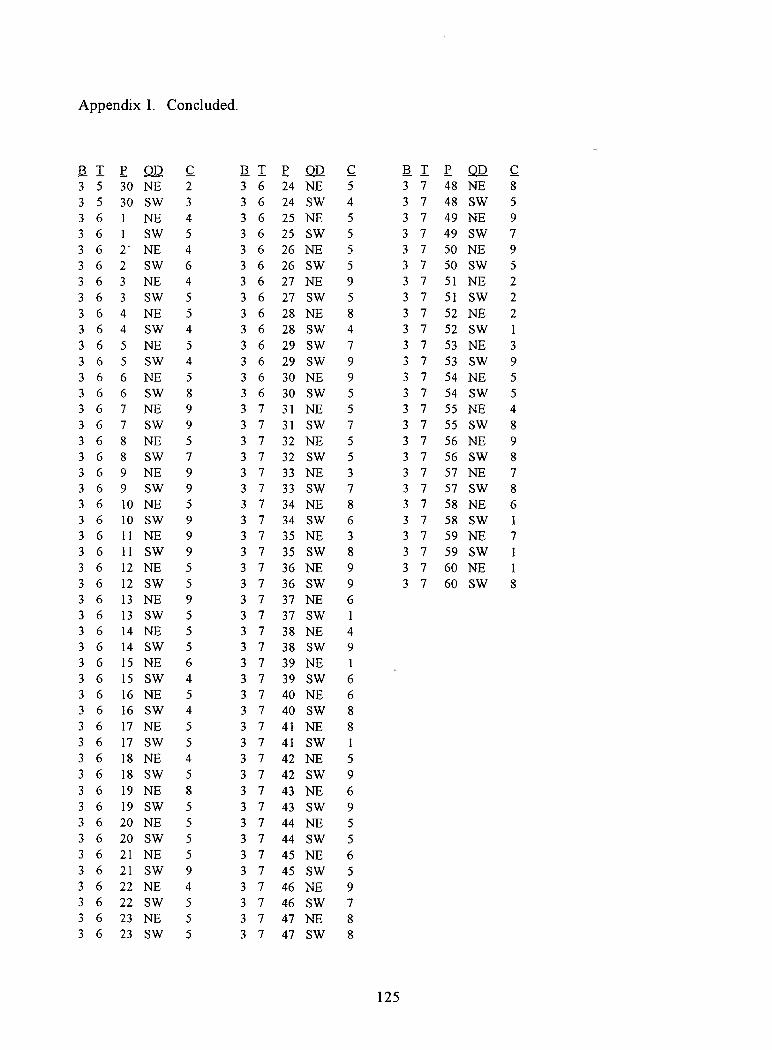
Appendix I. Concluded.
!iI£QQ ~ !iI £ QQ ~ !iI£QQ ~ 3 5 30 NE 2 3 6 24 NE 5 3 7 48 NE 8 3 5 30 SW 3 3 6 24 SW 4 3 7 48 SW 5 3 6 NE 4 3 6 25 NE 5 3 7 49 NE 9 3 6 SW 5 3 6 25 SW 5 3 7 49 SW 7 3 6 2· NE 4 3 6 26 NE 5 3 7 50 NE 9 3 6 2 SW 6 3 6 26 SW 5 3 7 50 SW 5 3 6 3 NE 4 3 6 27 NE 9 3 7 51 NE 2 3 6 3 SW 5 3 6 27 SW 5 3 7 51 SW 2 3 6 4 NE 5 3 6 28 NE 8 3 7 52 NE 2 3 6 4 SW 4 3 6 28 SW 4 3 7 52 SW 3 6 5 NE 5 3 6 29 SW 7 3 7 53 NE 3 3 6 5 SW 4 3 6 29 SW 9 3 7 53 SW 9 366 NE 5 3 6 30 NE 9 3 7 54 NE 5 3 6 6 SW 8 3 6 30 SW 5 3 7 54 SW 5 3 6 7 NE 9 3 7 31 NE 5 3 7 55 NE 4 3 6 7 SW 9 3 7 31 SW 7 3 7 55 SW 8 3 6 8 NE 5 3 7 32 NE 5 3 7 56 NE 9 3 6 8 SW 7 3 7 32 SW 5 3 7 56 SW 8 369 NE 9 3 7 33 NE 3 3 7 57 NE 7 3 6 9 SW 9 3 7 33 SW 7 3 7 57 SW 8 3 6 10 NE 5 3 7 34 NE 8 3 7 58 NE 6 3 6 10 SW 9 3 7 34 SW 6 3 7 58 SW 1 3 6 11 NE 9 3 7 35 NE 3 3 7 59 NE 7 3 6 11 SW 9 3 7 35 SW 8 3 7 59 SW 3 6 12 NE 5 3 7 36 NE 9 3 7 60 NE 1 3 6 12 SW 5 3 7 36 SW 9 3 7 60 SW 8 36 l3NE 9 3 7 37 NE 6 3 6 13 SW 5 3 7 37 SW 3 6 14 NE 5 3 7 38 NE 4 3 6 14 SW 5 3 7 38 SW 9 3 6 15 NE 6 3 7 39 NE 1 3 6 15 SW 4 3 7 39 SW 6 3 6 16 NE 5 3 7 40 NE 6 3 6 16 SW 4 3 7 40 SW 8 3 6 17 NE 5 3 7 41 NE 8 3 6 17 SW 5 3 7 41 SW 1 3 6 18 NE 4 3 7 42 NE 5 3 6 18 SW 5 3 7 42 SW 9 3 6 19 NE 8 3 7 43 NE 6 3 6 19 SW 5 3 7 43 SW 9 3 6 20 NE 5 37 44NE 5 3 6 20 SW 5 3 7 44 SW 5 3 6 21 NE 5 3 7 45 NE 6 3 6 21 SW 9 3 7 45 SW 5 3 6 22 NE 4 3 7 46 NE 9 3 6 22 SW 5 3 7 46 SW 7 3 6 23 NE 5 3 7 47 NE 8 3 6 23 SW 5 3 7 47 SW 8
125
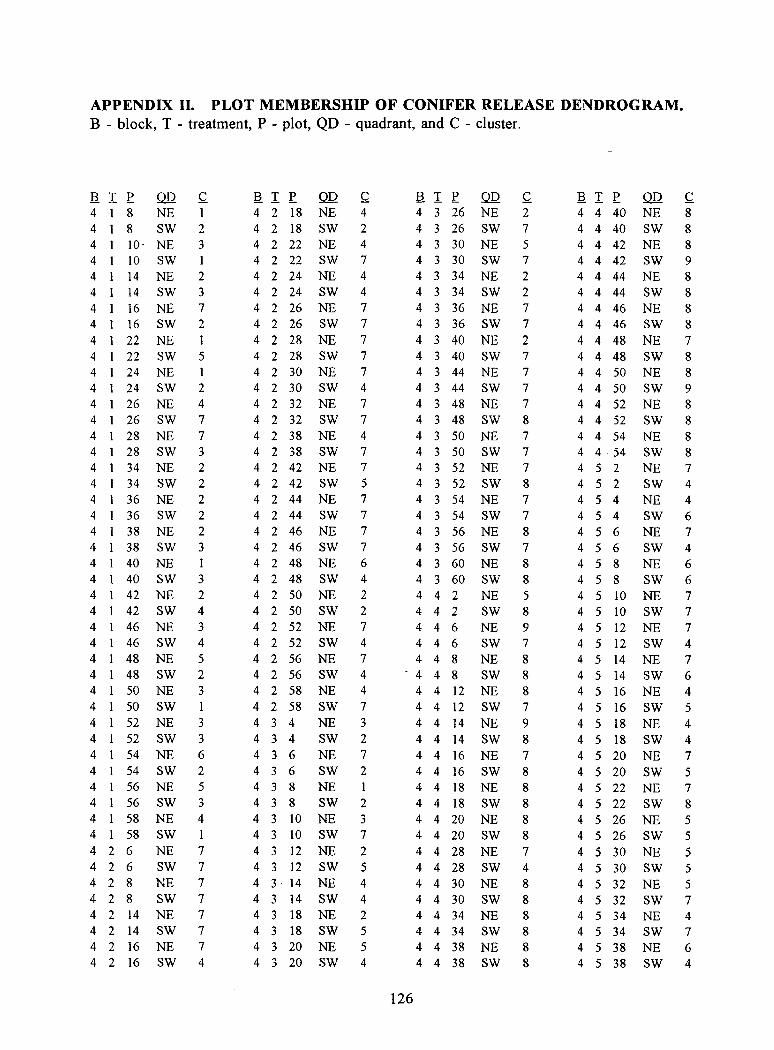
APPENDIX II. PLOT MEMBERSHIP OF CONIFER RELEASE DENDROGRAM. B - block, T - treatment, P - plot, QD - quadrant, and C - cluster.
a I r 4 8
QQ NE
4 8 SW 4 1 10- NE 4 1 10 SW 4 1 14 NE
2 3 1 2
4 1 14 SW 3 4 16 NE 7 4 4
16 SW 2 22 NE 1
4 1 22 SW 4 24 NE 4 1 24 SW 4 1 26 NE 4 1 26 SW 4 1 28 NE 4 1 28 SW 4 1 34 NE 4 1 34 SW 4 1 36 NE 4 36 SW 4 38 NE 4 1 38 SW 4 40 NE 4 40 SW 4 1 42 NE 4 1 42 SW 4 1 46 NE 4 1 46 SW 4 48 NE 4 48 SW 4 50 NE 4 50 SW 4 52 NE 4 1 52 SW 4 1 54 NE 4 1 54 SW 4 56 NE 4 56 SW 4 58 NE 4 58 SW 4 2 6 NE 4 2 6 SW 4 2 8 NE 4 2 8 SW 4 2 14 NE 4 2 14 SW 4 2 16 NE
5 1 2 4 7 7 3 2 2 2 2 2 3
3 2 4 3 4 5 2 3 1 3 3 6 2 5 3 4 1 7 7 7 7 7 7 7
4 2 16 SW 4
aIr QQ 4 2 18 NE 4 2 18 SW 4 2 22 NE 4 2 22 SW 4 2 24 NE
~ 4 2 4 7 4
4 2 24 SW 4 4 2 26 NE 7 4 2 26 SW 7 4 2 28 NE 7 4 2 28 SW 4 2 30 NE 4 2 30 SW 4 2 32 NE 4 2 32 SW 4 2 38 NE 4 2 38 SW 4 2 42 NE 4 2 42 SW 4244 NE 4 2 44 SW 4 2 46 NE 4 2 46 SW 4 2 48 NE 4 2 48 SW 4 2 50 NE 4 2 50 SW 4 2 52 NE 4 2 52 SW 4 2 56 NE 4 2 56 SW 4 2 58 NE 4 2 58 SW 4 3 4 NE 4 3 4 SW 4 3 6 NE 4 3 6 SW 4 3 8 NE 4 3 8 SW 4 3 10 NE 4 3 10 SW 4 3 12 NE 4 3 12 SW 4 3 14 NE 4 3 14 SW 4 3 18 NE 4 3 18 SW 4 3 20 NE
7 7 4 7 7 4 7 7 5 7 7 7 7 6 4 2 2 7 4 7 4 4 7 3 2 7 2
2 3 7 2 5 4 4 2 5 5
4 3 20 SW 4
aIr QQ ~ 4 3 26 NE 2 4 3 26 SW 7 4 3 30 NE 5 4 3 30 SW 7 4 3 34 NE 2 4 3 34 SW 2 4 3 36 NE 7 4 3 36 SW 7 4 3 40 NE 2 4 3 40 SW 4 3 44 NE 4 3 44 SW 4 3 48 NE 4 3 48 SW 4 3 50 NE 4 3 50 SW 4 3 52 NE 4 3 52 SW 4 3 54 NE 4 3 54 SW 4 3 56 NE 4 3 56 SW 4 3 60 NE 4 3 60 SW 4 4 2 NE 4 4 2 SW 4 4 6 NE 4 4 6 SW 4 4 8 NE
- 4 4 8 SW 4 4 12 NE 4 4 12 SW 4 4 14 NE 4 4 14 SW 4 4 16 NE 4 4 16 SW 4 4 18 NE 4 4 18 SW 4 4 20 NE 4 4 20 SW 4 4 28 NE 4 4 28 SW 4 4 30 NE 4 4 30 SW 4 4 34 NE 4 4 34 SW 4 4 38 NE
7 7 7 7 8 7 7 7 8 7 7 8 7 8 8 5 8 9 7 8 8 8 7 9 8 7 8 8 8 8 8 7 4 8 8 8 8 8
4 4 38 SW 8
126
aIr QQ 4 4 40 NE 4 4 40 SW 4 4 42 NE 4 4 42 SW 4444 NE
~ 8 8 8 9 8
4 4 44 SW 8 4 4 46 NE 8 4 4 46 SW 8 4 4 48 NE 7 4 4 48 SW 4 4 50 NE 4 4 50 SW 4 4 52 NE 4 4 52 SW 4 4 54 NE 4 4 54 SW 4 5 2 NE 4 5 2 SW 4 5 4 NE 4 5 4 SW 4 5 6 NE 4 5 6 SW 4 5 8 NE 4 5 8 SW 4 5 10 NE 4 5 10 SW 4 5 12 NE 4 5 12 SW 4 5 14 NE 4 5 14 SW 4 5 16 NE 4 5 16 SW 4 5 18 NE 4 5 18 SW 4 5 20 NE 4 5 20 SW 4 5 22 NE 4 5 22 SW 4 5 26 NE 4 5 26 SW 4 5 30 NE 4 5 30 SW 4 5 32 NE 4 5 32 SW 4 5 34 NE 4 5 34 SW 4 5 38 NE
8 8 9 8 8 8 8 7 4 4 6 7 4 6 6 7 7 7 4 7 6 4 5 4 4 7 5 7 8 5 5 5 5 5 7 4 7 6
4 5 38 SW 4
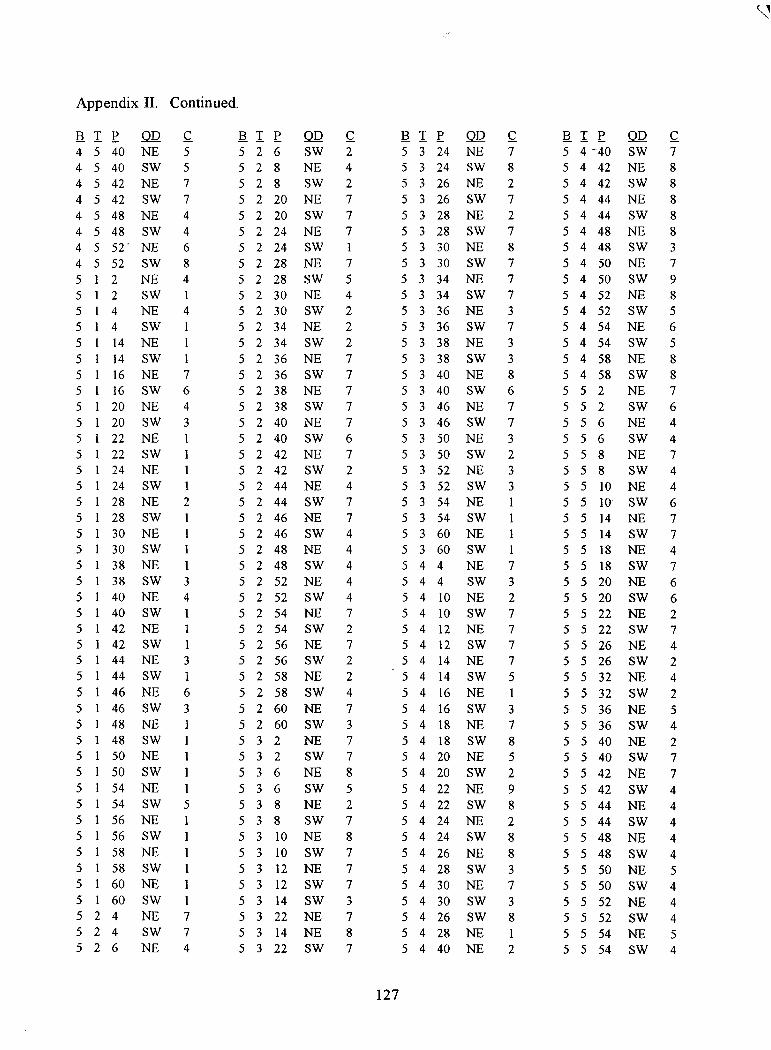
Appendix II. Continued.
alE QI2 ~ 4 5 40 NE 5 4 5 40 SW 5 4 5 42 NE 7 4 5 42 SW 7 4 5 48 NE 4 4 5 48 SW 4 4 5 52' NE 6 4 5 52 SW 8 5 2 NE 4 5 1 2 SW 514 NE 4 5 4 SW 1 5 14 NE 5 14 SW 5 16 NE 7 5 1 16 SW 6 5 20 NE 4 5 20 SW 3
22 NE 22 SW 24 NE 24 SW.
5 5 5 5 5 5 5 5 5 5 5
28 NE 2 28 SW 30 NE 30 SW 38 NE 38 SW 3 40 NE 4
5 40 SW 5 1 42 NE 5 1 42 SW 5 44 NE 5 44 SW 5 46 NE 5 1 46 SW 5 1 48 NE 5 1 48 SW 5 50 NE 5 50 SW 5 54 NE 5 1 54 SW 5 1 56 NE 5 56 SW 5 58 NE 5 58 SW 5 60 NE 5 1 60 SW 5 2 4 NE
3 1
6 3
5
7 5 2 4 SW 7
526 NE 4
alE QI2 ~ 5 2 6 SW 2 528 NE 4 5 2 8 SW 2
5 2 20 NE 7 5 2 20 SW 7 5 2 24 NE 7 5 2 24 SW 5 2 28 NE 7 5 2 28 SW 5 5 2 30 NE 4 5 2 30 SW 2 5 2 34 NE 2 5 2 34 SW 2 5 2 36 NE 7
5 2 36 SW 7 5 2 38 NE 7 5 2 38 SW 7 5 2 40 NE 7 5 2 40 SW 6 5 2 42 NE 7 5 2 42 SW 2 5 2 44 NE 4 5 2 44 SW 7 5 2 46 NE 7 5 2 46 SW 4 5 2 48 NE 4 5 2 48 SW 4 5 2 52 NE 4 5 2 52 SW 4 5 2 54 NE 7 5 2 54 SW 2 5 2 56 NE 7 5 2 56 SW 2 5 2 58 NE 2
5 2 58 SW 4 5260 NE 7 5 2 60 SW 3 5 3 2 NE 7 5 3 2 SW 7
536 NE 8 5 3 6 SW 5 5 3 8 NE 2
5 3 8 SW 7 5310 NE 8 5 3 10 SW 7 5 3 12 NE 7 5 3 12 SW 7 5 3 14 SW 3 5 3 22 NE 7 5 3 14 NE 8 5 3 22 SW 7
alE QI2 ~ alE QI2 ~ 5 3 24 NE 7 5 4 -40 SW 7 5 3 24 SW 8 5 4 42 NE 8 5 3 26 NE 2 5 4 42 SW 8 5 3 26 SW 7 5444 NE 8 5 3 28 NE 2 5 4 44 SW 8 5 3 28 SW 7 5 4 48 NE 8 5 3 30 NE 8 5 4 48 SW 3 5 3 30 SW 7 5 4 50 NE 7 5 3 34 NE 7 5 4 50 SW 9 5 3 34 SW 7 5 4 52 NE 8 5 3 36 NE 3 5 4 52 SW 5 5 3 36 SW 7 5 4 54 NE 6 5 3 38 NE 3 5 4 54 SW 5 5 3 38 SW 3 5 4 58 NE 8 5 3 40 NE 8 5 4 58 SW 8 5 3 40 SW 6 5 5 2 NE 7
5 3 46 NE 7 5 5 2 SW 6 5 3 46 SW 7 556 NE 4 5 3 50 NE 3 5 5 6 SW 4 5 3 50 SW 2 5 5 8 NE 7 5 3 52 NE 3 5 5 8 SW 4 5 3 52 SW 3 5510 NE 4 5 3 54 NE 5 5 10 SW 6 5 3 54 SW 5 5 14 NE 7 5 3 60 NE 5 5 14 SW 7 5 3 60 SW 1 5 5 18 NE 4 5 4 4 NE 7 5 5 18 SW 7 5 4 4 SW 3 5 5 20 NE 6 5410 NE 2 5 5 20 SW 6 5 4 10 SW 7 5 5 22 NE 2 5 4 12 NE 7 5 5 22 SW 7 5 4 12 SW 7 5 5 26 NE 4 5 4 14 NE 7 5 5 26 SW 2 5 4 14 SW 5 5 5 32 NE 4 5 4 16 NE 5 5 32 SW 2 5 4 16 SW 3 5 5 36 NE 5 5 4 18 NE 7 5 5 36 SW 4 5 4 18 SW 8 5 5 40 NE 2 5 4 20 NE 5 5 5 40 SW 7 5 4 20 SW 2 5 5 42 NE 7 5 4 22 NE 9 5 5 42 SW 4 5 4 22 SW 8 5 5 44 NE 4 5 4 24 NE 2 5 5 44 SW 4 5 4 24 SW 8 5 5 48 NE 4 5 4 26 NE 8 5 5 48 SW 4 5 4 28 SW 3 5 5 50 NE 5 5 4 30 NE 7 5 5 50 SW 4 5 4 30 SW 3 5 5 52 NE 4 5 4 26 SW 8 5 5 52 SW 4 5 4 28 NE 5 5 54 NE 5 5 4 40 NE 2 5 5 54 SW 4
127
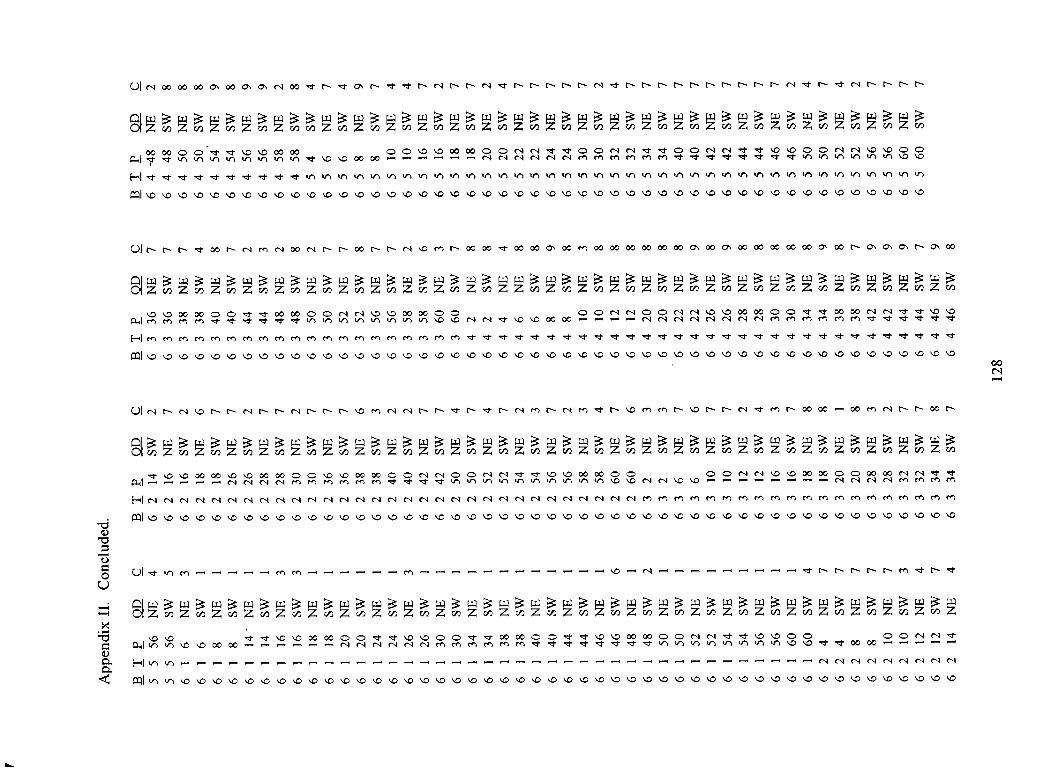
01 N 00 00 00 ON 00 ON ON N 00 4,,r N •d" 1- el- N N N N N N N N N N N N N N N N N N N N N et N et N N N N N
00 00 0 O et et VD k..0 00 00 0 0 'O ∎1D 00 00 CD CD N N et et 0 cp N N et et 0 cp N N et et qD 0 0 N N nsip 'O c)0.41 7t vn vl vn vn vn vn vn vn et vD, nID 00 00 N N N N N N en en en en rn rn et et et et et et et et If vn vn vn vn vn VD ∎ID
E.I et et et et et et et et et et vn v1 vn in in vn vn vn v1 vn vn vn vn v1 vn vn vn v1 vn in vt vn vn vn v1 vn v1 in vn vn vn v1 vn vn vn in in vn
=I .0 .0 .0 .0 %0 '.0 .0 .0 .0 .0 .0 .0 .0 .0 .0 .0 .0 .0 .0 .0 .0 .0 .0 .0 .0 .0 .0 .0 .0 .0 .0 .0 .0 .0 .0 .0 .0 .0 .0 VD 1/40 1/40 1/40 1/40 1/40 1/40 1/40
01 N -I- 00 N N M N 00 N N t--- 00 N N c•-n N 00 00 1- 00 00 ON 00 Ki 00 00 00 00 00 00 O\ 00 01/4 00 00 00 00 00 ON 00 N ON ON 01 N 0'. 00
Qua3u4w3w3LraLtar.4w4.1f-Tuaww401ZcIDZc/DZcnZcIDZv)ZcnZcnZr/DZvIZV)ZciDZZr/DZc/DZcnZr/DZv)Zc/)Zr/DZcnZvDZyDZci)ZcI)ZV)Zy)
, l0 00 00 0 0 .1* el- 00 00 0 0 N N 1/40 '.0 00 00 0 0 0 0 N N 0 0 N N VD VD 00 00 0 0 1- et 00 00 N N el- 1- 1/40 VD0-11 rn en en en 1- .1r .1. .1- 1- el- ,r) v1 kr) V') tr) kr) ,r) ,r) '.0 N N et 1/40 .0 00 00 N N N N N N N en en en en en en 1- et 1- 1- 1-
HI en en en en en en en cn en en en en en en en en en en en en 'CI- et et .1- .1- '1- el- et •,:1- et .1- -1' et et el- 1- et et et .1- .1* '1- .1- 1. et .1. el- el- '1' "1-
MI .0 .0 1/40 1/40 1/40 1/40 1/40 1/40 1/40 1/40 1/40 1/40 1/40 1/40 1/40 1/4.C) 0 1/40 .0 1/40 1/40 1/40 .0 .0 .0 .0 1/40 1/40 .0 .0 .0 .0 .0 .0 .0 .0 .0 .0 .0 .0 1/40 1/40 1/40 .0 .0 .0 .0 .0
01 N N N N N N N N N N N N 'X) en N N N t--- et N et N N en t--- N en et N nID en en N VD N t--- N et en N 00 00 00 en N N N 00 N
-ci
"E")0 01 *1-
el- '.0 1/40 00 00 1/40 1/40 00 00 0 0 1/40 1/40 00 00 0 0 N N 0 0 N N el- 1- 1/40 1/40 00 00 0 0 0 0 N N '.0 '.0 00 00 0 0 00 00 N N 1- d-P.I N N N N en en en en en en el- 1- 1- 1- tr.) tr) tin kr) v") trl trl krn krl ,r) VD '.0 N N VD '.0 N N N N en en en to
H N N N N N N N N N N N N N N N N N N N N N N N N N N N N N N N en en en en en en en en en en en cn en en en en en en en en
MI 1/40 1/40 1/40 ..0 .0 .0 .0 1/40 1/40 1/40 1/40 1/40 1/40 .0 .0 n0 .0 .0 .0 .0 .0 .0 .0 .0 .0 1/40 1/4.0 .0 .0 .0 .0 .0 .0 .0 .0 .0 .0 .0 .0 .0 v0 .0 .0 .0 .0 .0 .,0 .0 .0 .0 .0
en en M 1/40 - N et N N N t`... N en .1-
r./)ZCIDZ(r)ZCnZV)ZCnZ(/)ZVDZCIDZV/Zr/DZV)ZCI)ZV)ZCnZV)ZV)ZCAZ(/) Z V) Z CnZ C/D Z C/D Z Cr)ZCnZ
X• ,-4
,
121 1/40 1/40 .1- et 1/40 1/40 00 00 0 0 et et 1/40 1/40 0 0 et- .1- 00 00 0 0 et el- 1/40 1/40 00 00 0 0 N N et 1- 1/40 1/40 0 0 0 0 N N .1-z a.,I tr) tr) 1/40 1/40 00 00 N N N N N N en en en en en en -I- 1- 1- 1- 1- 'I- .1- "1- V) in trl ,r) .11 tn (11 tr) 1/40 VD .1- ,r 00 00G)
E--,Iv-, v1 N N N N N N N N N
Q (41,f, kr) NO VD VD 1/4.0 1/40 1/40 VD 10 10 1/40 VD 1/4-0 1/40 1/40 1/40 10 '.0 1/40 1/40 VD VD VD VD VD VD ,..0 '.0 n0 1/40 1/40 1/40 1/40 1/40 VD VD VD '.0 '.0 VD 1/40 1/40 1/40 10 1/40 '.0 1/40 1/40 '.0 10