Embed Size (px)
Citation preview

Archives of Medical Research 37 (2006) 778–786
ORIGINAL ARTICLE
Vegetable Protein and Fiber from Cereal Are InverselyAssociated with the Risk of Hypertension in a Spanish Cohort
Alvaro Alonso,a,b Juan Jose Beunza,c Maira Bes-Rastrollo,a Raquel M. Pajares,a andMiguel Angel Martınez-Gonzaleza
aDepartment of Preventive Medicine and Public Health, cService of Internal Medicine, University Clinic,
School of Medicine, University of Navarra, Pamplona, SpainbDepartment of Epidemiology, Harvard School of Public Health, Boston, Massachusetts
Received for publication June 6, 2005; accepted January 11, 2006 (ARCMED-D-05-00217).
Background. Some cross-sectional studies suggest that fiber and protein intake can beassociated with lower levels of blood pressure, but results from prospective cohorts arescarce and none has been conducted outside the U.S.
Methods. The SUN cohort followed-up prospectively 5880 Spanish men and women olderthan 20 years of age, all university graduates. Dietary information was gathered at baselinewith a previously validated semiquantitative food frequency questionnaire. New cases ofmedically diagnosed hypertension (HT) were identified through responses to a mailedquestionnaire after at least 2 years from recruitment.
Results. One hundred and eighty new cases of HT were ascertained after a median fol-low-up of 28 months. After adjustment for potential confounders and several dietary fac-tors, participants in the highest quintile of vegetable protein intake had a lower risk ofincident HT compared with those in the lowest quintile ½hazard ratio (HR) 5 0.5, 95%confidence interval (CI) 0.220.9, p for trend 5 0.06�. Similarly, fiber from cereals wasinversely associated with a lower risk of HT (HR comparing fifth vs. first quintile 50.6, 95% CI 0.3–1.0, p for trend 5 0.05). Risk reduction was more important amongmen and obese and older individuals. Total or animal protein and total fiber as well asfiber from other sources different from cereal were not associated with the risk of HT.
Conclusions. In this Mediterranean cohort, dietary intake of vegetable protein and fiberfrom cereals was associated with a lower risk of HT when other nutrients were also takeninto consideration. � 2006 IMSS. Published by Elsevier Inc.
Key Words: Fiber, Protein, Hypertension, Prospective studies, Mediterranean diet, Spain.
Introduction
The most recent statement on the primary prevention of hy-pertension (HT) published by the National High BloodPressure Education Program Coordinating Committee ac-cepted the role of some dietary factors in a multifactorialapproach for the prevention of this disorder. Nonetheless,it also recognized that further research is still needed. Par-ticularly, this statement recommends investigating the role
Address reprint requests to: Dr. Miguel Angel Martınez-Gonzalez. De-
partment of Preventive Medicine and Public Health. University of Navarra,
Irunlarrea, 1, 31008 Pamplona, Spain; E-mail: [email protected]
0188-4409/06 $–see front matter. Copyright � 2006 IMSS. Published by Elsevdoi: 10.1016/j.arcmed.2006.01.007
of dietary protein and fiber intake in the prevention of HT(1). So far, the effect of both nutrients in the pathogenesisand prevention of this condition remains elusive.
Recently, two meta-analyses of randomized trials haveshown that fiber supplementation can exert a small benefi-cial effect on blood pressure (BP) levels, particularlyamong hypertensives (2–3). But the trials included in bothstudies assessed short-term interventions (!6 months).Results from well-conducted cohort studies consistentlysuggest that fiber, especially from cereals, can reducethe risk of coronary heart disease (4–7), stroke (8,9) andperipheral arterial disease (10,11). A possible mechanism toexplain this effect could be a reduction in BP values. But
ier Inc.

779Protein and Fiber Intake and Risk of Hypertension
prospective studies that have assessed the role of fiber in theincidence of HT are scarce (12–14), failing on occasion toseparate the effect of different types of fiber (15), and theyhave been conducted exclusively in the U.S.
The study of the relationship between protein intake andBP presents similar problems. Most studies have beencross-sectional, did not discriminate between animal andvegetable protein, or did not adjust for potential dietaryconfounders (15–19).
There are no published results from large prospectivestudies in Mediterranean countries assessing the role of dieton the development of HT. The high consumption of fruit,vegetables, and cereal in these countries, which also impliesa higher between-subject variability, makes them an excel-lent setting to address the role of dietary fiber and protein,particularly vegetable protein, in the prevention of HT.
The objective of our study was to assess the role of dif-ferent nutritional factors, especially protein and fiber fromdifferent sources, on the risk of incident HT in a cohortof Spanish university graduates.
Materials and Methods
Study Population
The Seguimiento Universidad de Navarra (SUN, Universityof Navarra) Follow-up Study is a Mediterranean cohort ofuniversity graduates. A detailed description of its methodshas been published elsewhere (20). Briefly, beginning inDecember 1999 an explanatory letter and a mailed ques-tionnaire were sent to all former students of the Universityof Navarra (Spain) and to members of some Spanish profes-sional associations. The follow-up of those who respondedto the initial questionnaire is being carried out through bi-ennial mailed questionnaires. From December 1999 to Jan-uary 2002, we recruited 9,907 participants. From these,8,646 (87%) answered the first follow-up questionnaire toJuly 2004.
For the present analysis we excluded those participantswho reported a diagnosis of cancer, cardiovascular disease,or diabetes at the beginning of the follow-up or wereprevalent cases of HT. Those with missing values for anyof the variables considered in the analysis or with implau-sible or extreme caloric intakes (!400 or O3500 kcal/day for women, and !600 or O4200 kcal/day for men)were also excluded, thus leaving 5,880 participants avail-able for analysis.
Dietary Assessment
The baseline questionnaire included a semiquantitativefood frequency questionnaire, previously validated ina Spanish population (21). This type of dietary question-naire is a good method for measuring the long-term normaldiet (22). The questionnaire asked the frequency of con-sumption of 136 items in the previous year. There were nine
possible answers (ranging from never/almost never to 61
times per day). For each food, a standard portion size wasspecified. Nutrient intakes were calculated by multiplyingthe frequency of consumption by the nutrient content ofthe specified portion, using data from Spanish food compo-sition tables (23,24).
Other Covariate Assessments
The baseline assessment also included questions to gatherinformation about certain anthropometric measures(weight, height), lifestyle factors (smoking, physical activ-ity), and clinical variables (family history of HT and cardio-vascular disease, previous history of cancer, diabetes,hypercholesterolemia, use of medication). The validity ofself-reported weight to compute body mass index (BMI)was assessed in a subsample of the cohort (25). The meanrelative error in self-reported weight was 1.45% (95% CI:0.86–2.03%). The correlation coefficient between measuredand self-reported weight was 0.991 (95% CI: 0.986–0.994)and the weighted kappa statistic for BMI categories (!25,$25 and !30, and $30) was 0.98 (95% CI 0.84, 0.99).
The physical activity questionnaire inquired about theparticipation in 17 different activities. We assigned a multi-ple of resting metabolic rate [metabolic equivalent (MET)score] to each of these activities using previously publishedguidelines to quantify the average intensity of physical ac-tivity (26,27). The MET index of each activity was multi-plied by the weekly time spent in each activity obtaininga value of overall weekly MET-hours for each participant.This variable represented the individual’s volume and inten-sity of leisure-time physical activity. In a validation study,there was a highly significant correlation between physicalactivity objectively measured through an accelerometerand the overall weekly MET-hours assessed using our ques-tionnaire (r 5 0.51, p !0.001) (28).
Outcome Ascertainment
Prevalent cases of HT at baseline were defined as those in-dividuals reporting a medical diagnosis of HT in the initialquestionnaire, taking anti-hypertensive medication (di-uretics, beta-blockers, calcium antagonists, ACE inhibitors,other antihypertensive medication), or that reported a sys-tolic BP $140 mmHg and/or diastolic BP $90 mmHg.
The follow-up questionnaire included the followingquestion ‘Since you completed the first questionnaire, haveyou received for the first time a medical diagnosis of hyper-tension?’ and the approximate date (month and year) of thediagnosis. There was also a question asking whether the in-dividual has had her/his BP measured in the period betweenthe completion of both questionnaires. We considered thata participant was an incident case of HT when she or he re-ported a diagnosis of HT in the follow-up questionnaire butwas not hypertensive at baseline.

780 Alonso et al. / Archives of Medical Research 37 (2006) 778–786
We carried out a validation study to determine the qual-ity of the self-reported diagnosis of HT (29). Briefly, twostudy physicians (AA, JJB) performed two BP measuresin a random sample of 127 participants in our cohortfrom the metropolitan area of Pamplona (Navarra, Spain).This study confirmed 82% (95% CI 73–93%) of the self-reported HT cases and 85% (95% CI 72–89%) of the self-reported normotensives. Other validation studies ofself-reported HT have produced similar results (30,31).Self-reported information about a medical diagnosis ofHT was used as a reliable outcome in previous epidemio-logic studies that included highly educated participants(12,13,32).
Statistical Analysis
Intake of each nutrient was adjusted for total energy intakeusing the residuals method. We applied separate models toadjust for energy among women and men (22). Energy-adjusted intake of a nutrient is computed using the residualsfrom a regression model in which the total energy intake isthe independent variable and the intake of the particularnutrient is the dependent variable. The residuals representthe difference between the observed intake of the particularnutrient and the expected intake according to the individualenergy intake of each participant. They are added to theexpected intake of the nutrient if total energy intake is setat the mean of the sample.
We categorized each energy-adjusted nutrient usingquintiles as cut-off points. In all statistical models, quintilesof nutrient intake were introduced as categorical variables,with the quintile corresponding to the lowest intake as thereference category. Linear trends were assessed assigningthe median value to each quintile and modeling these valuesas a continuous variable.
Person-time of follow-up was computed for each partici-pant in the cohort from the date of reception of the baselinequestionnaire to the date of HT diagnosis or date of receptionof the follow-up questionnaire, whichever occurred first. Weused Cox proportional hazard models to assess the associa-tion between nutrient intake and the incidence of HT, adjust-ing for multiple known and potential risk factors ofhypertension. For each nutrient, we ran an initial model in-cluding only age and sex as covariates. Next, we includedin the model the following variables: BMI (with both a linearand a quadratic term), physical activity (4 categories), smok-ing (never/past/current smoker), alcohol consumption (5 cat-egories), sodium intake (5 categories), total energy intake(continuous) and personal history of hypercholesterolemia(yes/no). Finally, to adjust for other dietary factors, we in-cluded in the model quintiles for the consumption of eachof the following foods and nutrients: fruit, vegetables, low-fat dairy, potassium, magnesium, fiber, caffeine, saturatedfatty acids, and monounsaturated fatty acids.
To assess the potential interaction (effect modification)between each nutrient and age, gender or BMI, we repeated
the analysis after stratifying by gender, age (!40, $40years) and BMI (!25, $25 kg/m2). Statistical interactionsbetween these variables and the nutrient of interest wereevaluated through the likelihood ratio test comparinga model with a multiplicative term between both variablesand a model without this term.
Finally, we ran a stepwise multiple linear regressionmodel with cereal fiber intake as dependent variable andall food items that supplied cereal fiber as independent vari-ables, to determine the main sources of this nutrient.
All p values are two-tailed. Statements about statisticalsignificance refer to the 0.05 cutoff.
Results
We included initially 9,907 participants in the baseline as-sessment of diet and other risk factors. From these, 1,045were prevalent cases of HT, 813 reported a history of car-diovascular disease, cancer or diabetes, 1,018 were belowor above the limits of caloric intake, and 784 had missingvalues for one or more potential confounding variable, withsome participants included in more than one of these cate-gories. Finally, 6,686 individuals were considered in the ini-tial cohort; 5,880 (88%) answered the 2-year follow-upquestionnaire. Table 1 shows the distribution of selectedvariables in the study population and among those (n 5
806) who were not prevalent cases of HT but did not re-spond to the follow-up questionnaire (lost to follow-up).
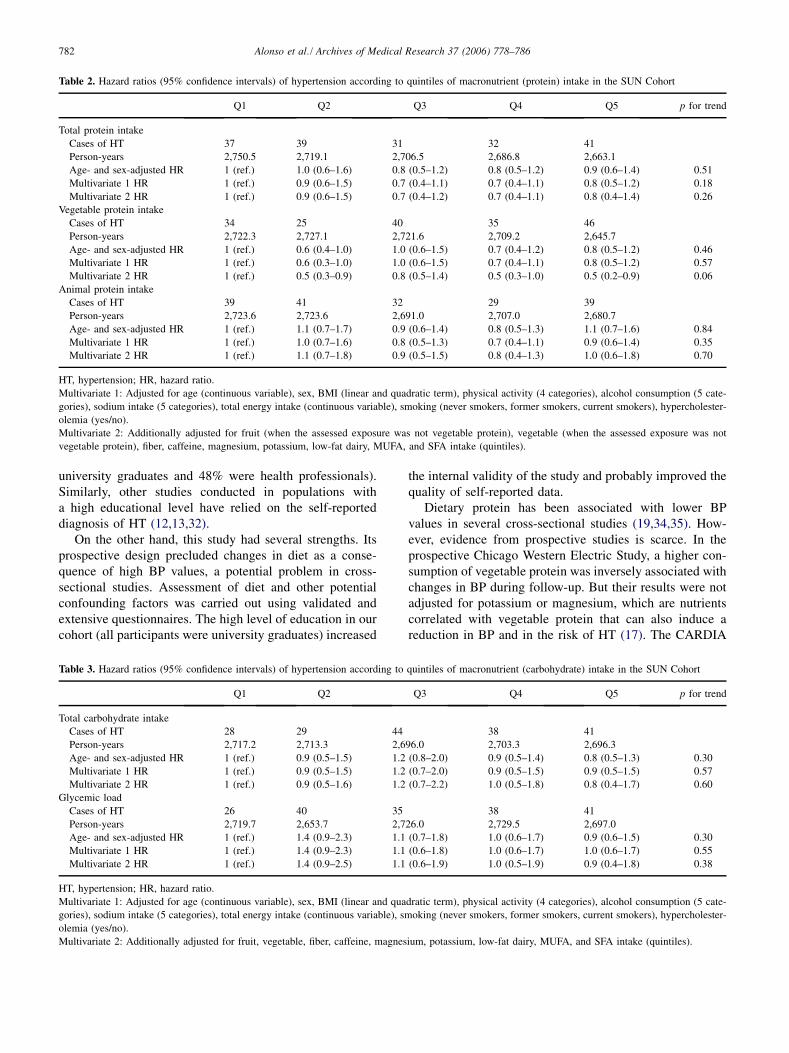
Total carbohydrates, glycemic load, protein and fat in-take, and intake of different types of fat were not associatedwith the risk of HT when we took into consideration multi-ple potential confounding variables (Tables 2–5). Proteinfrom vegetable sources but not total or animal proteinwas inversely associated with the risk of HT. The hazardratio (HR) of HT among those with the highest intake ofvegetable protein compared with those in the lowest intakecategory was 0.5 (95% confidence interval (CI): 0.2–0.9, pfor linear trend: 0.06) (Tables 2–5). When we additionallyadjusted for folate intake, the estimates for vegetable pro-tein did not substantially change (HR of HT in the fifthquintile compared with the first quintile 0.4, 95% CI 0.2–0.9, p for trend 0.05).
Total fiber intake and fiber from fruits or vegetables werenot associated with the risk of HT. However, fiber from ce-reals was associated with a statistically significant reduc-tion in the risk of HT (HR highest vs. lowest quintile ofcereal fiber intake 0.6, 95% CI 0.3–1.0), with a significantlinear trend ( p 5 0.05), suggesting a possible dose-re-sponse relationship (Tables 6 and 7). In this population,the main sources of fiber from cereals were whole grainbread (66% of total variability in cereal fiber intake), andwhite bread (27%).
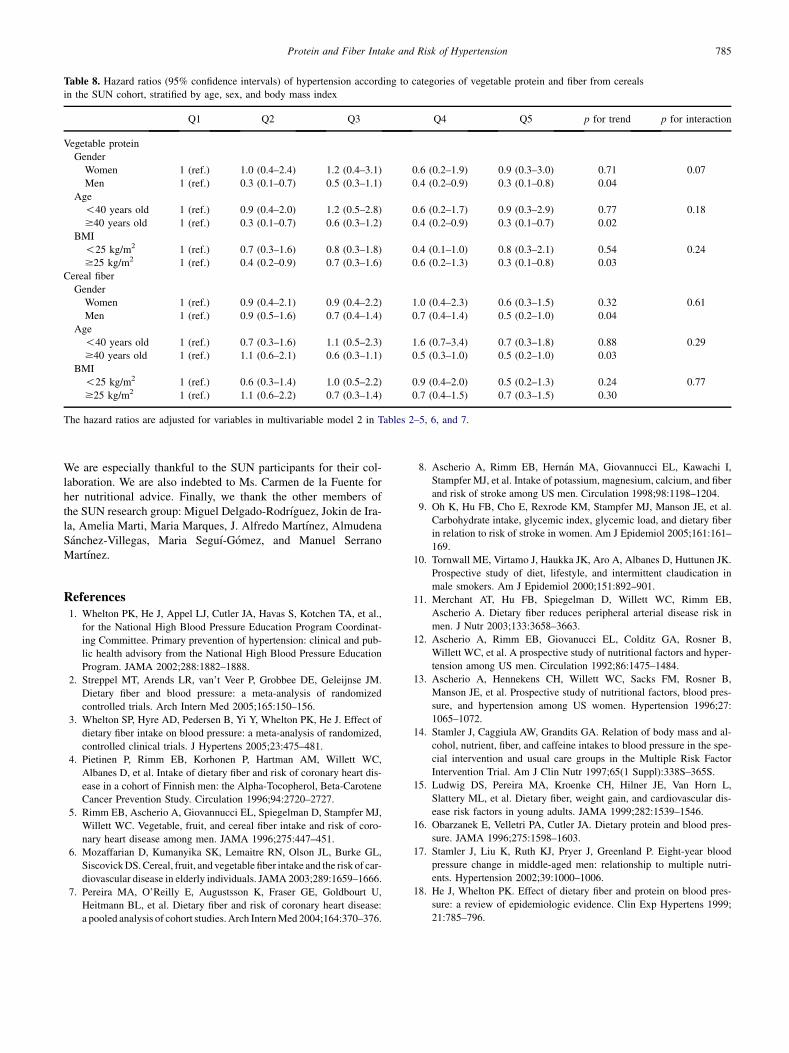
In Table 8 we show the association between fiber fromcereals or vegetable protein and HT stratified according

781Protein and Fiber Intake and Risk of Hypertension
Table 1. Baseline characteristics of the SUN participants
Followed up Lost to follow-up p value*
Women
(n 5 3604)
Men
(n 5 2276)
Women
(n 5 510)
Men
(n 5 296) Women Men
Age (years) 33.8 (9.8) 38.9 (11.5) 31.1 (9.7) 36.0 (11.4) !0.001 !0.001
BMI (kg/m2) 21.8 (2.8) 25.1 (2.9) 21.7 (3.1) 25.4 (3.2) 0.25 0.10
Physical activity (MET-h/week) 14.0 (17.0) 21.2 (25.3) 15.7 (21.1) 21.8 (28.0) 0.08 0.73
Hypercholesterolemia (%) 9.9 17.5 6.5 15.2 0.01 0.32
Smoking status (%) 0.03 0.03
Never 49.3 44.4 45.3 45.3
Former 27.8 27.1 33.5 32.8
Current 22.9 28.5 21.2 22.0
Total energy intake (kcal/day) 2,321 (573) 2,527 (704) 2,273 (632) 2.529 (718) 0.10 0.97
Protein (% energy intake) 18.2 (3.4) 17.6 (3.3) 18.4 (3.9) 17.6 (3.2) 0.14 0.79
Carbohydrates (% energy intake) 43.0 (7.3) 42.9 (7.5) 43.4 (7.4) 41.7 (7.2) 0.21 0.008
Total fat (% energy intake) 37.7 (6.6) 36.7 (6.3) 36.9 (6.8) 37.7 (6.4) 0.02 0.007
Saturated fatty acids (% energy intake) 12.8 (3.1) 12.9 (3.3) 12.6 (3.3) 13.3 (3.2) 0.22 0.05
Monounsaturated fatty acids (% energy intake) 16.3 (3.9) 15.6 (3.4) 15.6 (3.8) 15.9 (3.5) !0.001 0.08
Intake of
Alcohol (g/day) 3.8 (5.8) 9.9 (12.4) 3.8 (5.3) 10.3 (13.3) 0.84 0.57
Sodium (g/day) 3.2 (2.5) 3.9 (2.6) 3.1 (1.9) 3.9 (2.2) 0.51 0.93
Potassium (g/day) 4.7 (1.5) 4.6 (1.6) 4.8 (1.7) 4.5 (1.5) 0.41 0.40
Magnesium (mg/day) 408.2 (118.8) 412.6 (128.6) 409.6 (135.1) 405.5 (129.2) 0.82 0.37
Fiber (g/day) 27.3 (11.7) 25.9 (12.1) 27.4 (13.0) 24.4 (11.2) 0.92 0.06
Caffeine (mg/day) 44.8 (39.3) 46.5 (43.2) 47.1 (41.0) 44.5 (38.3) 0.21 0.41
Fruit (g/day) 343.1 (287.1) 290.9 (277.3)) 359.0 (306.6) 258.2 (228.0) 0.27 0.05
Vegetable (g/day) 543.1 (316.5) 457.3 (306.5) 551.4 (353.9) 426.3 (279.3) 0.61 0.10
Low-fat dairy (g/day) 238.3 (254.4) 152.2 (222.3) 263.0 (265.0) 158.3 (238.8) 0.04 0.66
Values are expressed as mean (standard deviation) unless otherwise stated. BMI, body mass index.
*Comparison between followed-up and lost to follow up participants. c2 test for categorical variables and Student’s t-test for continuous variables.
to gender, age, and BMI. For both vegetable protein and ce-real fiber, the inverse association with HT was strongeramong older than younger people, among men than women,and only for vegetable protein, among obese/overweightthan among lean participants. But none of the interactionterms was statistically significant.
Finally, when we repeated the analysis including onlythose individuals who had their BP measured in the periodbetween both questionnaires, the results were essentiallythe same (data not shown).
Discussion
In this prospective Mediterranean cohort conducted inSpain, vegetable protein and fiber from cereal were in-versely associated with the risk of HT, but only after takinginto consideration multiple confounding factors. Fiber fromother sources different from cereals and animal protein didnot show any association with the incidence of HT. The in-verse associations found for vegetable protein and cereal fi-ber were stronger among men, among older people, andamong obese/overweight participants, i.e., those witha higher baseline risk. However, we were not able to showany statistically significant interaction (i.e., effect modifica-tion) for these differences.
Our study had potential limitations. First, the diet wasevaluated using a food-frequency questionnaire. Althoughthis questionnaire has been previously validated (21) andsuccessfully used in other epidemiological studies (33),a certain degree of misclassification always occurs. How-ever, usually this misclassification is non-differential result-ing in risk estimates biased towards the null value. Then,the observed relationship between vegetable protein and fi-ber from cereals could not be explained through this sourceof error. But the lack of association between HT and othermacronutrients or different sources of fiber can be a conse-quence of this nondifferential misclassification bias. An-other limitation was the possible lack of statistical power.Again, this problem could not explain the observed associ-ations but can account for the negative results for some ofthe other assessed nutrients.
Finally, our outcome was based on self-reported infor-mation. In the baseline questionnaire, we gathered informa-tion on usual BP values and a previous medical diagnosis ofHT. Similarly, in the follow-up questionnaire we asked fora new medical diagnosis of HT. This ascertainment methodcould introduce misclassification error but, as we have ex-plained in the Materials and Methods section and publishedelsewhere (29), both diagnosis of HT and values of BPbased on the mailed questionnaires had adequate validityin this highly educated population (all participants were
782 Alonso et al. / Archives of Medical Research 37 (2006) 778–786
Table 2. Hazard ratios (95% confidence intervals) of hypertension according to quintiles of macronutrient (protein) intake in the SUN Cohort
Q1 Q2 Q3 Q4 Q5 p for trend
Total protein intake
Cases of HT 37 39 31 32 41
Person-years 2,750.5 2,719.1 2,706.5 2,686.8 2,663.1
Age- and sex-adjusted HR 1 (ref.) 1.0 (0.6–1.6) 0.8 (0.5–1.2) 0.8 (0.5–1.2) 0.9 (0.6–1.4) 0.51
Multivariate 1 HR 1 (ref.) 0.9 (0.6–1.5) 0.7 (0.4–1.1) 0.7 (0.4–1.1) 0.8 (0.5–1.2) 0.18
Multivariate 2 HR 1 (ref.) 0.9 (0.6–1.5) 0.7 (0.4–1.2) 0.7 (0.4–1.1) 0.8 (0.4–1.4) 0.26
Vegetable protein intake
Cases of HT 34 25 40 35 46
Person-years 2,722.3 2,727.1 2,721.6 2,709.2 2,645.7
Age- and sex-adjusted HR 1 (ref.) 0.6 (0.4–1.0) 1.0 (0.6–1.5) 0.7 (0.4–1.2) 0.8 (0.5–1.2) 0.46
Multivariate 1 HR 1 (ref.) 0.6 (0.3–1.0) 1.0 (0.6–1.5) 0.7 (0.4–1.1) 0.8 (0.5–1.2) 0.57
Multivariate 2 HR 1 (ref.) 0.5 (0.3–0.9) 0.8 (0.5–1.4) 0.5 (0.3–1.0) 0.5 (0.2–0.9) 0.06
Animal protein intake
Cases of HT 39 41 32 29 39
Person-years 2,723.6 2,723.6 2,691.0 2,707.0 2,680.7
Age- and sex-adjusted HR 1 (ref.) 1.1 (0.7–1.7) 0.9 (0.6–1.4) 0.8 (0.5–1.3) 1.1 (0.7–1.6) 0.84
Multivariate 1 HR 1 (ref.) 1.0 (0.7–1.6) 0.8 (0.5–1.3) 0.7 (0.4–1.1) 0.9 (0.6–1.4) 0.35
Multivariate 2 HR 1 (ref.) 1.1 (0.7–1.8) 0.9 (0.5–1.5) 0.8 (0.4–1.3) 1.0 (0.6–1.8) 0.70
HT, hypertension; HR, hazard ratio.
Multivariate 1: Adjusted for age (continuous variable), sex, BMI (linear and quadratic term), physical activity (4 categories), alcohol consumption (5 cate-
gories), sodium intake (5 categories), total energy intake (continuous variable), smoking (never smokers, former smokers, current smokers), hypercholester-
olemia (yes/no).
Multivariate 2: Additionally adjusted for fruit (when the assessed exposure was not vegetable protein), vegetable (when the assessed exposure was not
vegetable protein), fiber, caffeine, magnesium, potassium, low-fat dairy, MUFA, and SFA intake (quintiles).
university graduates and 48% were health professionals).Similarly, other studies conducted in populations witha high educational level have relied on the self-reporteddiagnosis of HT (12,13,32).
On the other hand, this study had several strengths. Itsprospective design precluded changes in diet as a conse-quence of high BP values, a potential problem in cross-sectional studies. Assessment of diet and other potentialconfounding factors was carried out using validated andextensive questionnaires. The high level of education in ourcohort (all participants were university graduates) increased
the internal validity of the study and probably improved thequality of self-reported data.
Dietary protein has been associated with lower BPvalues in several cross-sectional studies (19,34,35). How-ever, evidence from prospective studies is scarce. In theprospective Chicago Western Electric Study, a higher con-sumption of vegetable protein was inversely associated withchanges in BP during follow-up. But their results were notadjusted for potassium or magnesium, which are nutrientscorrelated with vegetable protein that can also induce areduction in BP and in the risk of HT (17). The CARDIA
Table 3. Hazard ratios (95% confidence intervals) of hypertension according to quintiles of macronutrient (carbohydrate) intake in the SUN Cohort
Q1 Q2 Q3 Q4 Q5 p for trend
Total carbohydrate intake
Cases of HT 28 29 44 38 41
Person-years 2,717.2 2,713.3 2,696.0 2,703.3 2,696.3
Age- and sex-adjusted HR 1 (ref.) 0.9 (0.5–1.5) 1.2 (0.8–2.0) 0.9 (0.5–1.4) 0.8 (0.5–1.3) 0.30
Multivariate 1 HR 1 (ref.) 0.9 (0.5–1.5) 1.2 (0.7–2.0) 0.9 (0.5–1.5) 0.9 (0.5–1.5) 0.57
Multivariate 2 HR 1 (ref.) 0.9 (0.5–1.6) 1.2 (0.7–2.2) 1.0 (0.5–1.8) 0.8 (0.4–1.7) 0.60
Glycemic load
Cases of HT 26 40 35 38 41
Person-years 2,719.7 2,653.7 2,726.0 2,729.5 2,697.0
Age- and sex-adjusted HR 1 (ref.) 1.4 (0.9–2.3) 1.1 (0.7–1.8) 1.0 (0.6–1.7) 0.9 (0.6–1.5) 0.30
Multivariate 1 HR 1 (ref.) 1.4 (0.9–2.3) 1.1 (0.6–1.8) 1.0 (0.6–1.7) 1.0 (0.6–1.7) 0.55
Multivariate 2 HR 1 (ref.) 1.4 (0.9–2.5) 1.1 (0.6–1.9) 1.0 (0.5–1.9) 0.9 (0.4–1.8) 0.38
HT, hypertension; HR, hazard ratio.
Multivariate 1: Adjusted for age (continuous variable), sex, BMI (linear and quadratic term), physical activity (4 categories), alcohol consumption (5 cate-
gories), sodium intake (5 categories), total energy intake (continuous variable), smoking (never smokers, former smokers, current smokers), hypercholester-
olemia (yes/no).
Multivariate 2: Additionally adjusted for fruit, vegetable, fiber, caffeine, magnesium, potassium, low-fat dairy, MUFA, and SFA intake (quintiles).

783Protein and Fiber Intake and Risk of Hypertension
Table 4. Hazard ratios (95% confidence intervals) of hypertension according to quintiles of macronutrient (fat) intake in the SUN cohort
Q1 Q2 Q3 Q4 Q5 p for trend
Total fat intake
Cases of HT 41 26 38 38 37
Person-years 2,692.0 2,692.4 2,690.3 2,728.2 2,723.1
Age- and sex-adjusted HR 1 (ref.) 0.7 (0.4–1.1) 1.0 (0.6–1.5) 1.0 (0.6–1.5) 1.0 (0.6–1.6) 0.68
Multivariate 1 HR 1 (ref.) 0.7 (0.4–1.2) 0.9 (0.6–1.5) 0.9 (0.6–1.5) 1.0 (0.6–1.6) 0.73
Multivariate 2 HR 1 (ref.) 0.7 (0.4–1.1) 0.9 (0.5–1.4) 0.8 (0.5–1.3) 0.9 (0.5–1.4) 0.75
Saturated fat intake
Cases of HT 39 33 30 40 38
Person-years 2,675.7 2,690.8 2,724.3 2,717.2 2,717.9
Age- and sex-adjusted HR 1 (ref.) 0.9 (0.6–1.5) 0.8 (0.5–1.4) 1.1 (0.7–1.7) 1.1 (0.7–1.8) 0.48
Multivariate 1 HR 1 (ref.) 0.9 (0.5–1.4) 0.8 (0.5–1.3) 1.1 (0.7–1.8) 1.2 (0.7–1.8) 0.36
Multivariate 2 HR 1 (ref.) 0.8 (0.5–1.3) 0.8 (0.5–1.3) 1.0 (0.6–1.7) 1.0 (0.6–1.7) 0.68
Monounsaturated fat intake
Cases of HT 37 31 37 38 37
Person-years 2,703.9 2,705.9 2,676.6 2,730.1 2,709.4
Age- and sex-adjusted HR 1 (ref.) 0.8 (0.5–1.4) 1.0 (0.6–1.6) 1.0 (0.7–1.6) 1.0 (0.6–1.6) 0.79
Multivariate 1 HR 1 (ref.) 0.8 (0.5–1.4) 1.0 (0.6–1.5) 1.0 (0.6–1.6) 1.0 (0.6–1.6) 0.92
Multivariate 2 HR 1 (ref.) 0.8 (0.5–1.4) 0.9 (0.5–1.4) 0.9 (0.6–1.5) 0.8 (0.5–1.4) 0.64
HT, hypertension; HR, hazard ratio.
Multivariate 1: Adjusted for age (continuous variable), sex, BMI (linear and quadratic term), physical activity (4 categories), alcohol consumption (5 cate-
gories), sodium intake (5 categories), total energy intake (continuous variable), smoking (never smokers, former smokers, current smokers), hypercholester-
olemia (yes/no).
Multivariate 2: Additionally adjusted for fruit, vegetable, fiber, caffeine, magnesium, potassium, and low-fat dairy intake (quintiles).
cohort of relatively young Americans did not find any asso-ciation between dietary protein and HT. However, the pos-sible different roles of animal and vegetable protein werenot assessed (15). Finally, the Dietary Intervention Studyin Children that followed-up 662 children aged 8–11 yearswith elevated low-density lipoprotein cholesterol for 3years found an inverse association between protein intakeand increase in BP, but the relationship disappeared afteradjusting for other dietary factors (36). The role of dietaryprotein has also been studied in some clinical trials, butmost of them had small sample size with a limited durationor were conducted exclusively among hypertensive patients(37). All these factors could restrict the applicability oftheir results to the general population.
Two recent meta-analyses have suggested a beneficialeffect of fiber supplementation on BP, particularly among
hypertensive individuals (2,3). However, the length of theintervention in the analyzed trials was !24 weeks in allcases. Hence, it is not possible to derive from these studiesthe longer-term effect of fiber intake. Nonetheless, there areseveral observational studies that have linked a high con-sumption of fiber, especially from cereals, with a lower riskof cardiovascular disease (4–11). Moreover, fiber has beenassociated with a lower risk of HT or lower levels of BP insome prospective studies (12,13,15). So far, there has beenno available prospective information about the role of fiberon the risk of HT obtained in populations outside the U.S.
Little is known about the mechanisms through which fi-ber could reduce the risk of HT. Dietary fiber has beenshown to reduce insulin resistance (38) and this, in turn,could curtail increases in BP. In fact, cereal fiber was asso-ciated with a lower prevalence of the metabolic syndrome
Table 5. Hazard ratios (95% confidence intervals) of hypertension according to quintiles of macronutrient (polyunsaturated fat) intake in the SUN cohort
Polyunsaturated fat intake Q1 Q2 Q3 Q4 Q5 p for trend
Cases of HT 30 32 38 49 31
Person-years 2,698.5 2,701.3 2,692.2 2,729.1 2,704.8
Age and sex adjusted HR 1 (ref.) 1.1 (0.7–1.8) 1.1 (0.7–1.8) 1.3 (0.8–2.0) 0.9 (0.5–1.5) 0.85
Multivariate 1 HR 1 (ref.) 1.0 (0.6–1.7) 1.0 (0.6–1.7) 1.3 (0.8–2.0) 0.9 (0.6–1.5) 0.93
Multivariate 2 HR 1 (ref.) 1.0 (0.6–1.7) 1.0 (0.6–1.7) 1.2 (0.7–2.0) 0.9 (0.5–1.5) 0.69
HT, hypertension; HR, hazard ratio.
Multivariate 1: Adjusted for age (continuous variable), sex, BMI (linear and quadratic term), physical activity (4 categories), alcohol consumption (5 cate-
gories), sodium intake (5 categories), total energy intake (continuous variable), smoking (never smokers, former smokers, current smokers), hypercholester-
olemia (yes/no).
Multivariate 2: Adjusted additionally for fruit, vegetable, fiber, caffeine, magnesium, potassium, and low-fat dairy intake (quintiles).

784 Alonso et al. / Archives of Medical Research 37 (2006) 778–786
Table 6. Hazard ratios (95% confidence intervals) of hypertension according to quintiles of total fiber and fiber from different sources in the SUN cohort
Q1 Q2 Q3 Q4 Q5 p for trend
Total fiber intake
Cases of HT 30 33 32 42 43
Person-years 2,764.3 2,737.1 2,704.3 2,684.3 2,636.0
Age- and sex-adjusted HR 1 (ref.) 1.0 (0.6–1.7) 0.9 (0.5–1.4) 1.1 (0.7–1.8) 1.0 (0.6–1.6) 0.88
Multivariate 1 HR 1 (ref.) 1.0 (0.6–1.6) 0.8 (0.5–1.4) 1.1 (0.7–1.8) 1.0 (0.6–1.7) 0.73
Multivariate 2 HR 1 (ref.) 1.2 (0.7–2.2) 1.0 (0.5–2.0) 1.2 (0.6–2.5) 1.2 (0.5–3.0) 0.88
Fiber from fruit sources
Cases of HT 26 45 32 41 36
Person-years 2,717.2 2,761.2 2,706.3 2,667.5 2,673.8
Age- and sex-adjusted HR 1 (ref.) 1.5 (0.9–2.4) 1.0 (0.6–1.7) 1.2 (0.7–2.0) 1.0 (0.6–1.7) 0.44
Multivariate 1 HR 1 (ref.) 1.4 (0.9–2.4) 1.0 (0.6–1.7) 1.2 (0.7–2.0) 1.0 (0.6–1.7) 0.48
Multivariate 2 HR 1 (ref.) 1.2 (0.5–2.9) 0.8 (0.3–2.5) 1.5 (0.4–5.3) 1.8 (0.4–7.7) 0.36
Fiber from cereal sources
Cases of HT 36 32 38 42 32
Person-years 2,689.2 2,725.0 2,697.8 2,699.2 2,714.8
Age- and sex-adjusted HR 1 (ref.) 0.9 (0.5–1.4) 0.9 (0.6–1.4) 0.9 (0.6–1.4) 0.7 (0.4–1.1) 0.19
Multivariate 1 HR 1 (ref.) 0.9 (0.5–1.4) 0.9 (0.5–1.4) 0.9 (0.6–1.4) 0.7 (0.4–1.1) 0.18
Multivariate 2 HR 1 (ref.) 0.9 (0.5–1.4) 0.8 (0.5–1.3) 0.8 (0.5–1.4) 0.6 (0.3–1.0) 0.05
HT, hypertension; HR, hazard ratio.
Multivariate 1: Adjusted for age (continuous variable), sex, BMI (linear and quadratic term), physical activity (4 categories), alcohol consumption (5 cate-
gories), sodium intake (5 categories), total energy intake (continuous variable), smoking (never smokers, former smokers, current smokers), hypercholester-
olemia (yes/no).
Multivariate 2: Additionally adjusted for fruit, vegetable, caffeine, magnesium, potassium, low-fat dairy, MUFA, and SFA intake (quintiles).
in the Framingham Offspring Cohort Study (39). Similarly,how dietary protein affects BP values is largely unknown. Ithas been hypothesized that protein intake could result inhigher concentrations of some amino acids that could havea favorable effect on BP (40). Folate and vegetable proteinintake are highly correlated, and folate intake has been re-cently associated with a lower risk of HT in the Nurses’Health Study I and II (32). However, when we additionallyadjusted for folate intake, risk estimates did not change,suggesting that this micronutrient was not the elementmainly responsible for the observed association. Nonethe-less, it is not possible to rule out completely the possibilityof residual confounding by other nutrients associated withboth vegetable protein intake and the risk of HT.
In conclusion, we have observed in a prospectively fol-lowed-up Mediterranean population that vegetable proteinand fiber from cereals are inversely associated with the riskof developing HT. Interestingly, the risk reduction was onlyapparent when we took into consideration other dietaryfactors.
AcknowledgmentsThis study was supported by the Spanish Ministry of Health (GrantsPI040233, PI042241, PI050514, and G03/140), the NavarraRegional Government (PI41/2005), and the University of Navarra.Dr. Alvaro Alonso was supported by a Fulbright fellowshipand a grant from the MMA Foundation for Medical Research.
Table 7. Hazard ratios (95% confidence intervals) of hypertension according to quintiles of total fiber and fiber from vegetable sources intake
in the SUN cohort
Fiber from vegetable sources Q1 Q2 Q3 Q4 Q5 p for trend
Cases of HT 42 29 31 36 42
Person-years 2,726.7 2,733.2 2,731.9 2,669.4 2,664.8
Age and sex adjusted HR 1 (ref.) 0.7 (0.4–1.1) 0.7 (0.4–1.1) 0.8 (0.5–1.3) 0.9 (0.6–1.5) 0.68
Multivariate 1 HR 1 (ref.) 0.7 (0.4–1.1) 0.7 (0.4–1.1) 0.9 (0.5–1.3) 0.9 (0.6–1.4) 0.78
Multivariate 2 HR 1 (ref.) 0.8 (0.4–1.5) 0.7 (0.3–1.6) 0.7 (0.2–1.8) 0.7 (0.2–2.1) 0.70
HT, hypertension; HR, hazard ratio.
Multivariate 1: Adjusted for age (continuous variable), sex, BMI (linear and quadratic term), physical activity (4 categories), alcohol consumption (5 cate-
gories), sodium intake (5 categories), total energy intake (continuous variable), smoking (never smokers, former smokers, current smokers), hypercholester-
olemia (yes/no).
Multivariate 2: Additionally adjusted for fruit, vegetable, caffeine, magnesium, potassium, low-fat dairy, MUFA, and SFA intake (quintiles).
785Protein and Fiber Intake and Risk of Hypertension
Table 8. Hazard ratios (95% confidence intervals) of hypertension according to categories of vegetable protein and fiber from cereals
in the SUN cohort, stratified by age, sex, and body mass index
Q1 Q2 Q3 Q4 Q5 p for trend p for interaction
Vegetable protein
Gender
Women 1 (ref.) 1.0 (0.4–2.4) 1.2 (0.4–3.1) 0.6 (0.2–1.9) 0.9 (0.3–3.0) 0.71 0.07
Men 1 (ref.) 0.3 (0.1–0.7) 0.5 (0.3–1.1) 0.4 (0.2–0.9) 0.3 (0.1–0.8) 0.04
Age
!40 years old 1 (ref.) 0.9 (0.4–2.0) 1.2 (0.5–2.8) 0.6 (0.2–1.7) 0.9 (0.3–2.9) 0.77 0.18
$40 years old 1 (ref.) 0.3 (0.1–0.7) 0.6 (0.3–1.2) 0.4 (0.2–0.9) 0.3 (0.1–0.7) 0.02
BMI
!25 kg/m2 1 (ref.) 0.7 (0.3–1.6) 0.8 (0.3–1.8) 0.4 (0.1–1.0) 0.8 (0.3–2.1) 0.54 0.24
$25 kg/m2 1 (ref.) 0.4 (0.2–0.9) 0.7 (0.3–1.6) 0.6 (0.2–1.3) 0.3 (0.1–0.8) 0.03
Cereal fiber
Gender
Women 1 (ref.) 0.9 (0.4–2.1) 0.9 (0.4–2.2) 1.0 (0.4–2.3) 0.6 (0.3–1.5) 0.32 0.61
Men 1 (ref.) 0.9 (0.5–1.6) 0.7 (0.4–1.4) 0.7 (0.4–1.4) 0.5 (0.2–1.0) 0.04
Age
!40 years old 1 (ref.) 0.7 (0.3–1.6) 1.1 (0.5–2.3) 1.6 (0.7–3.4) 0.7 (0.3–1.8) 0.88 0.29
$40 years old 1 (ref.) 1.1 (0.6–2.1) 0.6 (0.3–1.1) 0.5 (0.3–1.0) 0.5 (0.2–1.0) 0.03
BMI
!25 kg/m2 1 (ref.) 0.6 (0.3–1.4) 1.0 (0.5–2.2) 0.9 (0.4–2.0) 0.5 (0.2–1.3) 0.24 0.77
$25 kg/m2 1 (ref.) 1.1 (0.6–2.2) 0.7 (0.3–1.4) 0.7 (0.4–1.5) 0.7 (0.3–1.5) 0.30
The hazard ratios are adjusted for variables in multivariable model 2 in Tables 2–5, 6, and 7.
We are especially thankful to the SUN participants for their col-laboration. We are also indebted to Ms. Carmen de la Fuente forher nutritional advice. Finally, we thank the other members ofthe SUN research group: Miguel Delgado-Rodrıguez, Jokin de Ira-la, Amelia Marti, Maria Marques, J. Alfredo Martınez, AlmudenaSanchez-Villegas, Maria Seguı-Gomez, and Manuel SerranoMartınez.
References1. Whelton PK, He J, Appel LJ, Cutler JA, Havas S, Kotchen TA, et al.,
for the National High Blood Pressure Education Program Coordinat-
ing Committee. Primary prevention of hypertension: clinical and pub-
lic health advisory from the National High Blood Pressure Education
Program. JAMA 2002;288:1882–1888.
2. Streppel MT, Arends LR, van’t Veer P, Grobbee DE, Geleijnse JM.
Dietary fiber and blood pressure: a meta-analysis of randomized
controlled trials. Arch Intern Med 2005;165:150–156.
3. Whelton SP, Hyre AD, Pedersen B, Yi Y, Whelton PK, He J. Effect of
dietary fiber intake on blood pressure: a meta-analysis of randomized,
controlled clinical trials. J Hypertens 2005;23:475–481.
4. Pietinen P, Rimm EB, Korhonen P, Hartman AM, Willett WC,
Albanes D, et al. Intake of dietary fiber and risk of coronary heart dis-
ease in a cohort of Finnish men: the Alpha-Tocopherol, Beta-Carotene
Cancer Prevention Study. Circulation 1996;94:2720–2727.
5. Rimm EB, Ascherio A, Giovannucci EL, Spiegelman D, Stampfer MJ,
Willett WC. Vegetable, fruit, and cereal fiber intake and risk of coro-
nary heart disease among men. JAMA 1996;275:447–451.
6. Mozaffarian D, Kumanyika SK, Lemaitre RN, Olson JL, Burke GL,
Siscovick DS. Cereal, fruit, and vegetable fiber intake and the risk of car-
diovascular disease in elderly individuals. JAMA 2003;289:1659–1666.
7. Pereira MA, O’Reilly E, Augustsson K, Fraser GE, Goldbourt U,
Heitmann BL, et al. Dietary fiber and risk of coronary heart disease:
a pooled analysis of cohort studies. Arch Intern Med 2004;164:370–376.
8. Ascherio A, Rimm EB, Hernan MA, Giovannucci EL, Kawachi I,
Stampfer MJ, et al. Intake of potassium, magnesium, calcium, and fiber
and risk of stroke among US men. Circulation 1998;98:1198–1204.
9. Oh K, Hu FB, Cho E, Rexrode KM, Stampfer MJ, Manson JE, et al.
Carbohydrate intake, glycemic index, glycemic load, and dietary fiber
in relation to risk of stroke in women. Am J Epidemiol 2005;161:161–
169.
10. Tornwall ME, Virtamo J, Haukka JK, Aro A, Albanes D, Huttunen JK.
Prospective study of diet, lifestyle, and intermittent claudication in
male smokers. Am J Epidemiol 2000;151:892–901.
11. Merchant AT, Hu FB, Spiegelman D, Willett WC, Rimm EB,
Ascherio A. Dietary fiber reduces peripheral arterial disease risk in
men. J Nutr 2003;133:3658–3663.
12. Ascherio A, Rimm EB, Giovanucci EL, Colditz GA, Rosner B,
Willett WC, et al. A prospective study of nutritional factors and hyper-
tension among US men. Circulation 1992;86:1475–1484.
13. Ascherio A, Hennekens CH, Willett WC, Sacks FM, Rosner B,
Manson JE, et al. Prospective study of nutritional factors, blood pres-
sure, and hypertension among US women. Hypertension 1996;27:
1065–1072.
14. Stamler J, Caggiula AW, Grandits GA. Relation of body mass and al-
cohol, nutrient, fiber, and caffeine intakes to blood pressure in the spe-
cial intervention and usual care groups in the Multiple Risk Factor
Intervention Trial. Am J Clin Nutr 1997;65(1 Suppl):338S–365S.
15. Ludwig DS, Pereira MA, Kroenke CH, Hilner JE, Van Horn L,
Slattery ML, et al. Dietary fiber, weight gain, and cardiovascular dis-
ease risk factors in young adults. JAMA 1999;282:1539–1546.
16. Obarzanek E, Velletri PA, Cutler JA. Dietary protein and blood pres-
sure. JAMA 1996;275:1598–1603.
17. Stamler J, Liu K, Ruth KJ, Pryer J, Greenland P. Eight-year blood
pressure change in middle-aged men: relationship to multiple nutri-
ents. Hypertension 2002;39:1000–1006.
18. He J, Whelton PK. Effect of dietary fiber and protein on blood pres-
sure: a review of epidemiologic evidence. Clin Exp Hypertens 1999;
21:785–796.

786 Alonso et al. / Archives of Medical Research 37 (2006) 778–786
19. Liu L, Ikeda K, Sullivan DH, Ling W, Yamori Y. Epidemiological
evidence of the association between dietary protein intake and blood
pressure: a meta-analysis of published data. Hypertens Res 2002;25:
689–695.
20. Martınez-Gonzalez MA, Sanchez-Villegas A, de Irala-Estevez J,
Martı A, Martınez JA. Mediterranean diet and stroke: objectives and
design of the SUN Project. Nutr Neurosci 2002;5:65–73.
21. Martın-Moreno JM, Boyle P, Gorgojo L, Maisonneuve P, Fernan-
dez-Rodrıguez JC, Salvini S, et al. Development and validation of
a food frequency questionnaire in Spain. Int J Epidemiol 1993;22:
512–519.
22. Willett WC. Nutritional Epidemiology. 2nd ed. New York: Oxford
University Press;1998.
23. Mataix Verdu J. Tabla de composicion de alimentos espanoles. 4a ed.
Granada: Universidad de Granada;2003.
24. Moreiras O, Carbajal A, Cabrera L, Cuadrado C. Tablas de composi-
cion de alimentos. 7th ed. Madrid: Piramide;2003.
25. Bes-Rastrollo M, Perez Valdivieso JR, Sanchez-Villegas A, Alonso A,
Martınez-Gonzalez MA. Validacion del peso e ındice de masa corpo-
ral auto-declarados de los participantes de una cohorte de graduados
universitarios. Rev Esp Obes 2005;3:183–189.
26. Ainsworth BE, Haskell WL, Whitt MC, Irwin ML, Swartz AM,
Strath SJ, et al. Compendium of physical activities: an update of activ-
ity codes and MET intensities. Med Sci Sports Exerc 2000;32:S498–
S504.
27. Martınez-Gonzalez MA, Varo JJ, Santos JL, de Irala J, Gibney MJ,
Kearney J, et al. Prevalence of physical activity during leisure time
in the European Union. Med Sci Sports Exerc 2001;33:1142–1146.
28. Martınez-Gonzalez MA, Lopez-Fontana C, Varo JJ, Sanchez-
Villegas A, Martınez JA. Validation of the Spanish version of the
physical activity questionnaire used in the Nurses’ Health Study and
Health Professionals’ Follow-up Study. Public Health Nutr 2005;8:
920–927.
29. Alonso A, Beunza JJ, Delgado-Rodrıguez M, Martınez-Gonzalez MA.
Validation of self reported diagnosis of hypertension in a cohort of
university graduates in Spain. BMC Public Health 2005;5:94.
30. Colditz GA, Martin P, Stampfer MJ, Willett WC, Sampson L,
Rosner B, et al. Validation of questionnaire information on risk factors
and disease outcomes in a prospective cohort study of women. Am J
Epidemiol 1986;123:894–900.
31. Tormo MJ, Navarro C, Chirlaque MD, Barber X. Validation of self
diagnosis of high blood pressure in a sample of the Spanish EPIC co-
hort: overall agreement and predictive values. J Epidemiol Community
Health 2000;54:221–226.
32. Forman JP, Rimm EB, Stampfer MJ, Curhan GC. Folate intake and the
risk of incident hypertension among US women. JAMA 2005;293:
320–329.
33. Martınez-Gonzalez MA, Fernandez-Jarne E, Martınez-Losa E, Prado-
Santamarıa M, Brugarolas-Brufau C, Serrano-Martınez M. Role of
fibre and fruit in the Mediterranean diet to protect against myocardial
infarction: a case-control study in Spain. Eur J Clin Nutr 2002;56:715–
722.
34. Stamler J, Elliott P, Kesteloot H, Nichols R, Claeys G, Dyer AR, et al.
Inverse relation of dietary protein markers with blood pressure. Find-
ings for 10,020 men and women in the INTERSALT Study. Circula-
tion 1996;94:1629–1634.
35. Stamler J, Caggiula A, Grandits GA, Kjelsberg M, Cutler JA. Rela-
tionship to blood pressure of combinations of dietary macronutrients:
findings of the Multiple Risk Factor Intervention Trial (MRFIT). Cir-
culation 1996;94:2417–2423.
36. Simons-Morton DG, Hunsberger SA, Van Horn L, Barton BA,
Robson AM, McMahon RP, et al. Nutrient intake and blood pressure
in the Dietary Intervention Study in Children. Hypertension 1997;29:
930–936.
37. Burke V, Hodgson JM, Beilin LJ, Giangiulioi N, Rogers P, Puddey IB.
Dietary protein and soluble fiber reduce ambulatory blood pressure in
treated hypertensives. Hypertension 2001;38:821–826.
38. Ylonen K, Saloranta C, Kronberg-Kippila C, Groop L, Aro A,
Virtanen SM. Associations of dietary fiber with glucose metabolism
in nondiabetic relatives of subjects with type 2 diabetes: the Botnia
Dietary Study. Diabet Care 2003;26:1979–1985.
39. McKeown NM, Meigs JB, Liu S, Saltzman E, Wilson PWF,
Jacques PF. Carbohydrate nutrition, insulin resistance, and the preva-
lence of the metabolic syndrome in the Framingham Offspring Cohort.
Diabet Care 2004;27:538–546.
40. Gokce N. L-arginine and hypertension. J Nutr 2004;134:2807S–2811S.


![Cereal Food, Cereals and Cereal Products Processing IndustryNIIR]_Books-Cereal... · Profitable Agro Based Projects with Project Profiles (Cereal Food Technology) ... use. Cereals](https://img.pdfslide.us/doc/110x75/5ab66a817f8b9ab47e8dc8d4/cereal-food-cereals-and-cereal-products-processing-industry-niirbooks-cerealprofitable.jpg)