Embed Size (px)
Citation preview

Vegetable Cool Chain
Adrian Dahlenburg SARDI Horticulture
Project Number: VG97016

VG97016
This report is published by Horticulture Australia Ltd to pass on information concerning horticultural research and development undertaken for the vegetable industry.
The research contained in this report was funded by Horticulture Australia Ltd with the financial support of the vegetable industry.
All expressions of opinion are not to be regarded as expressing the opinion of Horticulture Australia Ltd or any authority of the Australian Government.
The Company and the Australian Government accept no responsibility for any of the opinions or the accuracy of the information contained in this report and readers should rely upon their own enquiries in making decisions concerning their own interests.
ISBN 0 7341 0465 0
Published and distributed by: Horticultural Australia Ltd Level 1 50 Carrington Street Sydney NSW 2000 Telephone: (02) 8295 2300 Fax: (02) 8295 2399 E-Mail: [email protected]
© Copyright 2002
Horticulture Australia
Project Number: VG97016
Project Title: Vegetable Cool Chain
Project Leader: Adrian Dahlenburg
Organisation: SARDI
Report by Matthew Palmer and Adrian Dahlenburg
1

Project Number: VG97016
Project Title: Vegetable Cool Chain
Project Leader: Adrian Dahlenburg
Organisation: SARDI
Funding: Horticulture Australia
Vegetable Levy
Date: 17 June 2002
Adrian Dahlenburg
SARDI Horticulture
GPO Box 397
Adelaide South Australia 5001
Phone: (08) 8303 9416 Fax: (08) 8303 9424
Acknowledgments and Collaborators
SARDI
Matthew Palmer
Maria Nechvoglod
Louise Chvyl
Agriculture Victoria
Robert Premier
Janine Jaeger
NTDPIF
Melinda Gosbee
Susan Marte
Disclaimer
Any recommendations contained in this publication do not necessarily represent current HAL policy. No person should act on the basis of the contents of this publication, whether as to
matters of fact or opinion or other content, without first obtaining specific, independent professional advice in respect of the matters set out in this publication.
2

Contents
CONTENTS 3
MEDIA SUMMARY 4
TECHNICAL SUMMARY 5
TECHNOLOGY TRANSFER STRATEGY 7
Industry Articles '
Project Publications "
Visits 11
Wholesale Market Meetings 13
RESEARCH AND DEVELOPMENT ACTIVITIES 14
Temperature Moni tor ing 14
Introduction 14
Temperature Monitoring Summary 14
Temperature Monitoring Data 14
Northern Territory Monitoring 17
Key Issues Identified Through Temperature Monitoring 19
Conducting future monitoring 20
Temperature Monitoring Outcomes 21
Warming and Cooling rates of palletised produce 22
Optimising storage temperature for selected Asian vegetables 23
NT Temperature Monitoring 29
Postharvest handling of 'Asian' vegetables in the Northern Territory 32
Inoculum of vegetables at time of harvest 38
Cool chain handling and microbial loads 42
Cool chain handling and microbial loads 43
Introduction 43
Methods 43
Results 44
Simulated Temperature Abuse 44
Results: Transport from Darwin to Melbourne 53
Temperature abuse during transport (Adelaide to Melbourne) 59

Media Summary
The Vegetable Cool chain project developed from an interest in understanding the current practices of
postharvest handling of Australian vegetables, and the impact that such practices have on produce quality
once it reaches the consumer. The project has investigated handling procedures by monitoring the
temperature of produce from when it is harvested in the field, through the marketing chain (including
packing, transport, markets and retail outlets). The results varied significantly between individuals, from
extremely good handling procedures - through to handling chains that require significant improvements.
Common problems noted included inadequate or under capacity cool rooms, inappropriate transport and
storage temperature (often linked to mixed produce) and extended periods of time out of cool storage at
wholesale and retail level.
Microbiological testing has been used to evaluate the impacts that breaks in the cool chain can have on
various produce types. Testing was carried out in laboratory situations and also during transport of
vegetables from Darwin to Melbourne and Adelaide to Melbourne. Vegetables exposed to various
temperatures and conditions to evaluate how the microbiological loads vary. Microbiological sampling
was used as a measure of produce quality (total aerobic counts, yeasts and moulds, fluorescent
pseudomonads) and the potential of human pathogens (Coliforms and fluorescent pseudomonads).
Controlled studies highlighted the importance of low temperatures to retard microbiological growth. The
results of monitoring samples during refrigerated transport were more variable, but also reinforced the
importance of temperature management, particularly precooling.
To communicate the importance of good cool chain management and the techniques and information to
implement them, a range of activities have been conducted. A series of publications (including a book,
information kits, fact sheets, posters, pocket guides and a web page) have been produced to assist all
those involved with handling vegetables. Regional meetings, presentations at conferences and site visits
- have also been used to convey the message of the project. Additionally, a series of articles prepared by
the project team have appeared in National and Regional newsletters and publications. Information
produced by the project can be found at http://www.sardi.sa.gov.au/coolchai/
4
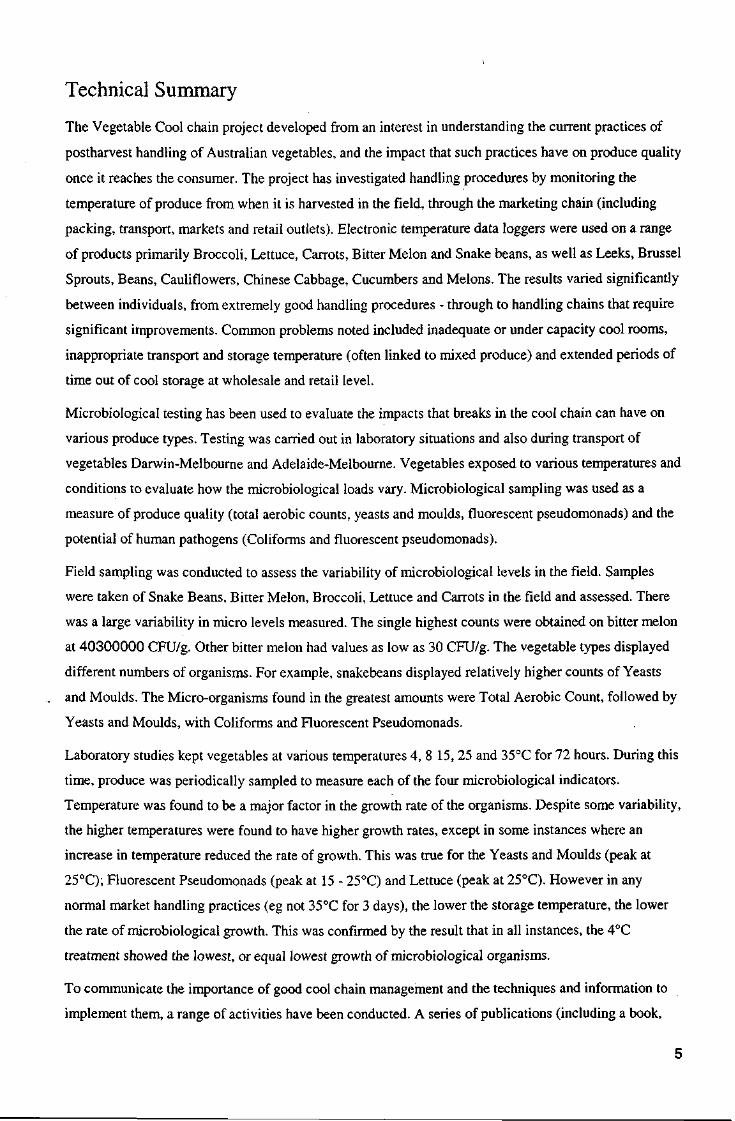
Technical Summary
The Vegetable Cool chain project developed from an interest in understanding the current practices of
postharvest handling of Australian vegetables, and the impact that such practices have on produce quality
once it reaches the consumer. The project has investigated handling procedures by monitoring the
temperature of produce from when it is harvested in the field, through the marketing chain (including
packing, transport, markets and retail outlets). Electronic temperature data loggers were used on a range
of products primarily Broccoli, Lettuce, Carrots, Bitter Melon and Snake beans, as well as Leeks, Brussel
Sprouts, Beans, Cauliflowers, Chinese Cabbage, Cucumbers and Melons. The results varied significantly
between individuals, from extremely good handling procedures - through to handling chains that require
significant improvements. Common problems noted included inadequate or under capacity cool rooms,
inappropriate transport and storage temperature (often linked to mixed produce) and extended periods of
time out of cool storage at wholesale and retail level.
Microbiological testing has been used to evaluate the impacts that breaks in the cool chain can have on
various produce types. Testing was carried out in laboratory situations and also during transport of
vegetables Darwin-Melbourne and Adelaide-Melbourne. Vegetables exposed to various temperatures and
conditions to evaluate how the microbiological loads vary. Microbiological sampling was used as a
measure of produce quality (total aerobic counts, yeasts and moulds, fluorescent pseudomonads) and the
potential of human pathogens (Coliforms and fluorescent pseudomonads).
Field sampling was conducted to assess the variability of microbiological levels in the field. Samples
were taken of Snake Beans, Bitter Melon, Broccoli, Lettuce and Carrots in the field and assessed. There
was a large variability in micro levels measured. The single highest counts were obtained on bitter melon
at 40300000 CFU/g. Other bitter melon had values as low as 30 CFU/g. The vegetable types displayed
different numbers of organisms. For example, snakebeans displayed relatively higher counts of Yeasts
and Moulds. The Micro-organisms found in the greatest amounts were Total Aerobic Count, followed by
Yeasts and Moulds, with Coliforms and Fluorescent Pseudomonads.
Laboratory studies kept vegetables at various temperatures 4, 8 15, 25 and 35°C for 72 hours. During this
time, produce was periodically sampled to measure each of the four microbiological indicators.
Temperature was found to be a major factor in the growth rate of the organisms. Despite some variability,
the higher temperatures were found to have higher growth rates, except in some instances where an
increase in temperature reduced the rate of growth. This was true for the Yeasts and Moulds (peak at
25°C); Fluorescent Pseudomonads (peak at 15 - 25°C) and Lettuce (peak at 25°C). However in any
normal market handling practices (eg not 35°C for 3 days), the lower the storage temperature, the lower
the rate of microbiological growth. This was confirmed by the result that in all instances, the 4°C
treatment showed the lowest, or equal lowest growth of microbiological organisms.
To communicate the importance of good cool chain management and the techniques and information to
implement them, a range of activities have been conducted. A series of publications (including a book,
5

information kits, fact sheets, posters, pocket guides and a web page) have been produced to assist all
those involved with handling vegetables. Regional meetings, presentations at conferences and site visits
have also been used to convey the message of the project. Additionally, a series of articles prepared by
the project team have appeared in National and Regional newsletters and publications. Information
produced by the project can be found at http://www.sardi.sa.gov.au/coolchai/
Recommendations on future research, development and technology transfer activities for improved
vegetable cold chain handling would include:
• Continuing promotion of improved cold chain handling practices through out the market supply
chain.
• Encouragement and support for temperature monitoring activities that allow supply chain operators to
better understand the impact of their handling practices on product temperatures.
• Development and production of handling information and systems targeted at specific commodities
and market sectors including exports.
• Development of more cost effective and efficient small scale, on-farm cooling systems for small
volume producers.
• Analysis of the costs and returns associated with a range of different postharvest handling systems
and the use of this data in promoting to the industry improved supply chain handling systems.
• Projects specifically targeted at improving cold chain handling practices beyond the farm gate.
6
Technology Transfer Strategy
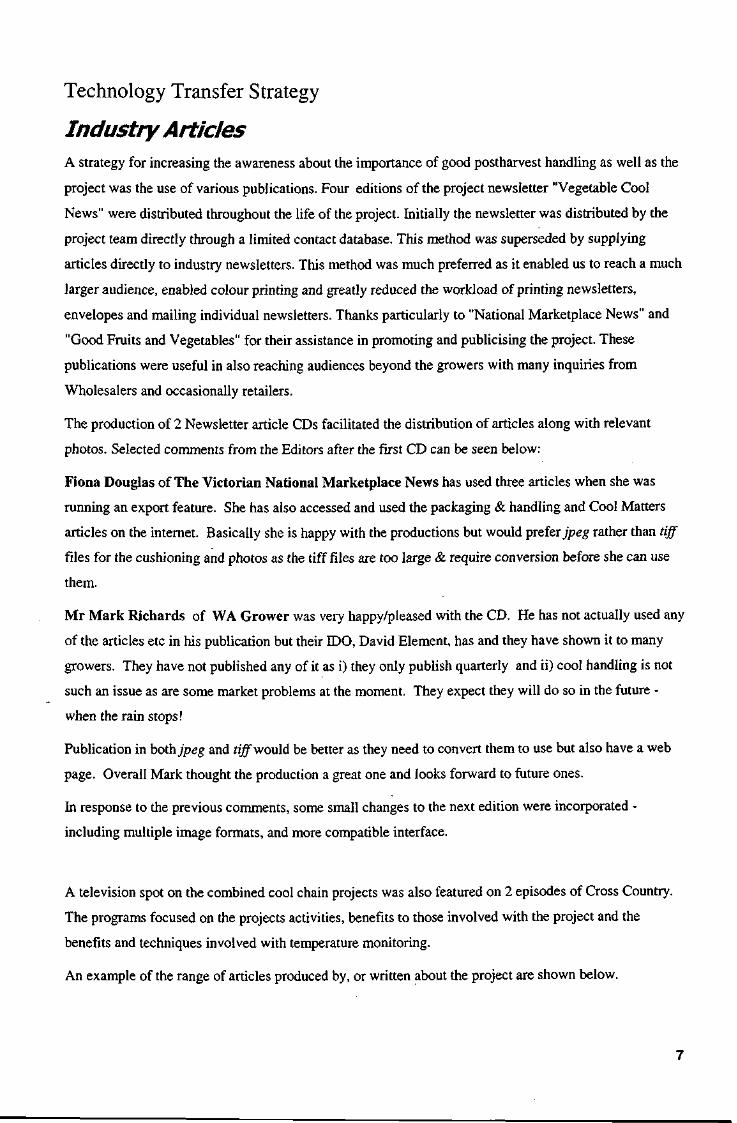
Industry Articles A strategy for increasing the awareness about the importance of good postharvest handling as well as the
project was the use of various publications. Four editions of the project newsletter "Vegetable Cool
News" were distributed throughout the life of the project. Initially the newsletter was distributed by the
project team directly through a limited contact database. This method was superseded by supplying
articles directly to industry newsletters. This method was much preferred as it enabled us to reach a much
larger audience, enabled colour printing and greatly reduced the workload of printing newsletters,
envelopes and mailing individual newsletters. Thanks particularly to "National Marketplace News" and
"Good Fruits and Vegetables" for their assistance in promoting and publicising the project. These
publications were useful in also reaching audiences beyond the growers with many inquiries from
Wholesalers and occasionally retailers.
The production of 2 Newsletter article CDs facilitated the distribution of articles along with relevant
photos. Selected comments from the Editors after the first CD can be seen below:
Fiona Douglas of The Victorian National Marketplace News has used three articles when she was
running an export feature. She has also accessed and used the packaging & handling and Cool Matters
articles on the internet. Basically she is happy with the productions but would prefer jpeg rather than tiff
files for the cushioning and photos as the tiff files are too large & require conversion before she can use
them.
Mr Mark Richards of WA Grower was very happy/pleased with the CD. He has not actually used any
of the articles etc in his publication but their IDO, David Element, has and they have shown it to many
growers. They have not published any of it as i) they only publish quarterly and ii) cool handling is not
such an issue as are some market problems at the moment. They expect they will do so in the future -
when the rain stops!
Publication in both jpeg and tiff would be better as they need to convert them to use but also have a web
page. Overall Mark thought the production a great one and looks forward to future ones.
In response to the previous comments, some small changes to the next edition were incorporated -
including multiple image formats, and more compatible interface.
A television spot on the combined cool chain projects was also featured on 2 episodes of Cross Country.
The programs focused on the projects activities, benefits to those involved with the project and the
benefits and techniques involved with temperature monitoring.
An example of the range of articles produced by, or written about the project are shown below.
7

Transporting Fresh Produce in Refrigerated Trucks
National Marketplace News Feb 2000
Poor Temperature control dogs industry
National Marketplace News, Feb 1999
Research warms to challenge
National Marketplace News May 1998
Cool Handling Web Site
Supermarket to Asia V4 No 4 2000/01
Cool Chain Project
Hort Report 1998 Cool Chain Article
The importance and benefits of cool chain handling
Australian Chamber Handbook 1999
Techniques for maintaining the cool chain
National Marketplace News, Feb 2000
Cool Chain good for sales
Stock Journal, March 2001
Transporting Fresh produce in refrigerated trucks
National Marketplace News, Feb 1999
Booklets assisting fruit and vegetable exports
Stock Journal, Dec 2000
Guides to assist Australian Exports
National Marketplace News, April 2002
Cool from shed to supermarket - new air freight container
National Marketplace News, April 2002

Project Publications Throughout the life of the project we have developed a range of publications covering a wide range of
postharvest handling topics. The simultaneous funding of fresh stone fruit / vegetable cool chain projects
has allowed a wider range of information to be produced, that is of benefit to both groups. The expertise
and experience we have gained has also allowed us to leverage further money from other organisations to
further the amount of publications we have been able to produce.
The range of publications have been distributed continuously through the life of the project, as they have
been produced. The main avenues for distribution have been through meetings and conferences, through
publicity generated by the Newsletter and articles, and through the Cool Handling web site.
The total list of publications produced by the project team is:
Information Kits
Forced Air Cooling
Hydrocooling
Vacuum Cooling
Cool Room Construction - Refrigeration
Cool Room Construction - Insulation
Refrigeration Systems
Choosing a refrigerated carrier
Temperature Data Loggers
Vegetable Physiology and Cooling
Fact Sheets and Articles
Managing your cooling requirements
Field Heat
Plastic Bins
Packaging and Cooling
Cool room construction for the vegetable grower
Cool room refrigeration checklist
Centre Line Loading
Thermometer Calibration
9

Posters Notes
Produce Handling Guidelines
* See Note Below.
4000 copies printed and distributed.
2000 reprint just produced.
Pathways for Exports - Sea Freight * See Note Below
Pathways for Exports - Air Freight * See Note Below
Pocket Guides Notes
Harvest, Packing and Dispatch Guide * See Note Below
Refrigerated Road Transport * See Note Below
Air freight of Perishables * See Note Below
Refrigerated Shipping * See Note Below
* Publications funded by the South Australian Air Freight Export Council, South Australian Freight
Council for Sea Cargo and the South Australian Land Freight Council.
Evaluation and Discussion on Publications
The posters in particular have been highly sought after and appear to be a successful mechanism to
deliver targeted messages to industry. The Produce Handling Guidelines were largely distributed to
transporters, wholesalers and retailers.
The project also made use of electronic media to distribute information. This proved successful with the
Cool Handling web page, from which, we have received much positive feed back. This has also proved to
be a time saving way of directing people to relevant information - rather than physically mailing
information to them. However, we have noted that paper copies of information are still important as only
a limited number of growers have ready access to web facilities. Other groups (agency, IDOs, consultants,
retailers) interested in information produced by the project generally had a high percentage of web access
and could more often could access relevant information from the site.
Information Kits and fact sheets were designed to address specific sections of cool chain handling. These
were publicised in a number of our publications and have been well accepted by individuals who were
interested in particular topics.
10

Visits One of the key components of the technology transfer program of the project relied on regional meetings
in the various growing regions throughout the country. These meetings would not have been possible
without the support and organisation of people in each of the districts who helped in organising venues,
inviting participants and promoting the work of the cool handling project.
Other information presented at the meetings included
• The benefits of temperature monitoring
• Some example temperature monitoring results
• Research results, including forced air cooling
Information, or information order forms were also distributed at each of the meetings. These included fact
sheets, information kits and most popularly and produce handling guidelines.
Another important aspect of the meetings was the discussion generated by the information presented.
Common points of discussion included:
Grower / Packer
• What are the benefits of cooling, when other temperature abuse is known to occur along the chain
• Cooling methods
Transport
• Mistrust between the parties involved
• Mixed loads, shipping with incompatible products
• Multiple pick up points affecting good temperature management
• The necessity of refrigerated transport over short transport distances
Wholesale Markets, Independent retailers and Supermarkets
• Mistrust between the parties involved
• Un-refrigerated fruit at the wholesale markets, upon delivery and during sale on the market floor
• The lack of cool chain management beyond the wholesale markets
• Mishandling of fruit in the retail store
11
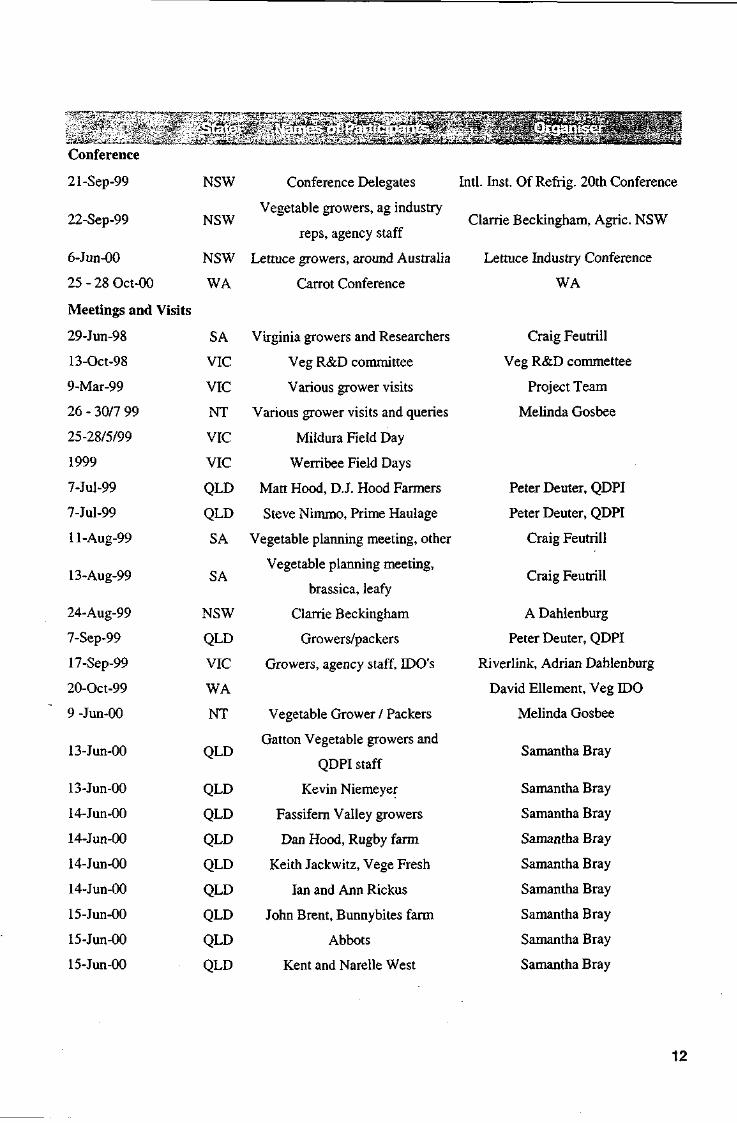
Conference
21-Sep-99 NSW
22-Sep-99 NSW
6-Jun-OO NSW
25 - 28 Oct-00 WA
Meetings and Visits
29-Jun-98 SA
13-Oct-98 VIC
9-Mar-99 VIC
26 - 30/7 99 NT
25-28/5/99 VIC
1999 VIC
7-Jul-99 QLD
7-M-99 QLD
ll-Aug-99 SA
13-Aug-99 SA
Clarrie Beckingham, Agric. NSW
Conference Delegates Intl. Inst. Of Refrig. 20th Conference
Vegetable growers, ag industry
reps, agency staff
Lettuce growers, around Australia Lettuce Industry Conference
Carrot Conference WA
24-Aug-99 NSW
7-Sep-99 QLD
17-Sep-99 VIC
20-Oct-99 WA
9 -Jun-00 NT
13-Jun-00 QLD
13-Jun-00 QLD
14-Jun-00 QLD
14-Jun-00 QLD
14-Jun-00 QLD
14-Jun-00 QLD
15-Jun-00 QLD
15-Jun-00 QLD
15-Jun-00 QLD
Virginia growers and Researchers
Veg R&D committee
Various grower visits
Various grower visits and queries
Mildura Field Day
Werribee Field Days
Matt Hood, D.J. Hood Farmers
Steve Nimmo, Prime Haulage
Vegetable planning meeting, other
Vegetable planning meeting,
brassica, leafy
Clarrie Beckingham
Growers/packers
Growers, agency staff, IDO's
Vegetable Grower / Packers
Gatton Vegetable growers and
QDPI staff
Kevin Niemeyer
Fassifern Valley growers
Dan Hood, Rugby farm
Keith Jackwitz, Vege Fresh
Ian and Ann Rickus
John Brent, Bunnybites farm
Abbots
Kent and Narelle West
Craig Feutrill
Veg R&D commettee
Project Team
Melinda Gosbee
Peter Deuter, QDPI
Peter Deuter, QDPI
Craig Feutrill
Craig Feutrill
A Dahlenburg
Peter Deuter, QDPI
Riverlink, Adrian Dahlenburg
David Ellement, Veg IDO
Melinda Gosbee
Samantha Bray
Samantha Bray
Samantha Bray
Samantha Bray
Samantha Bray
Samantha Bray
Samantha Bray
Samantha Bray
Samantha Bray
12

Wholesale Market Meetings
An offer was made to all wholesale markets in regards to holding meetings during the second half of
2000. The chamber and/or Market company in each market were contacted to assist coordination of
meeting/workshops.
Only the Brisbane market responded positively to the offer of conducting a workshop. The Adelaide,
Perth and Sydney market both responded that there was little interest from their members, due to current
good understanding of cool chain issues through their quality management systems. As we were unable to
conduct workshops in these markets, information was sent to the chambers informing them of the
information and publications available and where their members can obtain more information on cool
chain handling.
A workshop was conducted by Adrian Dahlenburg at the Brisbane Market on November 17. Information
was delivered to each of the markets along with order forms so information can be ordered from us.
Evaluation and Discussion of meetings
The meetings were beneficial for the project, particularly in guiding research directions, and the
highlighting the need for information in different areas. It was also greatly beneficial to understand the
different needs and requirements for cool handling information and adoption throughout the country. For
those involved hopefully the result was a greater understanding about the need and reason for good cool
chain handling practices.
The most difficult thing in conducting the meetings were the time in organising and travelling to the
regions for the meetings. Much of the success of the meetings relied on regional people generating
interest in the project and the meetings.
13

Research and Development Activities
Temperature Monitoring
Introduction
The original premise of the temperature monitoring was for the project and for the individuals involved to
better understand the temperature of vegetables as they pass through the marketing chain. This
information could then be used to determine the most critical points along the handling chain. For the
project this enabled us to better focus our information to key areas, and for those directly involved in the
monitoring it allowed them to make improvements in their handling systems where appropriate.
Temperature Monitoring Summary
Most of the temperature runs were conducted from the field where the produce was harvested, through to
the wholesale markets. The markets provided the most reliable site for the loggers to be collected. Early
trials with loggers being transported through to retail outlets, caused a higher rate of logger loss than at
the wholesale markets. Some successful runs were conducted through to retail outlets where the
monitoring was well coordinated with wholesaler and retailer.
Temperature Monitoring Data
Temperature monitoring was undertaken with a range of different vegetable crops, particularly in the
early years of the project. The most extensive collection of temperature monitoring was undertaken as
part of the microbiological survey work from the Northern Territory and South Australia to Victoria. The
monitoring work was undertaken with collaborating producers and packers as identified by IDO's and
other industry organisations and from meetings in various regions around Australia.
- Temperature loggers were provided to interested parties to use as they wish for a period up to a month.
They were encouraged to use them from the field through to the market end of the supply chain. A logger
recovery service paid for by the project was provided in each of the wholesale markets in Australia.
Users were asked to keep a log sheet to record the logger use, and the dates and times relating to specific
produce handling activities to help interpret the logger data. Loggers were returned to the SARDI cool
chain team for down-loading and interpretation. Once the temperature data was down-loaded, the
information was linked with the data log sheets and hard copies of the information provided to the
industry collaborators. Interpretations and suggestions on improved cool chain handling practices were
often made on the reports or discussed with the collaborators.
Some examples of the types of information and temperature data colleted from the temperature
monitoring work are included below with some comments relating to the temperature management of the
produce for that particular set of data. The issues raised in the comments would be the type of issues
raised with the relevant supply chain operators in discussion of the data-logger information.
14

D I U O U I I I - n ts iu i u nc tcmc i
20.0
mo
o
(0
a. E ao'
4.0
. i i 1 ' i r — i 1 i i | i i i | 1 i i | i i i | i i i | i . . , . .
28Th 29Fr 30Sa 31Su Jun 2Tu • 3W6 4Th Time (starting 27/05/1998) ;
Comments:
• The 2 lines on this graph are air temperature and the core temperature of the head of broccoli.
• The room cooling for the produce is slow (36hrs from 12 to 0°C) and could impact on the market
quality and shelf life, particularly if the same cooling rates were to occur with warmer incoming
produce temperatures.
• Coolstore is holding produce at near to optimum temperature.
• Minimal increase in temperature during packing.
• Temperature rise in the retail situation was slow, possibly being held in coolroom at retail store
operating at around 10°C.
Carrots - Packingshed to 2 Retail Outlets (Adelaide)
• i i — i i i .
18b - 18V* Time (starting 17/02/1998 07:40:06)
Comments
• Rapid temperature reduction achieved in cooling.
• Produce warming during distribution centre handling and transport to the retail stores.
• Produce cooling again in cool room at one of the retail stores.
15

Carrots to Darwin - Carrot Core and Van Air Temps
—i 1 1 — — i — - ^ — — i 1 =i i— SSa 6Su 7Mo
Time (starting 4/09/1998 09:38:30)
Comments
• Carrots transported from Adelaide to Darwin
• Large temperature span for air temperature while truck in operation. Some small potential for frozen
produce directly in front of air off coil as temperature go down to minus 2°C.
• Carrot core temperatures higher than optimal at loading.
• Carrot core temperatures slowly decreased (approx 3°C) during transit till midday Sunday 6 , then
increased over the next day. What happened? Warm produce added to load / carton or pallet
relocated on load / load movement or re-stowage so all or part of load blocked from adequate airflow,
are all possibilities.
• Van air temperature shows a slight tendency to follow daily external temperature variations which
could indicate the van is loaded to very near the full refrigeration capacity of the equipment.
16

25.0
20.0
B is.o 8. E'
I— 10.0
S.0
0 .
- J»<»,«*<-vsJ-»*s-
I -• . I . 5 T h ;•
— | 1 1 1 1 1 1 1 1 —
6Fr 7Sa 8Su Time (starting 4/08/1999 17:59:00)
-i 1 ' 9 M o
Comments
• Produce not cooled before loading which impacted on air temperature and likely was responsible
(together with any other warm produce on the load) for elevated transport van temperatures for the
first 24 to 36 hours.
• Transport temperature too low for bitter melon. Probably shipped as a minor component of a mixed
commodity load.
Northern Territory Monitoring
Objective: To investigate the cool handling of Asian vegetables and the effects on quality.
The Vegetable Cool Chain project is funded by HRDC and is a joint project between the South Australian
Research and Development Institute, Agriculture Victoria and NT DPIF. Part of the project was the
temperature monitoring of bitter melon and snake bean during transport via road freight from Darwin to
Melbourne. Data loggers were placed in cartons at Darwin, and records of the quality of the produce
taken. In Melbourne, the consignment was met at the market, loggers removed for collection of data and
product quality again recorded. A total of 20 successful consignments of bitter melon were monitored,
and 13 of snake beans.
Data is presented in Graphs 1 and 2 as the proportion of the journey that the produce spent in three
selected temperature brackets. 7 to 10°C is the optimum storage temperature for physiological quality of
bitter melon and snake beans, however they are often transported at much lower temperatures to ensure
heat damage does not occur. Above 10°C bitter melon will start to ripen, and snake beans produce enough
heat through respiration to damage the product. A typical time interval is 80 to 100 hours, from produce
arriving at depot for consolidation to being sold in the Footscray markets.
17

Graph 1. Proportion of journey that temperatures of <7, between 7 and 10° and over 10°C were recorded
in boxes of bitter melon transported by road freighted to Melbourne. Initial vegetable temperatures are
displayed under each column.
c
o
c o '•c o Q. O
22710.728.1 a5 10.7123 11.920.1 17.7a0 ia6 1X713.9 11.4112 S7 12212911.91X3
• <7C D7to10C D>10C
Graph 2. Proportion of journey that temperatures of <7, between 7 and 10° and over 10°C were recorded
in boxes of snake beans transported by road freight to Melbourne. Initial vegetable temperatures are
displayed under each column.
100%
CD
c
o
c o t : o D. O
12.3 10.5 12.6 8.0 10.1 11.5 11.6 11.7 6.7
• <7Cn7to iocn>ioc
10.6 13.0 13.1 10.1
Of greatest concern is the proportion of time the temperature was recorded above 10°C. For all the times
recorded, bitter melon spent 20% of its transit time above 10°C. For snake beans, this proportion was
slightly higher at 24%. Snake beans and bitter melon spent 46 and 37% respectively in the optimum
temperature range, and the remaining 30 and 43% of the total recorded time at less than 7°C. Also of
concern are the high temperatures of bitter melon at the beginning of the trip. Such produce is not
18

adequately precooled. This affects not only the shelf life of the product but also the ability of the
refrigeration unit in the truck to cool the produce.
The quality of bitter melon was recorded in Darwin and Melbourne. In the Melbourne market, 1 carton
was recorded as excellent quality, 3 as good quality, 9 as satisfactory and 5 as non saleable. The main
reasons for loss of quality was physical damage to the product, usually insect or other preharvest damage,
and ripening. Often the seeds inside the bitter melon sampled were turning red.
Key Issues Identified Through Temperature Monitoring
Mixed Produce Loads
Mixed produce loads are when different commodities are transported in the same truck, or when the same
produce type is loaded at different temperatures.
Mixed commodity loads would ideally have a dedicated compartment running at the recommended
temperature for each commodity. However, transport vehicles with multiple temperature compartments
are more expensive and not commonly used. The temperature of the truck is usually set at a temperature
that will prevent chilling injury to any produce in the vehicle (often 5°C), but this is often a non-ideal
temperature for particular vegetables.
Alternatively, a problem also occurs when warm produce is loaded along with properly pre-cooled
produce. The cooled produce subsequently warms as the temperature equilibrates with the warm produce.
Temperature monitoring has demonstrated that cooling during transport is at best extremely slow, and
usually negligible. When warm produce is to be loaded onto the truck, transporters are left with the
decision to either reject the load (at a financial cost to themselves) or accept warm produce and
compromise the quality of the other produce on the vehicle.
From these results it has been justifiably argued "If the other produce on the vehicle isn't at the right
temperature", or "the vehicle is running at the wrong temperature", what is the point of properly cooling
my vegetables prior to transport. The response is not an easy one, other than to say that the longer the
vegetables spend at the optimum temperatures, the better it will be when it comes to sell. Alternatively,
there are steps that can be taken to reduce the effects of mixed loads. Pallet covers can reduce the effects
of small or short term breaks in the cool chain. Trials we conducted demonstrated their usefulness,
provided the produce is properly cooled prior to covering, they are required for a brief time only, and that
the covers are removed once the produce is returned to correct refrigeration temperature.
19

Wholesale Markets and Distribution Centres
The wholesale markets are of great importance in delivering vegetables to the consumer. Most produce
will pass through either the wholesale markets or distribution centre (or both) before reaching the
consumer. However, some of the current practices in storage and marketing of vegetables results in large
breaks in the cool chain. Delivery to unrefrigerated receival areas and long periods without refrigeration
(at delivery and on the market selling floor) result in significant temperature increases. Refrigerated
selling floors greatly reduce this problem and are beginning to be adopted. Coordinated deliveries and
pre-selling of produce also allows fruit to be kept in the cool room longer. Distribution centres often have
facilities available to maintain the cool chain (loading docks, large refrigerated holding rooms), but good
practices must still be implemented to ensure fruit is not left standing around outside of refrigeration.
Cooling techniques and facilities
Adequate precooling and storage facilities have been identified as a key issue in the temperature
monitoring of vegetables. Many of the cool rooms monitored were found to be under capacity, resulting
in slow cooling rates or even the inability to reach the target temperature. This was particularly true of
smaller operators. Small gains can be made by harvesting produce in the cool of the morning and quickly
cooling vegetables, but the only real solution is an upgraded coolroom or refrigeration system. Rapid
cooling facilities (hydrocooling, vacuum cooling or forced air cooling) is also a requirement for optimum
produce quality. These also require suitable equipment and refrigeration capacity. New cool rooms and
cooling equipment is usually an expensive proposition and often down the list of grower priorities.
Unfortunately there are no easy solutions to this problem, however there are successful examples of
cooperative packing sheds and cool store facilities, which effectively spreads the expense of new
equipment over a group of growers.
Conducting future monitoring
Many of the obstacles and challenges for successful temperature monitoring have been addressed in the
Temperature Data Loggers Information kit, available on the project web site. Some of the key points for
successful temperature monitoring include:
• Good communication between all parties. People sending loggers need to inform those receiving the
loggers prior to and at the time of sending the loggers. This can help avoid some of the loss (or theft,
or vandalism) of loggers that occurred during this project.
• Good record keeping to interpret logger results
• Well marked. It is easy to misplace loggers if they are not clearly visible. Particularly in loads with
multiple pallets, loggers can be easily missed. Bright or contrasting coloured stickers, tape or ribbon
should be used to identify the presence of a logger. It is important to label all four sides of a pallet.
• Providing a mechanism for returning the loggers. Providing a self addressed, prepaid envelope
enables quick and easy return of loggers by the receiver.
20

The most critical factors when temperature monitoring are good communication with the marketing chain
and good record keeping about the loggers movements. Without good records being kept, the logger
results become difficult, if not impossible to interpret. The records can be detailed, but in most situations
need only include the most critical movements of vegetables within the handling system.
A typical record sheet would look like
15/01 9:00 a.m. Broccoli Harvested
10:00 Arrived at Shed and into cool room
2:30 p.m. Onto grader (logger removed for 5 mins)
3:30 p.m. Packed and returned to cool room
16/01 6:00 p.m. Loaded on truck and transported to wholesale markets
9:30 p.m. Arrived at markets and logger removed
Temperature Monitoring Outcomes
One of the recurring results from the temperature monitoring was the surprise that the people expressed
when they saw the temperatures that occurred during the handling of their produce. Inevitably the results
were worse than they expected. This highlights the need for people to actually monitor produce
temperatures, rather than relying on feeling the produce, or simply relying on the temperature displayed
on the coolroom.
Monitoring temperatures also highlights where breaks are occurring in the handling chain. In speaking
with individuals in the handling chain, much of the blame was usually attributed to "everyone else" in the
chain. The objective results of the temperature logger demonstrate where problems need to be addressed.
Common grower complaints, particularly with mishandling at wholesale or distribution level, were
highlighted, but often an equally serious problem of slow cooling, or non-ideal shipping temperature were
also shown in the results.
While our results were not used or intended for dispute resolution, temperature monitoring can be highly
helpful for this process, particularly on export shipments or over long distances. Temperature monitoring
can be a highly beneficial in integrated supply chains, where all groups are well coordinated and
cooperative, to enable continual improvement. However, for less organised marketing arrangements
temperature monitoring is important to enable clear understanding of what the consequences are for
uncoordinated produce handling.
The results have been useful to highlight breaks in the cool chain and where improvements need to be
implemented.
21

Warming and Cooling rates of palletised produce Forced air cooling was found to offer many benefits in comparison to room cooling. All produce cooled
much faster and much more evenly with forced air cooling. Rapid cooling is beneficial for maintaining
postharvest quality. During room cooling of one pallet, individual pieces of produce took between 9 and
25 hours to properly cool. This uneven cooling can lead to uneven ripening/softening, water loss and
susceptibility to decay within a single pallet. If the produce is room cooled a number of times (in field
bins, prior to shipping, at wholesale markets etc) this can lead to produce with varying qualities being
presented to the consumer as a uniform line. Rapid cooling systems greatly reduce the variability in
product temperature. Forced air cooling is recommended as a system that offers rapid cooling, with the
benefit of being able to be used in conjunction with an existing cool room.
From temperature data logging and observation, there are times during the handling chain where product
is not under refrigeration and can warm quite rapidly. Pallet wraps can be of benefit in better maintaining
the cool chain, where these breaks occur. Three unperforated wraps were tested (thin plastic wrap, bubble
wrap and insulated foil) and all approximately doubled the time to reach 5°C compared with an
unwrapped pallet. However there are limitations to the use of pallet wraps. If product is not properly
precooled prior to applying the wrap, enclosing the product will rapidly lead to heat and ethylene build up
and subsequent product deterioration. Enclosed pallet wraps also prevent cooling if warm produce is
placed in a cool room. Some possible practical uses include
• Immediately prior to transport. Reusable pallet wraps could be used to cover produce if it is not
under refrigeration. These could be removed as the truck is being loaded.
• During transport. Wraps could be used on pallets of properly cooled vegetables that are to be carried
at non-ideal temperatures. This can occur if the truck is running at a higher temperature, or if warm
product is being loaded on the truck with cool product. Even with transport vehicles running at 5°C,
properly cooled vegetables at 0°C will warm extremely slowly if covered in pallet wrap.
• At the wholesale markets. If refrigeration facilities are a distance from the point of unloading or the
produce spends time with no refrigeration, pallet wraps will reduce the costs of refrigeration in re-
cooling the produce and better maintain quality.
22
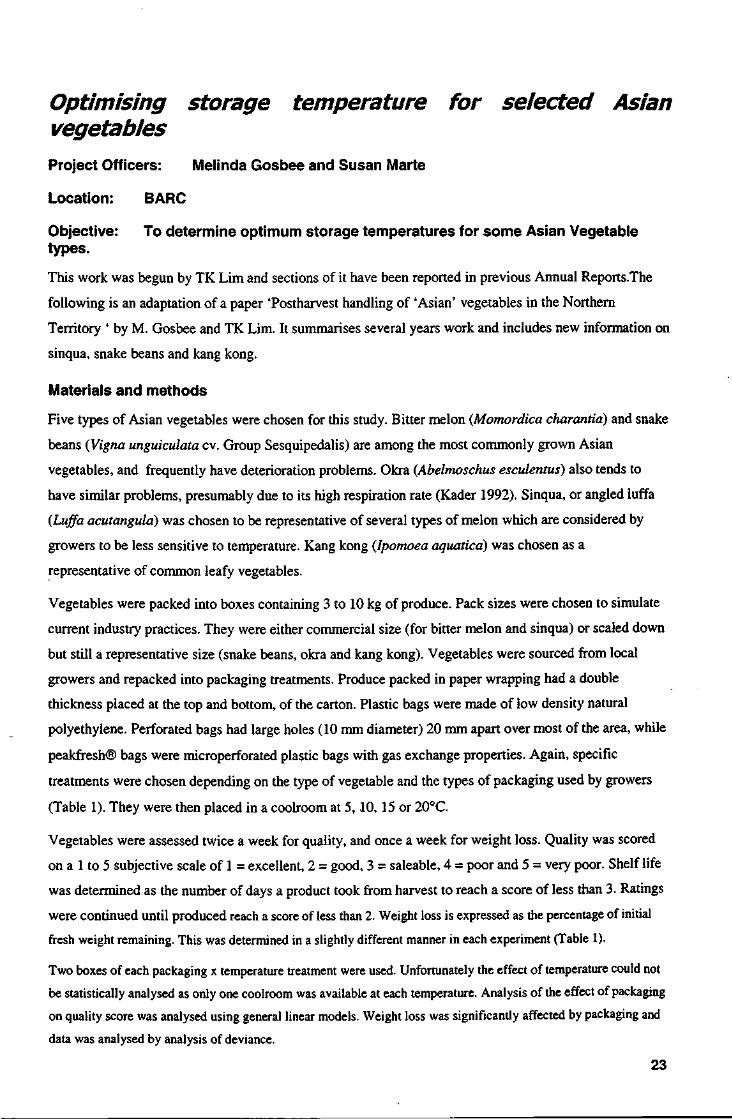
Optimising storage temperature for selected Asian vegetables Project Officers: Melinda Gosbee and Susan Marte
Location: BARC
Objective: To determine optimum storage temperatures for some Asian Vegetable types.
This work was begun by TK Lim and sections of it have been reported in previous Annual Reports.The
following is an adaptation of a paper 'Postharvest handling of 'Asian' vegetables in the Northern
Territory ' by M. Gosbee and TK Lim. It summarises several years work and includes new information on
sinqua, snake beans and kang kong.
Materials and methods
Five types of Asian vegetables were chosen for this study. Bitter melon {Momordica charantia) and snake
beans (Vigna unguiculata cv. Group Sesquipedalis) are among the most commonly grown Asian
vegetables, and frequently have deterioration problems. Okra (Abelmoschus esculentus) also tends to
have similar problems, presumably due to its high respiration rate (Kader 1992). Sinqua, or angled luffa
(Luffa acutangula) was chosen to be representative of several types of melon which are considered by
growers to be less sensitive to temperature. Kang kong (Ipomoea aquatica) was chosen as a
representative of common leafy vegetables.
Vegetables were packed into boxes containing 3 to 10 kg of produce. Pack sizes were chosen to simulate
current industry practices. They were either commercial size (for bitter melon and sinqua) or scaled down
but still a representative size (snake beans, okra and kang kong). Vegetables were sourced from local
growers and repacked into packaging treatments. Produce packed in paper wrapping had a double
thickness placed at the top and bottom, of the carton. Plastic bags were made of low density natural
polyethylene. Perforated bags had large holes (10 mm diameter) 20 mm apart over most of the area, while
peakfresh® bags were microperforated plastic bags with gas exchange properties. Again, specific
treatments were chosen depending on the type of vegetable and the types of packaging used by growers
(Table 1). They were then placed in a coolroom at 5, 10, 15 or 20°C.
Vegetables were assessed twice a week for quality, and once a week for weight loss. Quality was scored
on a 1 to 5 subjective scale of 1 = excellent, 2 = good, 3 = saleable, 4 = poor and 5 = very poor. Shelf life
was determined as the number of days a product took from harvest to reach a score of less than 3. Ratings
were continued until produced reach a score of less than 2. Weight loss is expressed as the percentage of initial
fresh weight remaining. This was determined in a slightly different manner in each experiment (Table 1).
Two boxes of each packaging x temperature treatment were used. Unfortunately the effect of temperature could not
be statistically analysed as only one coolroom was available at each temperature. Analysis of the effect of packaging
on quality score was analysed using general linear models. Weight loss was significantly affected by packaging and
data was analysed by analysis of deviance.
23

Table 1. Packaging and pack size used in the assessment of optimum storage life and temperature of five Asian vegetables.
Bitter Melon Okra Sinqua Snake beans Kangkong
Packaging
Paper wrapping / / / / /
Perforated Bag / / / /
PeakfreshBag / / • /
Plastic Bag • / / / /
Pack size 10 kg 5 kg 10 kg 5 kg 3 kg
Weight loss combined weight combined individual total weight of total weight of
of 5 fruit weight of 10 weight of 5 fruit 5 kg box 3 kg box
fruit
Results and Discussion
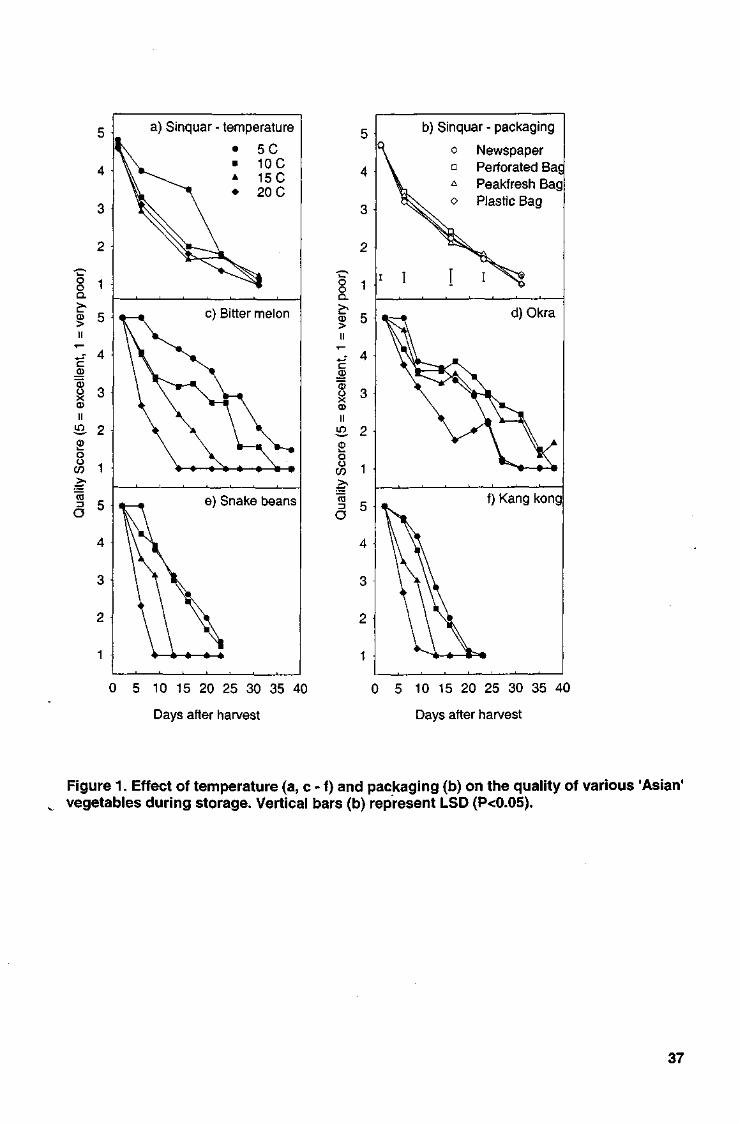
Temperature had by far the greater effect on quality and shelf life than packaging. Differences in quality
score of vegetables stored at different temperatures (Figure 1 a, c-f) were greater than that observed
between vegetables stored in different types of packaging (Figure lb).
Figure 1. Effect of temperature (a, c - f) and packaging (b) on the quality of various 'Asian' vegetables
during storage. Vertical bars (b) represent LSD (P<0.05).
24

a) Sinquar - temperature
e) Snake beans
•—• - •
0 5 10 15 20 25 30 35 40
Days after harvest
b) Sinquar - packaging
o Newspaper • Perforated Bac A Peakfresh Bag o Plastic Bag
d) Okra
0 5 10 15 20 25 30 35 40
Days after harvest
25
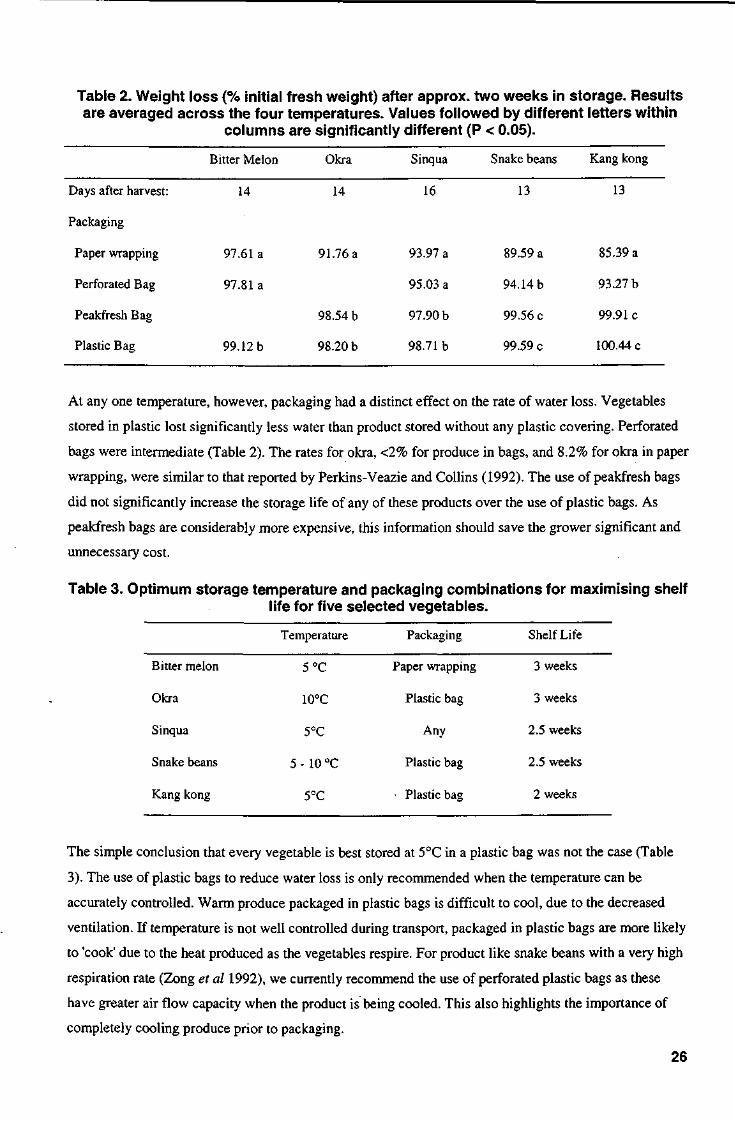
Table 2. Weight loss (% initial fresh weight) after approx. two weeks in storage. Results are averaged across the four temperatures. Values followed by different letters within
columns are significantly different (P < 0.05).
Bitter Melon Okra Sinqua Snake beans Kang kong
Days after harvest: 14 14 16 13 13
Packaging
Paper wrapping 97.61a 91.76 a 93.97 a 89.59 a 85.39 a
Perforated Bag 97.81a 95.03 a 94.14 b 93.27 b
PeakfreshBag 98.54 b 97.90 b 99.56 c 99.91c
Plastic Bag 99.12 b 98.20 b 98.71b 99.59 c 100.44 c
At any one temperature, however, packaging had a distinct effect on the rate of water loss. Vegetables
stored in plastic lost significantly less water than product stored without any plastic covering. Perforated
bags were intermediate (Table 2). The rates for okra, <2% for produce in bags, and 8.2% for okra in paper
wrapping, were similar to that reported by Perkins-Veazie and Collins (1992). The use of peakfresh bags
did not significantly increase the storage life of any of these products over the use of plastic bags. As
peakfresh bags are considerably more expensive, this information should save the grower significant and
unnecessary cost.
Table 3. Optimum storage temperature and packaging combinations for maximising shelf life for five selected vegetables.
Temperature Packaging Shelf Life
Bitter melon 5°C Paper wrapping 3 weeks
Okra 10°C Plastic bag 3 weeks
Sinqua 5°C Any 2.5 weeks
Snake beans 5 - 10 °C Plastic bag 2.5 weeks
Kang kong 5°C • Plastic bag 2 weeks
The simple conclusion that every vegetable is best stored at 5°C in a plastic bag was not the case (Table
3). The use of plastic bags to reduce water loss is only recommended when the temperature can be
accurately controlled. Warm produce packaged in plastic bags is difficult to cool, due to the decreased
ventilation. If temperature is not well controlled during transport, packaged in plastic bags are more likely
to 'cook' due to the heat produced as the vegetables respire. For product like snake beans with a very high
respiration rate (Zong et al 1992), we currently recommend the use of perforated plastic bags as these
have greater air flow capacity when the product is being cooled. This also highlights the importance of
completely cooling produce prior to packaging.
26

The use of plastic bags for bitter melon poses a different problem. These fruit are close to maturity at
harvest, are producers of ethylene and are also sensitive to ethylene (Zong et al 1992). Optimum stage of
harvest is difficult to determine, and is clouded by the desire of growers to harvest heavier and therefore
more profitable vegetable. As the bitter melon ripen, the flesh rapidly turns a brilliant yellow and splits
open. This may induce the rest of the melons in the box to likewise ripen. Bitter melon are consumed
immature, and such ripe fruit are unmarketable. Temperature reduces the rate of ripening and loss of
quality (Figure lc), but packing bitter melon in paper wrapping increases ventilation within the box and
reduces the possibility ethylene triggering the fruit to ripen.
In this trial, okra stored in paper wrapping succumbed to fungal decay more readily than that in plastic
bags. It may be that the paper wrapping was a source of inoculum, or that water loss from the okra
predisposed them to decay. From these results, plastic packaging is more beneficial than paper wrapping
(Table 3).
Sinqua was different because the shelf life of vegetables stored at 20°C were not greatly different to that
of vegetables stored at 15 or 10°C. This would be why sinqua, and other melons, have a reputation among
growers for longer shelf life. Sinqua stored at 5°C had a significantly longer shelf life than that stored at
any other temperature (Figure la).
Kang kong is a leafy vegetable with a very short shelf life. Low temperatures of 5 to 10°C were beneficial
in prolonging shelf life (Figure 1 f). Water loss was significantly greater in paper wrapping and perforated
bags from day 6, and the use of plastic bags is strongly recommended. At 15 and 20°C, breakdown in
kang kong was seen as wilting and yellowing of the lower leaves and fungal decay. At lower temperatures
colour and turgor were maintained for longer.
Chilling injury was observed in bitter melon and okra after 3 weeks at 5°C. Dark watery pits first
appeared on the bitter melon at this time and increased with time in storage. Zong et al (1992) suggested
that none of these vegetables should be stored at less than 10°C for more than two weeks, due to chilling
injury. That observation is more accurate as the vegetables were removed to 20° and chilling injury
observed after 2 to 3 days. This was not attempted in our experiment and symptoms may have been more
obvious had we held the vegetables at 20°C after removal from cooler temperatures.
At the present time, most growers cool their produce to 4 to 8°C, and temperatures of 4 to 6°C are used in
road freight for periods of 3 days. While these temperatures may seem a bit low, the lower temperatures
reduce the possibility of the vegetables heating up within packaging. The transit time of 4 days to
southern markets is short enough to minimise the risk of developing chilling injury. When vegetables are
properly precooled, vegetable quality is maintained and produce reaches markets in a good condition.
Technology in terms of temperature and packaging exist for a range of vegetables. It is, however,
important to match these not only to each vegetable in the case of its particular physiology but also to the
capability of the growers and available transport options. Our recommendations may well change as the
skill of the growers in postharvest handling and managing the cool chain increase.
27

Acknowledgments
Thanks to Carole Wright for statistical analysis. Funding for this project by HRDC and RIRDC is
gratefully appreciated.
References
Bureau of Meteorology, Commonwealth of Australia. 1999.
http://www.bom.gov.au/climate/averages/tables
Kader A.A. 1992. Postharvest biology and technology: an overview. In: Postharvest Technology of
Horticultural Crops, pg 15 to 20. University of California, USA
Perkins-Veazie, P. and Collins, J.K. 1992. Cultivar, packaging, and storage temperature differences in
postharvest shelf life of okra. HortTechnology 2:350-352.
Zong, R.J., Cantwell, M., Morris, L. and Rubatzky, V. 1992. Postharvest studies on four fruit-type
Chinese vegetables. Acta Horticulturae 318:345-354.
28

NT Temperature Monitoring Project Officers: Melinda Gosbee and Susan Marte
Location: BARC
Objective: To investigate the cool handling of Asian vegetables and the effects on quality.
The Vegetable Cool Chain project is funded by HRDC and is a joint project between the South Australian
Research and Development Institute, Agriculture Victoria and NT DPIF. Part of the project was the
temperature monitoring of bitter melon and snake bean during transport via road freight from Darwin to
Melbourne. Data loggers were placed in cartons at Darwin, and records of the quality of the produce
taken. In Melbourne, the consignment was met at the market, loggers removed for collection of data and
product quality again recorded. A total of 20 successful consignments of bitter melon were monitored,
and 13 of snake beans.
Data is presented in Graphs 1 and 2 as the proportion of the journey that the produce spent in three
selected temperature brackets. 7 to 10°C is the optimum storage temperature for physiological quality of
bitter melon and snake beans, however they are often transported at much lower temperatures to ensure
heat damage does not occur. Above 10°C bitter melon will start to ripen, and snake beans produce enough
heat through respiration to damage the product. A typical time interval is 80 to 100 hours, from produce
arriving at depot for consolidation to being sold in the Footscray markets.
29

Graph 1. Proportion of journey that temperatures of <7, between 7 and 10° and over 10°C were recorded in boxes of bitter melon transported by road freighted to Melbourne. Initial
vegetable temperatures are displayed under each column.
o c 3
c o
'•£ O Q. O 0.
22.710.728.1 a5 1Q7123 11.920.1 17.7a0 ia6 ia7ia911.4 112 a7 12212911.9ia3
• <7C D 7 t o 1 0 C D > 1 0 C
Graph 2. Proportion of journey that temperatures of <7, between 7 and 10° and over 10°C were recorded in boxes of snake beans transported by road freight to Melbourne. Initial
vegetable temperatures are displayed under each column.
CD C
o
c g o Q. o
12.3 10.5 12.6 8.0 10.1 11.5 11.6 11.7 6.7 10.6 13.0 13.1 10.1
• <7Cn7to 10Crj>10C
Of greatest concern is the proportion of time the temperature was recorded above 10°C. For all the times
recorded, bitter melon spent 20% of its transit time above 10°C. For snake beans, this proportion was
slightly higher at 24%. Snake beans and bitter melon spent 46 and 37% respectively in the optimum
temperature range, and the remaining 30 and 43% of the total recorded time at less than 7°C. Also of
concern are the high temperatures of bitter melon at the beginning of the trip. Such produce is not
30

adequately precooled. This affects not only the shelf life of the product but also the ability of the
refrigeration unit in the truck to cool the produce.
The quality of bitter melon was recorded in Darwin and Melbourne. In the Melbourne market, 1 carton
was recorded as excellent quality, 3 as good quality, 9 as satisfactory and 5 as non saleable. The main
reasons for loss of quality was physical damage to the product, usually insect or other preharvest damage,
and ripening. Often the seeds inside the bitter melon sampled were turning red.
31

Postharvest handling of 'Asian' vegetables in the Northern Territory M.J. Gosbee and T.K. Lim
Abstract
In the Northern Territory of Australia a significant proportion of vegetable production is based on 'Asian'
type vegetables. These are mainly grown in the dry season (April to October) and are sold locally and
interstate. Interstate markets are 4000 km distant from the place of production. Most vegetables are
transported south by refrigerated road freight, which takes up to four days. This has necessitated careful
handling and cooling of the vegetables to ensure they reach the market in an acceptable condition.
Most popular vegetables grown in the NT are bitter melon {Momordica charantia), snake beans (Vigna
unguiculata cv. Group Sesquipedalis), okra {Abelmoschus esculentus), angled luffa or sinqua {Luffa
acutangula) long, hairy and winter melon (all types of Benincasa hispida), kang kong {Ipomoea aquatica)
and basil {Ocimum basilicum). These vegetables have different postharvest storage requirements.
Storage experiments testing the shelf life of some of these vegetables have been carried out over several
years. Boxes of vegetables stored in several different types of packaging at 5, 10, 15 and 20°C were
evaluated for overall quality, chilling injury, water loss and decay. Bitter melon and sinqua were best
stored at 5°C in paper wrapping or a perforated plastic bag. Okra and snake beans developed chilling
injury at 5°C, and the best storage condition found were 10°C and in a plastic bags. Kang kong
maintained its quality when stored at 5°C. Generally, vegetables need to be cooled to less than 12°C
before packaging. A more difficult issue has been educating the growers to thoroughly cool produce
before packing to ensure the vegetables remain cool during transport.
Introduction
Temperature control is the single most important factor in maintaining the shelf life and quality of
vegetables after harvest (Kader 1992). In the Northern Territory (NT), ambient daytime temperatures
during the main vegetable production season (May to October) are hot and dry, in the range of 19.3 to
33.1°C, with humidities of 38 to 78 % (Bureau of Meteorology 1999). Vegetables from both "European"
and "Asian" origins are grown in the NT. The "Asian" vegetables are mainly tropical cucurbits, along
with others requiring similar tropical climates. Interstate markets for these commodities are 4000 km
away. Produce is generally transported by refrigerated road freight which takes up to 4 days. Information
on the medium term storage of these vegetables is limited. This paper describes several storage
experiments conducted to determine the optimum temperature for freighting these vegetables, and some
of the problems encountered with their postharvest handling.
Materials and methods
Five types of Asian vegetables were chosen for this study. Bitter melon {Momordica charantia) and snake
beans {Vigna unguiculata cv. Group Sesquipedalis) are the most commonly grown vegetables (H. Ngo,
32

NT DPIF Economist, 1999., pers. comm.), and frequently have deterioration problems. Okra
(Abelmoschus esculentus) also tends to have similar problems, presumably due to its high respiration rate
(Kader 1992). Sinqua, or angled luffa (Luffa acutangula) was chosen to be representative of several types
of melon which are considered by growers to be less sensitive to temperature. Kang kong (Ipomoea
aquatica) was chosen as a representative of common leafy vegetables.
Vegetables were packed into boxes containing 3 to 10 kg of produce. Pack sizes were chosen to simulate
current industry practices. They were either commercial size (for bitter melon and sinqua) or scaled down
but still a representative size (snake beans, okra and kang kong). Vegetables were sourced from local
growers and repacked into packaging treatments. Produce packed in paper wrapping had a double
thickness placed at the top and bottom, of the carton. Plastic bags were made of low density natural
polyethylene. Perforated bags had large holes (10 mm diameter) 20 mm apart over most of the area, while
peakfresh® bags were microperforated plastic bags with gas exchange properties. Again, specific
treatments were chosen depending on the type of vegetable and the types of packaging used by growers
(Table 1). They were then placed in a coolroom at 5, 10, 15 or 20°C.
Vegetables were assessed twice a week for quality, and once a week for weight loss. Quality was scored
on a 1 to 5 subjective scale of 1 = excellent, 2 = good, 3 = saleable, 4 = poor and 5 = very poor. Shelf life
was determined as the number of days a product took from harvest to reach a score of less than 3. Ratings
were continued until produced reach a score of less than 2. Weight loss is expressed as the percentage of
initial fresh weight remaining. This was determined in a slightly different manner in each experiment
(Table 1).
Two boxes of each packaging x temperature treatment were used. Unfortunately the effect of temperature
could not be statistically analysed as only one coolroom was available at each temperature. Analysis of
the effect of packaging on quality score was analysed using general linear models. Weight loss was
significantly affected by packaging and data was analysed by analysis of deviance.
Results and Discussion
Temperature had by far the greater effect on quality and shelf life than packaging. Differences in quality
score of vegetables stored at different temperatures (Figure 1 a, c-f) were greater than that observed
between vegetables stored in different types of packaging (Figure lb).
At any one temperature, however, packaging had a distinct effect on the rate of water loss. Vegetables
stored in plastic lost significantly less water than product stored without any plastic covering. Perforated
bags were intermediate (Table 2). The rates for okra, <2% for produce in bags, and 8.2% for okra in paper
wrapping, were similar to that reported by Perkins-Veazie and Collins (1992). The use of peakfresh bags
did not significantly increase the storage life of any of these products over the use of plastic bags. As
peakfresh bags are considerably more expensive, this information should save the grower significant and
unnecessary cost.
33

The simple conclusion that every vegetable is best stored at 5°C in a plastic bag was not the case (Table
3). The use of plastic bags to reduce water loss is only recommended when the temperature can be
accurately controlled. Warm produce packaged in plastic bags is difficult to cool, due to the decreased
ventilation. If temperature is not well controlled during transport, packaged in plastic bags are more likely
to 'cook' due to the heat produced as the vegetables respire. For product like snake beans with a very high
respiration rate (Zong 1992), we currently recommend the use of perforated plastic bags as these have
greater air flow capacity when the product is being cooled. This also highlights the importance of
completely cooling produce prior to packaging.
The use of plastic bags for bitter melon poses a different problem. These fruit are close to maturity at
harvest, are producers of ethylene and are also sensitive to ethylene (Zong et al 1992). Optimum stage of
harvest is difficult to determine, and is clouded by the desire of growers to harvest heavier and therefore
more profitable vegetable. As the bitter melon ripen, the flesh rapidly turns a brilliant yellow and splits
open. This may induce the rest of the melons in the box to likewise ripen. Bitter melon are consumed
immature, and such ripe fruit are unmarketable. Temperature reduces the rate of ripening and loss of
quality (Figure lc), but packing bitter melon in paper wrapping increases ventilation within the box and
reduces the possibility ethylene triggering the fruit to ripen.
In this trial, okra stored in paper wrapping succumbed to fungal decay more readily than that in plastic
bags. It may be that the paper wrapping was a source of inoculum, or that water loss from the okra
predisposed them to decay. From these results, plastic packaging is more beneficial than paper wrapping
(Table 3).
Sinqua was different because the shelf life of vegetables stored at 20°C were not greatly different to that
of vegetables stored at 15 or 10°C. This would be why sinqua, and other melons, have a reputation among
growers for longer shelf life. Sinqua stored at 5°C had a significantly longer shelf life than that stored at
any other temperature (Figure la).
Kang kong is a leafy vegetable with a very short shelf life. Low temperatures of 5 to 10°C were beneficial
in prolonging shelf life (Figure 1 f. Water loss was significantly greater in paper wrapping and perforated
bags from day 6, and the use of plastic bags is strongly recommended. At 15 and 20°C, breakdown in
kang kong was seen as wilting and yellowing of the lower leaves and fungal decay. At lower temperatures
colour and turgor were maintained for longer.
Chilling injury was observed in bitter melon and okra after 3 weeks at 5°C. Dark watery pits first
appeared on the bitter melon at this time and increased with time in storage. Zong et al (1992) suggested
that none of these vegetables should be stored at less than 10°C for more than two weeks, due to chilling
injury. That observation is more accurate as the vegetables were removed to 20° and chilling injury
observed after 2 to 3 days. This was not attempted in our experiment and symptoms may have been more
obvious had we held the vegetables at 20°C after removal from cooler temperatures.
34

At the present time, most growers cool their produce to 8 to 10°C, and temperatures of 4 to 6°C are used
in road freight for short periods. While these temperatures may seem a bit low, the lower temperatures
reduce the possibility of the vegetables heating up within packaging. The transit time of 4 days to
southern markets is short enough to minimise the risk of developing chilling injury. When vegetables are
properly precooled, vegetable quality is maintained and produce reaches markets in a good condition.
Technology in terms of temperature and packaging exist for a range of vegetables. It is, however,
important to match these not only to each vegetable in the case of its particular physiology but also to the
capability of the growers and available transport options. Our recommendations may well change as the
skill of the growers in postharvest handling and managing the cool chain increase.
Acknowledgments
Thank you to Susan Marte who helped with the experiments and preparation of this paper. Carole Wright
for statistical analysis. Funding for this project by HRDC and RIRDC is gratefully appreciated.
References
Bureau of Meteorology, Commonwealth of Australia. 1999.
http://www.bom.gov.au/climate/averages/tables
Kader A.A. 1992. Postharvest biology and technology: an overview. In: Postharvest Technology of
Horticultural Crops, pg 15 to 20,. University of California, USA
Perkins-Veazie, P. and Collins, J.K. 1992. Cultivar, packaging, and storage temperature differences in
postharvest shelf life of okra. HortTechnology 2:350-352.
Zong, R.J., Cantwell, M., Morris, L. and Rubatzky, V. 1992. Postharvest studies on four fruit-type
Chinese vegetables. Acta Horticulturae 318:345-354.
35

Table 4. Packaging and pack size used in the assessment of optimum storage life and temperature of five Asian vegetables.
Bitter Melon Okra Sinqua Snake beans Kang kong
Packaging
Paper wrapping / • / / /
Perforated Bag / / / /
Peakfresh Bag / / / /
Plastic Bag / S / / /
Pack size 10 kg 5 kg 10 kg 5 kg 3 kg
Weight loss combined weight of 5 fruit
combined weight of 10
fruit
individual weight of 5 fruit
total weight of 5 kg box
total weight of 3 kg box
Table 5. Weight loss (% initial fresh weight) after approx. two weeks in storage. Results are averaged across the four temperatures. Values followed by different letters within
columns are significantly different (P < 0.05).
Bitter Melon Okra Sinqua Snake beans Kang kong
Days after harvest: 14 14 16 13 13
Packaging
Paper wrapping 97.61 a 91.76 a 93.97 a 89.59 a 85.39 a
Perforated Bag 97.81 a 95.03 a 94.14 b 93.27 b
Peakfresh Bag 98.54 b 97.90 b 99.56 c 99.91 c
Plastic Bag 99.12 b 98.20 b 98.71 b 99.59 c 100.44 c
Table 6. Optimum storage temperature and packaging combinations for maximising shelf life for five selected vegetables.
Temperature Packaging Shelf Life
Bitter melon 5°C Paper wrapping 3 weeks
Okra 10°C Plastic bag 3 weeks
Sinqua 5°C Any 2.5 weeks
Snake beans 5 - 10 °C Plastic bag 2.5 weeks
Kang kong 5°C Plastic bag 2 weeks
36
a) Sinquar - temperature
0 5 10 15 20 25 30 35 40
Days after harvest
o o Q.
CD >
C _CD
"35 o X CD
in
o o
CO
O
~- 4
1
b) Sinquar - packaging
o Newspaper D Perforated Bag ^ Peakfresh Bag o Plastic Bag
d) Okra
f) Kang kong
0 5 10 15 20 25 30 35 40
Days after harvest
Figure 1. Effect of temperature (a, c - f) and packaging (b) on the quality of various 'Asian' vegetables during storage. Vertical bars (b) represent LSD (P<0.05).
37

Inoculum of vegetables at time of harvest An investigation of the microbial levels of vegetables at time of harvest was carried out for all five
commodities chosen, ie. lettuce, broccoli, carrots, snake beans and bitter melon. Several farms were
selected for sampling and several samples were collected from each farm and tested for total aerobic
microorganisms, coliforms, yeasts and moulds, and fluorescent Pseudomonads.
An indication of the variability of microbial inoculum from one plant to the next was provided by these
tests. Total aerobic counts were used to give a general indication of the numbers of microorganisms on
vegetables. Coliform counts give some idea of the possibility of human pathogens present on the
vegetables, especially if Escherichia coli were found. Yeast and moulds, and fluorescent Pseudomonads
are indicators of the presence of plant spoilage organisms.
Method
Several samples of each commodity were collected from several farms in Victoria and Nortem Territory.
The number of samples and farms was dependent on the availiability of commodities in an area and the
restriction of how many samples could be processed on the same day as picking. Samples were placed in
sterile bags and were transported back to the laboratory with ice packs in an esky.
Victoria
Four or five carrots were picked from three locations in one field from each of three farms. Two or three
heads of broccoli were picked from three locations in one field from each of four farms. One head of
lettuce was picked from three locations in one field from each of three farms.
Northern Teritory
Eight to ten snakebeans were picked from five locations in one field from each of three farms. Two or
three bitter melons were picked from three locations in one field from five farms.
Samples were tested on the same day as picking and the numbers counted as appropriate for each test
over the next few days. All counts were then calculated as Colony Forming Units per gram (CFU/g) of
produce.
Results
Microbial level on vegetables at time of harvest are shown in the following graphs. There was a large
variability in micro levels measured. The single highest counts were obtained on bitter melon were
40300000 CFU/g. Other bitter melon had values as low as 30 CFU/g.
The vegetable types displayed different numbers of organisms. For example, snakebeans displayed
relatively higher counts of Yeasts and Moulds. The Micro-organisms found in the greatest amounts were
Total Aerobic Count, followed by Yeasts and Moulds, with Coliforms and Fluorescent Pseudomonads.
38
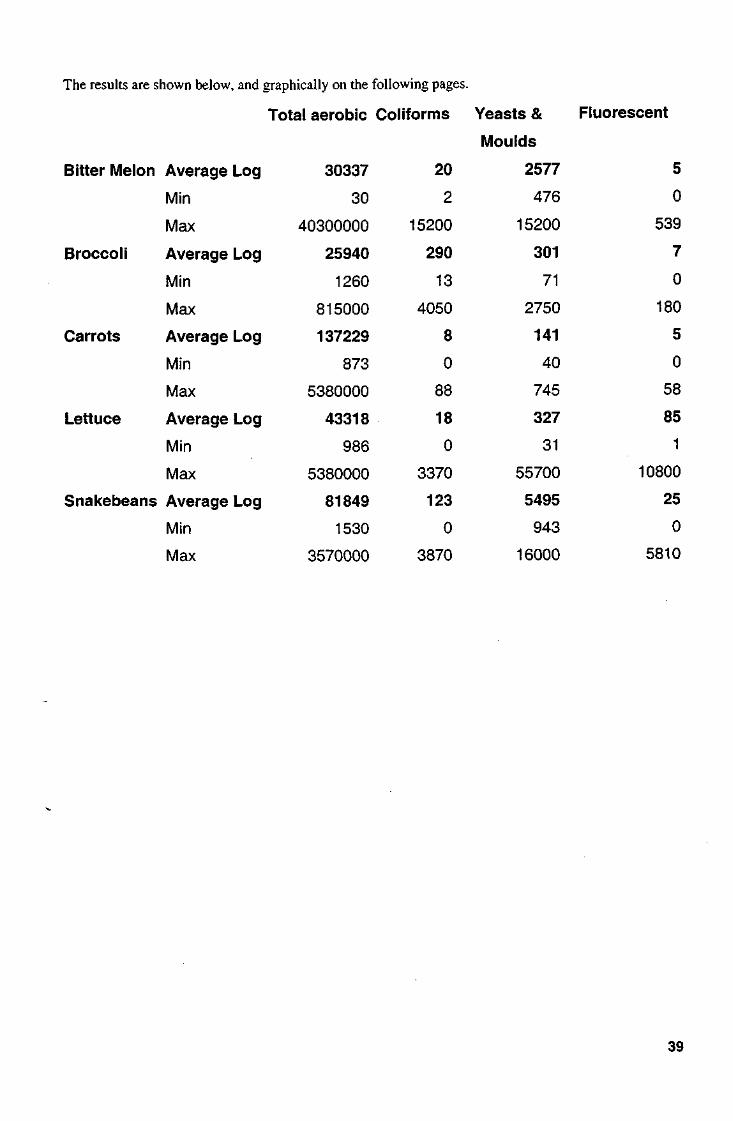
The results are shown below, and graphically on the following pages.
Total aerobic Coliforms Yeasts & Fluorescent
Moulds
Bitter Melon Average Log 30337 20 2577 5
Min 30 2 476 0
Max 40300000 15200 15200 539
Broccoli Average Log 25940 290 301 7
Min 1260 13 71 0
Max 815000 4050 2750 180
Carrots Average Log 137229 8 141 5
Min 873 0 40 0
Max 5380000 88 745 58
Lettuce Average Log 43318 18 327 85
Min 986 0 31 1
Max 5380000 3370 55700 10800
Snakebeans Average Log 81849 123 5495 25
Min 1530 0 943 0
Max 3570000 3870 16000 5810
39

100000000
10000000
1000000
100000
10000
1000
100
10
1
Bitter Melon Total aerobic count
1 1 2 3 1 2 3 1 2 3 1 2 3 1 2 3 1 2 3 4 5
100000
10000
1000
100
10
Bitter Melon Conforms
1
MM 1 I . I 1 1 2 3 1 2 3 1 2 3 1 2 3 1 2 3 1 2 3 4 5
100000
10000
1000
100
Bitter Melon Yeasts & Moulds
100000
10000
1000
100
10
1
Bitter Melon Fluorescent
1 2 3 1 2 3 1 2 3 1 2 3 1 2 3 1 2 3 4 5
Broccoli Total aerobic count
10000000
1000000
100000
10000
1000
100-
10
1
1 2 3 1 2 3 1 2 3 1 2 3 1 2 3 4
100000
10000
Broccoli Coliforms
100000
10000
1000
100 --
10 +
1
Broccoli Yeasts & Moulds
1 2 3 1 2 3 1 2 3 1 2 3 1 2 3 4
100000
10000
1000
100
10
Broccoli Fluorescent
JEL 1 2 3 1 2 3 1 2 3 1 2 3 1 2 3 4

Lettuce Total aerobic count
1onnnono
1000000 -
100000 -
10000 -
1000-
100 -
10 -
1
1000000 -
100000 -
10000 -
1000-
100 -
10 -
1
1000000 -
100000 -
10000 -
1000-
100 -
10 -
1
1000000 -
100000 -
10000 -
1000-
100 -
10 -
1
1000000 -
100000 -
10000 -
1000-
100 -
10 -
1
1 2 3 1 2 3 1 2 3 1 2 3
Lettuce Coliforms
100000
10000
1000
100
10
1
r - i r - i
— -
, , ,n, — -
1 2 3 1 2 3 1 2 3 1 2 3
Lettuce Yeasts & Moulds
1QOOOO
10000 -
1000 -
100 -
10 -
1 .
100 -
10 -
1 .
1 2 3 1 2 3 1 2 3 1 2 3
Lettuce Fluorescent
100000
10000
1000
100
10
l_1
f-i
n
n
f-i
n i - i
1 2 3 1 2 3 1 2 3 1 2 3
1QOOOOOO -,
Snake Beans Total aerobic count
1000000 -
100000 -
10000 -
1000 •
100 -
10-1 .
1000000 -
100000 -
10000 -
1000 •
100 -
10-1 .
H 1000000 -
100000 -
10000 -
1000 •
100 -
10-1 .
1000000 -
100000 -
10000 -
1000 •
100 -
10-1 .
1 1
1000000 -
100000 -
10000 -
1000 •
100 -
10-1 .
1 1 1 1
1000000 -
100000 -
10000 -
1000 •
100 -
10-1 .
S 1 jT
1000000 -
100000 -
10000 -
1000 •
100 -
10-1 . 1 1 1 1
1 2 3 1 2 3 1 2 3 1 2 3 1 2 3 1 2 3 4 5
Snake Beans Coliforms
100000
10000
1000
100
10
1 unnnn
1 2 3 1 2 3 1 2 3 1 2 3 1 2 3 1 2 3 4 5
Snake Beans Yeasts & Moulds
100000
10000
10 --
1000-*-™- -
100 --
Snake Beans Fluorescent
100000

IOOOOOOO -*
Carrot Total aerobic count
1000000 -
iooooo -
10000 -
•
—
1000 -
100 -
10-
•
1 2 3 1 2 3 1 2 3 1 2 3
100000
10000
1000
100
10
Carrot Coliforms
nn JUL 1 2 3 1 2 3 1 2 3 1 2 3
100000 -
Carrot Yeasts & Moulds
10000 -
1000 •
100 •
10 -
1 .
10000 -
1000 •
100 •
10 -
1 .
10000 -
1000 •
100 •
10 -
1 .
-
^
10000 -
1000 •
100 •
10 -
1 . -
- -—
-
1 2 3 1 2 3 1 2 3 1 2 3
100000
10000
1000
100
10
1
Carrot Fluorescent
is
3 1 2 3 2
42

Cool chain handling and microbial loads Investigations into the response of microbial loads of vegetables to transport and breaks in the cool chain
were carried out in three ways. Firstly, simulated temperature abuse trials were conducted in coolrooms
with controlled temperature environments, over time. Secondly, temperatures were monitored from the
distributor in Darwin to Melbourne Market and samples tested from each end. Thirdly, simulated
temperature abuse transport was carried out from Adelaide to Melbourne.
Introduction
The microbiological monitoring was used to investigate the effect of temperature and handling conditions
on the microbiological load found on vegetables. Four analyses were done on each vegetable sample,
representing different aspects of quality and safety.
Total Aerobic counts: Quality
Coliforms: Indicator of Human Pathogens
Yeasts and Moulds: Quality and Spoilage Organisms
Fluorescent Pseudomonads: Quality and Human Pathogens
In some instances microbiological levels will be causative in the deterioration of produce, usually a
particular bacteria, or plant pathogenic fungi. Alternatively, microbiological levels can be indicative of
morphological and physiological condition of the plant tissue, that is, high microbiological levels can be a
result of deteriorating tissue, but not necessarily to cause of it. Either way, the results presented can give
some indication of postharvest vegetable health.
A range of temperatures was used in the simulated abuse trials to represent conditions that may be
experienced during handling practices.
The transport from Darwin to Melbourne measured microbiological levels before and after transport to
investigate how commercial transport conditions impact on microbiological levels.
The Adelaide to Melbourne transport monitored microbiological levels, before and after transport at 2
temperatures (2° and 8°C) and with or without precooling, to determine how these practices impact on
microbiological levels and ultimately food quality and saftey.
Methods
Simulated temperature abuse (Cool room experiments)
This experiment has been conducted with broccoli, lettuce, carrots and snakebeans. Coolrooms were set at
five different temperatures (4, 8, 15, 25, 35°C) and bulk boxes stored at each temperature. Samples were
collected from each box at four times (0, 24, 48 and 72 hours) and tested for Total aerobic counts,
coliforms, yeasts and moulds, and fluorescent Pseudomonads.
43
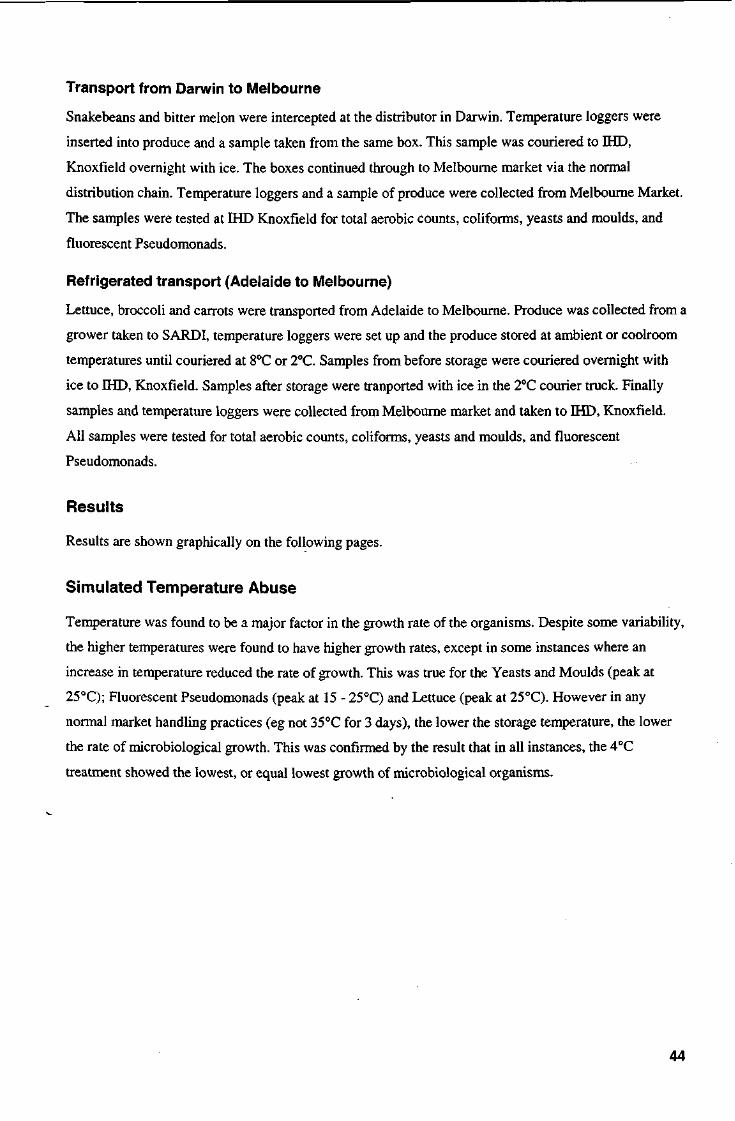
Transport from Darwin to Melbourne
Snakebeans and bitter melon were intercepted at the distributor in Darwin. Temperature loggers were
inserted into produce and a sample taken from the same box. This sample was couriered to IHD,
Knoxfield overnight with ice. The boxes continued through to Melbourne market via the normal
distribution chain. Temperature loggers and a sample of produce were collected from Melbourne Market.
The samples were tested at IHD Knoxfield for total aerobic counts, coliforms, yeasts and moulds, and
fluorescent Pseudomonads.
Refrigerated transport (Adelaide to Melbourne)
Lettuce, broccoli and carrots were transported from Adelaide to Melbourne. Produce was collected from a
grower taken to SARDI, temperature loggers were set up and the produce stored at ambient or coolroom
temperatures until couriered at 8°C or 2°C. Samples from before storage were couriered overnight with
ice to IHD, Knoxfield. Samples after storage were tranported with ice in the 2°C courier truck. Finally
samples and temperature loggers were collected from Melbourne market and taken to IHD, Knoxfield.
All samples were tested for total aerobic counts, coliforms, yeasts and moulds, and fluorescent
Pseudomonads.
Results
Results are shown graphically on the following pages.
Simulated Temperature Abuse
Temperature was found to be a major factor in the growth rate of the organisms. Despite some variability,
the higher temperatures were found to have higher growth rates, except in some instances where an
increase in temperature reduced the rate of growth. This was true for the Yeasts and Moulds (peak at
25°C); Fluorescent Pseudomonads (peak at 15 - 25°C) and Lettuce (peak at 25°C). However in any
normal market handling practices (eg not 35°C for 3 days), the lower the storage temperature, the lower
the rate of microbiological growth. This was confirmed by the result that in all instances, the 4°C
treatment showed the lowest, or equal lowest growth of microbiological organisms.
44

Figure la: Microbial loads on Broccoli when stored at different temperatures for different times, to
40000000
35000000
30000000
25000000 "5 u.
o ~ 20000000 c a o o
15000000
10000000
5000000
Broccoli - Total Aerobic Count
24 48
Time (hours)
72
- © - 4 9 C
-B-89C
~*-25BC -*- 358C
45000
40000
35000
30000
g 25000 O
c o 20000
15000
10000
5000
Br

Figure la: Microbial loads on Broccoli when stored at different temperatures for different times, tot
Broccoli - Total Aerobic Count
40000000
35000000
30000000
25000000
3 U.
O r 20000000 c o o
15000000
10000000
5000000
•*-4 sC
9 -8 9 C
259C
35SC
24 48
Time (hours)
72
Bro
45000
40000
35000
30000
01 g 25000 p
20000
15000
10000
5000

Figure 2a: Microbial loads on Carrots when stored at different temperatures for different times, total aer
Carrot - Total Aerobic Count
40000000
35000000
30000000
25000000
3 U. Ji 20000000 c 3 o o
15000000
10000000
5000000
4SC
8fiC
15SC
25fiC
35SC
6 24 48 72
Time (hours)
Carro
30000
25000
20000
3 LL
2. 15000 c 3 o o
10000
5000

Figure 2b: Microbial loads on Carrots when stored at different temperatures for different times, yeast and counts.
8000
7000
6000
5000
u. o 4000
c 3 o o 3000
2000
1 0 0 0 -
Carrots - Yeast and Mould Count
6 24 48
Time (hours)
72
4SC
8fiC
15eC
25SC
35fiC
Carrots - Fluo
300000
250000
200000
u. O
150000
I 100000
50000

Figure 3a: Microbial loads on Lettuce when stored at different temperatures for different times, total aero
Lettuce - Total Aerobic Count
1600000000
1400000000 -
1200000000
1000000000
u.
~ 800000000 (0
o O
600000000 -
400000000
200000000 -
24 48
Time (hours)
72
* - 4 f i
e-8sc i« i-15eC
* - 2 5 B C 35fiC
Lettuc
1800000
1600000
1400000
1200000
£ 1000000 o,
i 800000 o o
600000
400000
200000

Figure 3b: Microbial loads on Lettuce when stored at different temperatures for different times, yeast and counts.
Lettuce - Yeasts and Mould Count
800000
700000
600000
24 48
Time (hours)
72
• 4 s
-B-89C
-A-15SC
-X-259C
-*-359C
Lettuce - Fluor
16000000
14000000 -
12000000
10000000
3 U.
~ 8000000 c 3 o o
6000000
4000000
2000000

Figure 4a: Microbial loads on Snakebeans when stored at different temperatures for different times, total
Snakebeans - Total Aerobic Count
100000000
90000000
80000000
70000000
^ 60000000 - -
5 IL
" 50000000 f c 3 0 ° 40000000
30000000
20000000
10000000
24 48
Time (hours)
72
^-4°C
a — 8fic A-15 9C
*- 2 5 s C
358C
Snake
600000
550000
500000
450000
400000 -
3 350000 1
5 u.
~ 300000 -'c 3 O ° 250000
200000
150000
100000
50000

Figure 4a: Microbial loads on Snakebeans when stored at different temperatures for different times, yeast Pseudomonad counts.
450000
400000
350000
Snakebeans - Yeast & Mould Count
24 48
Time (hours)
72
^ - 4 9 C
B—8SC
* - 1 5 9 C
* - 2 5 9 C
359C
Snakebeans -
25000
22500
20000

Results: Transport from Darwin to Melbourne
Results from the Darwin studies demonstrate the variability between runs with some samples
rapidly increasing in numbers over the transport time, while others decreasing at a rapid rate.
53

Figure 5a : Microbial loads on bitter melon before (initial) and after (final) transport, total aerobic and c
Bittermelon - Total Aerobic Count
600000
500000-
400000-
O) D li. o — 300000" c 3 o O
200000 -
100000"
initial final
- e — R u n 1
-S—Run 2
-A—Run 3
-*—Run 4
Hi—Run 5
-6—Run 6
-#—Run 7
-X—Run 8
- -O-•Run 9
- -O--Run 10
80000
70000"
60000-
^ 50000 O) D li. O ^ 40000 +J
c 3 O
o 30000
Bitterm
20000
10000
initial

Figure 5b: Microbial loads on bitter melon before (initial) and after (final) transport, yeast and mould an
Bittermelon - Yeast & Mould Count
900000
800000
700000-
600000-
D LL
o c 3 o o
500000"
400000 -
300000-
200000 "
100000-
p
/ ...
. . .
...
. . .
...
. . .
"1 ...
"1 ...
"1 ...
--•O-^-Run 9
- - O - - R u n 10 7
--•O-^-Run 9
- - O - - R u n 10 1
--•O-^-Run 9
- - O - - R u n 10 1
& a
initial final
Bittermelon -
5000 -
4500 "
4000 "
3500"
B 3000 -
4000 "
3500"
B 3000 -
4000 "
3500"
B 3000 -
4000 "
3500"
B 3000 -D IL
o w 2500"
D IL
o w 2500"
D IL
o w 2500" c 3 c 3 O 2000 " O 2000 "
1500-
1000 "
500"
1000 "
500"
o • ™ initial
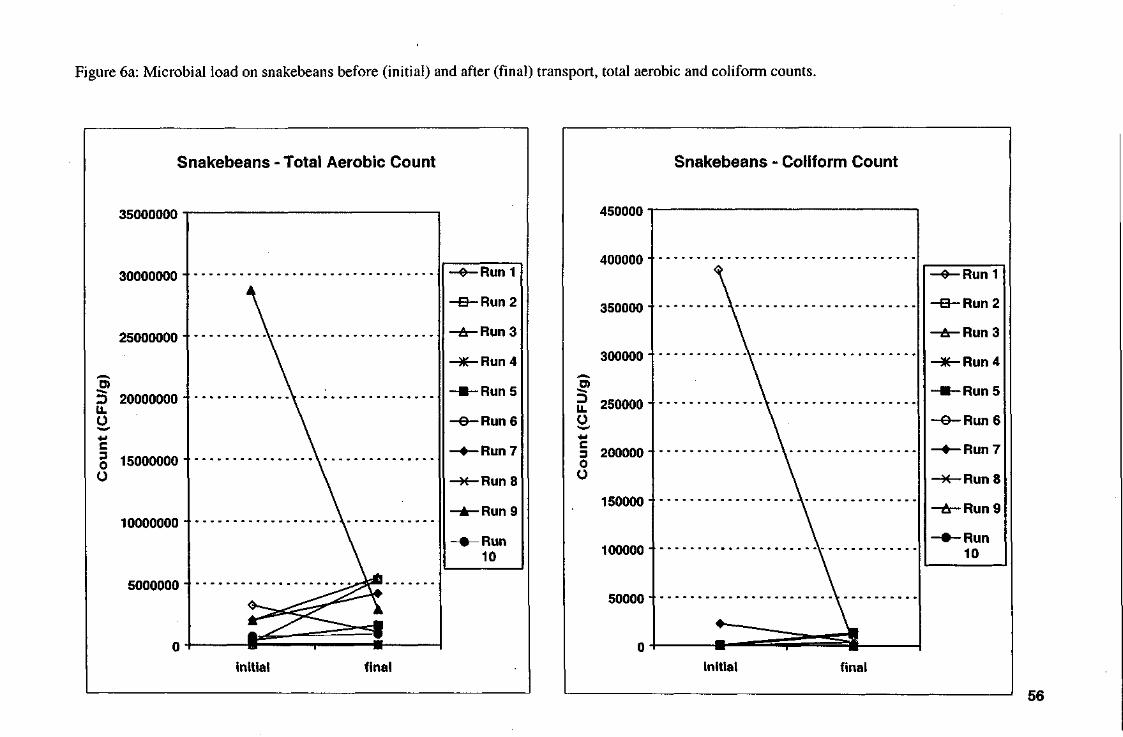
Figure 6a: Microbial load on snakebeans before (initial) and after (final) transport, total aerobic and coli
Snakebeans - Total Aerobic Count
35000000 '
30000000 " - •—Run 1 30000000 " - •—Run 1
\ - e - R u n 2
25000000 -\ -T&-Run3 25000000 - \
-T&-Run3
\ - * - R u n 4 .—s \
D 20000000-U. O
\ - • - R u n 5
- e - R u n 6
D 20000000-U. O \
- • - R u n 5
- e - R u n 6 +•> \ c § 15000000 -
\ —•—Run 7 c § 15000000 - \
—•—Run 7
O \ - * - R u n 8
10000000 • \ —h- Run 9
10000000 • V —h- Run 9
\ - • - R u n
5000000 -V 10
5000000 -V
5000000 -
^i5 initial final
Snakebe
450000
400000-
350000-
300000 -
95 2 250000
3 200000 o O
150000
100000"
50000"
initial
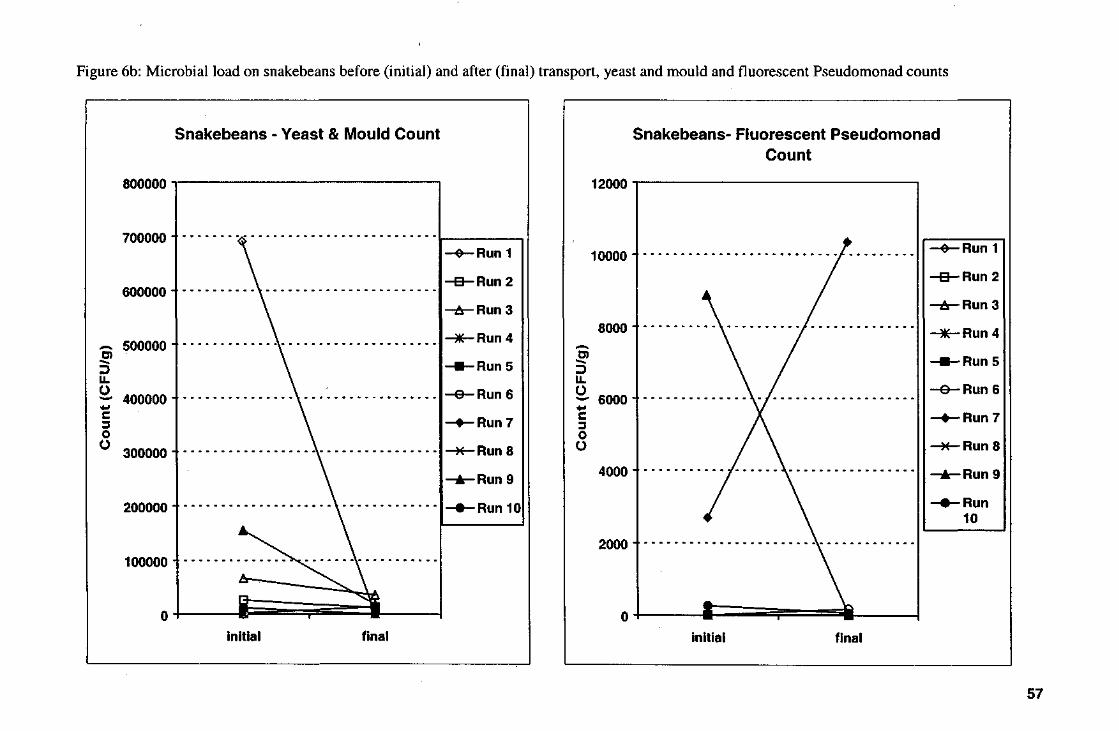
Figure 6b: Microbial load on snakebeans before (initial) and after (final) transport, yeast and mould and
Snakebeans - Yeast & Mould Count
800000
700000-
600000-
~ 500000 -•5*
IL
o — 400000" c 3 o o 300000 -
200000
100000-
initial final
Snakebeans-
12000
10000-
8000-
D LL O — 6000 4-1
c 3 O O
4000 -
2000"
initial

Temperature abuse during transport (Adelaide to Melbourne)
Results of the transport studies were more variable than the laboratory studies. Full results are presented
graphically on the following pages.
A summary of the results was achieved by ranking the microbiological counts at the end of each run, to
determine which combination of handling conditions of precooling and transport temperature were better
for each vegetable.
Precooling prior to transport resulted in lower microbiological levels than uncooled produce, except in the
case of lettuce which had higher microbiological in the uncooled produce.
Interestingly, on average the 8°C transport temperature resulted in lower microbiological levels than the
2°C temperature, although the differences were quite small. Coliforms and Fluorescent Pseudomonads
showed no difference with temperature while Total Aerobic counts and Yeasts and Moulds showed lower
levels at 8°C.
59

Figure 7a: Total aerobic counts of Broccoli before and after storage and after transport from
Melbourne to Adelaide.
Runl
before after storage after transport
"precooled, 2"C transport
'uncooled, 2"C transport '
"precooled, 8"C transport
"uncooled, 8°C transport
Run 3 70000
60000
before after storage after transport
"precooled, 2°C transport
"uncooled, 2"C transport
"precooled, 8°C transport
"uncooled, 8°C transport
Run 2 4000000
3500000
before after storage after transport
"precooled, 2°C transport
"uncooled, 2°C transport
"precooled, 8°C transport
•uncooted, 8°C transport
R u n 4
before after storage after transport
"precooled, 2°C transport S— precooled, 8°C transport
"uncooled, 2°C transport ~~*~~uncooled, 8°C transport
Run 5
2500000
2000000
-5? 3 1500000 u. U
5 1000000 u
500000
before after storage, after transport
"precooled, 2°C transport"
"uncooled, 2"C transport *
"precooled, 8°C transport
"uncooled, 8°C transport
60
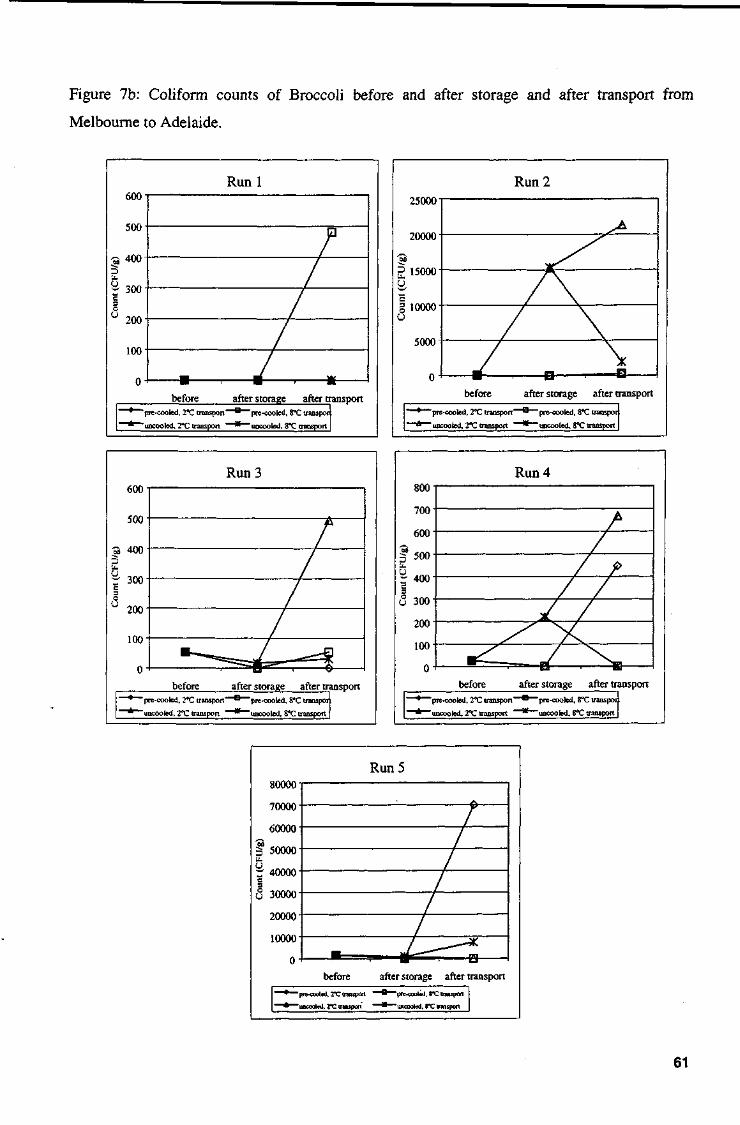
Figure 7b: Coliform counts of Broccoli before and after storage and after transport from
Melbourne to Adelaide.
Runl
before after storage after transport ""pre-cooled, 2°C transport"
"" uncooled, 2°C transport
"pre-cooled, 8"C transpor
"uncooled, 8"C transport
Run 3 600
500
400
r 300
200
100
0
before after storage after transport —pre-cooled, 2°C transport
"uncooled, 2°C transport
"pre-cooled, 8°C transpor
~ uncooled, 8"C transport
Run 2 25000
before after storage after transport
"pre-cooled, 2°C transport"
"uncooled, 2"C transport *"
"pre-cooled, 8°C transpor
"uncooled, 8"C transport
Run 4 800
700
600
g 50° r 4oo u 300
200
100
before after storage after transport
"pre-cooled, 2°C transport"
" uncooled, 2°C transport "
"pre-cooled, 8°C transpor
"uncooled, 8°C transport
Run 5
before after storage after transport
~ pre-coded, 2°C transport
'uncooled, 3*C transport
"pre-cooled, 8*C transport
"uncooled, 8"C transport
61

Figure 7c: Yeast and moould counts of Broccoli before and after storage and after transport from
Melbourne to Adelaide.
Run 1
before after storage after transport
"pre-cooled, 2 X transport '
-uncooled, 2°C transport '
"pre-cooled, 8"C transport
"uncooled, 8°C transport
40000
35000
30000
3 25000 f
B 20000 f
10000 t
5000
Run 2
before after storage after transport
"pre-cooled, 2"C transport '
"uncooled. 2°C transport '
"pre-cooled, 8°C transport
~ uncooled. 8°C transport
Run 3
before after storage after transport
"pre-cooled, 2"C transport '
"uncooled, 2°C transport '
"pre-cooled, 8°C transport
"uncooled, 8"C transport j
Run 4 35000
30000
,-, 25000 t CO
U, 20000 f o c 15000 3 O
0 10000
5000
before after storage after transport
-pre-cooled, 2*C transport
-uncooled. 2*C transport
-pre-cooled, 8"C transport
-uncooled, 8°C transport
Run 5 9000
before after storage after transport
~ pre-cooled, 2"C transport "
"uncooled, 2°C transport
•pre-cooled, B°C transport
"uncooled, 8°C transport
62

Figure 7d: Fluorescent Pseudomonad counts of Broccoli before and after storage and after
transport from Melbourne to Adelaide.
30
25
20 3
2 15
10
Run 1
before after storage after transport "pre-cooled, 2°C transport"
"uncooted, 2°C transport
~ pre-cooled, 8°C transpor
"uncooled, 8°C transport
Run 2 1200
1000
-3 800
3 | 600 c 3
5 400
200
o- "pre-cooled, 2°C transport"
"uncooted, 2°C transport ""
"pre-cooled, 8°C transpor
"uncooled, 8°C transport
Run 3 70
60
50
40
30
20
10
o-H "pre-cooled, 2°C transport"
"uncooled, 2°C transport oeiore
"pre-cooled, 8°C transpor
"uncooled, 8"C transport
atter storage—atter transport
Run 4 400
350
300
| 250
r 200
8 150
100
50
"pre-cooled, 2°C transport'
"uncooled, 2°C transport
oerore
"pre-cooled, 8°C transpor
"uncooled, 8°C transport
atter storage—alter transport
Run 5
250-
a 20oJ
3
I 150-C 3 O U
loo
se
250-
a 20oJ
3
I 150-C 3 O U
loo
se
\
250-
a 20oJ
3
I 150-C 3 O U
loo
se
\
250-
a 20oJ
3
I 150-C 3 O U
loo
se
\ \ / "
250-
a 20oJ
3
I 150-C 3 O U
loo
se
^\ / r
250-
a 20oJ
3
I 150-C 3 O U
loo
se
250-
a 20oJ
3
I 150-C 3 O U
loo
se W /̂̂ **-ly n
before after storase after transport * pre-cooled, 2°C transport ' " pre-cooted, 8°C transpor
* uncooled, 2"C transport ' * uncooled, 8"C transport
63

Figure 8a: Total aerobic counts of Carrots before and after storage and after transport from
Melbourne to Adelaide.
Runl 1800000 "i
X
•3 1200000 ' D
= 800000 ' 0
A
200000 ^S> n • •— H 0
before after storage after transport
~ precooled, 2°C transport '
"uncooled, 2°C transport '
"precooled, 8°C transport
"uncooled, 8°C transport
Run 3 7000000
6000000
5000000
•5?
g 4000000
u I 3000000 o U
2000000
1000000
before after storage after transport
"precooled, 2"C transport '
"uncooled, 2"C transport '
"precooled, 8"C transport
"uncooled. 8"C transport
Run 4
1200000 "
1000000 • S 0 800000- s
CF
U/(
> * ^ - * <s c
d 0
U 400000-
/ c d 0
U 400000- X „ —==ft c d 0
U 400000-^s_——a-
200000 "
0 J 1 • 0 J
' ^ precooled, 2°C transport ** precooled, 8"C transport
A " uncooled, 2°C transport ' * uncooled, 8°C transport
4000000
3500000
3000000
4? 2500000 3 ~ 2000000
O 1500000
1000000
500000
0
Run 5
before after storage after transport
"precooled, 2"C transport.'
"uncooled. 2°C transport '
"precooled, 8"C transport
"uncooled, 8"C transport
64

Figure 8b: Coliform counts of Carrots before and after storage and after transport from
Melbourne to Adelaide.
Run 1 yuuu -
8000-
7000-
6000-
5000
4000-
3000-
2000
1000
yuuu -
8000-
7000-
6000-
5000
4000-
3000-
2000
1000
)K
yuuu -
8000-
7000-
6000-
5000
4000-
3000-
2000
1000
yuuu -
8000-
7000-
6000-
5000
4000-
3000-
2000
1000
yuuu -
8000-
7000-
6000-
5000
4000-
3000-
2000
1000
yuuu -
8000-
7000-
6000-
5000
4000-
3000-
2000
1000
yuuu -
8000-
7000-
6000-
5000
4000-
3000-
2000
1000
yuuu -
8000-
7000-
6000-
5000
4000-
3000-
2000
1000
yuuu -
8000-
7000-
6000-
5000
4000-
3000-
2000
1000 A o J 1 • i B i B
before after storage after transport
"precooled, 2°C transport
"uncooled. 2°C transport '
"precooled, 8°C transport
"uncooled, 8°C transport
Run 2
7000 "
6000-
5000
'Si 2 4000-
1 3000 o U
2000
1000
7000 "
6000-
5000
'Si 2 4000-
1 3000 o U
2000
1000
/v 7000 "
6000-
5000
'Si 2 4000-
1 3000 o U
2000
1000
7 xv
7000 "
6000-
5000
'Si 2 4000-
1 3000 o U
2000
1000
/ V*
7000 "
6000-
5000
'Si 2 4000-
1 3000 o U
2000
1000
/ \
7000 "
6000-
5000
'Si 2 4000-
1 3000 o U
2000
1000 7
7000 "
6000-
5000
'Si 2 4000-
1 3000 o U
2000
1000
o -I before after storage after transport
* precooled, 2°C transport ^ precooled, 8°C transport
~~* uncooled, 2°C transport ~~*"~ uncooled, 8"C transport
Run 3
before after storage after transport
"precooled, 2°C transport ~~H precooled, 8"C transport
"uncooled, 2°C transport * uncooled, 8"C transport
Run 4
before after storage after transport
"precooled, 2°C transport *
"uncooled, 2"C transport
•precooled, 8°C transport
"uncooled, 8°C transport
25000-
20000-
'SS
3 15000-
1 10000-
5000-
Run 5 25000-
20000-
'SS
3 15000-
1 10000-
5000-
_X . _
25000-
20000-
'SS
3 15000-
1 10000-
5000-
____2Z____ 25000-
20000-
'SS
3 15000-
1 10000-
5000-
.........JLL......
25000-
20000-
'SS
3 15000-
1 10000-
5000-
-----yC^----
25000-
20000-
'SS
3 15000-
1 10000-
5000-* - — - ^ ^
o -i before after storage after transport
• precooled, 2°C transport B precooled, 8°C transport
* uncooled, 2°C transport * uncooled, 8"C transport
65

Figure 8c: Yeast and mould counts of Carrots before and after storage and after transport from
Melbourne to Adelaide.
Run 1
3000
2 5 0 0 -
•~ 2000 00
1500 X
before after storage after transport
"prccooled, 2°C transport '
"uncooled, 2"C transport '
"precooled, 8°C transport
"uncooled, 8"C transport
Run 3
30000
25000
- 20000
15000 •-
10000
5000
before after storage after transport
"prccooled, 2"C transport '
"uncooled, 2*C transport '
•precooled, 8°C transport
"uncooled, 8*C transport
Run 2
9000
before after storage after transport
•precooled, 2°C transport '
" uncooled, 2°C transport '
"precoolcd, 8°C transport
"uncooled, 8°C transport
Run 4
12000
before after storage after transport
*" prccooled, 2°C transport
"uncooled, 2°C transport
"precooled, 8°C transport
"uncooled, 8°C transport
30000
25000-
o. 20000-
10000-
5 0 0 0 -
R u n 5
before after storage after transport
"prccooled, 2"C transport''
"uncooled. 2°C transport '
"precooled, 8"C transport
"uncooled. 8"C transport
66

Figure 8d: Fluorescent Pseudomonad counts of Carrots before and after storage and after
transport from Melbourne to Adelaide.
Run 1 1400
1 2 0 0 -
1000
800
600 --
4 0 0 -
2 0 0 -
-A-
X
before after storage after transport
"precooled, 2°C transport '
"uncooled, 2"C transport '
"precooled, 8°C transport
"uncooled, 8°C transport
Run 3 5000
4500
4000
3500 'So 3 3000 o 2500 -
2000
1500
1000
500
0
before after storage after transport
"precooled, 2°C transport '
"uncooled, 2"C transport '
"precooled, 8°C transport
"uncooled, 8°C transport
Run 2
before after storage after transport
•precooled, 2°C transport '
"uncooled, 2*C transport '
•precooled, 8°C transport
"uncooled, 8°C transport
Run 4 1600
1400
1 2 0 0 -
1000
8 0 0 -
tj 600
400
2 0 0 -
before after storage after transport
"precooled, 2°C transport '
"uncooled, 2°C transport '
•precooled, 8°C transport
•uncooled, 8°C transport
Run 5
before after storage after transport
"precooled, 2°C transport '
"uncooled, 2°C transport
•precooled, 8°C transport
"uncooled, 8"C transport
67

Figure 9a: Total aerobic counts of Lettuce before and after storage and after transport from
Melbourne to Adelaide.
Run 1
W 25000000 -- A-
^ 20000000 --2? r~~~77vT""" ^- 15000000 • 3 C
U 10000000 - •f/\--^- 15000000 • 3 C
U 10000000 -• • • ~ ~ / / ~ - \ - "
5000000 •
n • - - / • \ -
before after storage after transport "precooled, 2"C transport '
"uncooled, 2°C transport '
"precooled, 8"C transpon
"uncooled, 8°C transport
Run 3 2500000
2000000 • -
3 1500000 •X
g
o 1000000
500000 - -
"precooled, 2°C transport '
"uncooled, 2*C transport '
"precooled, 8°C transport
"uncooled. 8°C transport
6000000-
5000000 -
<-. 4000000 -so
u. ^ 3000000 -3 O
° 2000000 -
1000000 -
°r
Run 2
6000000-
5000000 -
<-. 4000000 -so
u. ^ 3000000 -3 O
° 2000000 -
1000000 -
°r
2* 6000000-
5000000 -
<-. 4000000 -so
u. ^ 3000000 -3 O
° 2000000 -
1000000 -
°r w
6000000-
5000000 -
<-. 4000000 -so
u. ^ 3000000 -3 O
° 2000000 -
1000000 -
°r —+— precooled, 2°C transport — - a — precooled, 8"C transport
" " ^ ^ u n c o o l e d , 2"C transport * "uncooled, 8"C transport
Run 4 3500000
3000000 - -
2500000 • -
£ 2000000
y, 1 1500000-o U
1000000
500000
"precooled, 2"C transport '
"uncooled, 2"C transport '
"precooled, 8°C transport
"uncooled. 8"C transport
14000000
12000000 --
10000000
I £ 8000000 u 6000000 - -
4000000 - -
2000000
Run 5
before after storage after transport "precooled, 2°C transport '
"uncooled, 2"C transport '
" precooled, 8"C transport
"uncooled. 8*C transport
68

Figure 9b: Coliform counts of Lettuce before and after storage and after transport from
Melbourne to Adelaide.
12000
10000
5 8000
" 6000
4000
2000
Run 1
before after storage after transport
"precooled, 2"C transport '
•uncooled. 2*C transport '
•precooled, 8°C transport
•uncooled, 8°C transport
1000
900
800
700
600
• 500
400
300
200
100
Run 2
before after storage after transport
"precooled, 2"C transport '
•uncooled, 2*C transport '
"precooled, 8°C transport
•uncooled, 8"C transport
80
70
60
| 50
| 40
° 30
20
10
Run 3
"precooled, 2"C transport '
"•uncooled, 2*C transport '
"precooled, 8°C transport
"uncooled, 8°C transport
400
350
300
£ 2 5 0 •—
" 200
150
100
50
Run 5
12000
10000
8000 3 LL.
O 6000
4000
2000
o - f -
Run4
"precooled, 2"C transport '
"uncooled, 2"C transport *
•precooled, 8°C transport
"uncooled, 8*C transport nui -uuiupui L
"precooled, 2°C transport '
"uncooled, 2"C transport '
"precooled, 8°C transport
"uncooled, 8*C transport
69

Figure 9c: Yeast and mould counts of Lettuce before and after storage and after transport from
Melbourne to Adelaide.
35000
30000 -
Run 1
before after storage after transport
-prccooled, 2°C transport '
"uncooled, 2°C transport '
"precooled, 8°C transport
"uncooled, 8°C transport
Run 2
before after storage after transport
"precooled, 2°C transport '
"uncooled, 2°C transport '
"precooled, 8°C transport
"uncooled, 8°C transport
Run 3
before after storage after transport
"precooled, 2°C transport '
"uncooled, 2°C transport '
"precooled, 8°C transport
"uncooled, 8°C transport
Run 4
before after storage after transport
"precooled, 2°C transport '
"uncooled, 2°C transport '
"precooled, 8°C transport
"uncooled, 8°C transport
Run 5
before after storage after transport
"precooled, 2"C transport '
"uncooled, 2°C transport '
"precooled, 8"C transport
"uncooled, 8°C transport
70
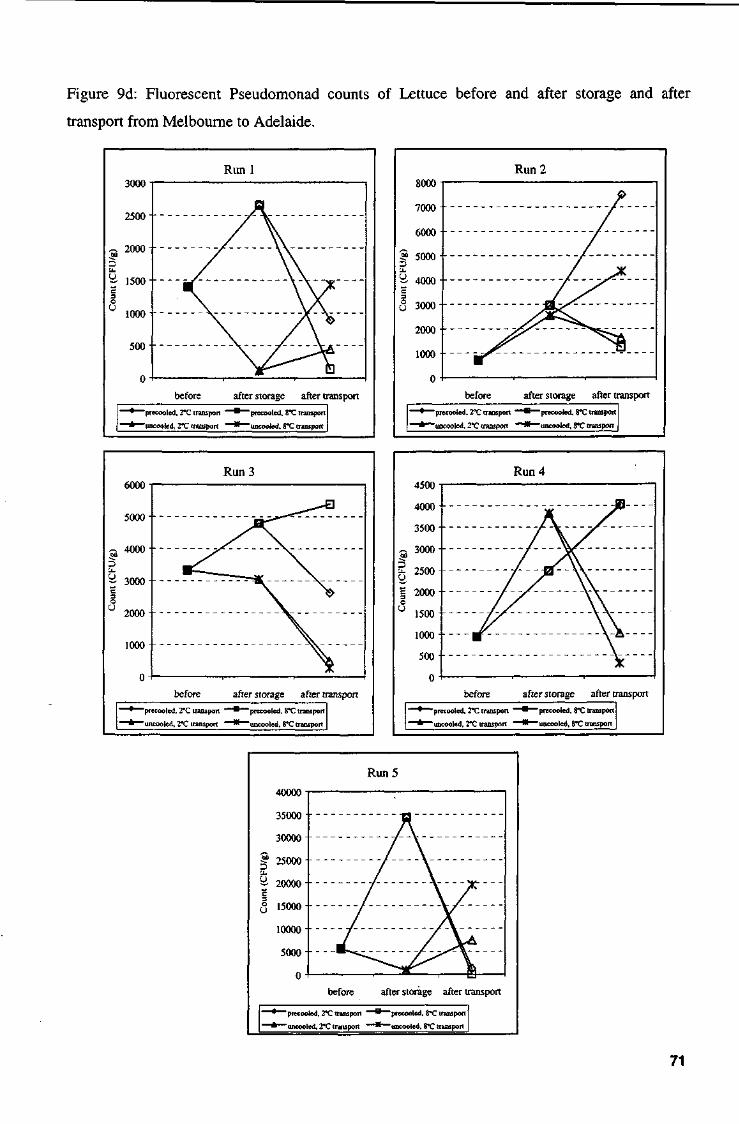
Figure 9d: Fluorescent Pseudomonad counts of Lettuce before and after storage and after
transport from Melbourne to Adelaide.
Run 1 3000
2500
2000
before after storage after transport
"precooled, 2°C transport '
"uncooled, 2°C transport '
"precooled, 8°C transport
"uncooled, 8°C transport
Run 3 6000
5000
--, 4000
u. ~ 3000
2000-
1000-
before after storage after transport
"precooled, 2°C transport '
"uncooled, 2°C transport '
"precooled, 8"C transport
"uncooled, 8°C transport
Run 2 8000
7 0 0 0 -
6 0 0 0 -
•S? 5 0 0 0 -3
before after storage after transport
"precooled, 2°C transport '
"uncooled, 2"C transport '
"precooled, 8°C transport
"uncooled, 8°C transpon
Run 4
before after storage after transport
"precooled, 2*C transport '
""uncooled, 2"C transport '
"precooled, 8"C transport
'uncooled, 8"C transport
Run 5
before after storage after transport
"precooled, 2°C transport
"uncooled, 2'C transport
"precooled, 8"C transport
"uncooled, 8°C trdnsport
71

Temperature and Microbiological monitoring through the marketing chain
30X
2TC
20X
15X
10X
5*C
OX
20000
J- 15000
• - p
o TJ cz
-f 10000
+ 5000
0 days 1 days
Pre- c o ole d after p ac kin§
2 days 3 days
B Not pre-cooled
Notes:
Carrot Temperature - line. Microbiological level - column
Microbiological samples were taken at packing, prior to transport and at the markets. Microbiological
level is coliforms, an indicator of human pathogen growth.
Implications: There was a rapid increase in microbiological levels when carrots were not pre-cooled.
Adequate pre-cooling is critical in slowing the growth rate of spoilage organisms and minimising the
chance of food safety problems.
72