Embed Size (px)
Citation preview
LOGO
ADVANCED STATISTICAL METHODS FOR GENE
EXPRESSION DATA
Veera Baladandayuthapani & Kim-Anh Do
University of Texas M.D. Anderson Cancer CenterHouston, Texas, [email protected]
Course Website:http://odin.mdacc.tmc.edu/∼kim/TeachBioinf/AdvStatGE-Prot.htm
STAT 675/ GS010103 SPRING 2008
LOGO
BIG PICTURE
Genomics/Bioinformatics (general)
As the generation, organization, and analysis of biological data(initially genomic data)
Attracted lot of interest in different fields: Computer Science,Physics, Engineering and of course Statistics
Statistical Genomics
Class of statistical methods for dealing with large biological datasets
Goal: statistically identify significant changes in biologicalprocesses to answer relevant biological questions.
High-throughput studies; get data matrix; mine the matrix forinformation
VEERA & DO, MD ANDERSON CANCER CENTER STAT 675/ GS010103 SPRING 2007
LOGO
EXAMPLES
Changes in DNA sequence
Quantitative trait locus identification
Differential expression of genes (microarrays)
Changes in protein abundance (proteomics)
Cell and molecular based studies
And many many more.....
VEERA & DO, MD ANDERSON CANCER CENTER STAT 675/ GS010103 SPRING 2007
LOGO
ROAD MAP FOR TODAY
How to get data?
How to clean data?
In the context of Microarrays
Get data: Image Processing
Clean data: Pre-processing data
The literature is huge!
VEERA & DO, MD ANDERSON CANCER CENTER STAT 675/ GS010103 SPRING 2007
LOGO
ROAD MAP FOR TODAY
How to get data?
How to clean data?
In the context of Microarrays
Get data: Image Processing
Clean data: Pre-processing data
The literature is huge!
VEERA & DO, MD ANDERSON CANCER CENTER STAT 675/ GS010103 SPRING 2007
LOGO
MICROARRAY TECHNOLOGY
High-throughput assays for understanding molecular biology
Simultaneously measure expression levels for thousands of genes
By understanding how “gene expression” changes across multipleconditions
Researches gain clues about gene functions
How genes work together to carry out biological functions
Many applications in a variety of studies; attracted considerablestatistical literature
Other techniques to measure gene expressionSerial analysis of gene expression (SAGE); cDNA librarysequencing; differential display; cDNA subtraction; multiplexquantitative RT-PCR
VEERA & DO, MD ANDERSON CANCER CENTER STAT 675/ GS010103 SPRING 2007
LOGO
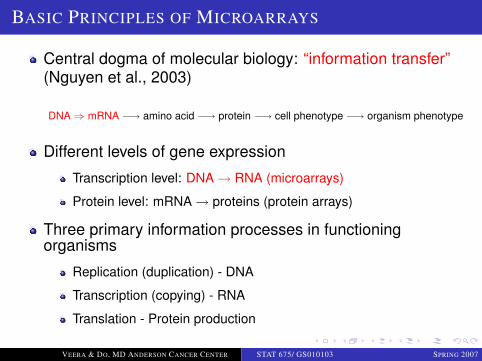
BASIC PRINCIPLES OF MICROARRAYS
Central dogma of molecular biology: “information transfer”(Nguyen et al., 2003)
DNA⇒ mRNA −→ amino acid −→ protein −→ cell phenotype −→ organism phenotype
Different levels of gene expression
Transcription level: DNA → RNA (microarrays)
Protein level: mRNA → proteins (protein arrays)
Three primary information processes in functioningorganisms
Replication (duplication) - DNA
Transcription (copying) - RNA
Translation - Protein production
VEERA & DO, MD ANDERSON CANCER CENTER STAT 675/ GS010103 SPRING 2007
LOGO
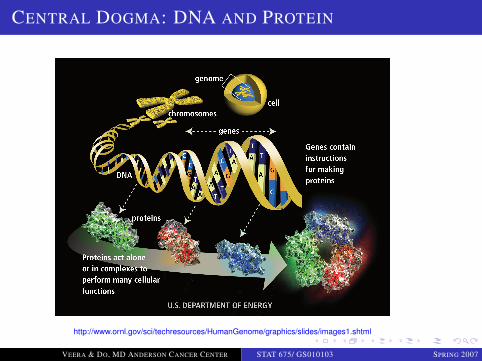
CENTRAL DOGMA: DNA AND PROTEIN
http://www.ornl.gov/sci/techresources/HumanGenome/graphics/slides/images1.shtml
VEERA & DO, MD ANDERSON CANCER CENTER STAT 675/ GS010103 SPRING 2007
LOGO
DNA, GENES AND DNA TRANSCRIPTION
DNADNA in native state is double stranded
Complementary base pairing: A-T, G-C
...AAAAGCTAGTCGATGCTAG......TTTTCGATCAGCTACGATC...
RNA
Single stranded
Base pairing: A-U, G-C (same as DNA with T replaced with U)
DNA Transcription
Inside the nucleus. DNA strand encoding the gene copied (mRNA)
Section of one strand of DNA corresponding to the gene is copiedusing base complementarity.
VEERA & DO, MD ANDERSON CANCER CENTER STAT 675/ GS010103 SPRING 2007
LOGO
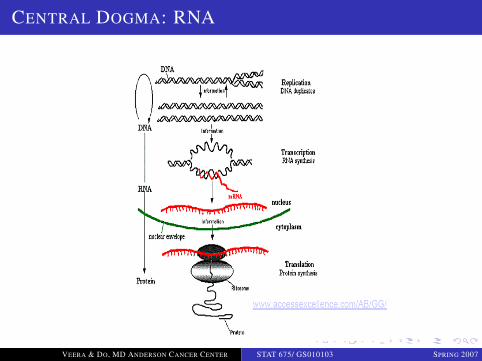
CENTRAL DOGMA: RNA
VEERA & DO, MD ANDERSON CANCER CENTER STAT 675/ GS010103 SPRING 2007
LOGO
MICROARRAY TECHNOLOGIES
Basic Premise: if we know target mRNA sequence we canbuild a probe for it using the complementary sequence.Probe location tells us the identity of the gene.Two variants:
Reverse transcription from mRNA to cDNA
cDNA Microarray technology; Duggan et al. (1999)
Synthesis of short subsequences (oligos)
Affymetrix (www.affymetrix.com); Genechips
VEERA & DO, MD ANDERSON CANCER CENTER STAT 675/ GS010103 SPRING 2007
LOGO
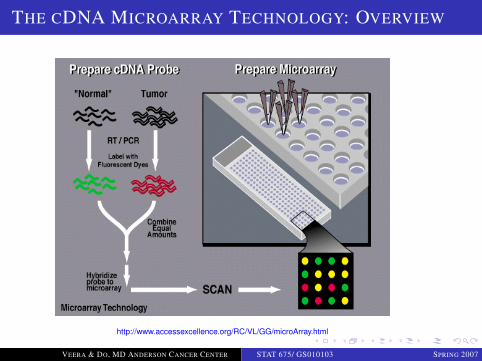
THE CDNA MICROARRAY TECHNOLOGY: OVERVIEW
http://www.accessexcellence.org/RC/VL/GG/microArray.html
VEERA & DO, MD ANDERSON CANCER CENTER STAT 675/ GS010103 SPRING 2007
LOGO
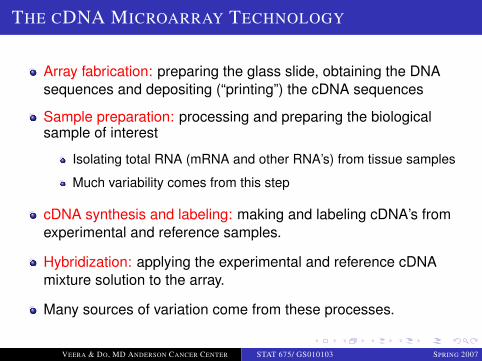
THE CDNA MICROARRAY TECHNOLOGY
Array fabrication: preparing the glass slide, obtaining the DNAsequences and depositing (“printing”) the cDNA sequences
Sample preparation: processing and preparing the biologicalsample of interest
Isolating total RNA (mRNA and other RNA’s) from tissue samples
Much variability comes from this step
cDNA synthesis and labeling: making and labeling cDNA’s fromexperimental and reference samples.
Hybridization: applying the experimental and reference cDNAmixture solution to the array.
Many sources of variation come from these processes.
VEERA & DO, MD ANDERSON CANCER CENTER STAT 675/ GS010103 SPRING 2007
LOGO
DATA COLLECTION: MICROARRAY QUANTIFICATION
Expression levels measured by spot intensities of Cy5 and Cy3dyes
Intensities obtained by scanning array with confocal lasermicroscope
Array scanned at two wavelengths: Cy5 and Cy3 tagged sample
Result: Two 16-bit TIFF images containing fluorescenceintensities of pixels
This is the raw data!
VEERA & DO, MD ANDERSON CANCER CENTER STAT 675/ GS010103 SPRING 2007
LOGO
OLIGONUCLEOTIDE (OLIGO) ARRAYS
Affymetrix GeneChip most popular commercially produced high-densityarrays; Genechips
Oligonucleotide: short sequence of nucleotides
Each gene (more accurately sequence of interest or feature) isrepresented by multiple short (25-nucleotide) oligo probes.
Probes sequences are chosen to have good and relatively uniformhybridization characteristics
A probe is chosen to match a portion of its target mRNA transcript that isunique to that sequence.
Oligo probes can distinguish among multiple mRNA transcripts withsimilar sequences
VEERA & DO, MD ANDERSON CANCER CENTER STAT 675/ GS010103 SPRING 2007
LOGO
GENECHIPS AND PROBES
A probe set is used to measure mRNA levels of a single gene.
Each probe set consists of multiple probe cells.
Each probe cell contains millions of copies of one oligo.
Each oligo is intended to be 25 nucleotides in length.
Probe cells in a probe set are arranged in probe pairs.
Each probe pair contains a perfect match (PM) probe cell and amismatch (MM) probe cell.
A PM oligo perfectly matches part of a gene sequence.
A MM oligo is identical to a PM oligo except that the middle nucleotide(13th of 25) is intentionally replaced by its complementary nucleotide.
VEERA & DO, MD ANDERSON CANCER CENTER STAT 675/ GS010103 SPRING 2007
LOGO
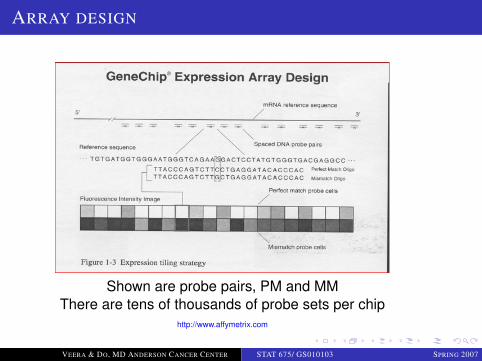
ARRAY DESIGN
Shown are probe pairs, PM and MMThere are tens of thousands of probe sets per chip
http://www.affymetrix.com
VEERA & DO, MD ANDERSON CANCER CENTER STAT 675/ GS010103 SPRING 2007
LOGO
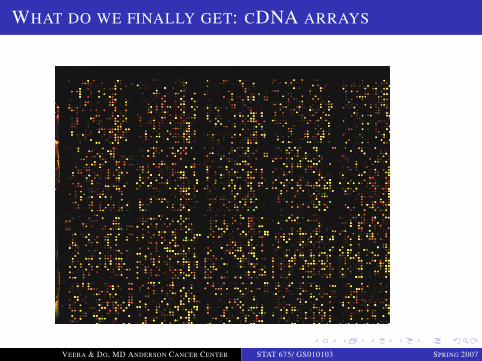
WHAT DO WE FINALLY GET: CDNA ARRAYS
VEERA & DO, MD ANDERSON CANCER CENTER STAT 675/ GS010103 SPRING 2007
LOGO
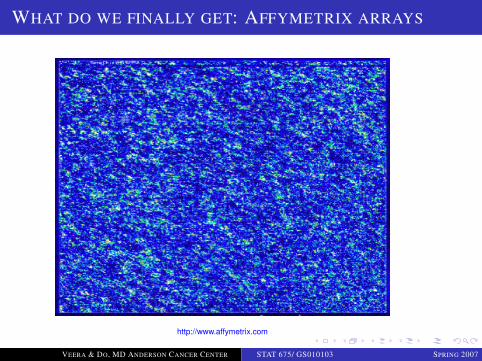
WHAT DO WE FINALLY GET: AFFYMETRIX ARRAYS
http://www.affymetrix.com
VEERA & DO, MD ANDERSON CANCER CENTER STAT 675/ GS010103 SPRING 2007
LOGO
WHAT DO WE FINALLY GET
Digital image: rectangular array of intensity values
Each intensity value corresponds to a pixel
Color Depth: is the number of bits used to store the intensity valueof one pixel
Color depth of 16 bits/pixel (common for microarray scanners)means the intensity values of each pixel is an integer between 0and 65,535 (= 216 − 1)
The number of pixels contained in a digital image is calledresolution
VEERA & DO, MD ANDERSON CANCER CENTER STAT 675/ GS010103 SPRING 2007
LOGO
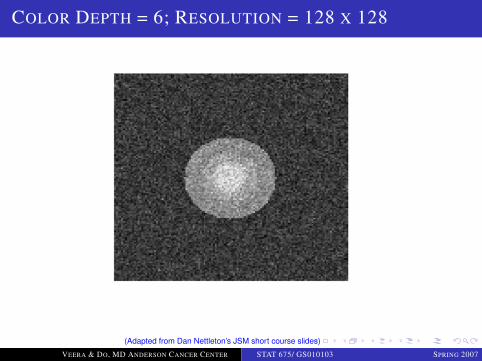
COLOR DEPTH = 6; RESOLUTION = 128 X 128
(Adapted from Dan Nettleton’s JSM short course slides)
VEERA & DO, MD ANDERSON CANCER CENTER STAT 675/ GS010103 SPRING 2007

LOGO
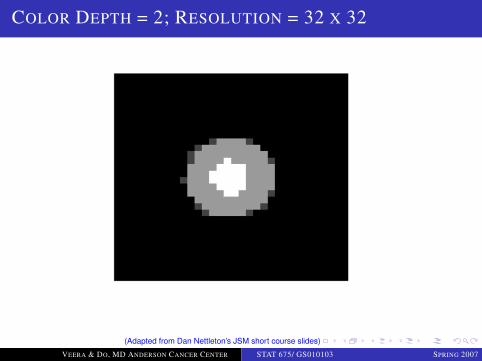
COLOR DEPTH = 2; RESOLUTION = 128 X 128
(Adapted from Dan Nettleton’s JSM short course slides)
VEERA & DO, MD ANDERSON CANCER CENTER STAT 675/ GS010103 SPRING 2007

LOGO
COLOR DEPTH = 6; RESOLUTION = 32 X 32
(Adapted from Dan Nettleton’s JSM short course slides)
VEERA & DO, MD ANDERSON CANCER CENTER STAT 675/ GS010103 SPRING 2007
LOGO
COLOR DEPTH = 2; RESOLUTION = 32 X 32
(Adapted from Dan Nettleton’s JSM short course slides)
VEERA & DO, MD ANDERSON CANCER CENTER STAT 675/ GS010103 SPRING 2007
LOGO
IMAGE PROCESSING FOR CDNA ARRAYS
4 basic steps:
Array localization - locate the spots
Image segmentation - categorize each spot as foreground(signal), background or other
Quantification - assign signal and background values to each spot
Spot quality assessment - compute measures of spot quality foreach spot
These steps use specialized software and can involve varying degreesof human intervention.
VEERA & DO, MD ANDERSON CANCER CENTER STAT 675/ GS010103 SPRING 2007
LOGO
ARRAY LOCALIZATION
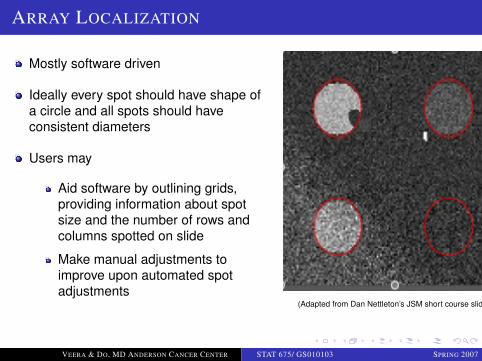
Mostly software driven
Ideally every spot should have shape ofa circle and all spots should haveconsistent diameters
Users may
Aid software by outlining grids,providing information about spotsize and the number of rows andcolumns spotted on slide
Make manual adjustments toimprove upon automated spotadjustments
(Adapted from Dan Nettleton’s JSM short course slides)
VEERA & DO, MD ANDERSON CANCER CENTER STAT 675/ GS010103 SPRING 2007
LOGO
ARRAY LOCALIZATION
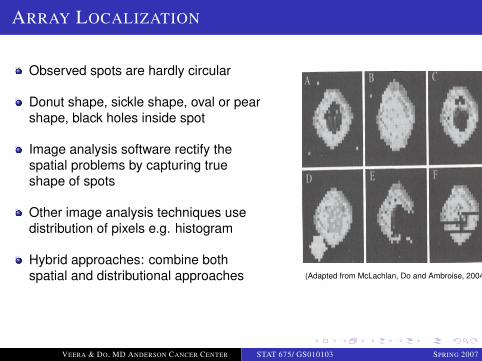
Observed spots are hardly circular
Donut shape, sickle shape, oval or pearshape, black holes inside spot
Image analysis software rectify thespatial problems by capturing trueshape of spots
Other image analysis techniques usedistribution of pixels e.g. histogram
Hybrid approaches: combine bothspatial and distributional approaches (Adapted from McLachlan, Do and Ambroise, 2004)
VEERA & DO, MD ANDERSON CANCER CENTER STAT 675/ GS010103 SPRING 2007
LOGO
IMAGE SEGMENTATION
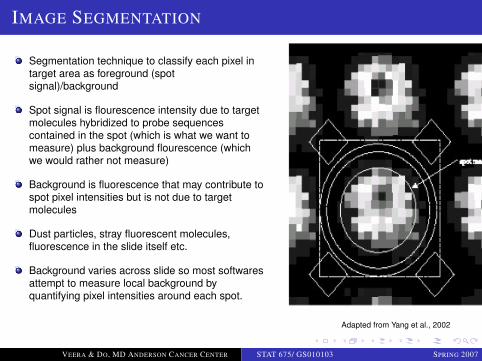
Segmentation technique to classify each pixel intarget area as foreground (spotsignal)/background
Spot signal is flourescence intensity due to targetmolecules hybridized to probe sequencescontained in the spot (which is what we want tomeasure) plus background flourescence (whichwe would rather not measure)
Background is fluorescence that may contribute tospot pixel intensities but is not due to targetmolecules
Dust particles, stray fluorescent molecules,fluorescence in the slide itself etc.
Background varies across slide so most softwaresattempt to measure local background byquantifying pixel intensities around each spot.
Adapted from Yang et al., 2002
VEERA & DO, MD ANDERSON CANCER CENTER STAT 675/ GS010103 SPRING 2007
LOGO
QUANTIFICATION
Pixels in spot and background area used to compute intensities
Spot intensity: Some statistics representing intensities for allpixels in spot area; similarly for background intensity
Mean: mean of pixel intensities
Median: median of pixel intensities
Mode: location of peak in histrogram of intensities
Area: number of pixels
Total: sum of pixel intensities
Many open questions still remain
Imaging software also output some spot quality statistics.
Different image analysis programs: GenePix, SPOT, ScanAlyze,UCSF Spot and Imagene
VEERA & DO, MD ANDERSON CANCER CENTER STAT 675/ GS010103 SPRING 2007
LOGO
IMAGE PROCESSING FOR OLIGO ARRAYS
Affymetrix Genechips use propriety Affymetrix software
Genechip surface covered with square shaped cells containingprobes
Probes are synthesized on the chip in precise locations
Thus spot finding and image segmentation are not major issues
VEERA & DO, MD ANDERSON CANCER CENTER STAT 675/ GS010103 SPRING 2007
LOGO
ARRAY LOCALIZATION
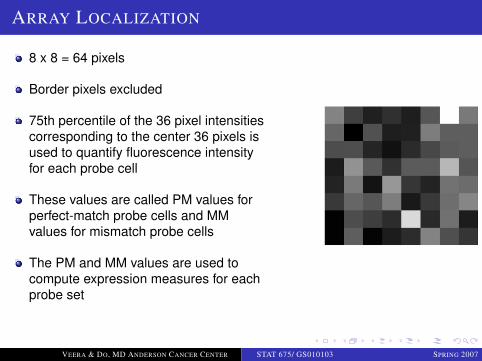
8 x 8 = 64 pixels
Border pixels excluded
75th percentile of the 36 pixel intensitiescorresponding to the center 36 pixels isused to quantify fluorescence intensityfor each probe cell
These values are called PM values forperfect-match probe cells and MMvalues for mismatch probe cells
The PM and MM values are used tocompute expression measures for eachprobe set
VEERA & DO, MD ANDERSON CANCER CENTER STAT 675/ GS010103 SPRING 2007
LOGO
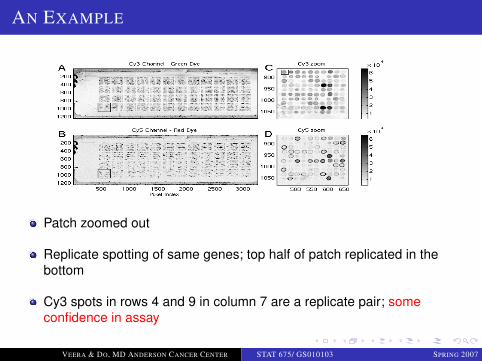
AN EXAMPLE
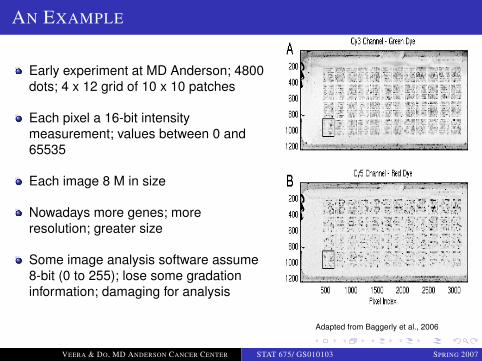
Early experiment at MD Anderson; 4800dots; 4 x 12 grid of 10 x 10 patches
Each pixel a 16-bit intensitymeasurement; values between 0 and65535
Each image 8 M in size
Nowadays more genes; moreresolution; greater size
Some image analysis software assume8-bit (0 to 255); lose some gradationinformation; damaging for analysis
Adapted from Baggerly et al., 2006
VEERA & DO, MD ANDERSON CANCER CENTER STAT 675/ GS010103 SPRING 2007
LOGO
AN EXAMPLE
Patch zoomed out
Replicate spotting of same genes; top half of patch replicated in thebottom
Cy3 spots in rows 4 and 9 in column 7 are a replicate pair; someconfidence in assay
VEERA & DO, MD ANDERSON CANCER CENTER STAT 675/ GS010103 SPRING 2007
LOGO
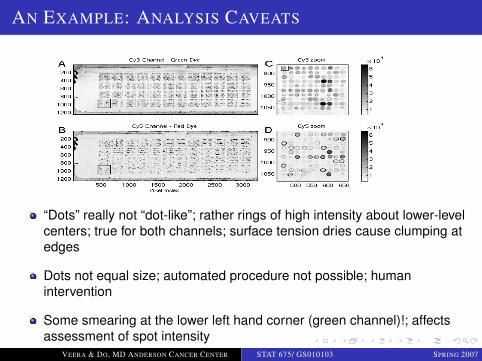
AN EXAMPLE: ANALYSIS CAVEATS
“Dots” really not “dot-like”; rather rings of high intensity about lower-levelcenters; true for both channels; surface tension dries cause clumping atedges
Dots not equal size; automated procedure not possible; humanintervention
Some smearing at the lower left hand corner (green channel)!; affectsassessment of spot intensity
VEERA & DO, MD ANDERSON CANCER CENTER STAT 675/ GS010103 SPRING 2007
LOGO
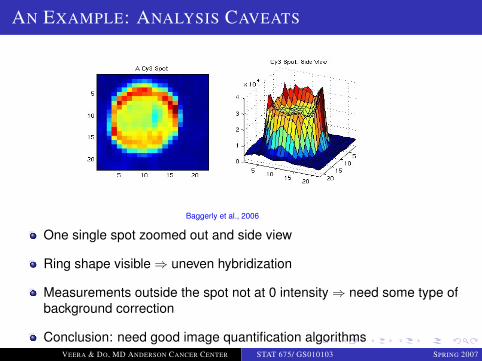
AN EXAMPLE: ANALYSIS CAVEATS
Baggerly et al., 2006
One single spot zoomed out and side view
Ring shape visible ⇒ uneven hybridization
Measurements outside the spot not at 0 intensity ⇒ need some type ofbackground correction
Conclusion: need good image quantification algorithmsVEERA & DO, MD ANDERSON CANCER CENTER STAT 675/ GS010103 SPRING 2007
LOGO
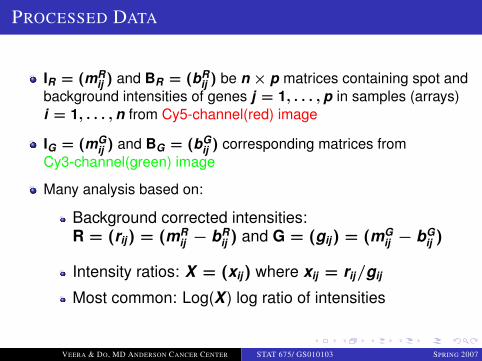
PROCESSED DATA
IR = (mRij ) and BR = (bR
ij ) be n × p matrices containing spot andbackground intensities of genes j = 1, . . . , p in samples (arrays)i = 1, . . . , n from Cy5-channel(red) image
IG = (mGij ) and BG = (bG
ij ) corresponding matrices fromCy3-channel(green) image
Many analysis based on:
Background corrected intensities:R = (rij) = (mR
ij − bRij ) and G = (gij) = (mG
ij − bGij )
Intensity ratios: X = (xij) where xij = rij/gij
Most common: Log(X ) log ratio of intensities
VEERA & DO, MD ANDERSON CANCER CENTER STAT 675/ GS010103 SPRING 2007
LOGO
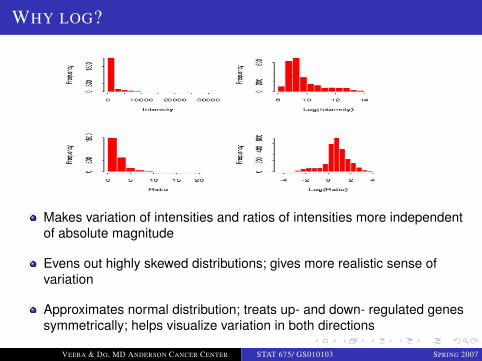
WHY LOG?
Makes variation of intensities and ratios of intensities more independentof absolute magnitude
Evens out highly skewed distributions; gives more realistic sense ofvariation
Approximates normal distribution; treats up- and down- regulated genessymmetrically; helps visualize variation in both directions
VEERA & DO, MD ANDERSON CANCER CENTER STAT 675/ GS010103 SPRING 2007
LOGO
NORMALIZATION
Describes the process of removing (or minimizing) non-biological(techincal) variation in the measured expression levels
Aim: Biological differences can be more easily detected
Typically, normalization attempts to remove global effects i.e.effects shown by exploratory plots for a slide or multiple slides
Nothing to do with normal distribution
Not a panacea for bad data!
VEERA & DO, MD ANDERSON CANCER CENTER STAT 675/ GS010103 SPRING 2007
LOGO
SOURCES OF NON-BIOLOGICAL VARIATION
Dye bias: differences in heat and light sensitivity; efficiency of dyeincorporation
Differences in amount of labeled cDNA hybridized
Different amounts of mRNA
Different scanning parameters
Different technicians producing the arrays
Any process that induces systematic error
VEERA & DO, MD ANDERSON CANCER CENTER STAT 675/ GS010103 SPRING 2007
LOGO
NORMALIZATION METHODS
Several methods
Global mean methods
(Iterative) linear regression method
Curvilinear methods (e.g. Lowess)
Variance model methods
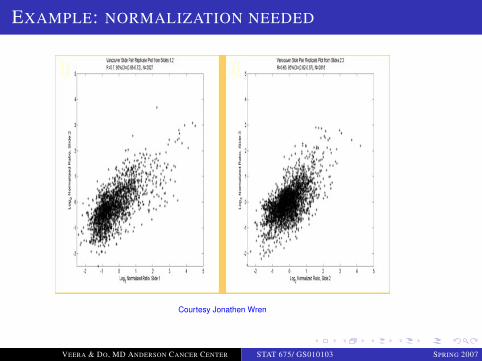
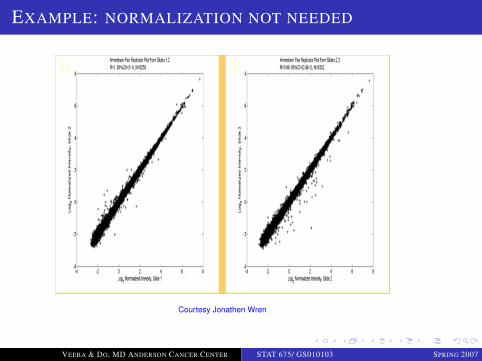
Basic idea: Try to get slope of ∼1 and a correlation of ∼1
VEERA & DO, MD ANDERSON CANCER CENTER STAT 675/ GS010103 SPRING 2007
LOGO
EXAMPLE: NORMALIZATION NEEDED
Courtesy Jonathen Wren
VEERA & DO, MD ANDERSON CANCER CENTER STAT 675/ GS010103 SPRING 2007
LOGO
EXAMPLE: NORMALIZATION NOT NEEDED
Courtesy Jonathen Wren
VEERA & DO, MD ANDERSON CANCER CENTER STAT 675/ GS010103 SPRING 2007
LOGO
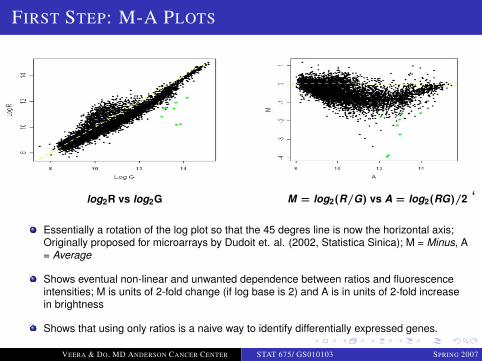
FIRST STEP: M-A PLOTS
log2R vs log2G M = log2(R/G) vs A = log2(RG)/2 ‘
Essentially a rotation of the log plot so that the 45 degres line is now the horizontal axis;Originally proposed for microarrays by Dudoit et. al. (2002, Statistica Sinica); M = Minus, A= Average
Shows eventual non-linear and unwanted dependence between ratios and fluorescenceintensities; M is units of 2-fold change (if log base is 2) and A is in units of 2-fold increasein brightness
Shows that using only ratios is a naive way to identify differentially expressed genes.
VEERA & DO, MD ANDERSON CANCER CENTER STAT 675/ GS010103 SPRING 2007
LOGO
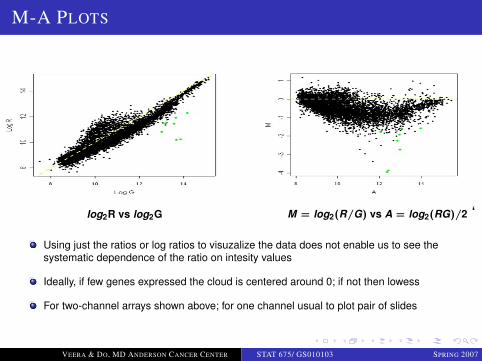
M-A PLOTS
log2R vs log2G M = log2(R/G) vs A = log2(RG)/2 ‘
Using just the ratios or log ratios to visuzalize the data does not enable us to see thesystematic dependence of the ratio on intesity values
Ideally, if few genes expressed the cloud is centered around 0; if not then lowess
For two-channel arrays shown above; for one channel usual to plot pair of slides
VEERA & DO, MD ANDERSON CANCER CENTER STAT 675/ GS010103 SPRING 2007
LOGO
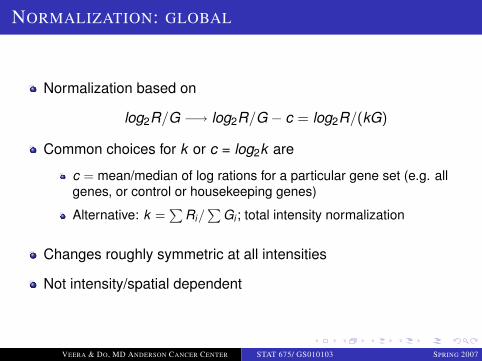
NORMALIZATION: GLOBAL
Normalization based on
log2R/G −→ log2R/G − c = log2R/(kG)
Common choices for k or c = log2k are
c = mean/median of log rations for a particular gene set (e.g. allgenes, or control or housekeeping genes)
Alternative: k =∑
Ri/∑
Gi ; total intensity normalization
Changes roughly symmetric at all intensities
Not intensity/spatial dependent
VEERA & DO, MD ANDERSON CANCER CENTER STAT 675/ GS010103 SPRING 2007
LOGO
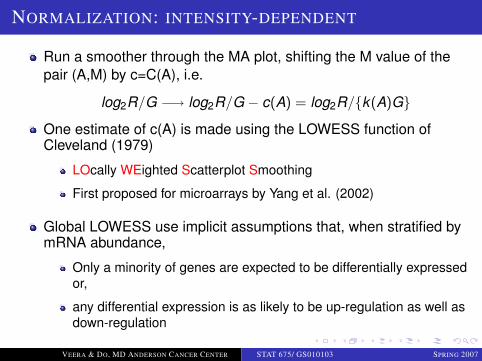
NORMALIZATION: INTENSITY-DEPENDENT
Run a smoother through the MA plot, shifting the M value of thepair (A,M) by c=C(A), i.e.
log2R/G −→ log2R/G − c(A) = log2R/{k(A)G}
One estimate of c(A) is made using the LOWESS function ofCleveland (1979)
LOcally WEighted Scatterplot Smoothing
First proposed for microarrays by Yang et al. (2002)
Global LOWESS use implicit assumptions that, when stratified bymRNA abundance,
Only a minority of genes are expected to be differentially expressedor,
any differential expression is as likely to be up-regulation as well asdown-regulation
VEERA & DO, MD ANDERSON CANCER CENTER STAT 675/ GS010103 SPRING 2007
LOGO
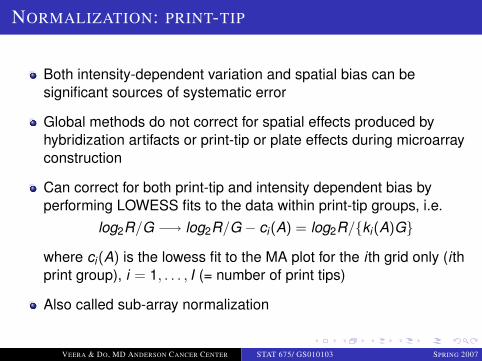
NORMALIZATION: PRINT-TIP
Both intensity-dependent variation and spatial bias can besignificant sources of systematic error
Global methods do not correct for spatial effects produced byhybridization artifacts or print-tip or plate effects during microarrayconstruction
Can correct for both print-tip and intensity dependent bias byperforming LOWESS fits to the data within print-tip groups, i.e.
log2R/G −→ log2R/G − ci(A) = log2R/{ki(A)G}
where ci(A) is the lowess fit to the MA plot for the i th grid only (i thprint group), i = 1, . . . , I (= number of print tips)
Also called sub-array normalization
VEERA & DO, MD ANDERSON CANCER CENTER STAT 675/ GS010103 SPRING 2007
LOGO
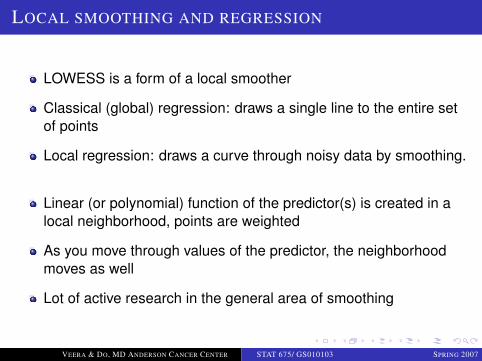
LOCAL SMOOTHING AND REGRESSION
LOWESS is a form of a local smoother
Classical (global) regression: draws a single line to the entire setof points
Local regression: draws a curve through noisy data by smoothing.
Linear (or polynomial) function of the predictor(s) is created in alocal neighborhood, points are weighted
As you move through values of the predictor, the neighborhoodmoves as well
Lot of active research in the general area of smoothing
VEERA & DO, MD ANDERSON CANCER CENTER STAT 675/ GS010103 SPRING 2007
LOGO
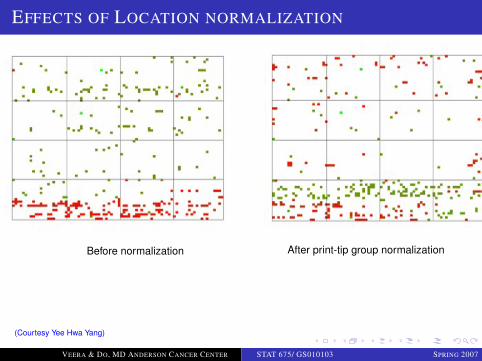
EFFECTS OF LOCATION NORMALIZATION
Before normalization After print-tip group normalization
(Courtesy Yee Hwa Yang)
VEERA & DO, MD ANDERSON CANCER CENTER STAT 675/ GS010103 SPRING 2007
LOGO
NORMALIZATION CONTINUED...
The LOWESS lines can be run through many different sets of points;each strategy has its own implicit set of assumptions, justifying itsapplicability
What genes to use
All genes on the array
Housekeeping genes: genes whose expression does not changeover a variety of conditions.
Controls: Spiked controls (e.g. plant genes) or genomic DNAtitration series; regulate amount of spike-in relative to the amount ofcontrol.
Different arrays often do not show identical signal distribution of Mvalues: various technical reasons (e.g. labeling efficiency, amount oflabelled RNA, scanner settings, etc...)
Need to normalize the signal between chips: multiple possibilities, oneoften used: ”scale normalization”
VEERA & DO, MD ANDERSON CANCER CENTER STAT 675/ GS010103 SPRING 2007
LOGO
SCALE NORMALIZATION
Assume: All slides have the same spread in M
True log ratio is µij where i represents different slides and jrepresents different spots
Observed is Mij , where Mij = aiµij
Robust estimate of ai is
MADi
I√∏J
k=1 MADi
where MADi = medianj{|yij − median(yij)|}
Could instead make same assumption for print tip groups (ratherthan slides)
Scale normalization changes scale of data; affects fold changecalculations
VEERA & DO, MD ANDERSON CANCER CENTER STAT 675/ GS010103 SPRING 2007
LOGO
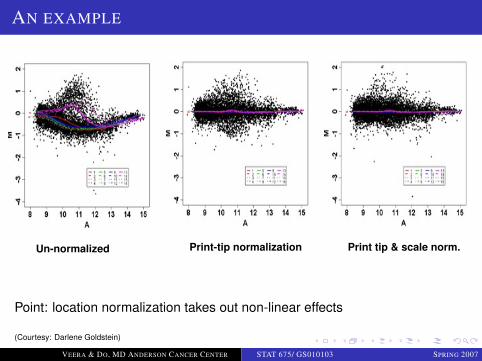
AN EXAMPLE
Un-normalized Print-tip normalization Print tip & scale norm.
Point: location normalization takes out non-linear effects
(Courtesy: Darlene Goldstein)
VEERA & DO, MD ANDERSON CANCER CENTER STAT 675/ GS010103 SPRING 2007
LOGO
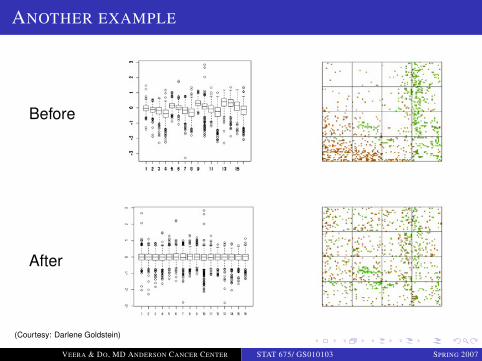
ANOTHER EXAMPLE
Before
After
(Courtesy: Darlene Goldstein)
VEERA & DO, MD ANDERSON CANCER CENTER STAT 675/ GS010103 SPRING 2007
LOGO
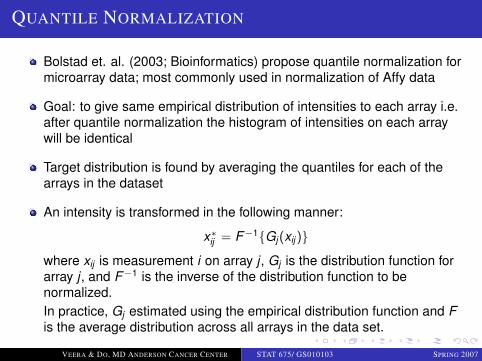
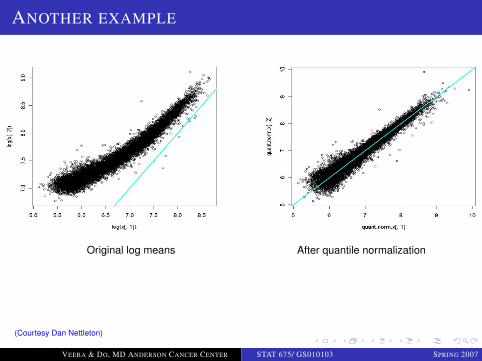
QUANTILE NORMALIZATION
Bolstad et. al. (2003; Bioinformatics) propose quantile normalization formicroarray data; most commonly used in normalization of Affy data
Goal: to give same empirical distribution of intensities to each array i.e.after quantile normalization the histogram of intensities on each arraywill be identical
Target distribution is found by averaging the quantiles for each of thearrays in the dataset
An intensity is transformed in the following manner:
x∗ij = F−1{Gj(xij)}
where xij is measurement i on array j , Gj is the distribution function forarray j , and F−1 is the inverse of the distribution function to benormalized.In practice, Gj estimated using the empirical distribution function and Fis the average distribution across all arrays in the data set.
VEERA & DO, MD ANDERSON CANCER CENTER STAT 675/ GS010103 SPRING 2007
LOGO
DETAILS OF QUANTILE NORMALIZATION
Very easy to implement
Find the smallest log signal on each channel
Average the values from step 1
Replace each value in step 1 with the average computed in step 2
Repeat steps 1 through 3 for the second smallest values, thirdsmallest values,..., largest values
Quantile normalization changes expression over many slides i.e.changes the correlation structure of the data, may effect subsequentanalysis.
VEERA & DO, MD ANDERSON CANCER CENTER STAT 675/ GS010103 SPRING 2007
LOGO
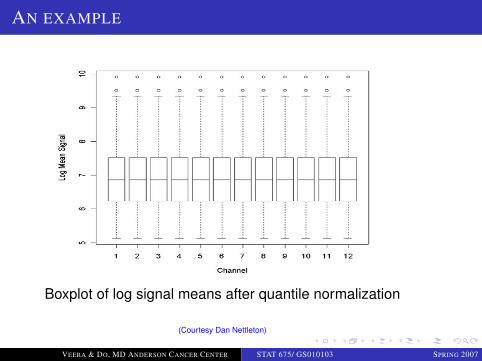
AN EXAMPLE
Boxplot of log signal means after quantile normalization
(Courtesy Dan Nettleton)
VEERA & DO, MD ANDERSON CANCER CENTER STAT 675/ GS010103 SPRING 2007
LOGO
ANOTHER EXAMPLE
Original log means After quantile normalization
(Courtesy Dan Nettleton)
VEERA & DO, MD ANDERSON CANCER CENTER STAT 675/ GS010103 SPRING 2007
LOGO
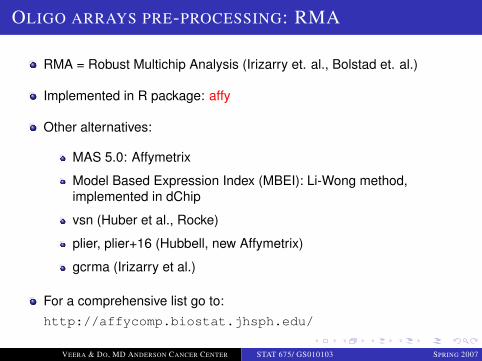
OLIGO ARRAYS PRE-PROCESSING: RMA
RMA = Robust Multichip Analysis (Irizarry et. al., Bolstad et. al.)
Implemented in R package: affy
Other alternatives:
MAS 5.0: Affymetrix
Model Based Expression Index (MBEI): Li-Wong method,implemented in dChip
vsn (Huber et al., Rocke)
plier, plier+16 (Hubbell, new Affymetrix)
gcrma (Irizarry et al.)
For a comprehensive list go to:http://affycomp.biostat.jhsph.edu/
VEERA & DO, MD ANDERSON CANCER CENTER STAT 675/ GS010103 SPRING 2007
LOGO
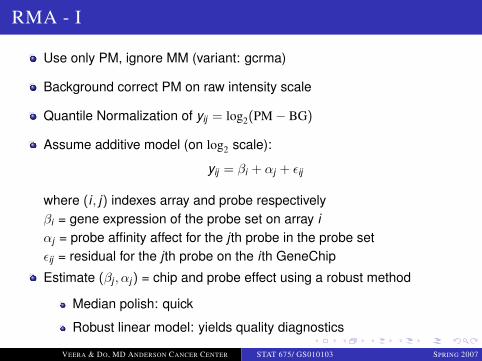
RMA - I
Use only PM, ignore MM (variant: gcrma)
Background correct PM on raw intensity scale
Quantile Normalization of yij = log2(PM− BG)
Assume additive model (on log2 scale):
yij = βi + αj + εij
where (i , j) indexes array and probe respectivelyβi = gene expression of the probe set on array iαj = probe affinity affect for the j th probe in the probe setεij = residual for the j th probe on the i th GeneChip
Estimate (βj , αj) = chip and probe effect using a robust method
Median polish: quick
Robust linear model: yields quality diagnostics
VEERA & DO, MD ANDERSON CANCER CENTER STAT 675/ GS010103 SPRING 2007

LOGO
RMA - II
The parameters in the above equations are unidentifiable. Needconstraint
∑αj = 0
Perform Tukey’s Median Polish on the matrix of yij values with yij in thei th row and j th column. Basically, entails iteratively normalizing row andcolumn medians to 0 until convergence.
Let yij denote the fitted value for yij that results from the median polishprocedure
Let αj = y.j − y.. where y.j =∑
i yij/I and y.. =∑
i∑
j yij/IJ where (I, J) =number of arrays and probes
Let βi =∑
j yij/J
Then, βi ’s are the RMA measure of expression for array i
VEERA & DO, MD ANDERSON CANCER CENTER STAT 675/ GS010103 SPRING 2007
LOGO
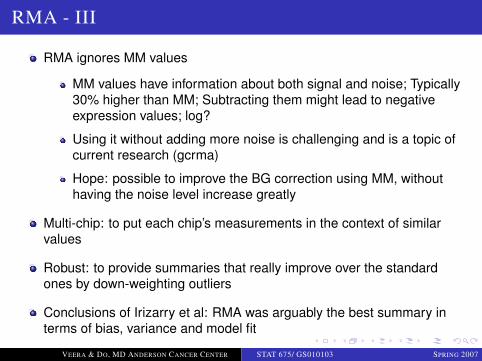
RMA - III
RMA ignores MM values
MM values have information about both signal and noise; Typically30% higher than MM; Subtracting them might lead to negativeexpression values; log?
Using it without adding more noise is challenging and is a topic ofcurrent research (gcrma)
Hope: possible to improve the BG correction using MM, withouthaving the noise level increase greatly
Multi-chip: to put each chip’s measurements in the context of similarvalues
Robust: to provide summaries that really improve over the standardones by down-weighting outliers
Conclusions of Irizarry et al: RMA was arguably the best summary interms of bias, variance and model fit
VEERA & DO, MD ANDERSON CANCER CENTER STAT 675/ GS010103 SPRING 2007
LOGO
FINAL COMMENTS: NORMALIZATION
Reduces systematic (not random) effects; makes it possible to compareseveral arrays
There are many variations and extensions of the methods covered today.Its a still emerging field.
Normalization affects the final analysis but not often clear which strategyis the best; normalization introduces more variability
Two-step procedure vs. integrated normalization and analysis?
Preprocessing can improve the quality of analysis, remove technicaleffects
But bad data IS bad data!
VEERA & DO, MD ANDERSON CANCER CENTER STAT 675/ GS010103 SPRING 2007
LOGO
FINAL DATA FOR ANALYSIS
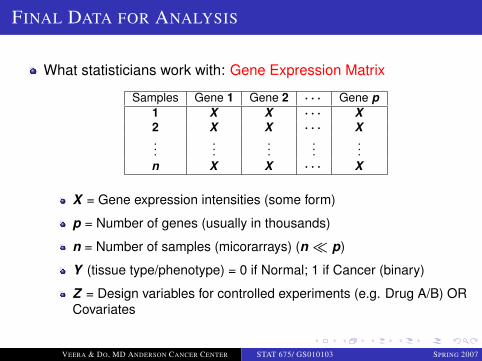
What statisticians work with: Gene Expression Matrix
Samples Gene 1 Gene 2 · · · Gene p1 X X · · · X2 X X · · · X...
......
......
n X X · · · X
X = Gene expression intensities (some form)
p = Number of genes (usually in thousands)
n = Number of samples (micorarrays) (n � p)
Y (tissue type/phenotype) = 0 if Normal; 1 if Cancer (binary)
Z = Design variables for controlled experiments (e.g. Drug A/B) ORCovariates
VEERA & DO, MD ANDERSON CANCER CENTER STAT 675/ GS010103 SPRING 2007
LOGO
FINAL THOUGHTS
Before complex statistical analysis some other preprocessingissues need to be addressed
Few basic issues affecting quality of data to be analyzed (notcovered today)
Variation: within and between arrays; identify areas ofexperimentation that require improvements
Design of experiments: understand “biology”Careful design on experiments; Kerr and Churchill (2001) examinedvariation due to array, dye, treatment (variety), gene and labelingdesign; ANOVA models for cDNA normalization
VEERA & DO, MD ANDERSON CANCER CENTER STAT 675/ GS010103 SPRING 2007
LOGO
GENE EXPRESSION VARIATION
“Biological” versus “Technological”
Need replication!; three kinds
Spot to SpotDepositing probes for same genes multiple times on the array
Assesses within array variation
Array to ArrayMultiple hybridizations using same mix of RNA source
Assesses between array variation
Subject to SubjectSample multiple individuals
Assesses biological variation
VEERA & DO, MD ANDERSON CANCER CENTER STAT 675/ GS010103 SPRING 2007
LOGO
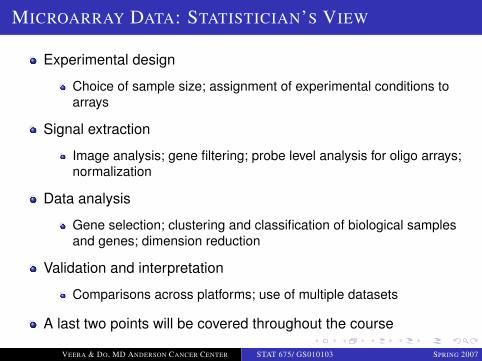
MICROARRAY DATA: STATISTICIAN’S VIEW
Experimental design
Choice of sample size; assignment of experimental conditions toarrays
Signal extraction
Image analysis; gene filtering; probe level analysis for oligo arrays;normalization
Data analysis
Gene selection; clustering and classification of biological samplesand genes; dimension reduction
Validation and interpretation
Comparisons across platforms; use of multiple datasets
A last two points will be covered throughout the course
VEERA & DO, MD ANDERSON CANCER CENTER STAT 675/ GS010103 SPRING 2007
LOGO
MORAL OF THE STORY
Microarray data: powerful tools to understand basicbiological processes
Opened a plethora of interesting methodological statisticalproblems
Small n large p problems
Careful review of procedures generating data; errorspropagated
Still evolving: new biology and new data analysis
VEERA & DO, MD ANDERSON CANCER CENTER STAT 675/ GS010103 SPRING 2007
LOGO
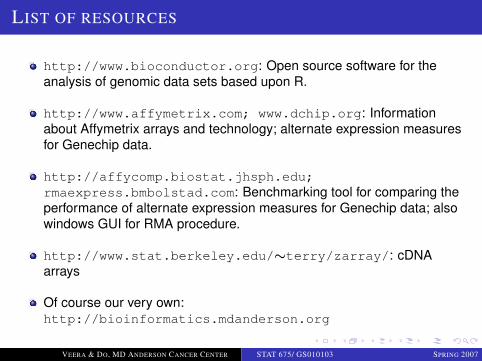
LIST OF RESOURCES
http://www.bioconductor.org: Open source software for theanalysis of genomic data sets based upon R.
http://www.affymetrix.com; www.dchip.org: Informationabout Affymetrix arrays and technology; alternate expression measuresfor Genechip data.
http://affycomp.biostat.jhsph.edu;rmaexpress.bmbolstad.com: Benchmarking tool for comparing theperformance of alternate expression measures for Genechip data; alsowindows GUI for RMA procedure.
http://www.stat.berkeley.edu/∼terry/zarray/: cDNAarrays
Of course our very own:http://bioinformatics.mdanderson.org
VEERA & DO, MD ANDERSON CANCER CENTER STAT 675/ GS010103 SPRING 2007